
Abstract
Abstract
There is growing interest in decentralization of wastewater collection and treatment systems, and with increasing numbers of small facilities there is greater need to predict effects of networks of treatment facilities on a watershed. A network analysis of effluent biological oxygen demand (BOD) discharge and variability for a gradient of decentralization was conducted by simulating many individual facility discharges using Generalized Linear Models. Simulations were performed for synthetic networks of varying numbers of facilities and of varying capacity. For a total flow of 400,000 m3/day, simulations indicated that a network of 1,000 small facilities would produce 80% higher median effluent BOD than a single large facility; however, a single facility had much greater variability, so the 95th percentile BOD discharge was 58% higher than for the network of small facilities. This methodology was also applied to a case study of wastewater facilities discharging in the St. Vrain watershed in Colorado. As with the synthetic network simulations, for ammonia discharges in the St. Vrain watershed, a centralized network produced lower median effluent ammonia than either the existing system or a decentralized network. The 95th percentile effluent discharge for both the decentralized network and the centralized network was 14% lower than for the existing network with a wide variety of facility sizes. Decentralized networks are able to reduce aggregate variability through diffusion of risk across many facilities, while centralized networks achieve improved median treatment through better individual facility performance.
Introduction
I
At the other extreme, proliferation of on-site wastewater systems (OWS) such as septic tanks, especially in higher-density developments, can result in declines in water quality and drinking water safety. Approximately 25% of all United States homes and 30% of new homes are served by OWS. In 1997, more than half of these were older than 30 years, and as many as 20% did not meet normal performance standards, which did not include groundwater contamination (Nelson and Shephard, 1998; U.S. Environmental Protection Agency, 2002, 2003; Ho, 2005). In parts of the developing world, as few as 2% of the population may be served by wastewater collection systems (Ho, 2005). As nutrient restrictions tighten, many communities whose wastewater service is dominated by OWS will face costly decisions about constructing more centralized collection and treatment to meet water quality standards. The USEPA has estimated that addressing current wastewater treatment needs for small United States communities is estimated to cost $17 billion (U.S. Environmental Protection Agency, 2008a).
Decentralized systems have several potential benefits for addressing population growth, land use patterns, and infrastructure asset management (National Decentralized Water Resources Capacity Development Project, 2009). The service life of major facilities is decades, and according to Pinkham et al. (2004), decentralized systems have a number of advantages of centralized systems when accurately predicting growth is difficult. Decentralized or satellite systems allow for construction on an as-needed basis, which can be desirable for communities with limited resources as well as uncertain growth projections. Decentralized treatment also allows for more local control of land use and zoning, desirable for many peri-urban communities. Water reuse in arid regions may benefit from decentralization due to reduced pumping distances in either potable or nonpotable systems, reducing distribution system capital and energy costs. Finally, decentralized systems may have a smaller hydrologic impact than centralized systems. Long distances between water intake and wastewater discharge points that are more common in highly centralized urban water systems can result in drastically reduced flows in natural streams (Pinkham et al., 2004).
There are some adverse impacts associated with decentralized wastewater treatment systems. Pitterle (2009) compared capital and life-cycle costs for six treatment systems in Colorado ranging in size from residential on-site to a regional treatment plant and an associated capacity range of 2.6–830,000 m3/day (675 gal/day to 220,000,000 gal/day or 220 MGD). Annualized capital costs per million gallons (MG) treated did not vary significantly for treatment plants served by collection systems: $432–$489/MG. On-site system capital costs were significantly higher: $4,300–$7,300/MG. In addition, larger plants were more efficient in capital utilization, defined as the actual use of equipment and facilities divided by the maximum possible use. Capital utilization ranged from 58% for the regional plant to 15% on average for the on-site systems. The large regional treatment plant also had the highest energy efficiency, including primary consumption of electricity and fuel, embodied energy in materials, and avoided energy consumption from biofuel and fertilizer outputs.
Reported treatment performance and reliability are highly variable in small facilities, especially in on-site systems. In Boulder County, Colorado, approximately one-third of the 14,000 on-site systems are unpermitted and at risk of failing. The expense of monitoring and enforcing discharge permits for numerous small systems may decrease motivation for regulators to ensure proper operation and maintenance (Nelson and Shephard, 1998). Historically, small treatment facilities have served isolated communities where discharges may be highly diluted in receiving waters, further reducing incentives for consistent enforcement. Nutrient removal is a common difficulty especially in on-site systems and leads to nitrogen and phosphorus contamination of groundwater (Oakley et al., 2010).
Though most research on decentralization has focused on on-site and cluster systems, these considerations also apply to small satellite wastewater collection and treatment facilities, which may be implemented in a network substituting for a highly centralized system serving the same population. The impact of facility size on reliability and resilience of wastewater treatment performance has been previously characterized (Weirich et al., 2011, 2015). Understanding the aggregate impact of a decentralized network on regional water quality is important for both facility planning and discharge regulation. In this study, a statistical method based on Generalized Linear Model (GLM) applied for modeling wastewater treatment discharges and reliability in Weirich et al. (2011, 2015) is extended for comparison of the water quality impacts of wastewater networks with varying degrees of (de)centralization.
Methods
GLMs have been shown to be a flexible and attractive framework to model discharge of wastewater constituents, including biological oxygen demand (BOD), total suspended solids (TSS), and ammonia (Weirich et al., 2011, 2015). Simulations based on GLM indicated that facility size (capacity), loading (capacity utilization), and discharge history were predictive of performance characteristics of individual plants such as the likelihood of exceeding permit limits and time required for plants to recover after a violation (Weirich et al., 2015). Here, the GLM approach is adapted to predict the performance of networks comprising n facilities serving the same population and service area. To perform this network analysis, the procedure described in Weirich et al. (2015) is used to simulate relative effluent concentrations for each facility in the network. This simulation procedure, in brief, is as follows:
1. Fit GLM based on average flow, capacity utilization, and previous month's effluent using a nationwide database 2. Simulate the expected effluent value for given facility characteristics using the GLM 3. Generate random value from the Gamma distribution defined by the expected effluent value from step 2 4. Repeat steps 2 and 3 until a simulation of the desired length is generated
Since the performance of each facility is assumed to be independent, separate simulations were made even if multiple facilities have identical flow characteristics. The mass flow rate of the constituent of concern for a single facility is then calculated by multiplying the simulated relative effluent values by the permit limit and average monthly flow rate. The sum of the mass flow rate for all n facilities is the total effluent discharge of the network, as shown in Equation (1).
where TEff is the total effluent discharge of the network, Ri is the simulated relative effluent value, Pi is the permitted effluent concentration, and Ai is the monthly average flow rate.
By performing multiple simulations, the range of possible total effluent values for the network can be determined. The network simulation procedure described earlier is used to analyze the effects of decentralization for two different situations. First, it is applied to predict and then compare the distributions of discharged BOD for 400,000 m3/day total wastewater flow treated in networks comprising 1–1,000 separate plants. In a second series of simulations, the discharge of ammonia into an actual watershed, the St. Vrain Creek drainage located northwest of Denver, Colorado, is used to evaluate the effect of decentralization on water quality, described in the next section.
St. Vrain Creek and tributaries are classified as impaired, with a total maximum daily load restriction on ammonia discharges to meet water quality standards for either “Class 1, Cold Water Aquatic Life” or “Warm Water Aquatic Life” depending on location in the drainage area (Lewis and McCutchan, 2008). Nitrogen discharged in wastewater effluents is an increasing regulatory concern. Recently, establishing a national approach for preventing nutrient contamination of surface waters has been considered, rather than continuing the current local water quality-based effluent limits (State-EPA Nutrient Innovations Task Group, 2009). GLM can enable more reliable estimates of wastewater contributions of ammonia based on available data of plant performance to aid in regulatory management of nutrients.
Decentralization and BOD Discharge
To explore the environmental impacts of decentralized wastewater collection and treatment on a watershed, simulations of several hypothetical networks of varying decentralization were performed. Four networks consisting of 1, 10, 100, and 1,000 treatment facilities were simulated assuming a total wastewater flow of 400,000 m3/day (∼ 100 MGD) equivalent wastewater service to a U.S. population of∼1 million. The wastewater flow was divided equally among each plant in the network. For purposes of the simulation, it was assumed that all facilities have an effluent BOD limit of 30 mg/L, common in the United States, and each received a hydraulic load equal to 69% of their rated capacity, the average for all facilities in the United States monitored in the EPA Integrated Compliance Information System (ICIS) database (Weirich et al., 2011). One hundred simulations were performed for each facility, and each simulation was 120 months long. Despite the fact that these hypothetical networks consist of many identical facilities, simulations of each facility must be performed separately due to the assumption that each facility's performance is independent of the others. The total mass flow rate for each network is presented in Fig. 1.

Boxplot of monthly simulated biological oxygen demand (BOD) discharge for increasingly decentralized networks assuming a permit limit of 30 mg/L. The box shows the 25th and 75th percentiles, the whiskers show the fifth and 95th percentile, the points show outliers, and the dotted line is the assumed permit limit.
Two trends are clear. As the decentralization of the treatment plant network increases, the median effluent BOD discharged by the network increases; however, the magnitude of an extreme event, defined here as the 95th percentile effluent discharge, decreases with increasing decentralization.
Small facilities individually are predicted to discharge higher median effluent concentrations of BOD than large facilities, so networks of small facilities will also discharge higher median levels of BOD as shown by the thick bars in Fig. 1. The most centralized network (one facility) has a median discharge of 2,300 kg/day, while the most decentralized network (1,000 facilities) has a median discharge of 4,200 kg/day. Small facilities are also predicted to have greater individual variability in their effluent discharges, resulting in higher 95th percentile discharges (upper whisker) than for large facilities. However, since each plant's performance is independent of others in the network, the variations in individual plants in networks are offsetting, reducing the magnitude of extreme events by distributing the risk of failure more widely. Thus, while a single large facility is less likely to violate its permit than an individual small facility, the likelihood that many small facilities will simultaneously perform poorly is low under normal conditions. Possible exceptions to this assumption are discussed in the next paragraph. Thus, the 95th percentile discharge of a decentralized network of 100 facilities each treating 400 m3/day is 4,600 kg/day, but for a single facility treating 400,000 m3/day the 95th percentile discharge is 7,300 kg/day, 58% higher. Decentralization increases the chronic BOD load to a watershed but decreases the magnitude of extreme acute events to a point. Since the facilities become very small, the poorer treatment overshadows the benefits of distribution of the risk. This results in higher median and 95th percentile discharges as seen in Fig. 1 for the network of 1,000 facilities, showing that there is a limit to how much decentralization can reduce the magnitude of acute events.
It should be noted once again that these results assume that treatment performance at each facility in a network is independent, but this may not always be the case. Certain events, such as infiltration from storm water flow and unusual temperatures, could influence performance for many facilities, causing higher effluent discharges across a large portion of the network. This could be especially problematic for facilities that face difficulties adapting to adverse conditions such as smaller treatment facilities without full-time operators. This could reduce the ability of decentralized networks to meet permitted levels. Despite this caveat, it is clear that networks of small facilities have a different risk profile than more centralized systems. In addition, the risk profile for networks should be considered along with the receiving water characteristics. Watersheds susceptible to chronically high levels, such as those with chronic eutrophication issues, would benefit from the better removal given by centralization. If the main concern is instead acute events, decentralization would reduce the risk.
Results and Discussion: St. Vrain Watershed Case Study
Boulder Creek, St. Vrain Creek, and tributaries form the St. Vrain watershed with a catchment area of 253,771 ha (627,082 acres) located primarily in Boulder County, Colorado at the eastern edge of the Rocky Mountains. Approximately 280,000 people live in several small cities and towns, primarily in the lower elevations at the eastern edge of the watershed. Besides urban areas, other major land uses include forest (42% of total area), rangeland (29%), and cropland (18%). Several of the water bodies are classed as impaired by the EPA. Leading causes of impairment are metals from abandoned mines and ammonia, Escherichia coli, and heightened water temperature from wastewater treatment facilities (USDA, 2010). Though nonpoint sources of ammonia contribute significantly to the impairment, the difficulties of regulating and controlling nonpoint sources may lead to stricter discharge limits for point sources such as wastewater treatment facilities (Lewis and McCutchan, 2008). Even if achievable, the cost of meeting lower discharge limits for ammonia is a major concern of treatment facilities in this watershed.
Within the watershed, there are 21 National Pollutant Discharge Elimination System (NPDES)-permitted wastewater treatment facilities ranging from an average flow of 6–49,000 m3/day, of which 18 have ammonia permit limits and are included in this study. The total wastewater discharge flow averages 110,000 m3/day. The types of treatment include conventional activated sludge plants, aerated lagoons, smaller extended aeration-activated sludge plants, “package” plants, and a commercial septic system (U.S. Environmental Protection Agency, 2008b). Only 8 of the 18 facilities have average flow rates greater than 1000 m3/day.
St. Vrain watershed ammonia discharge simulation
To analyze the effects of decentralization of wastewater treatment on the St. Vrain watershed, simulations were performed for three levels of centralization. First, simulations of the network of existing treatment facilities were compared with the actual reported treatment to test model performance. Next, a hypothetical decentralized case was created in which each facility with a permitted flow greater than 4,000 m3/day (∼ 1 MGD) was replaced with an appropriate number of facilities such that each had a flow equal to or lower than that limit, resulting in a network of 66 plants. For example, the Boulder Wastewater Treatment Plan (WWTP) was divided into 21 facilities, each of which had a flow of 3,700 m3/day (0.98 MGD). Finally, a more centralized network was created by combining wastewater flows from facilities within the same urban area and drainage basin, resulting in six larger facilities. A summary of facility numbers and sizes for each network is presented in Table 1.
For the existing network, simulations of each facility are conducted using actual average flow and capacity utilization values for each plant over a 3 year period (April 2008–March 2011). Ammonia permit limits vary seasonally in Colorado, as in many states, depending on stream temperature, seasonal flow, and aquatic life constraints, with the highest monthly limits often thrice greater than the minimum. Effluent data from the individual facilities show that they typically do not adjust their operations seasonally, and instead seek to meet the strictest permit standards year round. Therefore, the simulations to predict relative ammonia discharge (discharge concentration/permit limit) were performed assuming the lowest ammonia standard.
The total simulated ammonia discharged to the St. Vrain watershed is shown as boxplots with the actual discharged amount as a time series in Fig. 2. The model simulations that capture the observed variability though the simulations are proportionally higher than the actual discharges. This discrepancy is discussed in greater detail later. Actual ammonia discharge into the St. Vrain watershed from wastewater treatment plants is generally between 50 and 100 kg/day. There are three major excursions from this trend in May, 2008, October, 2009, and October, 2010 in which the amount discharged triples to about 200 kg/day.
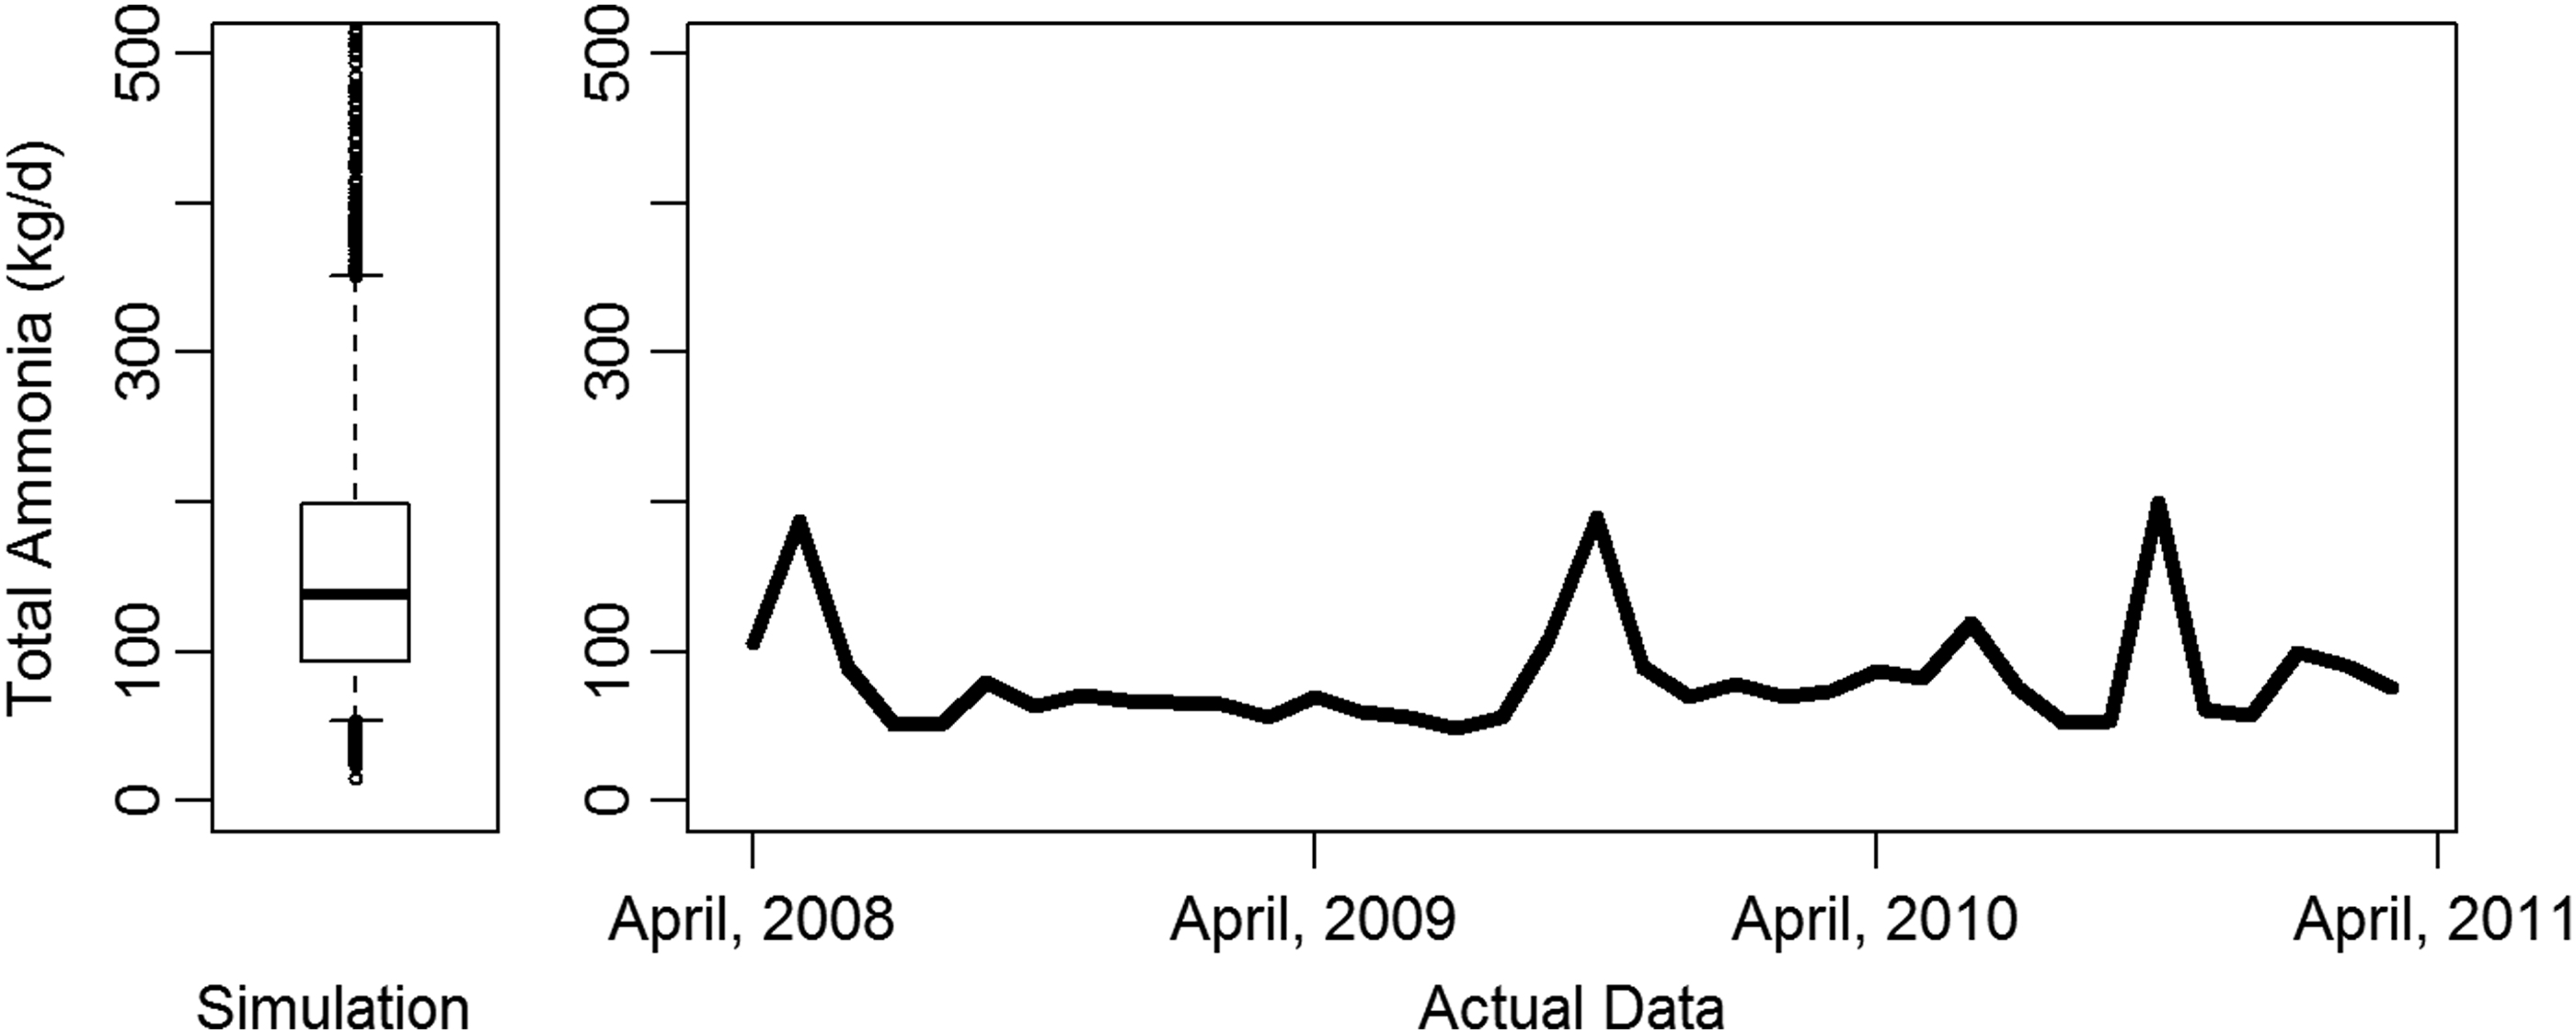
Total simulated and actual effluent ammonia discharged from all wastewater treatment facilities in the St. Vrain watershed. The box shows the 25th and 75th percentiles, the whiskers show the fifth and 95th percentile, and the points show outliers.
These unusually high (though within permitted limits) effluent concentrations can be traced primarily to the City of Boulder WWTP, which is the largest WWTP in the watershed. While the other facilities have variations in effluent concentration, they have very little effect on the overall ammonia discharge due to comparatively low flow rates, reinforcing the finding that treatment performance variation at large, centralized facilities can have a significant impact on a watershed while variations at small facilities have minimal effect on the watershed as a whole, though the small facilities may still affect the stream to which they are discharged.
Median-simulated ammonia discharge for the St. Vrain watershed varies between 100 and 175 kg/day, approximately double the median actual discharge but less than the three peak discharges mentioned earlier. The average actual ammonia discharge for the watershed commonly falls between the fifth and 25th percentiles of the simulations. The facilities in the St. Vrain watershed are performing better than the model predicts, especially the largest facilities, reflecting better removal of ammonia compared with the facilities in the national EPA ICIS database from which the model was developed. This is consistent for all three contaminants studied: BOD, TSS, and ammonia. Relative effluent values of ammonia are 47% less in the St. Vrain watershed than nationally, 60% less for BOD, and 38% less for TSS. Both the Boulder and Longmont treatment facilities have undergone major upgrades in the past 10 years to improve nitrification specifically. In addition, in anticipation of stricter ammonia discharge standards beginning around 2017, many local treatment facilities closely monitor their treatment processes, likely resulting in a better than average performance. A closer look at the data (Table 2) shows that facilities in the St. Vrain watershed smaller than 4,000 m3/day discharge higher relative levels of ammonia than the larger facilities, as is predicted by the model (Weirich et al., 2015).
To verify that the simulations accurately capture the effluent discharge variability, we compared the range between the fifth and 95th percentile of the simulations as well as the actual data. A direct comparison shows that the simulation range is slightly more than double the range of the actual data; however, this is expected given the improved performance in the watershed compared with national performance data. Since the model uses a gamma distribution, which is skewed, with a constant shape parameter, the effluent variability is proportional to the effluent concentration. Thus, higher simulated values imply a higher range. A comparison of the data ranges normalized by median effluent discharge shows that the simulation range is only 12% larger than that of the actual data. Thus, the variability and trends evident in the model still apply to the watershed, and the simulations are a valid method of analyzing the effects of decentralization and centralization.
Decentralization and centralization
To compare with the existing system, two hypothetical treatment scenarios are constructed and simulations are performed. For the decentralized system, facilities with average flows greater than 4,000 m3/day will be replaced with an appropriate number of facilities such that each has a design flow lower than that limit. This resulted in the seven largest facilities being split into a total of 55 separate small treatment facilities, resulting in a total network of 66 facilities. For these hypothetical facilities, the monthly flow of the original was divided evenly between its replacements, and the permitted effluent concentration was kept the same so the decentralized network has the same permitted mass flow rate of ammonia as the existing system.
For the centralized system, clusters of nearby facilities were combined, resulting in six centralized facilities. Five of these facilities have flow rates larger than 4,000 m3/day, and the last is a combination of two small facilities separated from others in the watershed by∼15 miles of rugged terrain. The average flow and design flows of these facilities were added together, and the permitted effluent concentration of ammonia was a weighted average (based on the design flow) of the original facilities, once again maintaining the same permitted mass flow rate of ammonia.
Treatment simulations of these hypothetical scenarios were performed using the same procedure as for the existing system. Figure 3 shows box plots of the monthly total mass flow rate of effluent ammonia for each of the three network scenarios. Clearly, median ammonia discharge decreases for more centralized systems, consistent with the finding that larger facilities discharge lower effluent concentrations. The discharge of the decentralized is 167 kg/day, higher than both the existing system (138 kg/day) and the centralized system (105 kg/day). However, extreme events follow a different pattern than median discharges. The 95th percentile of discharges (upper whisker) from both the decentralized and centralized systems is∼300 kg/day, lower than that of the existing system (351 kg/day). For the centralized system, the increased reliability and decreased variability of large treatment facilities also reduces the magnitude of extreme events. Interestingly, this is a different trend than for BOD as shown in Fig. 1 where centralized networks had higher BOD discharges in extreme events.
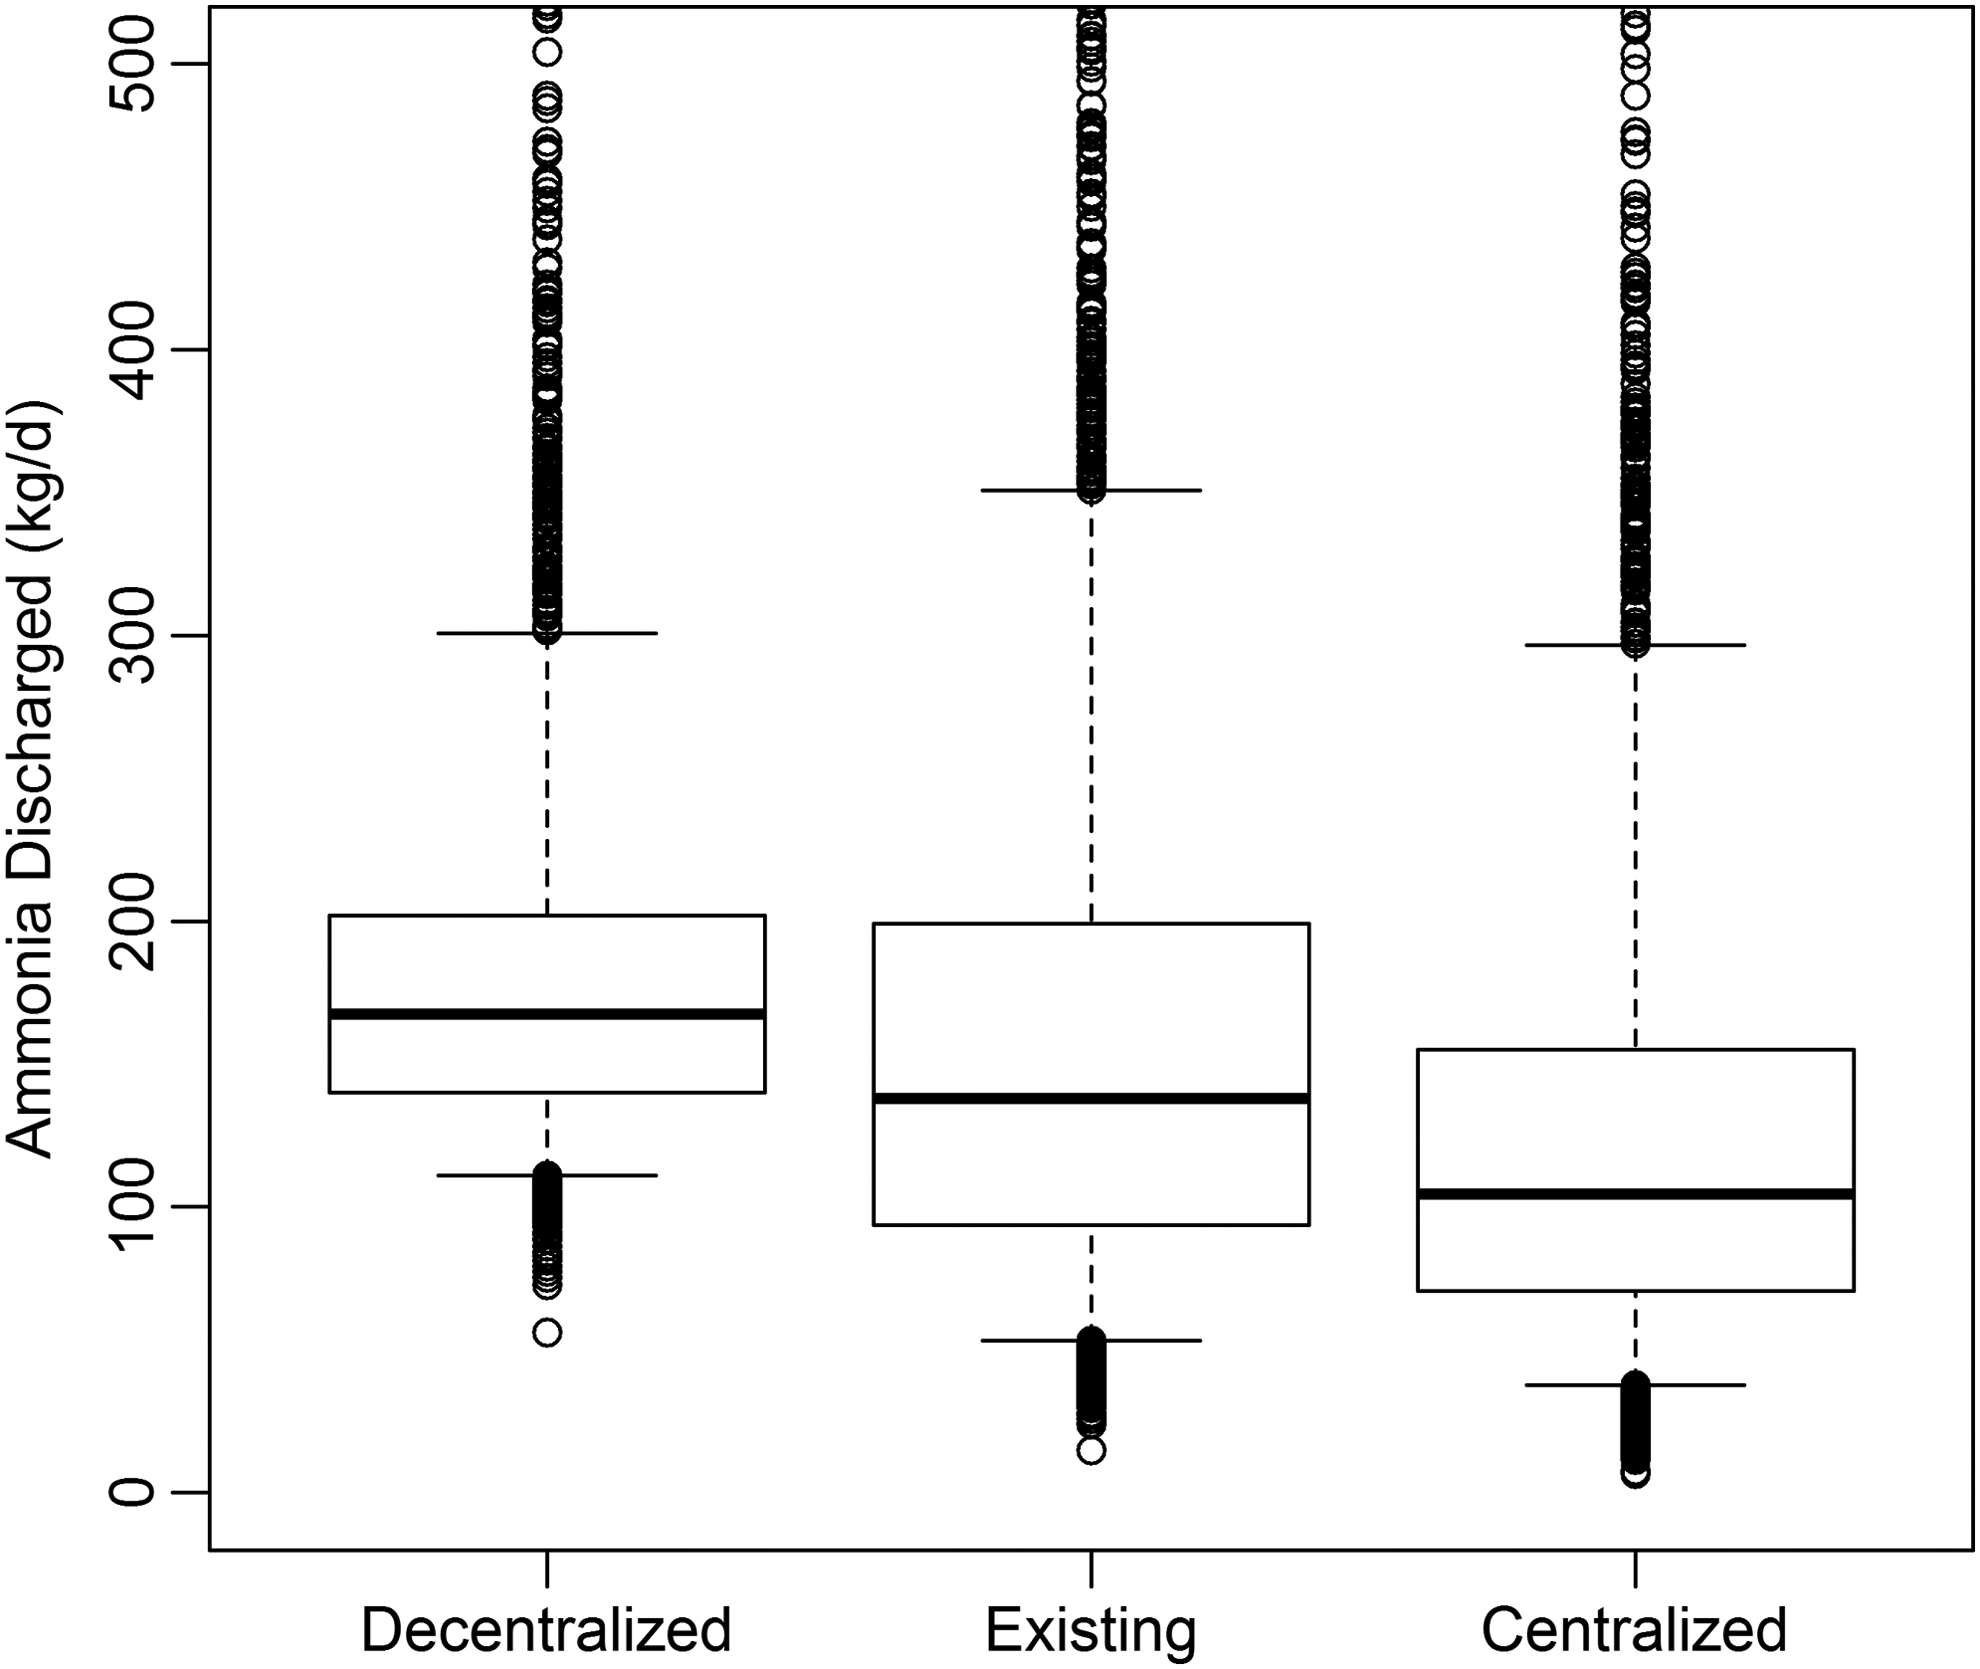
Distribution of simulated mass flow rate of ammonia discharged to the St. Vrain watershed for networks with three levels of centralization: decentralized (n=66 plants), existing (n=18 plants), and centralized (n=6 plants). The box shows the 25th and 75th percentiles, the whiskers show the fifth and 95th percentile, and the points show outliers.
For the decentralized network, a different effect than for the centralized network accounts for a lower impact of extreme discharge events. To significantly affect the network-wide ammonia discharge, a sizable portion of the facilities in the network must simultaneously perform poorly in any given month. As the number of facilities increases the likelihood of concurrent high releases of ammonia decreases, except in the case where a few large facilities comprise most of the wastewater flow for the network, as is true for the existing regional network of plants. With regard to extreme events, the existing network is vulnerable to the impact of process upsets by large plants even though some risk may be dispersed among the smaller plants in the network.
The total permitted discharge of ammonia for the watershed was calculated as sum across all n facilites of the permitted concentration times the design flow for each treatment facility i [Eq. (2)], and is 1,411 kg/day.
where Tperm is the total permitted effluent discharge for the watershed, Pi is the permitted effluent concentration at each facility, and Ai is the average monthly flow for each facility. Of the total allowed ammonia discharge into the St. Vrain watershed, 95% comes from the seven largest facilities. Water quality modeling of those seven largest facilities performed in preparation for the creation of new standards for ammonia discharge indicates that a reduction of 42% of the total permitted discharge of ammonia is needed to achieve the desired water quality in the St. Vrain watershed. Assuming a 42% reduction for all facilities, the total permitted discharge under the new standard will be 821 kg/day. For all three networks simulated, the discharge of ammonia even in extreme cases is well below both the current total permitted discharge for the watershed and the anticipated stricter standards. These results suggest that if the wastewater treatment facilities in the St. Vrain watershed represent removal levels achievable by typical secondary treatment, then national ammonia standards are within the treatment capacity of most plants without significant process modification. Of course, new more stringent standards for nitrate and phosphorus will pose more significant challenges for wastewater utilities in the United States that are not designed for biological nutrient removal.
In a previous study (Weirich et al., 2015), the ability of an individual treatment plant to recover from a process failure, or resilience, was found to depend on plant size, with smaller plants more likely to experience a series of contiguous monthly violations. Time-dependent statistics such as the length of sequential permit violations and number of violations within a time period are of interest in assessing water quality impacts of decentralization. For the network simulations, a threshold of 300 kg/day was chosen to represent reduced ammonia discharge limits in the future. Time series were generated for monthly ammonia discharge levels over a period of 3 years. The average duration of network exceedances and the number of separate exceedances of any duration are shown in the box plots in Fig. 4. Most exceedances of this threshold last between 1 and 2 months for all levels of decentralization; however, the 95th percentile exceedance duration for both the decentralized and existing networks is 4 months, but only 3 months for the centralized network, indicating that centralized networks are more resilient.
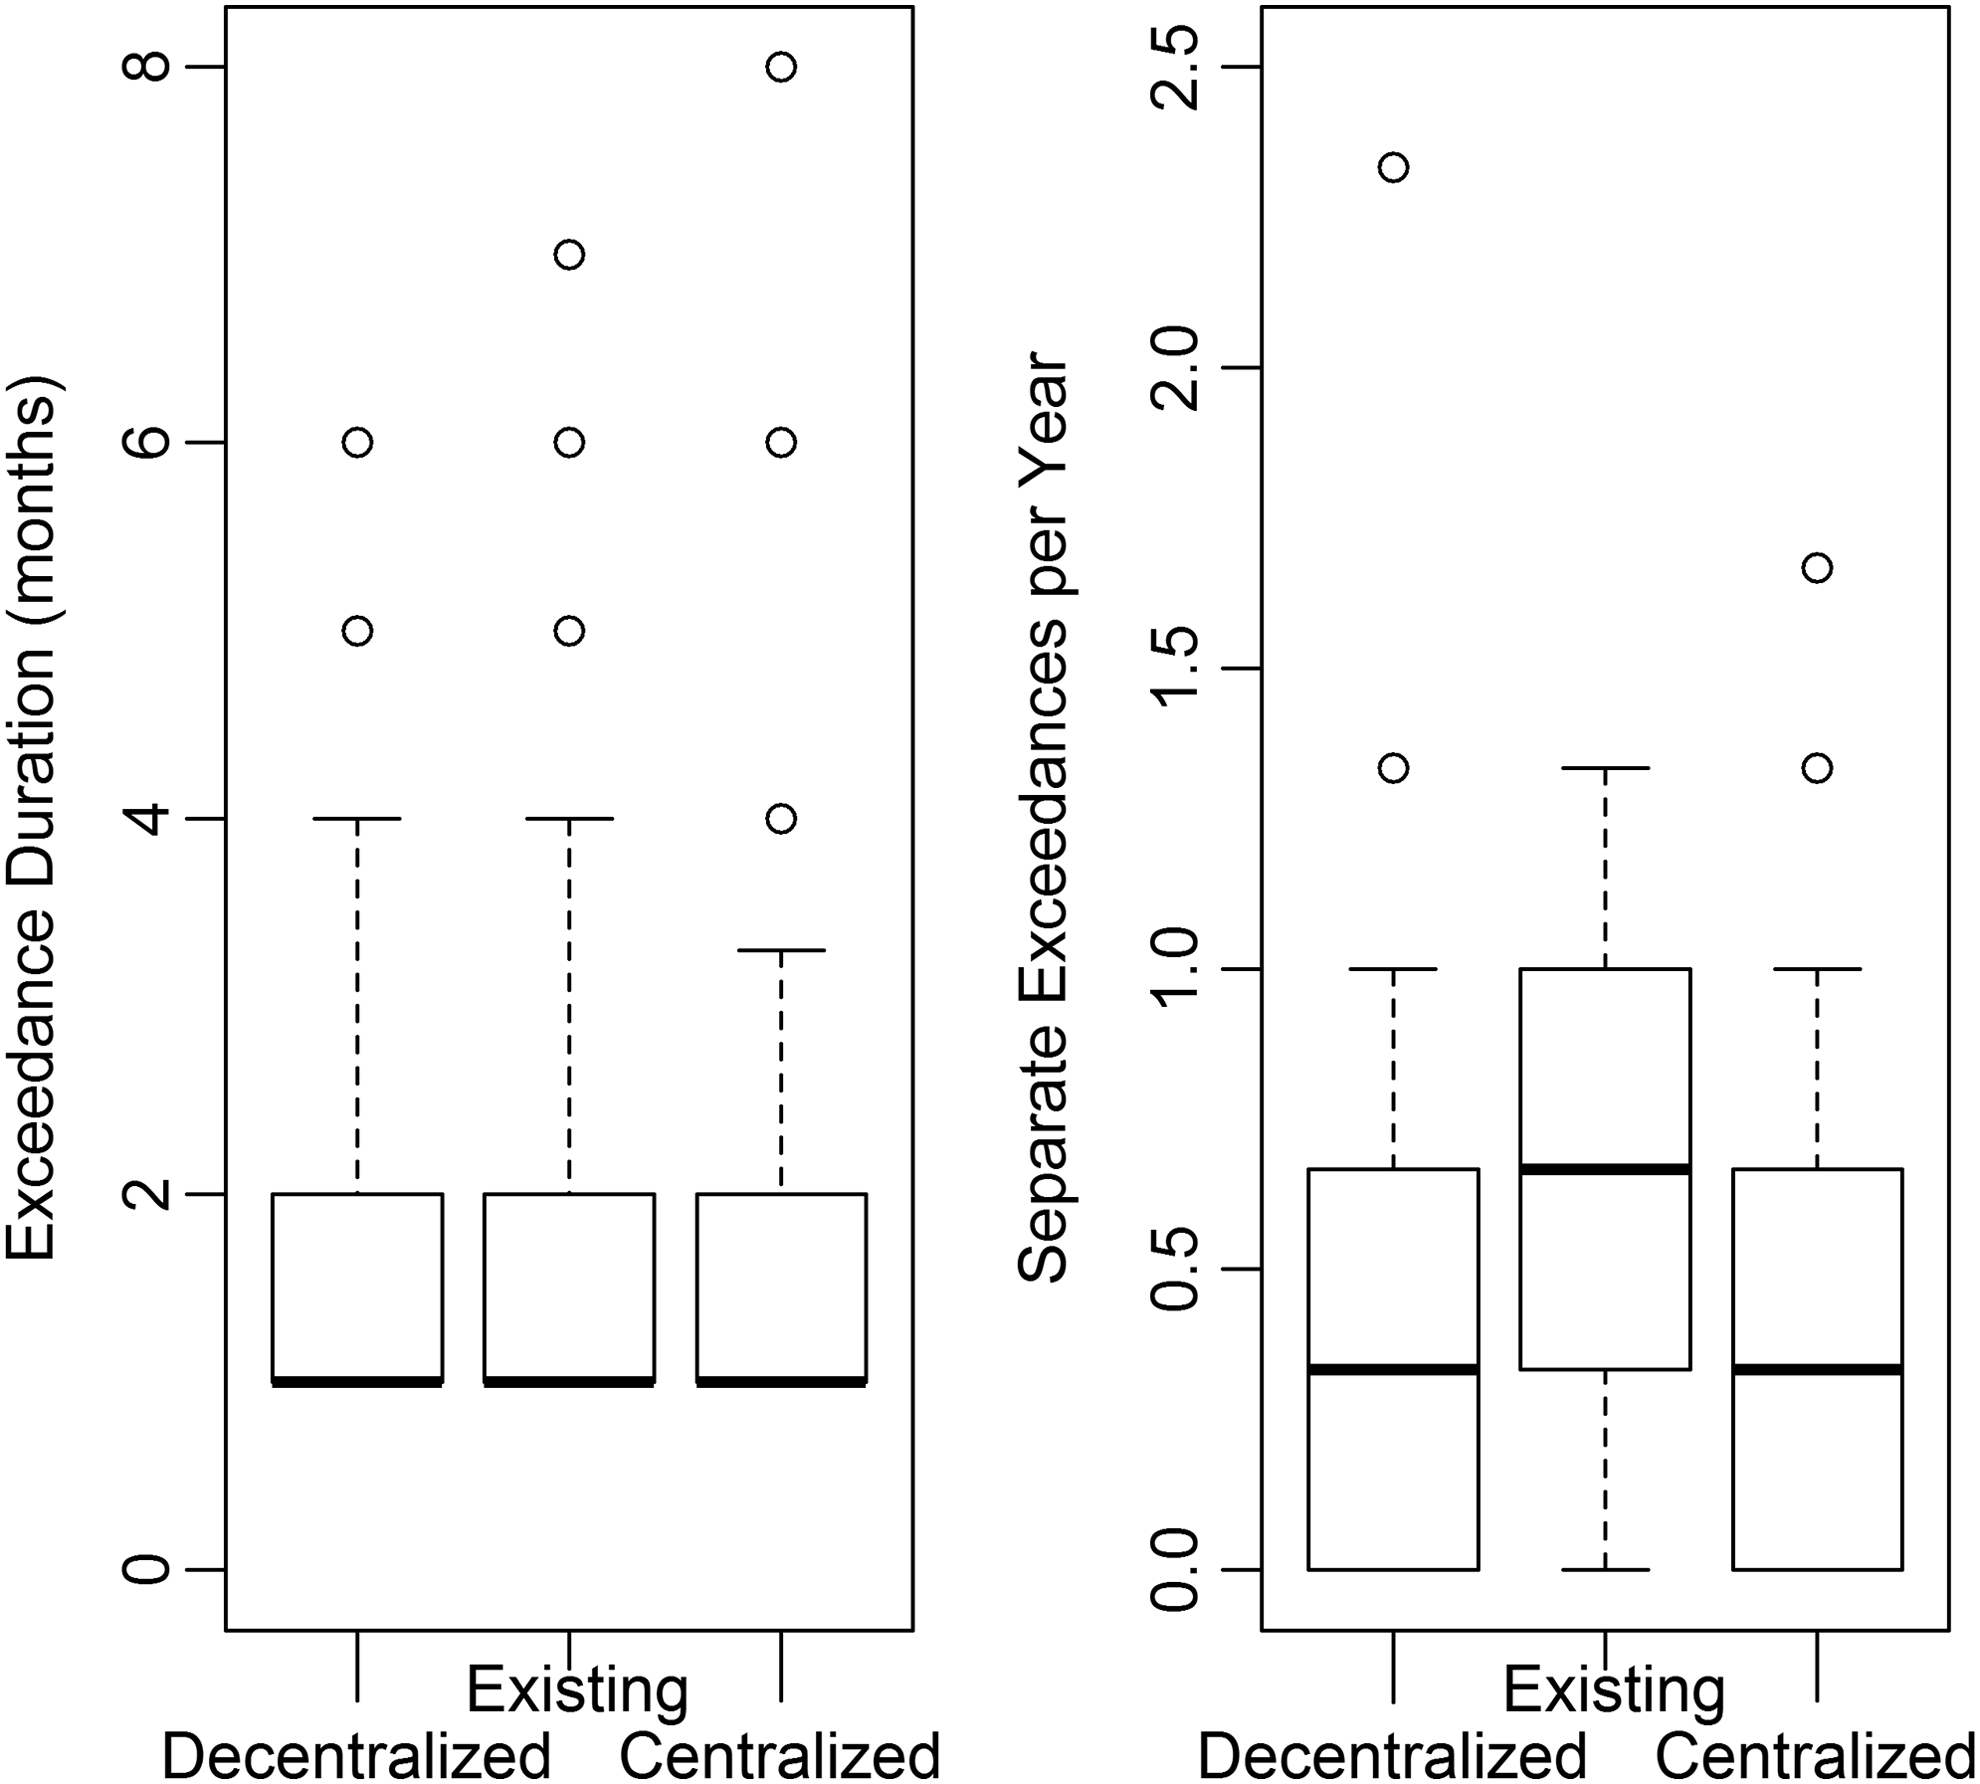
Predicted duration and frequency of exceeding 300 kg/day ammonia discharged for increasing level of centralization in the St. Vrain watershed. The box shows the 25th and 75th percentiles, the whiskers show the fifth and 95th percentile, and the points show outliers.
The network stability is measured as the median number of exceedances per year and is 0.3 for the decentralized and centralized networks and 0.7 for the existing system. The 95th percentile has a similar trend as the median, indicating that the existing mixed network is the least stable of the options, given this particular threshold. It is important to note that these results are sensitive to the threshold chosen, particularly with regard to the decentralized network due to the narrower range of discharged ammonia as shown in Fig. 3. For higher thresholds such as the current standards, the decentralized network would have relatively higher resilience and stability compared with the more centralized networks. However, in the case of reduced watershed, assimilation capacity for ammonia due to factors such as extreme low flows or stresses on aquatic life caused by rising water temperatures, decentralized networks may be less adaptable to more stringent water-quality standards.
In addition to the network composition considered in this study, the network topology also has an effect on the sustainability of the network. Pizzol et al. (2013) and Bodini et al. (2012) found that a simple network with fewer connections led to not only increased efficiency but also increased vulnerability to disasters due to reduced flexibility. This indicates that a decentralized system where the wastewater flow can be directed to different treatment facilities as needed could have greater resilience than the individual facility reliability would indicate. Discharge location is also a significant feature of a network beyond the scope of this analysis. Centralized treatment can lead to interbasin water transfers, as is the case in Boston (Pinkham et al., 2004), which affect the surface water quality. Decentralized treatment can move the wastewater discharge point closer to the drinking water withdrawal location, which would have fewer consequences for the ecosystem. The method presented in this article could be used to study these effects by applying it over the same geographic area, but with different system boundaries. For instance, this network analysis could be conducted for each individual stream reach as well as for the whole watershed.
Conclusion
A GLM was used to simulate the distribution of effluent BOD from networks treating wastewater from∼1 million population equivalents with varying levels of decentralization. The GLM approach to simulate waste water quality is a novel application, although it is widely used in stochastic hydroclimate simulation. The GLM provides good capability to simulate a rich variety of scenarios enabling robust estimation of probability density function and, consequently, the risk estimates for use in planning and management.
As a network becomes more decentralized, the median network BOD removal efficiency decreases due to the lower performance of individual small facilities. However, the likelihood of extremely high BOD discharges to a watershed decreases for decentralized systems due to dispersal of the risk across many facilities. Thus, while centralized wastewater networks will discharge less BOD on average, there is a greater probability of a process failure having a significant impact on receiving water quality. However, due to decreased reliability of very small facilities, there is a limit to how much decentralization can reduce the magnitude of acute events. In a case study of a watershed (St. Vrain Creek basin, Colorado), GLM-based simulations of ammonia discharged by plant networks serving a population of 280,000 (110,000 m3/day) indicate that decentralization results in higher median discharge ammonia loads to the basin than more highly centralized networks. However, a hybrid network comprising several large plants and a number of smaller ones is the most likely to experience an extreme event of high ammonia discharge. Centralized networks tend to be more resilient after a process upset, especially as ammonia limits decrease, while decentralized networks are both more stable and resilient when limits are less stringent.
Realizing the flexibility and cost benefits of decentralization of wastewater treatment systems will depend on understanding the environmental risks imposed by the variability and reliability of the aggregate performance of networks of collection and treatment facilities at a watershed or regional scale. In particular, high levels of BOD and ammonia released to surface waters can have significant negative effects on water quality, especially if those discharges are of long duration. The statistical method used in this study to compare the performance of treatment systems networks with varying degrees of centralization can serve as a decision support tool for planning agencies considering how best to serve rapidly urbanizing areas and for regulators considering expected process variability across a watershed when setting permit limits.
Footnotes
Author Disclosure Statement
No competing financial interests exist.