
Abstract
Abstract
Biodegradation is the primary removal mechanism of the potent endocrine-disrupting estrogen 17α-ethinylestradiol (EE2) during activated sludge (AS) wastewater treatment. Analysis of AS treatment process designs to optimize EE2 removal requires knowledge of EE2 biodegradation kinetics. However, there is little information on EE2 biodegradation kinetics for different types of systems and under long-term studies. EE2 biodegradation kinetics were investigated at 20°C using laboratory-scale sequencing batch reactors simulating aerobic, anaerobic/aerobic enhanced biological phosphorus removal, and anoxic/aerobic biological nitrogen removal processes fed synthetic wastewater. Three sets of reactor experiments were conducted using different municipal AS plant seed sources and with solid retention times (SRTs) ranging from 8 to 13 days. EE2 biodegradation was described by a pseudo first-order biodegradation rate model with a rate coefficient (kb) normalized to the reactor volatile suspended solids (VSS). EE2 kb values were determined from batch degradation tests and from calibration of the model to the reactor process. Significant EE2 biodegradation occurred only under aerobic conditions. Observed EE2 kb values for aerobic, anaerobic/aerobic, and anoxic/aerobic operations ranged from 4 to 22 L/g VSS-day, 4 to 19 L/g VSS-day, and 3 to 20 L/g VSS-day, respectively. Model simulations showed that the EE2 removal efficiency could range from 72% to over 99% for these coefficients at a 10-day SRT. Predicted EE2 removal efficiency at a given kb value can be improved by operating at a higher SRT upto a limit, by having a greater number of aerobic reactor stages, and by having a higher influent biodegradable chemical oxygen demand concentration.
Introduction
M
Of the estrogens, EE2 is the most difficult to degrade (Joss et al., 2004) and has the greatest estrogenic activity based on bioassays (Van den Belt et al., 2004) with a predicted no-effect concentration of 0.1 ng/L in surface waters (Caldwell et al., 2012). The impact of EE2 at such a low concentration indicates the need to identify processes and designs that can minimize WWTP effluent EE2 concentrations.
EE2 influent concentrations and removal efficiencies vary for municipal activated sludge (AS) WWTPs. Reported influent concentrations range from below detection to 330 ng/L, with a mean of 30 ng/L and median of 5 ng/L; removal efficiencies range from 34% to 98%, with a mean and median of 61% and 69%, respectively (Ternes et al., 1999; Baronti et al., 2000; Johnson et al., 2000; Cargouet et al., 2004; Joss et al., 2004; Clara et al., 2005; Cicek et al., 2007; Koh et al., 2009; Zhou et al., 2012). Biodegradation is responsible for greater than 90% of estrogen removals during AS wastewater treatment with the remainder removed by sorption to wasted solids (Andersen et al., 2003; Joss et al., 2004; Muller et al., 2008; Zhou et al., 2012). In view of the low ng/L influent estrogen concentrations in WWTPs, EE2-degrading bacteria must grow on another substrate to provide the removals observed (Tran et al., 2013).
Both ammonia-oxidizing bacteria (AOB) and heterotrophic bacteria have been linked with EE2 biodegradation in AS systems. Early work suggested that substantial EE2 degradation in WWTPs was due to AOB. In batch tests with a pure culture of Nitrosomonas europaea at 280 mg/L NH4-N and 400 μg/L EE2, Shi et al. (2004) showed EE2 removal with nitrification, but none when nitrification was inhibited with allythiourea (ATU). However, this result was later shown to be due to the high nitrite concentration produced in the uninhibited culture, which caused EE2 removal by abiotic nitritation (Gaulke et al., 2008).
There has been limited work investigating the role of AOB at EE2 concentrations that are more relevant to the ng/L levels found in municipal wastewaters. Batch experiments at 500 ng/L EE2 and 10 mg/L NH4-N showed no EE2 removal with Nitrosomonas europaea or with Nitrosospira multiformis (Gaulke et al., 2008). Bagnall et al. (2012) monitored AOB concentrations and the degradation performance of EE2 in laboratory-scale reactors fed synthetic wastewater and EE2 ranging from 38 to 570 ng/L. Following replacement of ammonia with nitrate in the synthetic feed, they observed no significant change in EE2 degradation even though the AOB concentration was reduced by 99%; thus, they attributed EE2 removal to degradation by heterotrophic bacteria.
Khunjar et al. (2011) reported on the effect of adding ATU to inhibit nitrification in a nitrifying AS chemostat fed primary effluent and 500 ng/L EE2. Before the ATU addition, the reactor effluent EE2 concentration was close to 1 ng/L. After ATU addition, the authors note that nitrification was inhibited with no nitrate or nitrite production for the next 15 days. The effluent EE2 concentration increased to 7 ng/L after nitrification inhibition, but by the 15th day it was down to near 2 ng/L. A mass balance based on the reactor feed EE2 concentration, hydraulic retention time, and assuming no EE2 degradation predicts that if the AOB were responsible for EE2 degradation and that degradation was inhibited by ATU, the reactor EE2 concentration would have increased to 48 ng/L in the first day instead of 7 ng/L and would have been 389 ng/L by the 15th day. Since EE2 levels were only slightly affected by ATU addition, these results strongly suggest that heterotrophic bacteria were primarily responsible for EE2 degradation in the nitrifying AS chemostat before and after the ATU addition.
Mechanistic models that predict the fate of estrogens during AS treatment (Joss et al., 2004; Lust et al., 2012) represent biodegradation as a pseudo first-order rate by normalizing biodegradation kinetics to the mixed liquor total suspended solids (TSS) or heterotrophic biomass concentration. Integration of an estrogen fate model with a comprehensive AS model, as done by Lust et al. (2012), provides a basis for predicting EE2 removal as a function of influent wastewater characteristics, process design configuration, and operational conditions. Knowledge of EE2 biodegradation kinetics and how conditions affect the kinetics is needed for such a model to serve as a useful tool for evaluating AS designs with low effluent EE2 concentrations.
The types of AS processes used for municipal wastewater treatment are often influenced by treatment needs for nitrogen and/or phosphorus removal, which has led to an increase in the number of biological nutrient removal (BNR) processes that use anaerobic and/or anoxic zones before the aerobic basins in single-sludge AS systems. In the anaerobic zone (no oxygen or nitrate/nitrite is present), influent soluble biodegradable chemical oxygen demand (sbCOD) is consumed to support the growth of polyphosphate-accumulating organisms, which results in enhanced biological phosphorus removal (EBPR) (Tchobanoglous et al., 2014). Alternatively, in preanoxic zones (no oxygen, but nitrate/nitrite is present), influent sbCOD is consumed to promote the growth of heterotrophic denitrifying bacteria that use nitrate/nitrite as the terminal electron acceptor. These systems select for different populations based on the different metabolic conditions during substrate uptake, and there has been little work showing how estrogen degradation kinetics may be affected by these different BNR processes compared to aerobic treatment only.
Previous studies measuring estrogen biodegradation kinetics of AS from BNR processes (Joss et al., 2004; Gaulke et al., 2009) have been confined to batch tests conducted with grab mixed liquor samples from full- and pilot-scale municipal wastewater treatment facilities. No study, to our knowledge, has adequately compared estrogen degradation kinetics at ng/L concentrations in BNR AS systems under controlled long-term operating conditions. Dytczak et al. (2008) conducted experiments with consideration of aerobic and anoxic/aerobic operations; however, initial estrogen concentrations of 5 mg/L were substantially higher than those found at WWTPs, and Xu et al. (2009) showed that EE2 degradation kinetics obtained at high μg/L concentrations were five to seven times slower than those obtained at ng/L concentrations. The objective of this research was to further evaluate estrogen biodegradation kinetics in AS aerobic and BNR designs by operating parallel laboratory-scale sequencing batch reactors (SBRs) amended with ng/L estrogen concentrations.
Experimental Methods
SBR description and operating conditions
Three sets of laboratory-scale SBRs were operated with different seed sources obtained from municipal WWTPs and at solid retention times (SRTs) typical of that for AS biological nitrogen removal processes, as summarized in Table 1. The first set of SBRs compared EE2 biodegradation kinetics in aerobic-only and anoxic/aerobic processes over three phases. The reactors were seeded with return activated sludge from the City of Puyallup, WA anoxic/aerobic BNR process operated at a 10-day SRT. During Phase I, two anoxic/aerobic SBRs were operated in parallel at an 8-day SRT to assess differences in estrogen biodegradation kinetics between systems operated under the same conditions. During Phase II, the mixed liquor of the anoxic/aerobic SBRs from Phase I was combined and used to seed an aerobic-only and an anoxic/aerobic SBR with operation at an 8-day SRT. During Phase III, the SRT of the aerobic-only and anoxic/aerobic SBRs was increased to 13 days. The second set of SBRs compared EE2 biodegradation kinetics in anaerobic/aerobic and anoxic/aerobic processes at a 10-day SRT. These reactors were seeded with mixed liquor from the Durham oregon anaerobic/anoxic/aerobic BNR process operated at an 11-day SRT. The third set of SBRs compared EE2 biodegradation kinetics in aerobic-only, anaerobic/aerobic, and anoxic/aerobic processes at a 13-day SRT. The reactors were seeded with mixed liquor from the King County, Renton, WA anaerobic-aerobic BNR process operated at a 4-day SRT. Before the 13-day SRT operation, these SBRs were operated 115 days at an 8-day SRT without any estrogen addition to assure that EBPR was well established.
Average±one standard deviation.
Combined SBR-mixed liquor from Phase I to seed Phase II reactors.
Continued operation from Phase II.
First hour of cycle was idle period to maintain similar aerobic SRT.
WWTP, wastewater treatment plant; SBR, sequencing batch reactor; SRT, solid retention time; MLVSS, mixed liquor volatile suspended solids.
The laboratory-scale SBRs were 1-L Pyrex Erlenmeyer glass flasks with a working volume of 0.95 L and maintained at 20°C in an environmental chamber in the dark. Cycle times of 4 or 6 h consisted of the following: (1) either 1 h of idle, aeration, anaerobic mix, or anoxic mix, (2) 2.5 or 4.5 h of aeration, (3) 25 min of settling, and (4) 5 min of decant (Table 1). Either 1/4 of the reactor volume or 1/8 of the reactor volume (Puyallup-seeded SBRs, Phase III only) was decanted and replaced with synthetic feed per cycle. Synthetic wastewater was delivered during the first 5 to 30 min of the cycle using peristaltic pumps. For the anaerobic/aerobic and anoxic/aerobic SBRs, nitrogen gas at 600 mL/min was fed to the 180-mL flask headspace during the anaerobic or anoxic contact period. Mixing was done using magnetic stir bars. Air was supplied during the aerobic period by sparging through stone diffusers. Based on our previous experience with similar air sparge to liquid volumes in small laboratory reactors, the dissolved oxygen (DO) should have been well above 2 mg/L. After the settling period, the supernatant was decanted to a preset level using a peristaltic pump. Manual wasting of mixed liquor volume was done daily to maintain the target SRT, based on previous day effluent TSS and mixed liquor suspended solids (MLSS) concentration measurements.
Soluble synthetic wastewater fed to the SBRs had a chemical oxygen demand (COD) of 347±39 mg/L. Organic constituents included 200 mg/L sodium acetate, 100 mg/L propionic acid, 55.2 mg/L peptone, and 20 mg/L casein. Phosphorus (28±1 mg P/L) consisted of 100 mg/L K2HPO4 and 50 mg/L KH2PO4, and NH4Cl was added at 10±2 mg N/L. The feed of the anoxic/aerobic SBRs contained NaNO3 at 51±8 mg N/L. Macro-inorganic nutrients consisted of 347 mg/L MgCl2·6H2O, 129 mg/L CaCl2·2H2O, and 79 mg/L KCl. Trace elements and vitamins were added as described by Clark (2009). Yeast extract (BD Bacto) (10 mg) was manually added to the SBRs every other day. Estrogens in the synthetic wastewater averaged 300±45 ng/L E1, 313±41 ng/L E2, and 298±67 ng/L EE2. For the Durham and Puyallup-seeded SBRs, alkalinity was added to the feed at 50 to 70 mg/L as CaCO3 and carbon dioxide was added to the aeration line for pH control. No alkalinity was added to the feed of the Renton-seeded SBRs.
During a decrease in the sludge thickening ability in Phase III of the Puyallup-seeded SBRs, the synthetic wastewater concentration was doubled (with the exception of the phosphorus, macro-inorganic nutrients, and yeast extract concentrations) so that a lower feed volume and SBR decant depth could be used to prevent solid loss. The synthetic wastewater contained 706±32 mg/L COD, 30±1 mg PO4-P/L, 19±5 mg NH3-N/L, and 94±2 mg NO3-N/L (anoxic/aerobic SBR only). Estrogen concentrations in the synthetic wastewater averaged 563±115 ng/L E1, 435±119 ng/L E2, and 420±25 ng/L EE2.
Sampling and analyses
For each operational condition, the synthetic feed was sampled at least 2 times for COD and estrogens and at least once for nutrients (PO4-P, NH3-N, and NO3-N). Mixed liquor, effluent solids, and reactor pH were monitored daily. Reactor samples were collected 3 times a week at the end of the anaerobic or anoxic cycle and at the end of the aeration cycle for nutrient analyses (PO4-P, NH3-N, NO3-N, and NO2-N). NO2-N was not measured in the Renton-seeded SBRs. Soluble COD (sCOD) in the reactor samples was measured at least thrice during each operational condition. For the Puyallup- and Renton-seeded SBRs, total estrogen measurements of the mixed liquor were normally taken 2 times a week at the end of the aeration cycle surrounding batch degradation testing events. Soluble estrogen concentrations were also measured for nine of these sampling events to characterize estrogen partitioning to the AS. All estrogen measurements were conducted in duplicate.
Analytical methods
E1, E2, and EE2 concentrations were measured by performing a liquid–liquid extraction with ethyl acetate, derivatization with dansyl chloride, and analysis using liquid chromatography coupled to tandem mass spectrometry, as described by Ziels et al. (2014). For total estrogen measurements, the sample consisted of the mixed liquor containing both the aqueous and solid fractions. For soluble estrogen measurements, the sample consisted of the supernatant after centrifuging the sample. The limit of detection for the method was 1 ng/L (signal-to-noise ratio of 3:1) and the method limit of quantification (LOQ) was 5 ng/L (signal-to-noise ratio of 10:1). HACH kits and a HACH DR4,000 U Spectrophotometer (Loveland, CO) were used to analyze COD (HACH Method 8000) and nutrients, including PO4-P (Method 8114), NH3-N (Methods 10023 and 10031), NO3-N (Methods 10049 and 10020), and NO2-N (Method 10019). Samples were first filtered through a 0.45-μm Supor filter before nutrient analyses. TSS and volatile suspended solids (VSS) were measured according to standard methods (APHA et al., 2005) using Whatman Grade GF/C (1.2 μm) glass fiber filters for filtration.
Estrogen biodegradation in situ batch kinetic tests
In situ estrogen biodegradation tests were conducted in the SBRs to determine the biodegradation kinetics for the particular SBR operating conditions. At the end of the feeding period, each SBR was amended with an additional 0 to 175 ng/L of E1, E2, and EE2 using aqueous stock solutions. Total estrogen concentrations were measured throughout one SBR cycle. To address any abiotic removals, autoclaved effluent (100 mL) from the aerobic-only and anoxic/aerobic SBRs was amended with an additional 200 ng/L of aqueous E1, E2, and EE2 and subjected to the same anoxic (nitrate of 23 mg N/L, headspace purged with nitrogen) and aerobic conditions (air sparged) as the corresponding SBRs. All estrogen measurements were conducted in duplicate.
Estrogen biodegradation kinetics and solid partitioning
Estrogen biodegradation was assumed to follow a pseudo first-order model as a function of the soluble estrogen and mixed liquor VSS (MLVSS) concentrations (Gaulke et al., 2009) as follows:
where ET is the total estrogen concentration (ng/L), t is the time (day), kb is the pseudo first-order estrogen biodegradation rate coefficient normalized to MLVSS (L/g VSS-day), and ES is the soluble estrogen concentration (ng/L). XVSS is the measured MLVSS concentration (g/L), which consists primarily of biomass as a result of feeding only soluble biodegradable substrate. Under equilibrium conditions, ES is related to ET by ES=ET/(1+KPXVSS), where KP is the estrogen solid–liquid partitioning coefficient (L/g VSS). Assuming a rapid solid–liquid equilibrium of the estrogen (Andersen et al., 2005) and insignificant change in MLVSS concentration during the test, the decline in total estrogen concentration during degradation tests was modeled as follows:
Estrogen kb values were calculated according to Gaulke et al. (2009) by performing a linear regression of ln(ET,t/ET,o) versus time (Microsoft Office Excel 2007) and multiplying the slope of the linear trend line by (1+KPXVSS)/XVSS. Each kb value was determined using four or more total estrogen measurements. Student's t-tests were used to compare kb values (Microsoft Office Excel 2007).
Total and soluble estrogen concentrations were measured at the end of the SBR aerobic period to determine the apparent estrogen solid–liquid partitioning. Sorbed estrogen concentrations (Esorb, ng/g) were calculated as follows:
and apparent KP values were determined from total and soluble estrogen measurements at the end of the SBR aerobic period as follows:
These KP values were used in calculating estrogen kb values as described above.
SBR model for total EE2 concentration versus reaction time
In addition to conducting estrogen degradation tests as previously described, EE2 kb values were also determined by calibrating an SBR model for predicting total EE2 concentrations at the end of the aerobic period. After repetitive cycles with the same feed and SRT control, a steady-state MLVSS concentration and final effluent nutrient concentrations occur for an SBR. Joss et al. (2006) developed a steady-state SBR model for predicting effluent soluble pharmaceutical concentrations based on a mass balance that included rapid solid–liquid partitioning characterized by a solid–liquid partitioning coefficient (Kd, L/g TSS) and applying a pseudo first-order biodegradation rate model with a kbiol coefficient normalized to MLSS (L/g TSS-day). Equation (15) in Joss et al. (2006) was modified in this study to predict the total mixed liquor EE2 concentration at the end of the SBR aerobic period (EE2T,
where R is the ratio of the SBR volume after decanting to the feed volume, and all other variables have previously been defined. EE2 kb values were calculated by fitting Equation (5) to measurements of EE2T,

SBR and continuous-flow completely stirred tank reactor models for EE2 removal efficiency
EE2 removals were modeled for an SBR and a single or series of continuous flow completely stirred tank reactors (CSTRs) with secondary clarification at 20°C to assess how biodegradation rate coefficients and operational conditions affect reactor performance. Biodegradation was related to the active heterotrophic biomass concentration rather than the total MLVSS, as the fraction of biomass varies depending on SRT and influent wastewater characteristics. For the simple case where the influent substrate is completely biodegradable, as in this study, the mixed liquor biomass concentration (Xbio, g/L) and MLVSS concentration (XVSS, g/L) were modeled as follows:
where Y is the heterotrophic biomass yield (g VSS/g COD), bCODf is the feed biodegradable COD concentration (g/L), b is the heterotrophic decay coefficient (g VSS/g VSS-day), and fd is the fraction of decayed biomass remaining as cell debris (g VSS/g VSS). The values for b and fd used to calculate Xbio and XVSS concentrations were 0.12 g VSS/g VSS-day and 0.15 g VSS/g VSS, respectively (Tchobanoglous et al., 2014). Xbio/XVSS ratios of the mixed liquor were estimated using the following equation:
Pseudo first-order biodegradation rate coefficients normalized to biomass (kbio, L/g biomass-day) were estimated by dividing measured kb coefficients by these calculated Xbio/XVSS ratios.
Assuming adequate clarification such that the sorbed effluent EE2 is negligible, EE2 removal was defined as 1−EE2S/EE2f, where EE2S is the soluble EE2 concentration leaving the reactor (ng/L) and EE2f is the total feed EE2 concentration (ng/L). For an SBR, the ratio EE2S/EE2f was obtained from Equation (5) by replacing ET,

HRT is the hydraulic retention time (day), R is the ratio of the sludge recycle flow rate to the influent flow rate, n is the number of staged compartments, and all other variables have been previously defined. Model simulations for a single CSTR (n=1) and four CSTRs in series (n=4) were based on a HRT of 0.92 days and R of 0.8, resulting in the same predicted biomass concentration as the SBR.
Results and Discussion
SBR performance
The SBR BNR processes performed as designed, with a large portion of the influent sCOD removal (average of 94–99%) occurring in the anaerobic or anoxic period and expected levels of EBPR and nitrate removal for the anaerobic/aerobic and anoxic/aerobic SBR systems, respectively. Removal of soluble phosphorus in the anaerobic/aerobic SBRs was greater than for the parallel anoxic/aerobic and aerobic-only SBRs by 16 mg/L for the Durham-seeded reactors and 26 mg/L for the Renton-seeded reactors. Denitrification in the anoxic/aerobic SBRs resulted in an average NO3-N reduction of 48±6 mg N/L with the exception of the Puyallup-seeded Phase III anoxic/aerobic SBR, which produced an average NO3-N reduction of 80±20 mg N/L. Effluent NH3-N concentrations were typically below 0.5 mg N/L except for the Durham-seeded anaerobic/aerobic SBR, which produced an average effluent of 10±2 mg N/L. The amount of ammonia oxidation averaged 7±3 mg N/L. Exceptions were the Durham-seeded anaerobic/aerobic SBR and the Puyallup-seeded Phase III SBRs, which resulted in average ammonia oxidation of 2±2 mg N/L and 15±6 mg N/L, respectively. The SBR performance data are not shown elsewhere.
Estrogen biodegradation in SBR cycle
Biodegradation of EE2 only occurred during the aerobic period, and at a slower rate than the natural estrogens, E1 and E2. A typical time course of EE2, E2, and E1 concentrations measured over time during an SBR cycle is shown in Fig. 1. There was no estrogen removal from abiotic controls, confirming that the estrogen removal was from biological activity (Fig. 1). E1 and E2 kb values were not determined due to the limited number of data points above the LOQ and the production of E1 from oxidation of E2 during the SBR cycle. EE2 was not removed during anaerobic or anoxic periods (e.g., Fig. 1), as observed in other studies (Dytczak et al., 2008; Zhang et al., 2011), and so the following results are based on EE2 biodegradation kinetics that occurred during aerobic periods.

Estrogen degradation at 20°C during a typical SBR cycle in Puyallup-seeded anoxic/aerobic SBR (Phase I) and in autoclaved effluent (control). SBR, sequencing batch reactor.
EE2 biodegradation rate coefficients
Biodegradation rate coefficients (kb) for EE2 are shown in Table 2 for the three reactor sets. In addition, EE2 kb values determined from in situ batch tests [Eq. (2)] and model calibrations [Eq. (5)] are shown over time in Fig. 2 for the Phase II and III Puyallup-seeded SBRs. The aerobic-only SBR kb values for the Puyallup-seeded reactors were consistently higher than the anoxic/aerobic SBR values, and the model calibrated kb values closely matched the batch test values (Fig. 2). After operation at a 7.5-day aerobic SRT for five SRTs, average kb values in the Durham-seeded SBRs determined from in situ batch degradation tests were within the range of kb values observed for the Puyallup-seeded SBRs (Table 2). The Renton-seeded SBRs had the highest kb values among the three sets of EE2 degradation experiments (Table 2). Following operation at a 10-day aerobic SRT for three SRTs, average kb values based on calibrated model results (n=3) were 20.8±0.9, 16.9±1.0, and 16.4±1.2 L/g VSS-day for the aerobic-only, anaerobic/aerobic, and anoxic/aerobic operations, respectively. One in situ batch degradation test also showed relatively high kb values in these SBRs of 14.6, 19.0, and 20.4 L/g VSS-day for the aerobic-only, anaerobic/aerobic, and anoxic/aerobic operations, respectively.
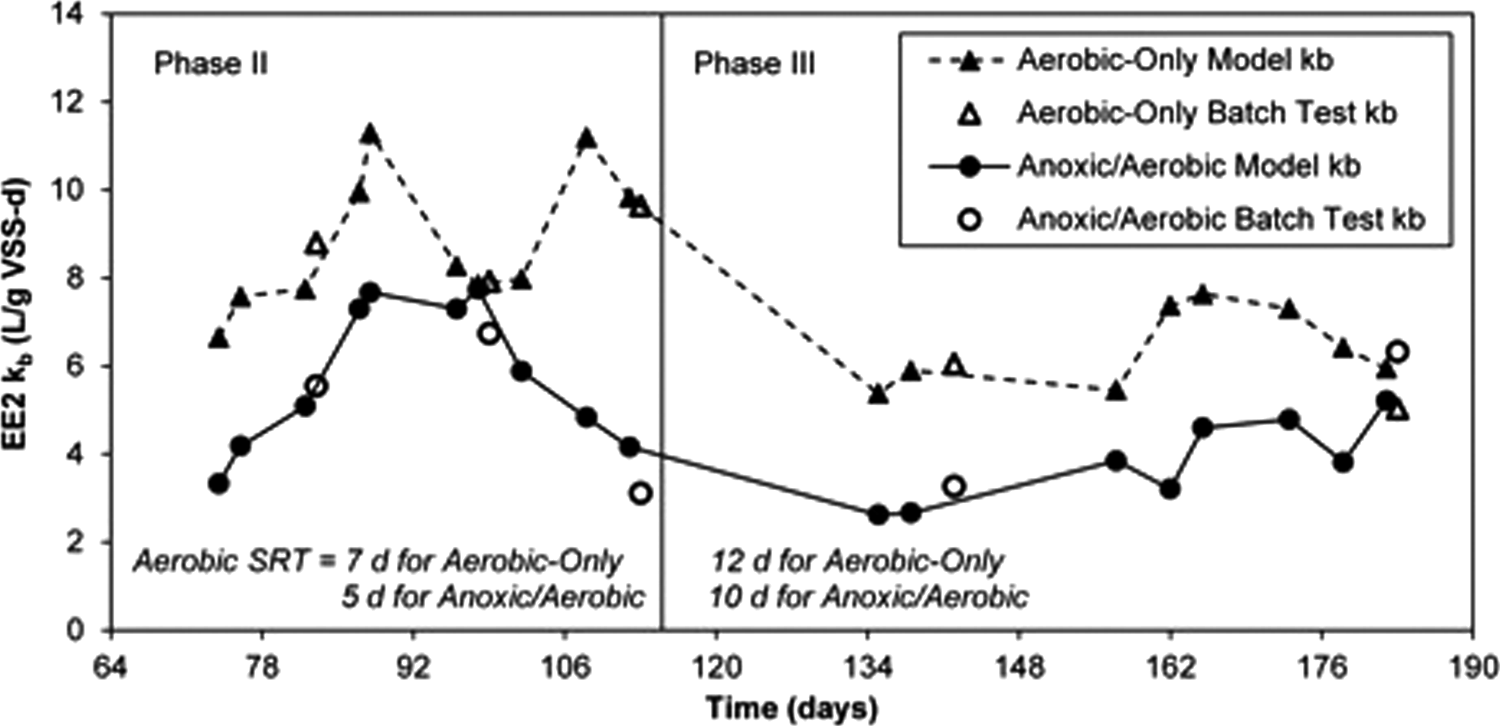
EE2 kb values (20°C) in Puyallup-seeded aerobic-only and anoxic/aerobic SBRs (Phases II and III). EE2 kb values were calculated from in situ batch degradation tests under aerobic conditions (open markers) or from model calibration (solid markers).
EE2 kb values were determined from (1) the decline in total EE2 concentration over the course of the aerobic period as measured during in situ batch degradation tests and (2) calibrating an SBR mass balance model to total feed and end of aerobic period EE2 concentrations.
Different superscripts show statistically significant differences in EE2 kb values between SBRs.
VSS, volatile suspended solids.
Variation in EE2 kb values between SBRs and within a single SBR over time suggests that there is a high degree of uncertainty in this value when predicting process performance. EE2 kb values of 3–22 L/g VSS-day varied by a factor of 7 in this study and were similar to values reported in literature both in magnitude and variation. Reported EE2 kb values vary by a factor of 6 (Table 3), ranging from 2 L/g VSS-day to 8 L/g TSS-day for WWTP AS and reaching 12 L/g VSS-day for laboratory-scale membrane bioreactor AS fed synthetic wastewater. During Phase II of the Puyallup-seeded SBR operation (Fig. 2), EE2 kb values varied by a factor of 2.5 in the anoxic/aerobic SBR, ranging from 3 to 8 L/g VSS-day. In evaluating the potential performance of a system, it is therefore important to assess how variation in EE2 kb values, in combination with various operational conditions, may impact EE2 removals.
kb values calculated from reported first-order degradation rate constant (k), mixed liquor suspended solid concentration (X), and estrogen solid–liquid partitioning coefficient (KP), where kb=k(1+KPX)/X.
Reactor was fed synthetic wastewater.
CAS, conventional activated sludge; A/O, anoxic/aerobic; MBR, membrane bioreactor; A2O, anaerobic/anoxic/aerobic; NA, not available.
Impact of AS process type
The AS process type did not have a consistent impact on EE2 kb. Statistically significant differences in kb values were found only for the Puyallup-seeded SBRs (Table 2), where higher kb values occurred with the aerobic-only process than the anoxic/aerobic process for both Phases II and III (two-tailed Student's t-test, p=0.00005 and 0.0005 for Phases II and III, respectively). Although results from the Puyallup-seeded SBRs suggest growth under aerobic-only conditions favor AS with a higher EE2 kb than anoxic/aerobic conditions, improved kb values with aerobic-only versus anoxic/aerobic operations could not be confirmed with the Renton-seeded SBRs (Table 2). Moreover, the high kb values in the Renton-seeded SBRs, regardless of AS process type, suggest other factors may have a greater impact on kb.
AOBs in these SBRs were unlikely responsible for the observed EE2 degradation kinetics. Based on the amount of nitrate production, a synthesis yield of 0.15 g VSSAOB/g N oxidized, an endogenous decay rate of 0.17 g VSS/g VSS-day (Tchobanoglous et al., 2014), the estimated AOB concentration in the SBR mixed liquor in this study ranged from 0 to 9 mg/L, representing a maximum of 1% of the MLVSS concentration. Our observed kb values did not correlate with the estimated AOB fraction of the biomass (all data not shown). For example, the Durham-seeded anaerobic/aerobic SBR with minor nitrification of 2 mg/L NH3-N had an average EE2 kb of 5.7 L/g VSS-day, which was not statistically different from the average kb of 4.3 L/g VSS-day for the nitrifying Durham-seeded anoxic/aerobic SBR with 11 mg/L of NH3-N oxidized. Based on no measurable effect of nitrification and the background introduction information, heterotrophic bacteria were primarily responsible for the estrogen biodegradation observed in this study. Further studies are needed to address the identity and growth substrate of heterotrophic estrogen-degrading populations.
EE2 solid–liquid partitioning
EE2 KP values of 440, 360, and 290 L/kg VSS were used in determining EE2 kb values for aerobic-only, anaerobic/aerobic, and anoxic/aerobic SBR mixed liquors, respectively, but kb coefficients were relatively insensitive to KP. These KP values were based on average apparent values of 436±211 (n=9), 358±34 (n=4), and 289±100 (n=13) L/kg VSS for aerobic-only, anaerobic/aerobic, and anoxic/aerobic SBR mixed liquors, respectively. Using these Kp values to calculate kb coefficients from in situ estrogen degradation tests [Eq. (2)], 17–35% of the total EE2 concentration in the system was sorbed for MLVSS concentrations ranging from 706 to 1,233 mg/L. Sensitivity of kb coefficients to Kp values was such that a 20% difference in Kp values resulted in an ∼3–7% difference in calculated kb coefficients. Average apparent Kp values normalized to TSS were 391, 240, and 254 L/kg TSS for the aerobic-only, anaerobic/aerobic, and anoxic/aerobic-mixed liquors, respectively, and were within the range of values reported in literature of 210–690 L/kg TSS (Clara et al., 2004; Andersen et al., 2005; Xu et al., 2008; Estrada-Arriaga and Mijaylova, 2010; Gomes et al., 2011).
Modeled EE2 removals in SBR and continuous-flow CSTRs
EE2 removals were modeled for aerobic SBR and continuous-flow CSTR systems to determine how variability in biodegradation rate coefficients, feed bCODf concentration, and SRT can affect EE2 removal performance. The range of SRTs used for the simulations is wider than used in our experimental reactors. It is not certain if the observed range of kinetic coefficient values are applicable over this wider SRT range as these values may change with operating conditions, but the simulations help to illustrate possible effects of SRT and the results should be useful to guide further investigations. Model simulations were done using an influent wastewater bCODf concentration of 400 mg/L, which was close to that used in the experimental reactors. Model simulations were also done at a lower feed bCODf of 200 mg/L to show the effect of having less biomass growth for EE2 degradation at a given SRT. For discussion purposes, a 90% removal was selected as an arbitrary treatment goal (effluent EE2 concentration of 0.5 ng/L for the median influent EE2 concentration reported in the literature) to illustrate conditions needed to reduce EE2 to low levels that may lead to no effect concentrations in surface waters depending on the receiving water dilution factor.
Biodegradation kinetics were based on the active biomass concentration instead of MLVSS to account for changes in the fraction of active biomass with SRT. The biomass yields (Y) obtained by fitting the model to average XVSS concentrations observed for the aerobic-only, anaerobic/aerobic, and anoxic/aerobic SBRs were 0.43±0.11, 0.52±0.02, and 0.42±0.04 g VSS/g COD, respectively. A Y of 0.43 g VSS/g COD was therefore used for the model simulations. The EE2 biodegradation kb values were adjusted to provide the pseudo first-order biodegradation rate coefficients normalized to biomass (kbio) instead of VSS. Estimated Xbio/XVSS ratios of the SBR-mixed liquors [Eq. (8)] were from 0.81 to 0.87 for SRTs from 8 to 13 days. Applying these Xbio/XVSS ratios to observed kb values resulted in kbio values of 3–27 L/g biomass-day. All predicted EE2 removals were based on a KP of 0.44 L/g VSS, as measured in this study.
The model simulation results in Fig. 3a–c show how kbio and aerobic SRT values affect the EE2 removal efficiency. The predicted EE2 removal efficiency was highly sensitive to kbio values, especially for variations in kbio between 3 and 10 L/g biomass-day, as observed with long-term operation of the Puyallup-seeded SBRs. For example, at a 10-day aerobic SRT and feed bCODf of 400 mg/L (Fig. 3a), the predicted EE2 removal efficiency ranged from 72% to 93% for kbio values ranging from 3 to 10 L/g biomass-day. Variations in kbio values between 15 and 27 L/g biomass-day, as was observed with the Renton-seeded SBR operations, were predicted to have less of an impact on EE2 removal efficiency with the system maintaining relatively high removals greater than 90%. Predicted EE2 removal efficiencies were less sensitive to kbio values at longer SRTs. For kbio values of 3–27 L/g biomass-day, predicted EE2 removal efficiencies ranged from 64% to 98% at a 5-day aerobic SRT (Fig. 3b), while only ranging from 76% to over 99% at a 20-day aerobic SRT (Fig. 3c).
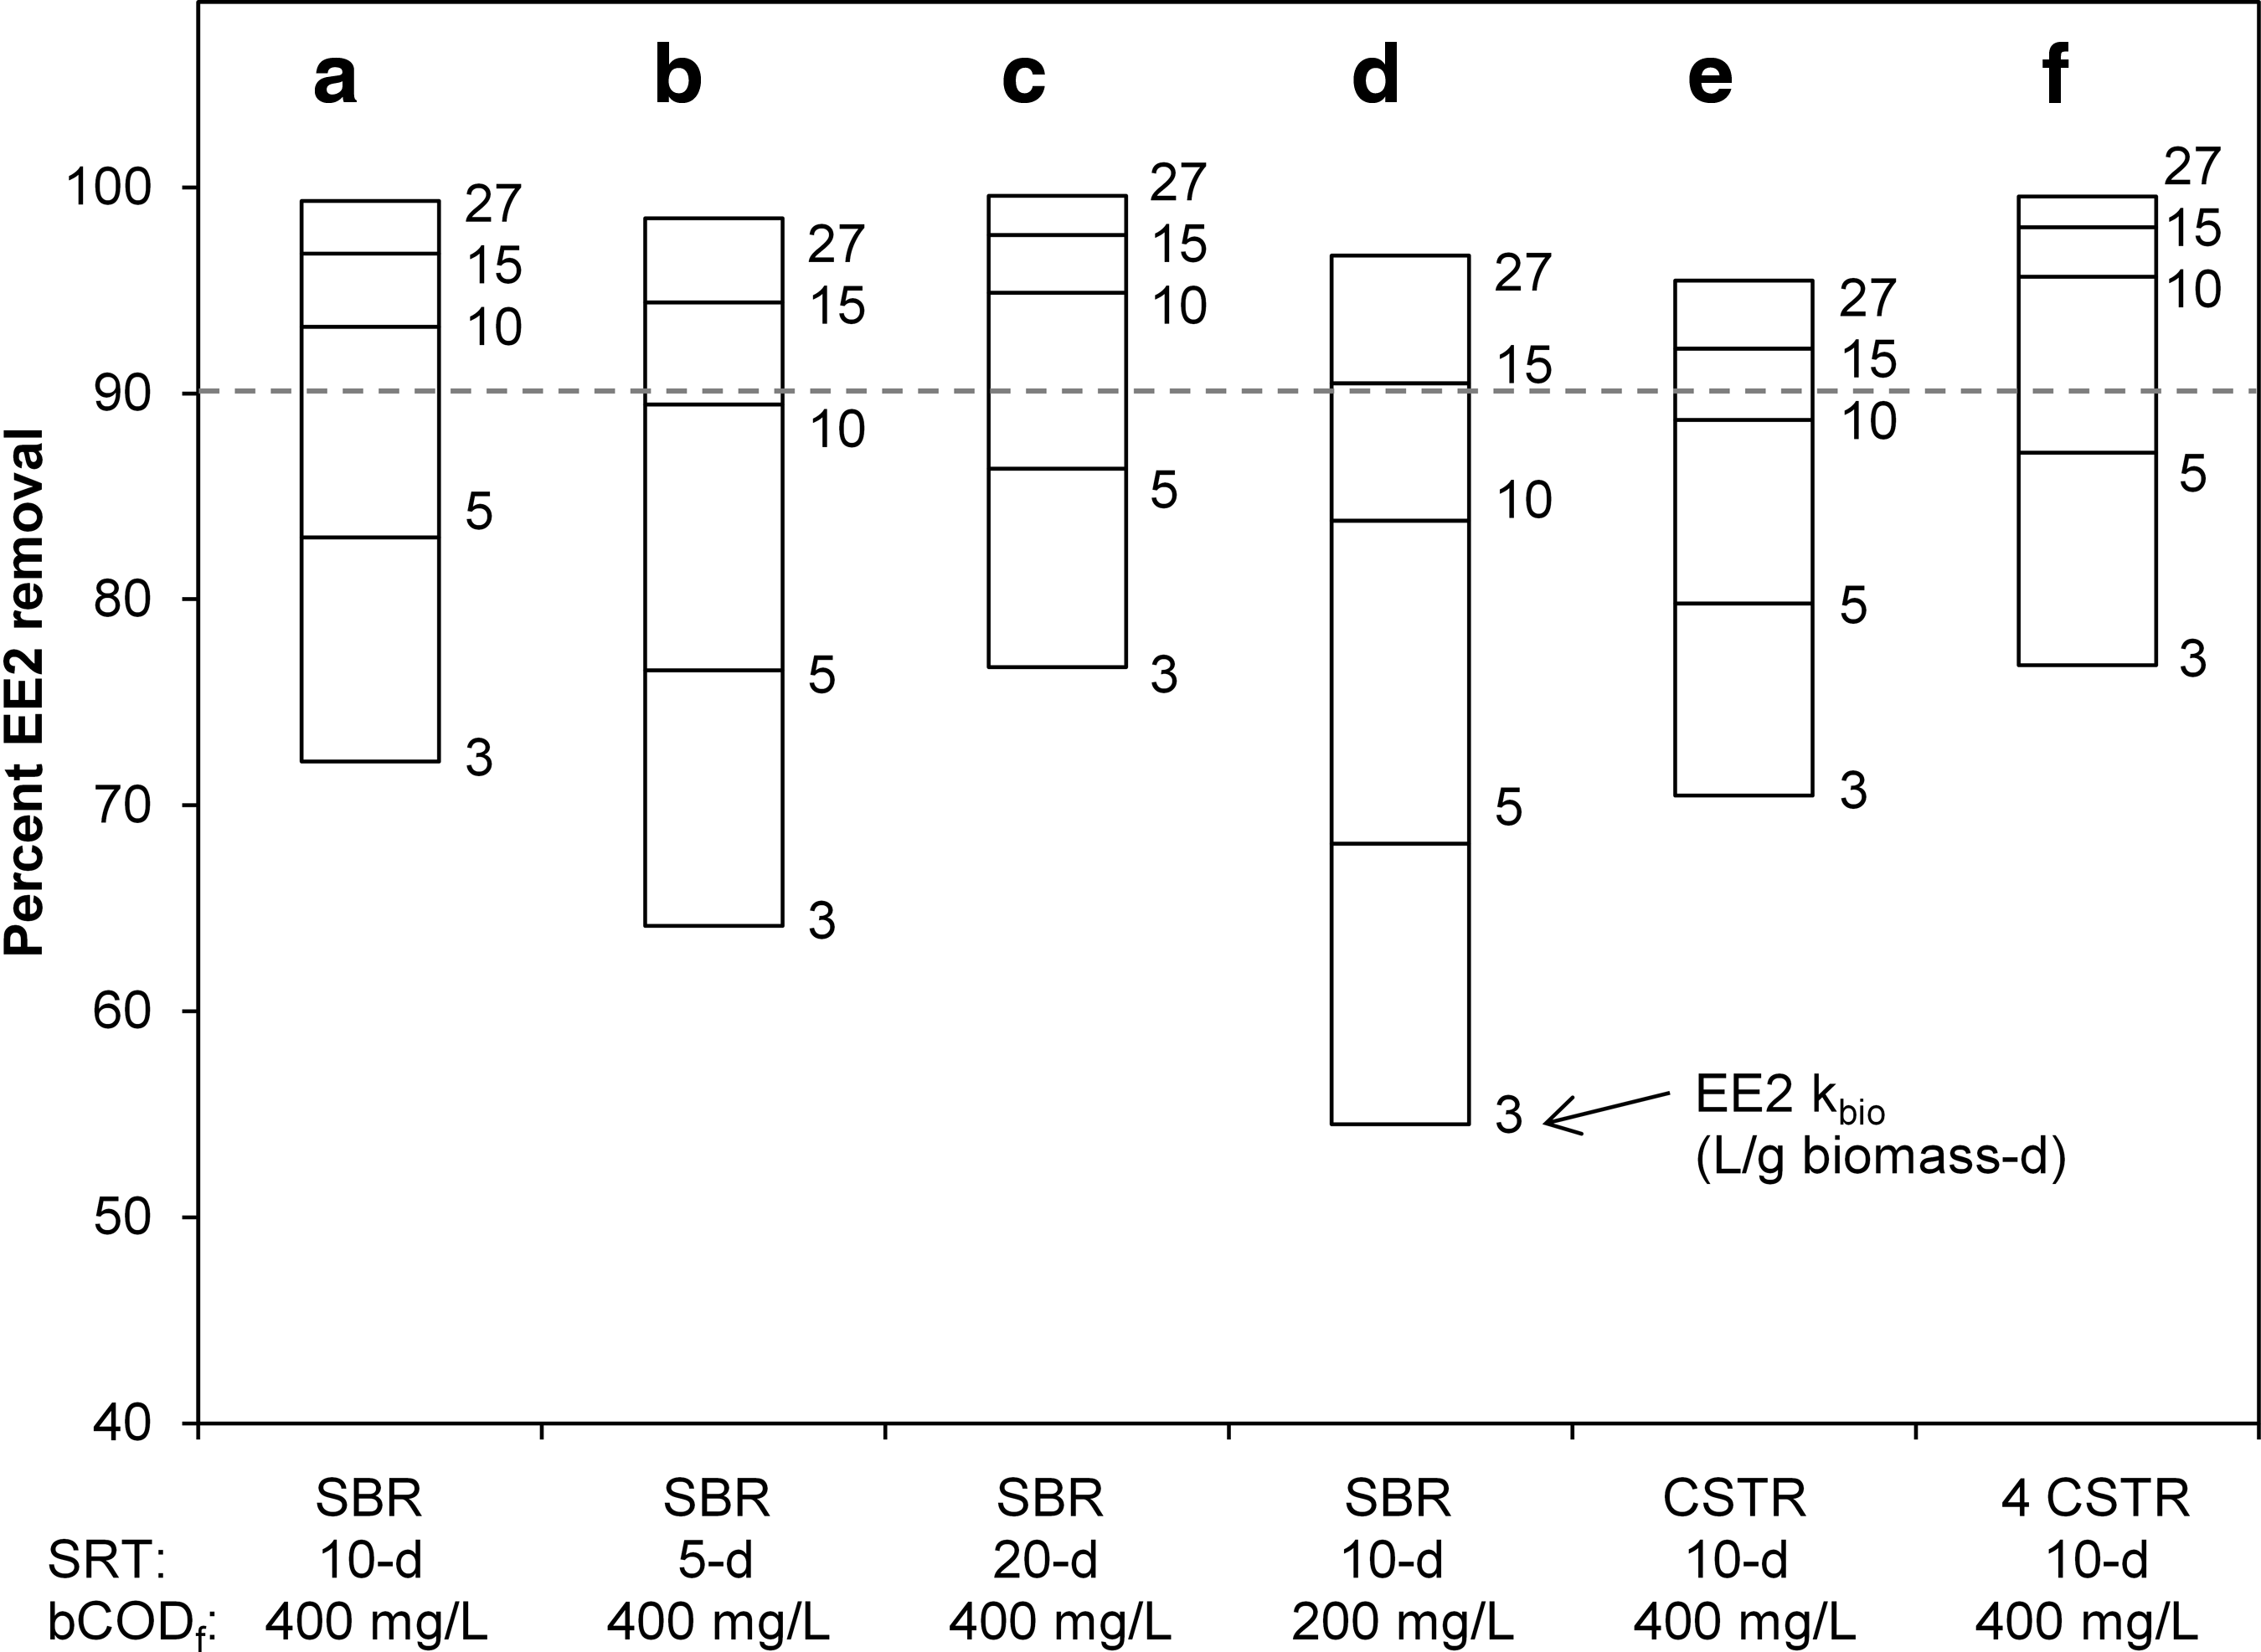
Predicted percent EE2 removal for kbio values estimated in this study of 3–27 L/g biomass-day. Model simulations for (a) SBR with feed bCODf of 400 mg/L and 10-day aerobic SRT and for following changes to Case (a) operating conditions, (b) decrease in aerobic SRT to 5 days, (c) increase in aerobic SRT to 20 days, (d) lower feed bCODf of 200 mg/L, and different reactor configurations of (e) CSTR and (f) four CSTRs in series. bCODf, feed biodegradable chemical oxygen demand; SRT, solid retention time; CSTR, completely stirred tank reactor.
As shown in the model simulation results in Fig. 3a–c, longer aerobic SRTs enable a system to achieve a given EE2 removal efficiency with lower kbio values. For example, to achieve 90% EE2 removal at a bCODf of 400 mg/L, the model predicted kbio values of 10.4, 7.7, and 6.4 L/g biomass-day were required for aerobic SRTs of 5, 10, and 20 days, respectively. Therefore, by increasing the aerobic SRT from 5 to 20 days, the percentage of kbio values resulting in EE2 removals of 90% or greater increased from 22% to 60%. It should be noted that 90% removals could not be obtained with all of the kbio values from this study solely by increasing the aerobic SRT. Although longer aerobic SRTs provide greater contact time between the biomass and estrogen, longer SRTs also reduce the observed biomass yield. As the aerobic SRT was increased further (simulation results not shown), a threshold kbio value of 5.9 L/g biomass-day was reached, below which 90% removals could no longer be obtained, indicating that a minimum kbio value is needed for a system to achieve a given percentage removal efficiency.
The importance of the influent wastewater bCODf concentration and less heterotrophic bacteria growth on the EE2 removal performance is illustrated by comparing Fig. 3a and d. For a lower bCODf concentration of 200 mg/L (Fig. 3d), a much higher kbio value is needed for the same removal efficiency as for a bCODf concentration of 400 mg/L (Fig. 3a) for the same SRT. The model predicted that a kbio value of 7.7 L/g biomass-day is needed to obtain 90% EE2 removal in an SBR with a bCODf of 400 mg/L at a 10-day aerobic SRT, but at half the bCODf concentration, the required kbio value is increased by almost a factor of 2 to 14.5 L/g biomass-day. In addition to the effect of SRT and kbio, differences in influent bCODf concentrations that can support EE2 degrading biomass may also be important in explaining the wide variations in reported EE2 removal efficiencies for municipal WWTPs as noted in the introduction.
The importance of reactor configuration is illustrated by comparing Fig. 3a, e, and f. As expected from fundamental reactor kinetics, the SBR and four-stage CSTR system are more efficient than a single CSTR and thus can meet a given EE2 removal efficiency with lower kbio values for the same SRT. For example, the predicted kbio values needed to obtain 90% EE2 removal at a 10-day aerobic SRT were 11.5, 7.7, and 6.0 L/g biomass-day for the single CSTR, SBR, and four CSTRs in series configurations, respectively. Thus, at this SRT, 90% or greater removals were predicted with 18%, 47%, and 62% of the kbio values observed in this study for single CSTR, SBR, and four CSTRs in series configurations, respectively. Even though the SBR provides for plug flow kinetics after feeding and would be expected to have the highest removal efficiency, it had a lower treatment efficiency than the four CSTRs in series due to the sludge recycle ratio, R, selected for each configuration (R=0.8 for staged CSTR and R=3 for SBR) to be representative of values used in practice.
Model results shown in Fig. 3 indicate that EE2 removals are highly sensitive to biodegradation rate coefficients and highlight the importance of understanding the factors governing these values. Research is needed to address how operational factors, such as wastewater characteristics, SRT, and substrate loading conditions, affect kb values and the mechanisms behind their impact, either by promoting growth of EE2-degrading biomass and/or altering their biodegradation kinetics.
Summary
A pseudo first-order model was successfully applied to measure EE2 biodegradation kinetics in laboratory-scale SBRs operating under aerobic-only, anaerobic/aerobic, and anoxic/aerobic conditions. Biodegradation occurred only under aerobic conditions. Observed pseudo first-order EE2 biodegradation rate (kb) coefficients normalized to MLVSS ranged from 3 to 22 L/g VSS-day at 20°C. Aerobic-only AS processes may promote higher kb values than anoxic/aerobic AS processes, but high kb values can be obtained with all BNR process types. For the observed range of kb values, model simulations indicate that EE2 removal efficiencies are expected to range from 55% to 98% for low feed bCOD concentrations (200 mg/L) or short aerobic SRTs (5 days); predicted EE2 removal efficiencies improve with higher feed bCOD concentrations (400 mg/L), longer aerobic SRTs (20 days), and staging of aerobic reactors (n=4), ranging from 76% to over 99%.
Footnotes
Acknowledgments
This research was supported by graduate student fellowships awarded by the King County Department of Natural Resources and Parks, Wastewater Treatment Division, and by the NSF grant CBET-1067744. This article has not been formally reviewed by King County or NSF. The views expressed in this document are solely those of the authors.
Author Disclosure Statement
No competing financial interests exist.