
Abstract
Abstract
Safe reuse of wastewater requires high levels of pathogen inactivation. Ozone is a very effective disinfectant for viruses and has distinct benefits over other forms of disinfectants, in that it increases the clarity of water and can oxidize some chemical contaminants in water. However, because of the combination of high ozone demand of most wastewaters and rapid reaction with viruses, determination of ozone dose in wastewater and recycled water treatment is not well defined. While various surrogates are used as indicator organisms for human pathogenic viruses in water reuse practice, much less is known about the relationship between surrogates and human pathogenic viruses for ozone disinfection in wastewater. In this study, the ozone inactivation dose response of several surrogates (Escherichia coli, coliphage T1, T4, PRD-1, ΦX174, and MS2) and human pathogenic viruses (poliovirus 1, echovirus 11, coxsackievirus B5, and adenovirus 2) were compared for the first time in secondary effluent wastewater. A unique reduction equivalent dose method was proposed to compare the inactivation of the microorganisms studied across waters with varying ozone demand. Inactivation of all viruses and surrogates studied was greater than 4 log at ozone Ct levels of less than 1 (mg/L)-min. E. coli and PRD-1 were identified as conservative surrogates for indicating inactivation of human pathogenic viruses in ozone disinfection of wastewater, providing a tool for practitioners and regulators to confidently accept ozonation systems for virus inactivation in wastewater reuse.
Introduction
O
Inactivation of pathogenic viruses by ozone
The USEPA first reported ozone Ct (concentration×time) values for disinfection of viruses in 1991 (USEPA, 1991) and subsequently rereported these values in 2002 and 2003 manuals (USEPA, 2002, 2003). These values were originally published by Roy et al. (1982) and Vaughn et al. (1987) and indicate that the required Ct decreases at higher temperatures and pH does not affect ozone performance within the range of most natural waters. Under the worst-case conditions of cold temperature (<1°C), 4-log inactivation of viruses requires a Ct value of 1.8 (mg/L)-min, whereas for a temperature of 25°C, a Ct of 0.3 (mg/L)-min is required. While these reports cite Ct values generalized for all viruses, the literature for inactivation of specific viruses indicates more variability in Ct values. Ideally, the Ct value should be an integration of concentration (ozone residual) over time to estimate an accurate Ct value. However, in most literature, the Ct values are typically noted as the initial concentration multiplied by exposure time or as average concentration multiplied by time.
Literature values for ozone dose responses of various viruses and surrogates in laboratory or drinking water quality matrices (Table 1) show that virus inactivation was typically rapid. High inactivation is achieved at relatively short contact times and relatively low applied doses.
Less is known about the dose response of viruses and surrogates in wastewater matrices, partly because varying ozone demand across different wastewater qualities makes dose calculations challenging. The USEPA Wastewater Disinfection Manual (1986) recommends an absorbed (transferred) ozone dose of 15–20 mg/L to achieve 2.2 total coliforms/100 mL in a filtered nitrified effluent and a dose of 3–5 mg/L to achieve 200 CFU/100 mL of fecal coliforms. Of the five ozone disinfection wastewater plants built since 1985, the designed target transferred doses range between 4 and 8 mg/L (Oneby et al., 2010). Gehr and Nicell (1996) reported 98% reduction of fecal coliform with applied ozone doses of 17–20 mg/L. The calculated Ct value required to achieve 4-log reduction was 2.9 (mg/L)-min. Xu et al. (2002) suggested that the transferred ozone dose is the critical parameter in ozonation of wastewater compared with the Ct values for natural waters. Burns et al. (2007) reported on ozone doses required for virus inactivation in wastewater, where an applied ozone dose of 3, 5, and 8 mg/L resulted in an ozone concentration after 30 s of <0.1, 0.6, and 2.5 mg/L, respectively. They concluded that a 5 mg/L transferred ozone dose (equivalent to a Ct=0.5 (mg/L)-min) was capable of achieving a 6-log virus inactivation credit.
Ishida et al. (2008) reported that a transferred ozone dose of 3–5 mg/L was sufficient to achieve 6.5-log inactivation of coliphage MS2 with contact times above 10 s in microfiltered effluent. In media-filtered effluent, a transferred ozone dose of greater than 7 mg/L with a contact time over 10 s was required to achieve the same level of inactivation.
Overall, in clean water, both indicator bacteria and bacteriophages are inactivated quickly with low Ct levels, generally well below 0.5 (mg/L)-min (for cell-associated viruses, below 1.5 (mg/L)-min). Although there are only a few studies performed in wastewater, the inactivation in wastewater was typically reported as less efficient due to competition from organics for disinfecting oxidants. In addition, the wastewater studies did not have clearly defined Ct calculations, so a precise comparative evaluation was not possible. Therefore, this research not only focused on defining the ozone dose response of the microorganisms but also addressed the complexities of defining the ozone dose under varying ozone demand water matrices in this study and provides a method that can be used to allow better comparison between studies in high ozone demand waters.
Materials and Methods
Ozone generation and measurement of ozone residuals
Ozone was produced by an ozone generator, either a Wedeco GSO30, an Orec 03V5-0, or an Ozone Solutions TG-40. In all cases, ozone was bubbled through an ultrafine glass frit into a continuously mixed, water-jacketed glass reactor filled with 2 L of laboratory-grade ultrapure (DI) water, which was cooled to 4°C. Ozone was bubbled into the reactor for at least 30 min before the concentration of the solution was determined. Ozone concentration was determined by measuring absorbance at 258 nm in a 1-cm quartz cuvette. Laboratory-grade ultrapure water was used as a zero control. A 4:1 dilution of the ozone stock was required to keep the solution within the range of the UV absorbance instrument (Hach DR5000). Ozone concentration was calculated using the Beer–Lambert law, taking the average of the three replicate samples.
Preparation of ozone demand-free glassware and solutions
Ozone demand-free (ODF) water was used to make phosphate-buffered saline (PBS) solution and sodium thiosulfate (STS). To prepare ODF water, ozone gas was bubbled directly into 2,000 mL of ultrapure laboratory-grade water for 30 min while stirring. The solution was allowed to sit for 3 days or a full day after the absence of ozone was confirmed. ODF glassware was made by soaking glassware in >15 mg/L of ozone solution over 3 h (often overnight), then rinsing thoroughly with ODF water, and drying in a 100°C furnace.
Wastewater source and characteristics
Secondary effluent from Melbourne Water's Eastern Treatment Plant (ETP) in Melbourne, Australia, was filtered by ultrafiltration membranes to minimize biological activity, then shipped frozen to the laboratories in the US. Before use, water was thawed at 4°C and filtered through Whatman GF/F 0.7-μm glass fiber filters (previously baked at 450°C for 3 h) to remove any particles formed during storage.
The water quality characteristics of the ETP wastewater were measured and are summarized in Table 2. All wastewater disinfection experiments were conducted at the natural pH of 7.96 and at 16°C, which was the minimum temperature observed in the ETP effluent. All methods conformed to those in Standard Methods (American Public Health Association, 2012).
Batch disinfection procedure
The target microbe stock was spiked into a completely mixed, sterile glass vessel containing a relatively large volume (100–300 mL) of PBS or wastewater. Glass batch reactors (5–20 mL) held in a constant temperature water bath were filled from this microbe stock solution using a sterile 10-mL pipette just before ozone dosing.
The standard batch solution ozone test (SOT) method was used to apply the ozone dose to the batch reactor (Hoigne, 1994; Hoigne and Bader, 1994). Ozone from the concentrated stock was pipetted into the batch reactor. Sample dilution was minimized by using a high concentration (70–80 ppm) ozone stock solution. Dilution factors for wastewater and clean water disinfection studies are illustrated in Supplementary Figures S1 and S2 in the Supplementary Data.
Sampling for ozone residual and microbiological assays was performed in the same manner, where the sample was extracted at regular intervals from the batch reactor beginning 4 s before the desired time point and inserted into the ozone quenching solution at the desired time point and vortexed immediately. Indigo dye (in three variations described below) was used for measuring the ozone residual, and 0.03% STS was used in an equal volume to the ozonated sample as a quenching agent for microbiological samples. The first time point and subsequent sampling intervals were 10 s from the start of ozone dosing.
Measurement of ozone residual
Ozone residual concentrations were measured using the Indigo Colorimetric method (Bader and Hoigné, 1981; American Public Health Association, 2012). Indigo solutions I, II, and modified II were used for ozone concentrations in the range of 0.01–0.1, 0.05–0.5, and higher than 0.3 mg/L, respectively.
Calculating ozone dose
Two different approaches were used for calculating the ozone dose: discrete summation Ct (Hunt and Mariñas, 1999) and extended T10 Ct (USEPA, 2003). These methods are described in detail in the Supplementary Data. While both the discrete summation and extended T10 Ct calculation methods were used in this study, the two methods can yield quite different results due to the difference in how they address the applied ozone dose and initial ozone demand. The choice of Ct calculation influences interpretation of the results with respect to the relative resistance of the viruses and surrogates. This issue, including a recommendation for the most appropriate method, is discussed in the following sections.
Microbiological methods
Propagation and enumeration of bacteriophages
The procedures for propagation and enumeration of phages used in this study were similar, except for utilizing a different host for a different phage. The phage/host pairs were MS2/Escherichia coli C3000, T1 and T4/E. coli B, ΦX174/E. coli CN13, and PRD-1/Salmonella typhimurium LT2. First, phages were grown and enumerated in their appropriate hosts by the double agar layer technique (Adams, 1959; USEPA, 2001). To make stocks, the top agar layer exhibiting confluent lysis of the host cells was harvested by scraping into a small amount of PBS, and phages were extracted by homogenizing in an equal volume of chloroform. The supernatant was recovered following low-speed (4,000 g) centrifugation for 30 min at 4°C.
Propagation and enumeration of E. coli
The procedures for the propagation and enumeration of E. coli, CN13 and Famp, were identical. For propagation, a loopful of E. coli was inoculated into 50 mL of tryptic soy broth and incubated at 37°C overnight until the optical density was around 0.80 absorbance units at 600 nm in a 1-cm cuvette, which corresponds to the late log growth phase and ∼109 CFU/mL. The overnight culture was centrifuged for 15 min and then washed with PBS thrice to make clean E. coli stocks. Spread plating was used to enumerate E. coli. All enumeration was performed in triplicate.
Propagation and assays for coxsackievirus, poliovirus, and echovirus
Echovirus 11 (EV11; ATCC VR-31) and coxsackievirus B5 (CVB5; Faulkner, ATCC VR-185) were obtained from the American Type Culture Collection (Manassas, VA). Poliovirus 1 (PV1; strain LSc-2ab) was obtained from Dr. Mark Sobsey at the University of North Carolina, Chapel Hill. Viruses were maintained on BGM (Buffalo Green Monkey Kidney) cell line monolayers with minimum essential medium containing 5% calf serum (CS; HyClone Laboratories, Logan, UT) at an incubation temperature of 37°C with 5% CO2. These viruses were propagated by inoculating stock viruses into cell monolayers that were ∼90% confluent. Following the observation of ≥90% destruction of the monolayer, the cell culture flasks were frozen (at −80°C) and thawed (at 37°C) three successive times to release the viruses from the host cells. Cell lysate was mixed with an equal volume of chloroform, vortexed vigorously for 1 min, and then centrifuged at 2,500 g for 15 min at 4°C. The top aqueous layer containing the virus was carefully removed using a pipette and the purified viruses were stored at −80°C until use.
Viral titrations for PV1, EV-11, and CVB5 were performed using 10-fold serial dilution plaque-forming assays described by Bidawid et al. (2003). Following incubation, the agar overlays were removed and the cell monolayers were stained with 0.5% crystal violet (Sigma-Aldrich, St. Louis, MO) dissolved in ultrapure water and mixed 1:1 with 95% ethanol. The plaques (clearings in the cell monolayer) were counted to enumerate infectious viruses.
Propagation and assay for adenovirus
Adenovirus 2 (Ad2, ATCC VR-846) was obtained from the American Type Culture Collection (Manassas, VA) and maintained on the A549 cell line. The propagation of adenovirus was similar to enteroviruses described above, except a different cell line (A549) was used. Adenovirus was assayed by the 50% tissue culture infectious dose (TCID50) method on confluent layers of A549 cells grown in 24-well tissue culture plates. Briefly, serial dilutions of the sample were performed in PBS, and 100 μL of each dilution was added to each well for a total of four wells per dilution. During infection, sample inocula were incubated with the cell monolayers for 1 h at 37°C and 5% CO2, carefully shaking the plates horizontally every 15 min to ensure even distribution of the inoculum. After 1 h of infection, maintenance media were added to the cell monolayers. Maintenance media consisted of complete F12K minimal media with 2% heat-inactivated fetal bovine serum. The infectivity of Ad2 was determined by observing the cytopathic effect on the confluent A549 cells over 14 days following inoculation of disinfected samples and controls.
Results and Discussion
Ozone inactivation of virus surrogates in PBS
As mentioned in the Materials and Methods section, several bacteriophages were chosen as potential virus surrogates, including MS2, T1, T4, PRD-1, and ΦX174, along with two strains of E. coli: CN13 and F amp. These surrogates were tested in a matrix of six different conditions over two temperatures and three pH values. Figure 1 illustrates the results of those disinfection experiments performed in PBS at pH 7.96 and 16°C.

Ozone apparent dose–response curves for phages in clean water based on discrete summation Ct. Shadowed data points indicate the maximum log inactivation, which is a function of the starting concentration. T1, T4, and MS2 solution ozone tests (SOTs) conducted at applied ozone doses of 0.10–0.39 mg/L and contact times of 10, 20, and 30 s. PRD-1 and Escherichia coli SOTs conducted at applied doses of 0.10–0.44 mg/L and contact times of 10, 130, 250, and 370 s. ΦX174 SOTs conducted at applied doses of 2.0–3.2 mg/L and contact times of 20 and 140 s.
As can be seen in Figure 1, the majority of the data are clustered in the top left, indicating high inactivation at low ozone doses. MS2 phage was less resistant than literature values (Finch and Fairbairn, 1991; Shin and Sobsey, 2003; Tanner et al., 2004; Ishida et al., 2008). E. coli and most bacteriophages showed similar resistance, while PRD-1 and ΦX174 were slightly more resistant than the other surrogates at low Ct values. Nonetheless, the required ozone Ct for high levels of surrogate inactivation was well below 1 (mg/L)-min. Neither temperature in the 16–23°C range nor pH in the range 6–8 significantly affected ozone disinfection (data not shown) at these low Ct values, which is consistent with the findings in previous studies (USEPA, 1991).
Ozone inactivation of pathogenic viruses in laboratory water
Figure 2 shows the inactivation of pathogenic viruses by ozone in PBS. As can be seen in Figure 2, Ad2 appears to be the most resistant virus to ozone regardless of the method to calculate the Ct value. Regardless of virus type or Ct calculation methods, the required ozone Ct value for high levels (3–4 log and greater) of virus inactivation was well below 1 (mg/L)-min.
Ozone disinfection dose–response curves for selected viruses in laboratory buffered water at two temperatures based on discrete summation Ct (top plot) and extended T10 Ct (bottom plot). SOTs conducted at an applied dose range of 0.10–0.60 mg/L and a contact time range of 10–370 s.
Ozone inactivation of surrogates and pathogenic viruses in wastewater
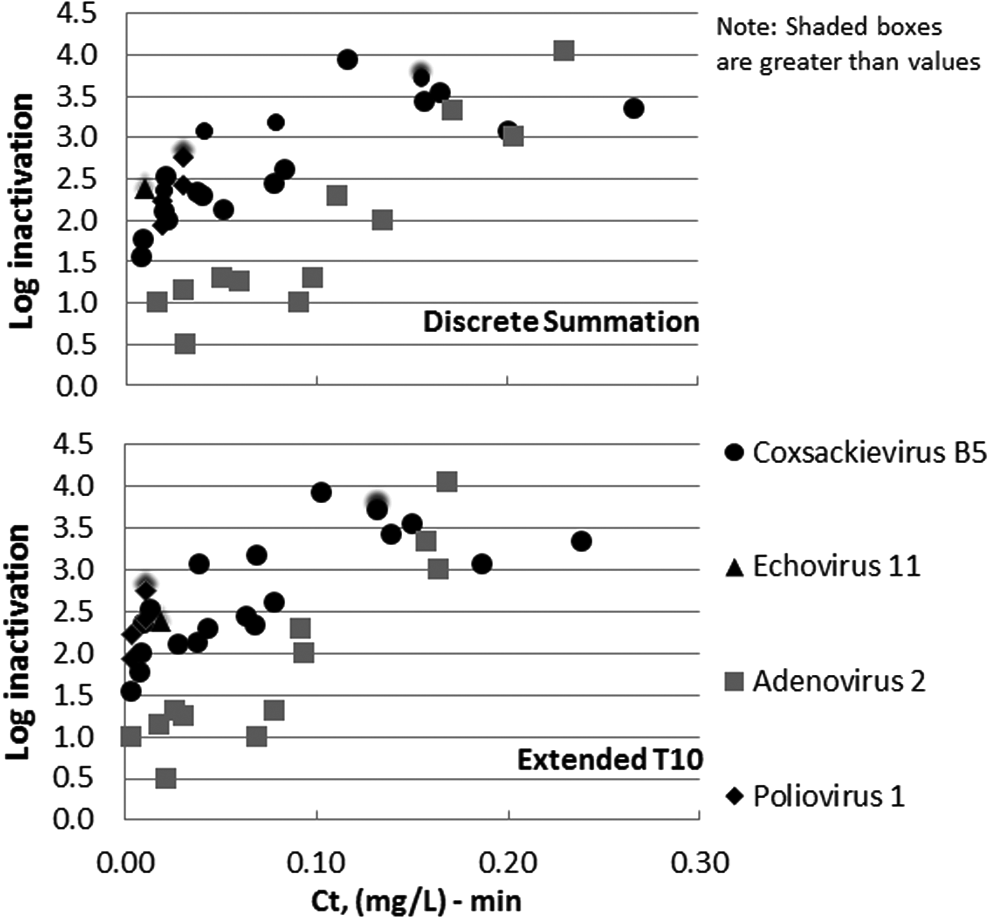
For evaluation of the dose response in ETP wastewater, relatively resistant surrogates (PRD1, ΦX174, F amp E. coli Famp, and E. coli CN13) and viruses (PV1, Ad2, and CVB5) were selected. The ozone dose response of the surrogates and viruses using both the discrete summation Ct calculation method and the extended T10 Ct method are shown in Figures 3 and 4, respectively.

Ozone dose–response curves for surrogates in Eastern Treatment Plant (ETP) wastewater effluent based on (top) discrete summation Ct and (bottom) extended T10 Ct. Wastewater effluent SOTs conducted at 16°C and a pH of 7.96 with applied doses from 1.6 to 21 mg/L and contact times of 30 and 60 s.
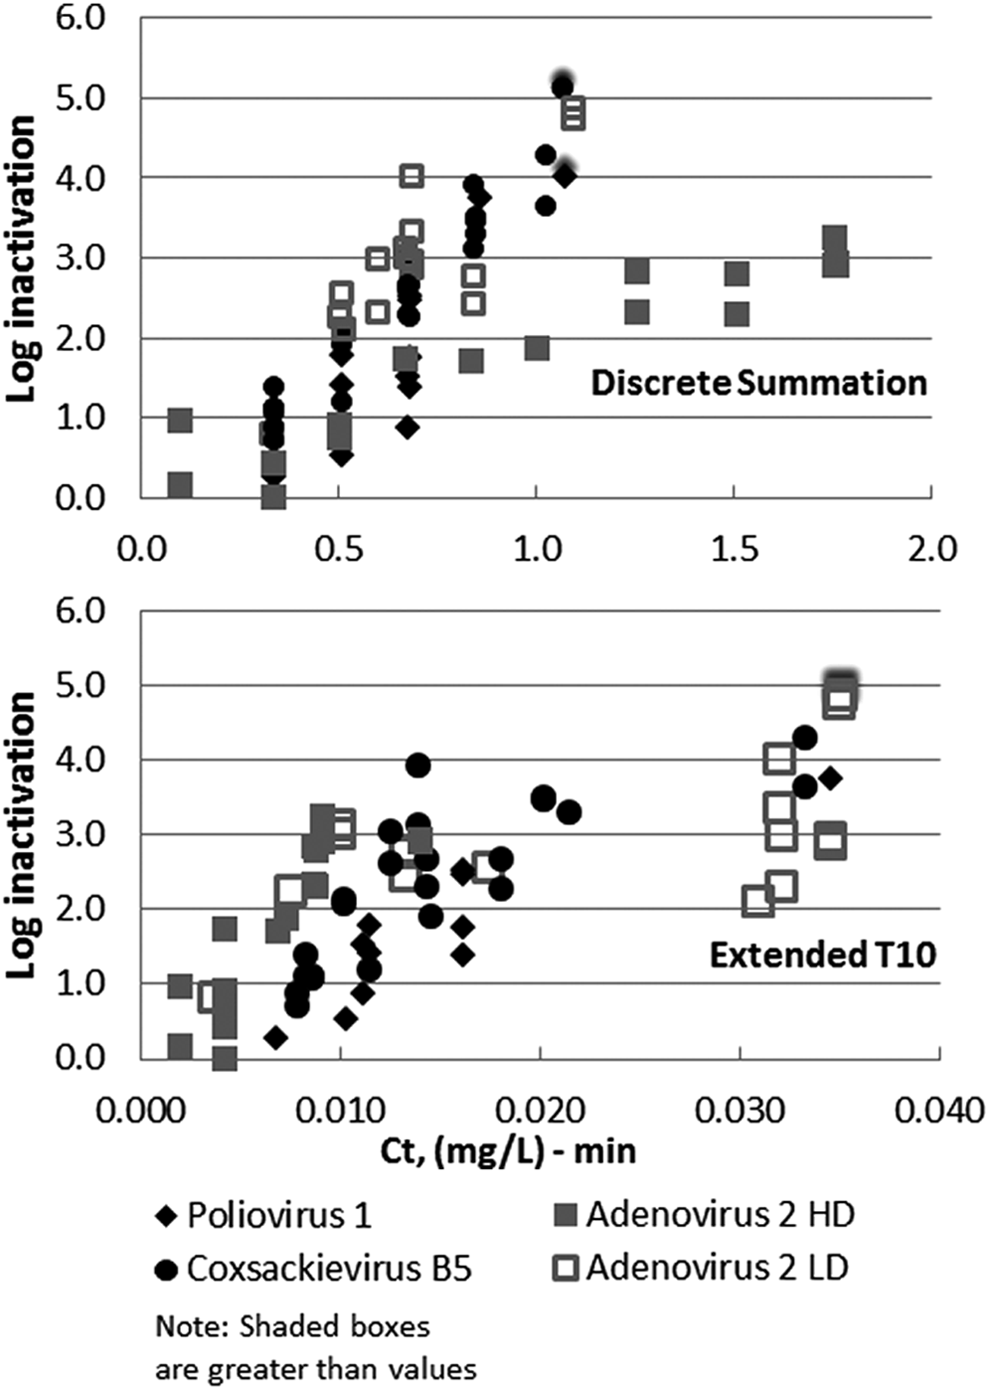
Ozone dose–response curves of viruses in ETP wastewater effluent based on (top) discrete summation Ct and (bottom) extended T10 Ct method. HD and LD refer to high-demand and low-demand stocks. Wastewater effluent SOTs were conducted at 16°C and a pH of 7.96. Poliovirus, coxsackievirus, and low-demand adenovirus SOTs were conducted with applied doses from 4.0 to 12.0 mg/L and a contact time of 30 s. High-demand adenovirus SOTs were conducted with applied doses from 1.2 to 21 mg/L and contact times of 30 and 60 s. Note X-axis scales differ due to the calculation method.
Figure 3 shows that bacteriophages appear to be more resistant to ozone than E. coli in wastewater based on the discrete summation method. However, the difference was not so significant in the extended T10 method. This is probably because of the higher ozone demand of the bacteriophage stock compared with the relatively low demand from the E. coli stock. Tanner et al. (2004) studied both E. coli and MS2 phage under the same experimental protocols and found E. coli to be more resistant to ozone than MS2.
As can be seen in Figure 4, adenovirus appeared to be the most resistant among the viruses tested, which is similar to the results for PBS and is supported when comparing other studies in the literature (see Table 1). Due to the high ozone demand of the adenovirus stock solution compared with the other viruses tested, a higher purity adenovirus stock was obtained (courtesy of Clancy Environmental Consultants). This stock, labeled LD (low demand), was also tested in the ETP wastewater to investigate the issue of virus stock demand in biasing of the results. The dose response of adenovirus was quite different between low- and high-demand stock based on the discrete summation Ct method (see Fig. 4 top). However, they were not significantly different based on the extended T10 Ct calculation method. As noted in the Supplementary Data, the extended T10 method reduces the impact of the ozone demand of the water because it uses a calculated C1 dose (i.e., theoretical ozone concentration at time T0 based on first-order ozone decay kinetics) compared with the applied ozone dose used for the discrete summation Ct method. This appears to have an effect of minimizing the impact of the initial ozone demand on the Ct calculation.
Regardless of the calculation methods, adenovirus appears to be the most resistant of the three viruses. However, looking at the data based on the extended T10 Ct method, it is clear that the viruses in general are susceptible to ozone at low Ct values (less than 0.1 (mg/L)-min) and there was no appreciable difference in sensitivity between them. This high susceptibility of viruses to ozone is also corroborated in numerous studies (Vaughn et al., 1987, 1990; Shin and Sobsey, 2003; Thurston et al., 2005)
The ozone demand issue and a new approach (reduction equivalent concept)
Numerous studies have exhibited the complexities of determining a clear ozone CT value in wastewaters for reporting dose response of microorganisms (e.g., Xu et al., 2002; Tanner et al., 2004; Burns et al., 2007; Ishida et al., 2008), thus many of these results are not universally transferrable to other studies. To determine the effect of ozone demand by wastewater, we compared the inactivation of E. coli in PBS and wastewater in Figure 5. As can be seen in Figure 5, in ETP wastewater, a Ct value of less than 0.040 (mg/L)-min was required for 4-log inactivation of E. coli in PBS (similar to the Ct reported by Hunt and Mariñas, 1999) compared with around 1.0 (mg/L)-min in wastewater. This discrepancy in the dose–response data for the exact strains and stocks of E. coli is caused by the ozone demand exerted by wastewater organic matter and other constituents rapidly competing for (scavenging) ozone molecules, thus affecting the calculation of Ct.

E. coli apparent dose–response curves for clean water at a pH of 7.5 (CW and no-fill markers) compared with ETP wastewater effluent at a pH of 7.96 (WW and solid markers) using discrete summation Ct calculation methods. Experiments were run at 16°C. Clean water SOTs were run at applied doses of 0.10–0.44 mg/L and contact times of 10–370 s. Wastewater SOTs were run at applied doses of 4.0–12.0 mg/L and a contact time of 30 s.
The effects of varying ozone demand on data interpretation can be neutralized in a number of ways. One way is to prepare surrogate and virus stocks with the least demand possible. However, for many microorganisms, such as bacteriophage, stocks produced with a titer sufficiently high to demonstrate greater than 4-log inactivation inevitably retain some of the organic matter associated with propagation and thus introduce some level of ozone demand to the test water matrix. A second way is to measure the concentration after a time frame of 1 s or shorter and use this as the C1 value. However, in the SOT experiments, it is nearly impossible to collect multiple samples over the first 10 s of the ozone contact time to measure residual ozone such that, in the case of comparing a high and low ozone demand water, the calculated Ct may differ greatly. An illustration of this effect is provided in Supplementary Figures S3 and S4.
A third method to normalize samples with varying ozone demand is to use an internal standard microorganism. This was achieved by combining two different microbial surrogates, or a surrogate and a virus, in the same background water to directly compare their ozone dose response under identical demand conditions in a wastewater sample. Toward this end, an approach to normalize for varying ozone demand by combining two or more microorganisms (e.g., E. coli and PRD-1 phage) was developed, including one with little to no ozone demand, demonstrating comparative inactivation in the same water matrix.
Figure 6 shows the results of the combined inactivation of E. coli and PRD-1. Compared with the result of experiments with E. coli alone, the Ct value required for the same inactivation of E. coli was increased when E. coli was combined with the PRD1 phage. This was quite surprising that only small amounts (e.g., 0.15 mL of PRD-1 stock in 200 mL) were applied and still the demand was significant even when spiked into wastewater, which generally had a high ozone demand of its own.
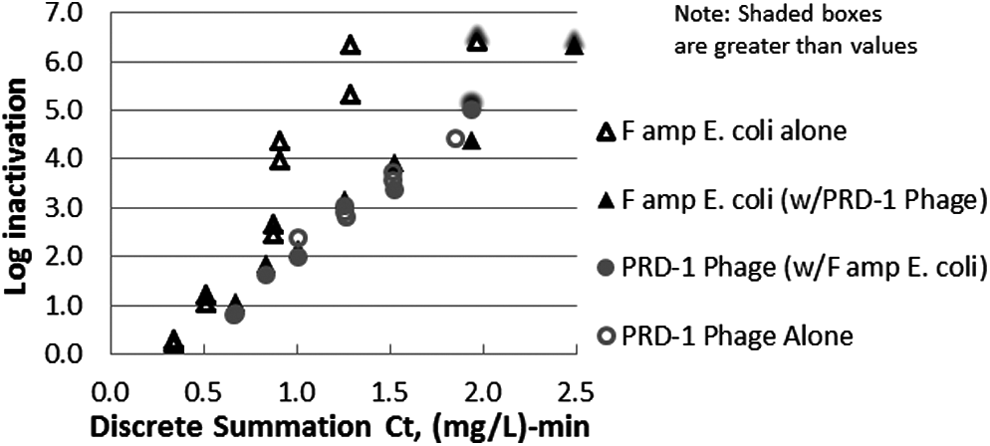
Ozone apparent dose responses for surrogates in ETP wastewater effluent at 16°C, pH of 7.96, in a combined batch based on discrete summation Ct. Dose responses for Famp E. coli tested alone and for PRD-1 tested alone are shown in hollow triangles and hollow circles, respectively, for reference. The combination SOTs and the PRD-1 alone SOTs were conducted with applied doses of 8–24 mg/L and contact times of 30 and 60 s. The Famp alone SOTs were conducted with applied doses of 4–15 mg/L and a contact time of 30 s.
Transferred ozone dose has been suggested as a good way to measure ozone dose in wastewater (Xu et al., 2002; Ishida et al., 2008); however, it may give misleading interpretations when using Hoigné and Bader's SOT method. While for some engineering decisions, the transferred ozone dose for a given level of inactivation of indigenous (nonspiked) microbes in a specific water may be useful, variations in the ozone demand of the water due to fluctuations in water quality would need to be accounted for. Comparing inactivation data on the basis of Ct would appear to be a better method than transferred ozone dose. The Ct bias from varying stock solution ozone demand typically occurs within the first 10 s of the experiment. Because 10 s is the first time point used by the discrete summation method together with the applied dose, the discrete summation Ct value does not reflect the true character of the decay curve within the first 10 s. This method and the extended T10 Ct method are compared below as methods to represent the ozone dose.
To compare dose responses across a suite of microbes with varying ozone demand and estimate a true ozone dose–response relationship for a microorganism, each organism under investigation was tested in a combined water matrix with an E. coli reference microbe. E. coli is used as a normalizing factor to indicate the actual dose to which organisms inside the complex water matrix were being subjected and thus could be normalized against. This is analogous to the use of reduction equivalent doses in UV disinfection tests. E. coli Famp was chosen as the indicator species since (1) the ozone demand associated with E. coli alone is negligible compared with that of virus and surrogate stocks, (2) its addition does not have an impact on somatic phage or virus assays, and (3) it can be easily enumerated in the laboratory. Figure 7 shows apparent dose–response curves for three combination experiments in ETP wastewater effluent at 16°C and pH of 7.96 with E. coli as an indicator species.
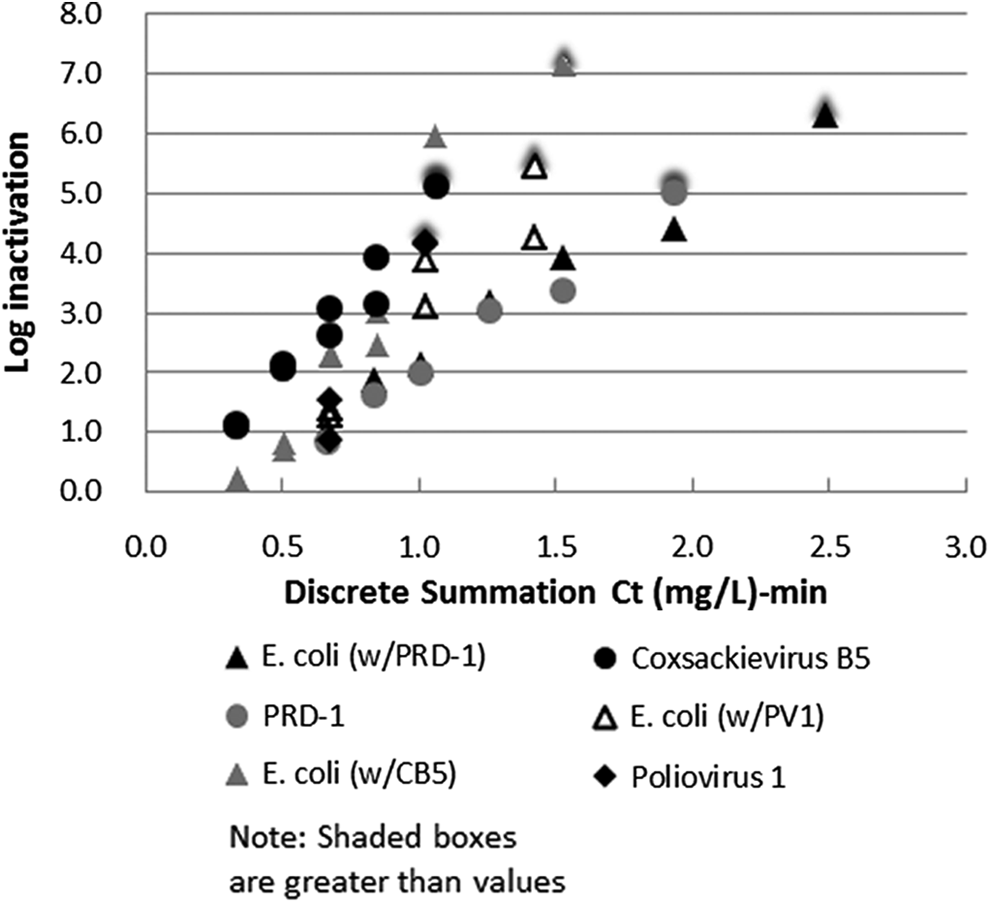
Apparent dose–response curves for three combination experiments in ETP wastewater effluent at 16°C and a pH of 7.96 with viruses and surrogates using E. coli as an indicator species based on discrete summation Ct. Combination experiments were conducted with a 30 s contact time. Coxsackievirus and poliovirus SOTs were conducted with applied doses from 4 to 15 mg/L, and PRD-1 SOTs were conducted with applied doses from 8 to 24 mg/L.
As expected, the observed inactivation of E. coli as a function of discrete summation Ct decreased with increasing ozone demand in various mixtures as was exemplified in comparing the clean water and wastewater experiments in Figure 5. The magnitude and variability of ozone demand in wastewater during these combined experiments can be seen in Figure 8, which depicts ozone residuals at 10 and 30 s after various applied ozone doses. Although Richard (1994) and others suggest the use of 30 s as the initial ozone residual measurement for measuring SOT ozone demand, Figure 8 shows that the ozone residual at 10 s may be more informative since ozone residual at 30 s is more frequently below the detection limit.
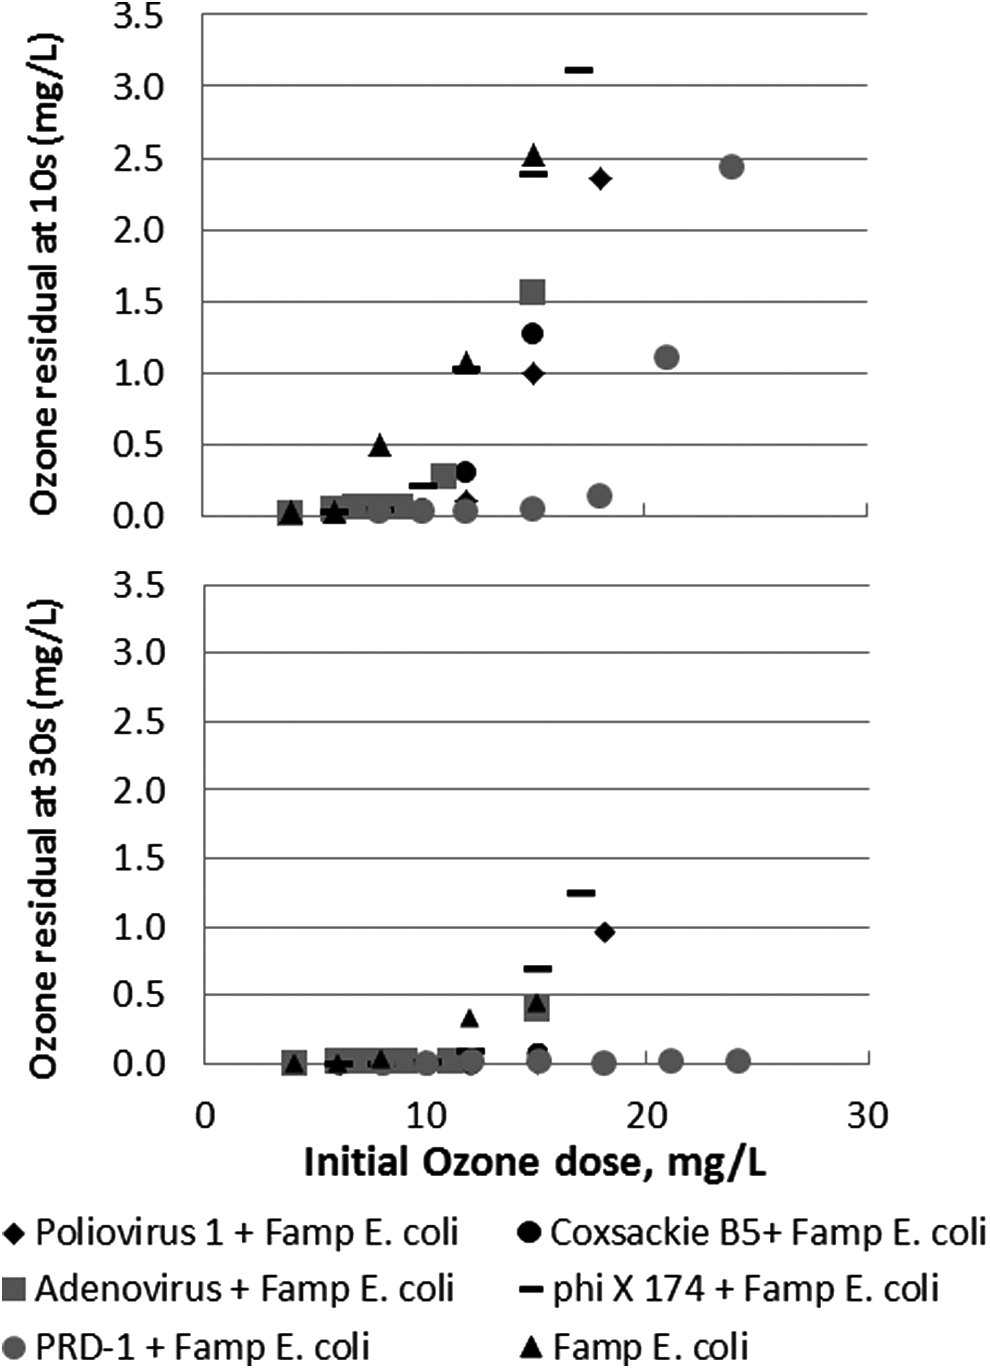
Ozone residual at 10 s (top) and 30 s (bottom) as a function of the initial ozone dose in ETP wastewater effluent at 16°C and an unaltered pH of 7.96.
In each combined batch, there was no significant difference between the resistance to ozone of E. coli and that of PV-1, Ad2, and CVB5 (E. coli combinations with PV-1 p<0.05, Ad2 p<0.001, and CVB5 p<0.00005).
Finally, apparent dose–response curves were normalized by the following method:
(1) First, a simple numeric normalizing factor was determined by iteratively adjusting the factor until the linear best-fit line of the logarithmic inactivation curve of the combined experiment (E. coli+poliovirus) was brought collinear with the linear best-fit line of the logarithmic inactivation curve of the experiment of E. coli alone. (2) Then, the same normalizing factor was applied to the logarithmic inactivation curve of the poliovirus only to generate an E. coli reduction equivalent inactivation curve for poliovirus.
Normalized data based on discrete summation Ct, shown in the top portion of Figure 9, represent the ozone resistance of surrogates and viruses relative to one another. These data suggest that both PRD-1 and E. coli are potential surrogates for inactivation of viruses in wastewater. More importantly, it illustrates that these data contain no outliers regarding ozone sensitivity. It indicates that inactivation of the surrogates would also represent similar inactivation of viral pathogens.
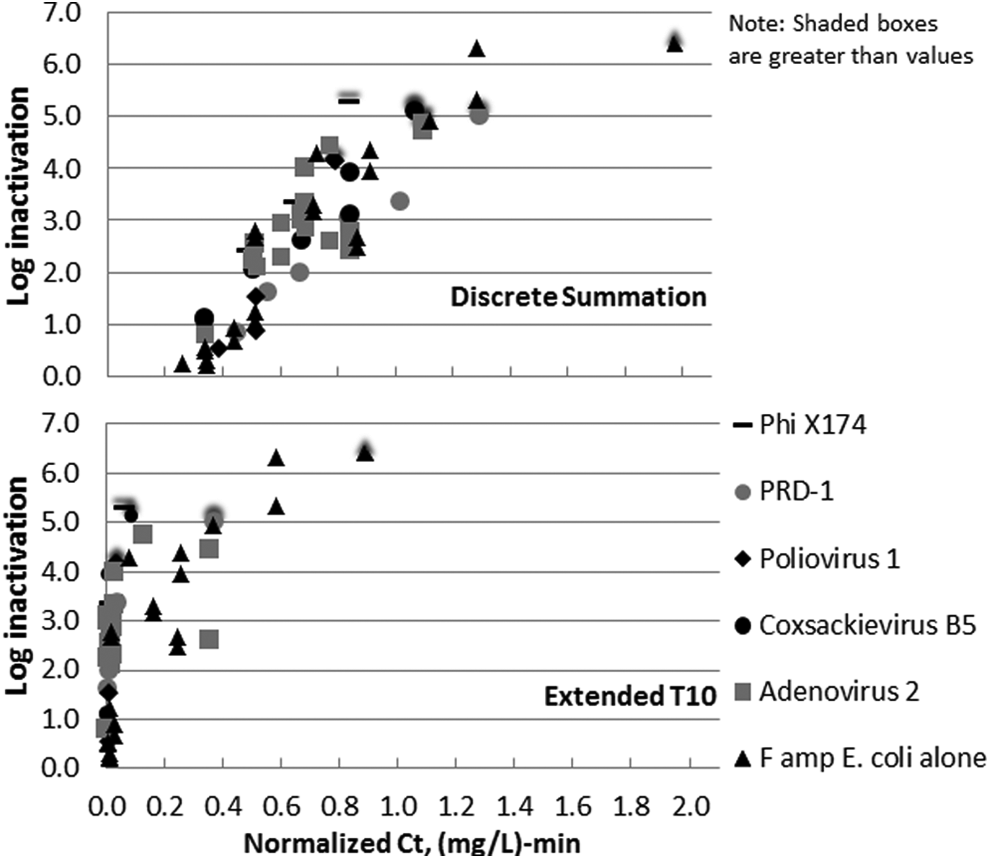
Normalized, apparent dose–response curves for combined experiments in ETP wastewater at 16°C and an unaltered pH of 7.96 with discrete summation Ct values (top) and extended T10 Ct values (bottom) normalized to match differing E. coli dose–response curves to give a better idea of the true resistance of viruses and surrogates relative to one another. Combination experiments were conducted with a 30 s contact time. Coxsackievirus, poliovirus, adenovirus, E. coli, and PhiX174 phage SOTs were conducted with applied doses from 4 to 15 mg/L and PRD-1 SOTs were conducted with applied doses from 8 to 24 mg/L.
The bottom portion of Figure 9 shows the results of combined experiments based on the extended T10 Ct calculation method. While the extended T10 method can minimize the impact of varying ozone demand of test waters, it appears that the extended T10 calculation is also sensitive to ozone demand, but in a quite different way. The microbes in the higher ozone demand stocks are interpreted as being very susceptible to ozone and those in the lower ozone demand stocks as more resistant. While these data lend further evidence to the fact that viruses are susceptible to ozone at low exposures and that exposure above a Ct value of 0.1 (mg/L)-min effectively inactivates all viruses tested, the use of extended T10 Ct calculation may also lead to misinterpretation of the data. The E. coli alone, which has an insignificant contribution to ozone demand, is an outlier to the right, suggesting that its inactivation requires a higher ozone exposure. Higher demand viruses are bunched at the left, suggesting that their inactivation would require a lower ozone exposure. If there is significant virus inactivation occurring during the consumption of ozone demand over the first initial few seconds, this portion of the Ct calculation would not be accounted for in the Ct.
Data from combined experiments also suggest that use of the extended T10 Ct calculations causes the shape of apparent ozone dose–response curves to differ based on different oxidant demand conditions. While extended T10 calculations themselves may reduce ozone demand bias, it prevents the data from being as easily normalized as the discrete summation data that were normalized in the upper portion of Figure 9.
While it is difficult to ascertain exactly what dose is required for virus inactivation, it is clear that the viruses are no more resistant to ozone than the surrogates tested. Furthermore, significant (>3–4 log) inactivation occurs at a Ct value of ∼1 (mg/L)-min using the discrete summation method (which is clearly conservative) and also occurs at a Ct value of less than 0.1 (mg/L)-min using the extended T10 method (which may be an underestimate). In the context of creating regulations, the weight of all the data in the literature (see references in Table 1) and the findings of this research indicate that to achieve a virus inactivation of >4 log, the ozone Ct exposure lies somewhere between 0.1 and 1.0 (mg/L)-min.
Proposed ozone Ct values for varying levels of inactivation of the viruses and surrogates examined in this study are presented in Table 3. While these data are presented for a specific wastewater, because the spiked stock for each microorganism's ozone demand impact was accounted for, the relative sensitivities of the viruses and surrogates can be used to select an appropriate surrogate to demonstrate varying levels of virus inactivation for use in any water.
Pseudo first-order rate constant shown as the negative slope of the linear best-fit trend line of a plot of ln(C/Co) versus normalized discrete summation Ct. Y-intercept of the same trend line is also shown.
0.844 (mg/L)-min gave a 3.19-log inactivation and 1.115 (mg/L)-min gave >5.57-log inactivation.
0.789 (mg/L)-min gave >4.16-log inactivation of PV-1.
Range of Cts reflects different separate batch experiments.
1.10 (mg/L)-min gave 4.74-log inactivation of Ad2.
Data from SOT tests generally conformed to a pseudo first-order inactivation rate, which is consistent with other literature (Hunt and Mariñas, 1997; Azzellino et al., 2011). The inactivation rate constant was calculated for each virus and surrogate by taking the negative slope of the plot of the natural log of the ratio of the viable microbe concentration at a given ozone Ct to the starting microbe concentration as a function of the ozone Ct using the discrete summation method.
Conclusions
Ozone was found to be highly effective for disinfection of viruses in membrane-filtered secondary effluent from the Melbourne Water ETP. Neither pH nor temperature, examined within the typical ranges of natural waters (pH 6–8 and temperature of 16–23°C), affected ozone disinfection. Discrete summation Ct, extended T10 Ct, and transferred ozone dose could all be appropriate methods for monitoring disinfection performance, provided that any ozone demand bias is eliminated. When a variable ozone demand is present, the most appropriate method for neutralizing the false impact on Ct comparisons among different microorganisms is to utilize the extended T10 Ct calculation method, as supported by the USEPA (2010). A method employing the reduction equivalent dose concept was presented to normalize ozone Ct data between samples with varying ozone demand.
Finally, E. coli was identified as a good candidate for use as a surrogate for ozone dose delivery that can indicate disinfection of a suite of viruses by ozone. Similarly, PRD-1 phage was found to be a good candidate as a surrogate for pathogenic viruses in ozone disinfection; however, care should be taken to reduce the PRD1 stock demand if it is to be used in field-scale testing.
Footnotes
Acknowledgments
Funding for this project was provided by Melbourne Water, Melbourne, Australia. The authors would like to thank Jon Bates formerly of Black & Veatch for valuable input throughout the project. The authors would like to acknowledge several people for their support with this project's microbiological goals and would like to thank Dr. Scott Meschke and students and staff at the University of Washington, including Nicola Beck, Jason Faulkenberry, Kelly Jones, and Lynne Simmonds. The authors would also like to thank Dr. Charles Gerba and Kelly Bright of the University of Arizona, Dr. Roberto Rodriquez of the University of Texas Health Sciences Center, and Tom Hargy and Dr. ThengTheng Fong of Tetra Tech/Clancy Environmental Consultants. The input of Professor Charles Haas (Drexel University) and Professor Charles Gerba (University of Arizona) on the experimental design and selection of viruses and surrogates to study was greatly appreciated.
Author Disclosure Statement
No competing financial interests exist.
References
Supplementary Material
Please find the following supplemental material available below.
For Open Access articles published under a Creative Commons License, all supplemental material carries the same license as the article it is associated with.
For non-Open Access articles published, all supplemental material carries a non-exclusive license, and permission requests for re-use of supplemental material or any part of supplemental material shall be sent directly to the copyright owner as specified in the copyright notice associated with the article.