
Abstract
Abstract
To describe the general distribution patterns in the plant biomass and its spatial relationships to the soil properties along the Qinghai-Tibet Railway, the below ground biomass (BGB), above ground biomass (AGB), species, plant coverage, soil moisture, nutrition, and permafrost table were investigated. Our independent data sets from 19 sites indicated that the communities differed significantly from each other in the vegetation types, biomass, total vegetation coverage, and species richness and composition. Overall, the mean AGB of the alpine grasslands was 0.144 kg/m2, with a greater mean value in the alpine meadow (0.183 kg/m2) than in the alpine steppe (0.060 kg/m2). AGB reached a maximum value of 0.351 kg/m2 at the Liangdao River site. Spatial patterns of soil moisture and nutrients were different from those of plant biomass; BGB was positively correlated with total nitrogen, organic matter content, and available nitrogen in the 0–40 cm soil layer and with soil moisture in the 50–100 cm soil layer. Deeper soil moisture is an indication of shallower soil moisture regime over longer periods.
Introduction
T
Alpine meadows, which cover ∼35% of the plateau area, comprise the representative vegetation and the major pastureland on the plateau. The soil of these alpine meadows is rich in organic C (Cao et al., 1998). The grassland ecosystem may be a major C sink because of its high productivity during the growing season and the low rate of decomposition resulting from the low temperature. Alpine wetland ecosystems are highly productive and store large quantities of carbon, which is sequestered into organic matter through the synthesis of plant biomass (Trumbore et al., 1999; Hirota et al., 2007).
In addition, the dry and cold climates determine the poor flora of the Qinghai-Tibetan Plateau (Wu, 1995). Primary productivity, the fixation of carbon dioxide into organic molecules by photosynthesis, is a key feature of ecosystem function (Huenneke et al., 2002) and is, thus, strongly related to the plant species composition. Therefore, in recent years, substantial effort has been made to explicitly quantify the variation in the plant species composition and structure, which are spatially related to the rate of and variability in the nutrient cycling along a successional sere.
Hence, studies of the spatial distribution of plants, nutrients, and biomass are fundamental to our understanding of the responses of the vegetation ecosystem to global warming and permafrost degradation, ecosystem structure and function (Hirota et al., 2007), carbon storage, and the biogeochemical dynamics of terrestrial ecosystems (Luo et al., 2002; Cheng et al., 2007; Wang et al., 2014). Furthermore, it is equally important to understand how these structural changes in ecosystems have altered the magnitude of the biomass and its spatial distribution (Cheng et al., 2007).
Knowledge about the biomass and net primary productivity of the natural vegetation of the Qinghai-Tibetan Plateau would contribute to better estimates of carbon storage and cycling for this large region of the world (Luo et al., 2002). However, to our knowledge, very few studies of the plant biomass and production have been conducted in this area (Luo et al., 2002; Yang et al., 2009).
The newly completed Qinghai-Tibet Railway (QTR), which connects the city of Lhasa in the Xizang Autonomous Region to Golmud City in Qinghai Province, crosses two provinces in West China. The length of the railway, which was initiated in 2001 and completed in 2006, is 1,142 km, and it is the highest railway in the world; for nearly 960 km, it is 4,000 m above sea level (Zhou et al., 2008).
Climate changes and human activities have influenced and altered a wide variety of the alpine and cold ecosystem functions. The construction of the QTR on the Qinghai-Tibetan Plateau has raised many concerns about its environmental impact. Various mitigation measures were adopted to reduce the detrimental impact of the QTR construction. It was reported that the mitigation measures applied in the permafrost areas along the QTR have been effective at different levels (Zhou et al., 2008). Thus, it is necessary to obtain current information concerning the spatial variation in biomass and the controlling environmental factors along the QTR in the permafrost regions.
Previous studies have been focused on the heterogeneity of the soil resources. Few efforts have been made to study the spatial variation of the above ground biomass (AGB) and the associated nutrient contents of the grassland plants in the permafrost regions along the QTR. Understanding the mechanisms underlying these relationships will increase our capacity to predict future ecosystem behaviors in response to global climate change. Moreover, knowledge of the primary productivity would contribute to a better understanding of the carbon storage and budget for this large region of the world.
In this study, we investigated the biomass from 19 sites in the permafrost regions along the QTR during the summer (July and August) in 2013. Specifically, our objectives were to (1) quantify the spatial distribution patterns of the AGB and the below ground biomass (BGB) along the railway and (2) further explore the relationships among the biomass, soil moisture, and nutrients.
Study Site and Methods
Descriptions of sampling sites
All of the sites are distributed from Xidatan to the Liangdao River along the QTR, with a range of more than 700 km (31°82′–35°72′N, 91°56′–94°12′E) and an altitude range from 4,488 to 5,100 m (Fig. 1). The distances from the sampling sites to the railway range from 39 to 930 m (Table 1). The region has a typical continental alpine cold and dry climate with a mean annual air temperature between −6.1°C and −4.4°C, a mean annual precipitation of 290–400 mm, and an annual average potential evaporation of 1,204–1,327 mm. The region is underlain by continuous permafrost, in which downward thawing from the surface begins in April, with the maximum thawing depth (1.1–3.3 m) being reached in August.

Location of sampling sites.
QTR, Qinghai-Tibet Railway.
The soils in the study area can be characterized by young development and form a thin skeletal soil layer due to the gravel parent materials of the glaciofluvial deposit, the eluvium and fluvial sediment, and the slow soil formation under the cold climate. The natural vegetation along the railway is dominated by the alpine meadow and steppe. Thirteen sample sites were located in the alpine meadow, and the other six sample sites were in the alpine steppe (Table 1). The alpine meadow is dominated by Kobresia pygmaea, Kobresia humilis, and Kobresia schoenoides. The alpine steppe is dominated by Carex moorcroftii and Stipa purpurea.
Sampling design and field investigation
The vegetation and soil investigation was conducted in the sites from 29 July to 8 August 2013, during the best growing seasons for the vegetation in the study area. The distribution of the different ecosystem types is not continuous, but instead follows a patch-like pattern along the railway because of the changing topography, which influences the air temperature and precipitation and, thus, the type of ecosystem (Zhou et al., 2008). Nineteen representative sample sites, 50 × 50 m2 in area (0.25 ha), were selected near the typical sections of the QTR. All of the vegetation and soil measurements were carried out inside the sites. Within each site, six 1 × 1 m2 quadrats were established uniformly to record the vegetation types, the plant species, the coverage, and the heights, etc. in detail (Moore, 1986). The AGB of the six sampled subquadrats of 0.25 × 0.25 m2 in each site was harvested after completion of the vegetation survey.
Soil samples for the root biomass measurement were collected using a soil auger (7.5 cm in diameter) from depths of 0–100 cm from six 0.25 × 0.25 m2 quadrats, which were colocated with the AGB measurement quadrats. In addition, soil profiles were dug at each site to determine the upper limit of the permafrost and root distributions (Johnston, 1981). Six soil cores for the soil moisture and nutrient measurements were sampled every 10 cm of soil depth and bulked to obtain a composite sample of each depth when the profiles were prepared. The soil samples were placed in sealed plastic bags. Because it is very difficult to separate the live roots from the dead ones in the field investigation, we collected both live and dead roots by washing through a sieve. The biomass samples were oven-dried to a constant mass at 70°C and weighed to the nearest 0.1 g.
It has been demonstrated that the magnitude and relative importance of different errors are highly dependent on the operating conditions (Jones, 2001). Two sources of uncertainty, which are not quantified in this study but are related to the sampling process, are (1) uncertainty of the AGB measurements and (2) uncertainty linked to the measurements of the underground biomass by considering dead and living roots together.
Laboratory analyses
Soil moisture was measured using the gravimetric method. The method involves drying a soil sample in the oven at 105°C for 24 h to determine the soil moisture content in each site. Each soil sample was thoroughly sieved to 2 mm to remove the roots and incorporate litter before measuring the nutrients. We measured the soil nutrients (organic matter content [OMC], available nitrogen [AN], available phosphorus [AP], available kalium, total nitrogen [TN], total phosphorus, total kalium, and salt content [SC]) by conventional methods (Institute of Soil Sciences, Chinese Academy of Sciences, 1978).
Data analyses
Statistical analyses were performed with the SPSS software package (version 13.0 for windows; SPSS, Inc.), with α = 0.05 as the threshold for statistical significance. One-way analysis of variance was used to analyze the mean ± standard deviation of the AGB and BGB. Correlation analyses were conducted to describe the relationships between the AGB and the soil moisture and nutrients. Linear and nonlinear curve fits were performed in Origin (version 7.5; OriginLab Corp) to explore the relationships among the permafrost table, the total vegetation coverage, and the AGB on the BGB.
Results and Discussion
Variation of AGB and BGB along QTR
As shown in Table 1, the communities differed with each other in the vegetation types, the biomass, the total vegetation coverage, and the species richness and composition. The vegetation coverage of the alpine plant communities ranged between 13% and 92%.
Variations in the AGB and BGB among different vegetation types along the QTR are shown in Fig. 2. The overall mean AGB of the alpine grasslands was 0.144 kg/m2, with a greater mean value in the alpine meadow (0.183 kg/m2) than in the alpine steppe (0.060 kg/m2). These values obtained in permafrost areas are not in close agreement with those obtained for the AGB in other studies on the overall Qinghai-Tibetan Plateau. Yang et al. (2009) estimated the alpine grasslands AGB value at 0.069 kg/m2, with a larger value (0.091 kg/m2) in the alpine meadow than in the alpine steppe (0.050 kg/m2), whereas Luo et al. (2002) estimated the total biomass (AGB and BGB) for the alpine steppe and meadow to be 0.157 and 0.663 kg/m2, respectively. The difference for the alpine grassland was likely due to the limited sample size (Luo et al., 2004).

AGB and BGB along Qinghai-Tibet Railway. Error bars represent the standard deviation about the mean. AGB, above ground biomass; BGB, below ground biomass.
Both the AGB and BGB vary according to the characteristics of the sample sites, indicating that the vegetation productivity possibly depends on the different local growing conditions in these sites. In addition, the different distances from sample sites to the QTR can affect the biomass variations because of the human activities. The AGB measured in the permafrost area along the QTR ranged from 0.020 to 0.351 kg/m2, and the BGB ranged from 0.178 to 12.040 kg/m2; the distribution of the biomass is presented in Fig. 2.
The peak values of the AGB were observed at site 18 in Liangdaohe. The site was dominated by Kobresia tibetica, Kobresia humilis, and Carex tristachya, with vegetation coverage of 92%. Comparatively, Cao et al. (2004) reported that the maximum AGB was 0.471 and 0.211 kg/m2 and that the total root biomass values averaged 1.951 and 1.032 kg/m2 for the light grazing and heavy grazing sites, respectively. However, site 19 in Liangdaohe had much lower AGB with a value of 0.138 kg/m2, although the vegetation coverage and species richness remain homogeneous in the same place. Accordingly, the vegetation productivity may show large spatial variation, even within the same sampling site. The highest AGB of the alpine steppe was found in lightly degraded community 4, with a value of 0.113 kg/m2.
Drought and overgrazing have been the major causal factors leading to the loss of the dominant grass species and the progress of permafrost degradation. The AGB decreased significantly with the increasing desertification effects at sites 2 (0.043 kg/m2) and 6 (0.020 kg/m2). The productivity of the vegetation was low as a result of bad environmental conditions, for example, on sites 3 and 8, where the AGB was 0.049 and 0.035 kg/m2, respectively. These sample sites are vulnerable to losses of soil nutrients, leading to a progressive degradation of productive capacity of the ecosystem over a long period. Thus, the decline of the biomass is likely related to drought and the loss of soil nutrients from these ecosystems with progressive desertification. The BGB decreases with the increasing permafrost table (Fig. 3) and, thus, fits with the plant coverage results very well (R2 = 0.8791, p < 0.01) (Fig. 4).

Relationships between BGB and permafrost table.
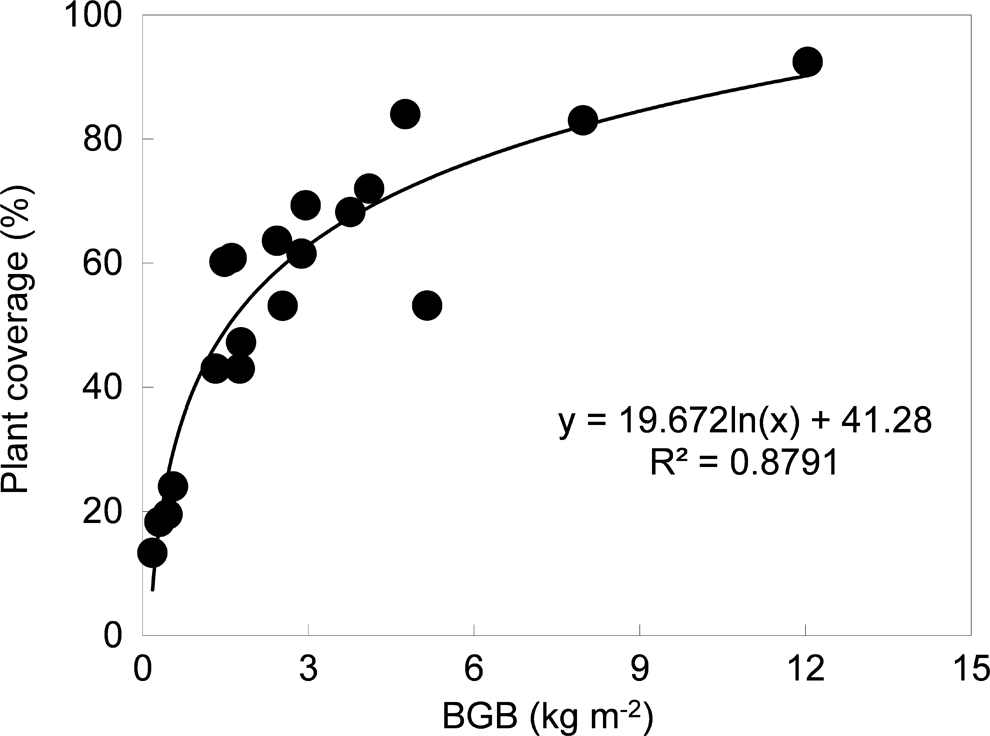
Relationships between BGB and plant coverage.
Variation in root/shoot ratio among different vegetation types along the QTR
Estimates of root biomass density are fundamental to understanding the carbon storage and the biogeochemical dynamics of terrestrial ecosystems (Luo et al., 2005). In our study, most of the communities have a shallow root system, with BGB higher than 60% being found in the top 0–10 cm of the soil (Fig. 5). The soil surface is well developed, with a mixture of root mass and clay to a depth of ∼5–10 cm. The root biomass decreased with the soil depth in all vegetation types. However, the roots of the vegetation in the Tongtian River 16 site can reach as deep as 1.5 m, although the majority of the absorbing roots were within the upper 40 cm of the soil and decreased with depth.
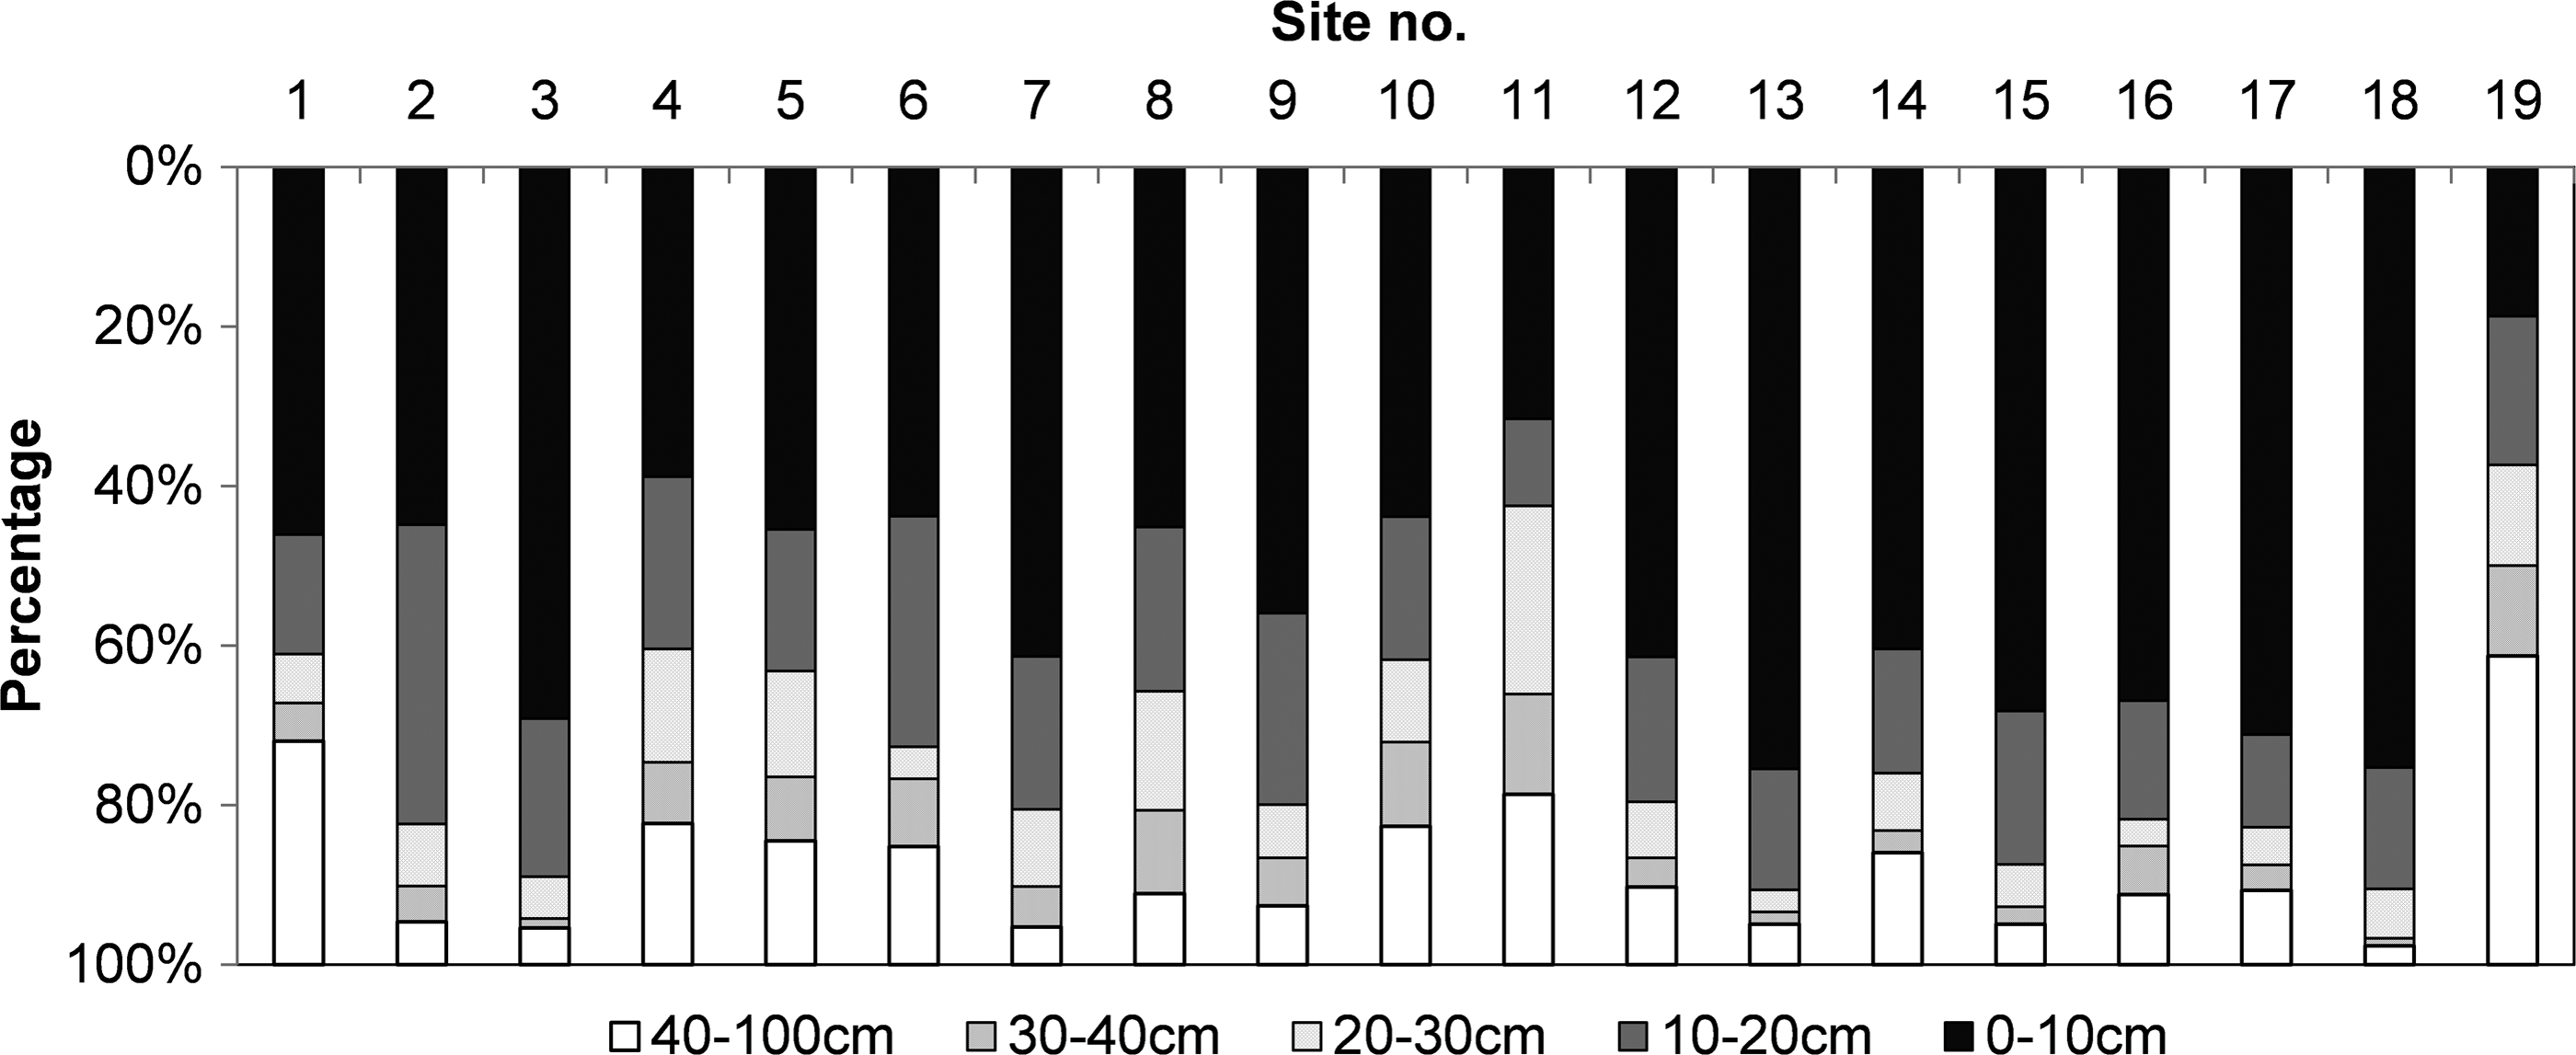
Percentage of underground biomass in different soil depth.
The disparity of the BGB between the southern and the northern limit of the permafrost regions along the QTR is particularly distinct. In the 0–100 cm soil layer, the underground biomass in sites Liangdao River 18, 19 and Xidatan 1, 2 was 12.040, 3.762 and 4.758, 0.452 kg/m2, respectively.
Most of the vegetation biomass was allocated underground in comparison with the AGB on the Qinghai-Tibetan Plateau (Li et al., 2013). Iwaki (1973) considered that the BGB is generally 5–10 times higher than the AGB in grasslands. An investigation in the Haibei alpine meadow showed that the ratio of the AGB to the BGB ranged from 1:14 to 1:23 when the BGB was sampled to a depth of 1 m, depending on the vegetation type and soil conditions. However, much higher ratios, that is, those in the permafrost regions along the QTR, were found in our research. As shown in Fig. 2, the root/shoot biomass ratio along the railway varied with different vegetation types: 11.7–39.1 for the alpine meadows and 8.6–18.2 for the alpine steppes in August. Moreover, the actual ratio may increase to some extent because roots deeper than 100 cm were not sampled.
It is, therefore, necessary to find an expedient procedure for underground estimation. Higher AGB coincided with higher values of underground biomass. A strong relationship (R2 = 0.9262, p < 0.01) between the AGB and underground biomass has been found in our case (Fig. 6), and the proportion could be used to estimate the BGB for all sites along the QTR by measuring the AGB in situ. This is especially important in these harsh environmental conditions because the detrimental impact of sampling is often large here. Therefore, destructive sampling of the underground is not acceptable.
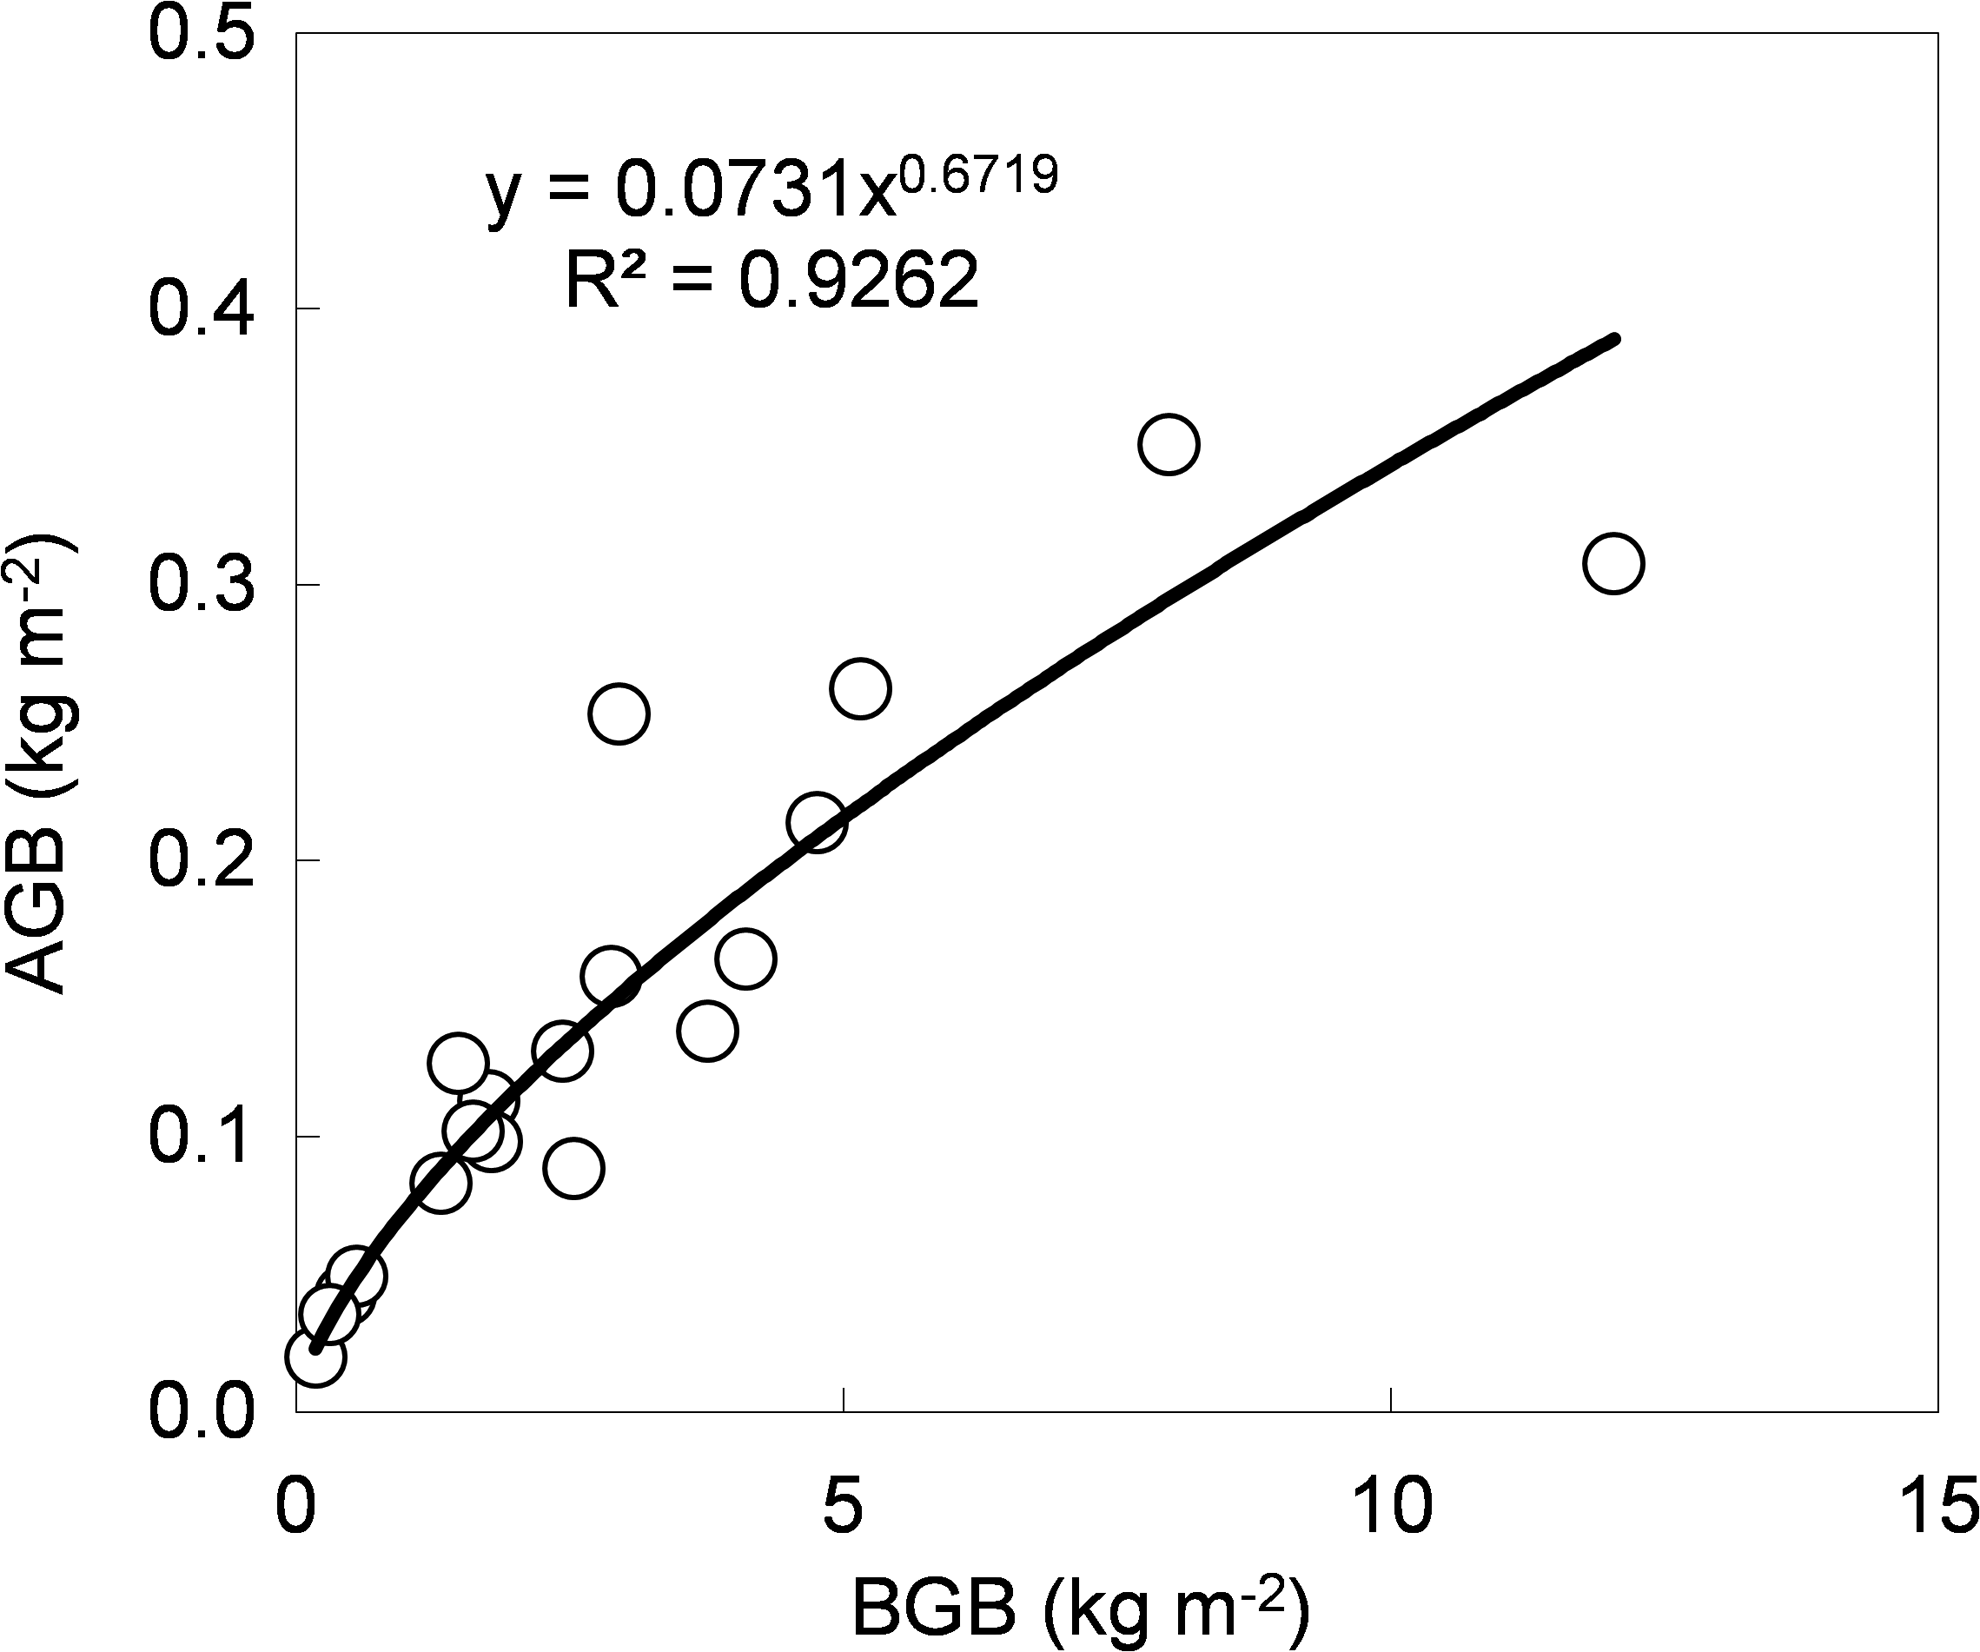
Relationship between AGB and BGB.
Relationship between vegetation productivity and soil moisture
Precipitation, which has been demonstrated to strongly determine the AGB in grasslands, is frequently used to explain the spatial variation in production (Sala et al., 1988; Ni, 2004; Yang et al., 2009). The results of Yang et al. (2009) suggest that soil moisture availability is the major environmental factor controlling the AGB in high-altitude regions. Wu et al. (2013) found that the vegetation of the AGB increased along a soil moisture gradient in a wetland ecosystem on the Qinghai-Tibetan Plateau. The correlation coefficients of the AGB with the soil moisture and nutrients at different soil depths are given in Table 2. The results demonstrated that the SM in the 50–100 cm soil layer was positively correlated with the AGB, with poor relationships found between the biomass and the 0–50 cm SM, although the vast majority of the roots were found in the shallow soil layers.
Correlation is significant at the 0.05 level (two tailed).
Correlation is significant at the 0.01 level (two tailed).
SM, soil moisture; OMC, organic matter content; AN, available nitrogen; AP, available phosphorus; AK, available kalium; TN, total nitrogen; TP, total phosphorus; TK, total kalium; SC, salt content.
Yang et al. (2003) suggested that the freezing process might prevent the soil moisture from evaporating. Because the freezing period in these areas lasts almost 6 months, it is beneficial for the soil to keep the moisture. Although there is low precipitation in the freezing period, the soil moisture content is high when the soil begins to thaw. In the permafrost regions of our study, the seasonal freezing and thawing activities were assumed to provide plants the main source of available water. Because the duration of the thawing decreases with the increase in soil depth, the upper soil layers contain the optimal water condition for the roots in most of the plant-growing season.
The permafrost downward-thawing process nearly reached the maximum thawing depth (permafrost table) during the sampling period in this area. Abundant water replenishment by precipitation and permafrost melting infiltrated downward and accumulated at the permafrost water-resisting layer, resulting in high water content in the 50–100 cm soil depth. In addition, samples of soil moisture were collected in situ once for all sites and on some days of measurement for the different sites. Therefore, the soil moisture in the topsoil could be influenced by the changes in the weather among the different sites over the sampling period. The low correlation coefficients between the AGB and the 0–50 cm SM might also be caused by the drawback of our sampling. Thus, it is concluded that the deeper soil moisture is an indication of the shallower soil moisture regime over longer periods, and the shallow measurements as single measurements are not representative.
Relationship between vegetation productivity and soil nutrients
Among the different environmental factors, soil is normally of great importance in plant growth, and the relationships between vegetation and soil characteristics can be an important tool when assessing sites. Wang et al. (2014) reported that the soil organic content affects the thermal dynamics of the permafrost active layer in the alpine meadow. In most of the sample sites along the QTR, the organic soil layer is very shallow, with a thickness of ∼10 cm. The upper soil layers generally contain the greatest concentrations of nutrients.
It was reported that the spatial variation of soil nutrients is often associated with variation in plant distribution (Schlesinger et al., 1990; Katherinel et al., 1995). In turn, changes in the vegetation distributions would provide feedback to the spatial distribution of soil elements (Robertson et al., 1997).
As shown in Table 2, our field data indicate that changes in the biomass were mainly determined by the TN, OMC, and AN in the 0–40 cm soil layer. Roots will respond to vertical gradients of nutrients. Because of the shallow root distribution, our results also show no significant correlation between the nutrients in deeper soil layers and the AGB, except for the AP in the 80–90 cm soil layer and for the SC in the 70–80, 90–100 cm soil layer. In addition, more sites of the alpine steppe were found close to the northern limit of permafrost, indicating a worse environmental status in the northern regions of permafrost. Luo et al. (2004) also insisted that the precipitation gradient along the railway characterizes not only the vegetation distribution but also the soil nutrients in the natural ecosystems. However, we still have no correlative data to support this view.
Conclusions
Our study further clarifies the spatial variation of the primary productivity and its relationship with the environmental factors in the alpine grassland on the plateau. Along the QTR, spatial variations were found in the biomass and soil properties because of the microenvironmental changes among the sites. The differences in the biomass and root include the fact that the shoot ratios among the different vegetation types were mostly related to the site conditions, soil moisture, and nutrients. Poor correlations were found between the BGB and the permafrost table. The BGB takes up a large proportion of the alpine plant biomass, resulting from the low rate of decomposition under the low temperature on the Qinghai-Tibetan Plateau. The majority of the BGB is distributed within the upper 40 cm of soil and decreased with depth. This presumably resulted from the shallow, less-extensive rooting system of the vegetation.
We found a strong relationship between the AGB and underground biomass, and their proportion could be used to estimate the BGB for all sites along the QTR by measuring the AGB in situ. Our field data indicate that the spatial variability of the AGB was closely related to the TN, OMC, and AN in the 0–40 cm soil layer and to the SM in the 50–100 cm soil layer. The deeper soil moisture is an indication of the shallower soil moisture regime over longer periods, and the shallow measurements as single measurements are not representative.
However, because of the limited sample number (3–6 quadrats for each site and only one sampling period in 2013) and the inconsistent distances from sites to the QTR, it is difficult to make a general conclusion about the effects of global warming and railway construction on the spatial heterogeneity of biomass in the current study. Further research is needed to answer this question.
Footnotes
Acknowledgments
The authors sincerely thank Shang Wen for her critical review and comments on the article. The authors are also grateful to Pang Qiangqiang, Liu Guangyue, and Wang Wu for their help with field measurements. This work was funded by the National Natural Science Foundation of China (41571075, 41101055, 41401090).
Author Disclosure Statement
No competing financial interests exist.