
Abstract
Abstract
This is a first of its kind study demonstrating that oil weathering can result in its sinking. Although a controversial proposition, oil's appearance on the sea floor following the 2010 Macondo 252 spill in the Gulf of Mexico and its large unaccountable volume has raised awareness of possible alternative explanations. Drag-down by settling particles is one known process. Another possible cause is heavy residue sinking due to density increase that follows the evaporation of the light constituents from the mixture. The study outcome impacts the field of oil spill modeling because confirmed mechanism-based process algorithms are required in the oil fate models. Theoretical and experimental studies on the proof of concept for the evaporation/sinking [EVAPO-SINK] process were undertaken using binary chemical mixtures representing “model oils.” Laboratory macrocosm-scale experiments with surface spills were performed and a theoretical, binary-component mathematical model was developed. Direct visual observations and physical/chemical measurements during both evaporation to air and heavy droplet sinking in the water column confirmed the process. Data obtained on oil component and bulk density concentrations tracked the time-series oil constituent chemodynamics within the slick and droplets. At the critical density the slick exceeded neutral buoyancy in water, after which a droplet formed underneath, broke away from the slick, and settled to the bottom. The drop was collected and physical/chemical measurements performed. Independent of the initial slick composition, the measured critical densities were 1.04 g/mL (±0.006) for fresh water and 1.07 for seawater. Dependent on initial composition, evaporation time to droplet formation varied from 200 to 2400 s. Data yielded evaporation rate kinetics required in the theoretical model. This light component mass transport coefficient ranged from 120 to 300 cm/h. The model correctly mimicked slick and droplet composition chemodynamic behavior patterns and density and drop-time measurements. Based on these positive outcomes the proof of concept was achieved.
Introduction
M
Background and Literature Review
Oil is a complex mixture of thousands of individual components. Though composition will vary depending on origin, mineral oils are made up of about 85 percent hydrocarbons (Speight, 1991; Scholz et al., 1999). Due to their high vapor pressure, the lighter oil components of a surface slick will preferentially evaporate to the atmosphere. The heavy, nonvolatile residue concentration will increase with time; it consists of waxes, resins, and ashphaltenes, primarily (Speight, 1991). As this occurs the slick may reach a critical density and achieve negative buoyancy in the water (Wilson et al., 1986). Pendulous, droplet-shaped forms appear on the underside of the slick as high density oil-material accumulates. Eventually, these calve and break away and the droplets move down the water column (Barnes et al., 1978). Figure 1 illustrates the evaporation/sinking process from the top of a surface slick and dissolution underneath.

Illustration of evaporation-sinking process for sea surface oil slick and various oil-material fractions produced as a consequence.
Field observations of sinking oil have been documented. The probability of oil sinking increases with high initial oil density (e.g., No. 6 fuel oil) and/or low density surface water (near river or glacier runoff) (Wilson et al., 1986). Since many oils have near neutral density, a small increase may activate this fate process. Wilson et al. (1986) confirmed a significant increase in the density of oil may be achieved by evaporative weathering due to exposure in wind tunnels (Wilson et al., 1986). Villoria et al. (1991) modeled oil sinking based on a hypothetical spill, concluding that spills with a high initial density may reach the necessary critical sinking density (Villoria et al., 1991). Extensive studies have examined the effect of environmental factors on the rates of evaporation and dissolution, and equations were developed to estimate mass transfer coefficients based on wind speed (MacKay and Yeun, 1983). Solubility is recognized as a secondary process for hydrocarbon losses from slicks. The “salting-out” effect and solubility alteration of crude oil in saline water has been observed and modeled (Hamam et al., 1987).
The evaporation and solubilization processes occur simultaneously and are due to the individual component vapor pressure and solubility (Ghiassi et al., 2012). Existing oil spill fate models do consider the settling process. However, a review of the documentation for three such models indicates that none include or address the simultaneous evaporation-sinking process specifically (Reed et al., 1996; Aamo et al., 1997; Beegle-Krause, 2001; French-McCay, 2004).
The theoretical derivation that follows is for a binary oil system, the simplest of oil mixtures, and accommodates both processes. It allows the development of a tractable mathematical model with a simple algorithm for tracking the oil chemodynamics with time. It provides the clarity and transparency required of a first-principle approach for the evaporation/sinking (EVAPO-SINKING) process that has not been published (Barnes et al., 1978). The binary model will serve as a guide for developing the more complex, multicomponent mixture models for use with the oil pseudo-component mixtures. The pseudo-component approach is one that uses boiling point to separate the oil into several mass fractions. Column chromatography is then used to subdivide each fraction into a “saturate”, “aromatic”, “resin,” or “asphaltene” oil category. Finally, the four categories are assigned with physicochemical and biological properties common to hydrocarbon chemicals of each group. Such is the current practice in models being used for projecting oil spill fate in aquatic systems (Reed et al., 1996; Aamo et al., 1997; Beegle-Krause, 2001; French-McCay et al., 2004). However, these models do not specifically use an evaporation-sinking mechanistic approach and to our knowledge have not been field tested specifically for producing a sinking fraction. The two component, EVAPO-SINK binary model allows for quantifying oil material fractions produced at the sea surface, thus providing the conditions of the initiating event. Other sea surface fate models can use this output as an input to forecast the embarked pathways, dispersion, reactions, and so on, of each fraction, thus assessing, finally “Where is all the oil likely to go?”
Methods: A Theoretical Model Development
The binary mixture consists of a volatile/soluble (light) component (A) with a density,
and it decreases with time. The concentration of A in the slick also decreases, whereas that of B and the density of the slick increase. In terms of the state variable the slick mass density is
Evaporative flux, NE [g/m2s], and the dissolution flux, ND [g/m2s], for component A are quantified by their respective mass transport rate equations,
where, KA [m/s] and Kw [m/s] are the overall air-side and overall water-side mass transfer coefficients (MTC). The double subscripts AA and AW [gA/m3] denote component A in air and water respectively. The concentration [g/m3] differences represent the oil phase equilibrium values and adjoining bulk phase background values.
A mass balance on component A in the slick requires the parallel loss rate by evaporation and dissolution equal the mass rate of change of A within the slick of volume,
Assuming the background concentrations in water and air are negligible, constant mass transfer coefficients, and substituting using the state variable X (t) followed by integration from initial slick conditions
Overall weathering constant, K[s−1], combines all the model constants and is defined as
Details on the mathematical derivation of the above equations appear in SM-2.
Thermodynamic properties appearing in Equation (5) are used to express the air to oil and oil to water equilibrium partitioning as follows: γA0 [−] is the activity coefficient of A in the oil,
This completes the theoretical model development task. Note that Equation (4) is the main result. Moreover, it provides the key equation representing the binary-model theory targeted for experimental verification. It tracks the time-series behavior of the composition of oil in the sea surface slick with values of X (t), the state variable. The evaporation time, t, is the independent variable. The X (t) variable is used for estimation of A and B concentrations in the oil, in addition to oil density and the respective fluxes to the atmosphere and water. These individual equations are located between Equations (1) and (2).
Negative slick buoyancy generally occurs when the density of the slick equals that of the surrounding water. Using the relationship for slick density,
with
where σ [dyne/cm] is the oil–water interfacial tension, g [cm/s2] is the acceleration of gravity, and VD [m3] is the volume of the drop. Clearly, Equations (4) and (6) provide the key testable result of the hypothesis representing the EVPO-SINK theoretical model. This aspect was tested in the laboratory.
Methods: B-Theoretical Model Evaluation
Model calculations using Equations (4) and (5) were made for simultaneous evaporation and dissolution processes to evaluate the general expected qualitative behavior of the final algorithm. It also projected expected outcomes of the forthcoming experiments. A list of the oil-like chemicals selected to formulate the “model oils” used in testing the conceptual model, and their physical and chemical properties appears in Table 1 (Green and Perry, 2008). These are needed for obtaining numerical values for the weathering rate constant, K, defined by Equation (5). The laboratory-scale slick surface area, S [m2], chosen was that of a 1-liter glass beaker; see Fig. 2A. A separate set of laboratory experiments were performed to measure the oil-to-air activity coefficients of the binary oil mixtures using an Othmer Still (See Supplementary Material, SM-2 for details). Based on experimental measurements the values for the activity coefficient of binary mixtures of benzene-ODB and hexane-ODB were determined to be approximately 5. Cyclohexane-ODB mixtures resulted in a value of 7. These values are contradicted by the group contribution method, which predicts the values as near 1 (Fredenslund et al., 1975). The reason for the differences is unknown. Since the experiments were reproduced several times, value of 5 for the activity coefficient was decided as the best approximation and subsequently used for all model calculations.
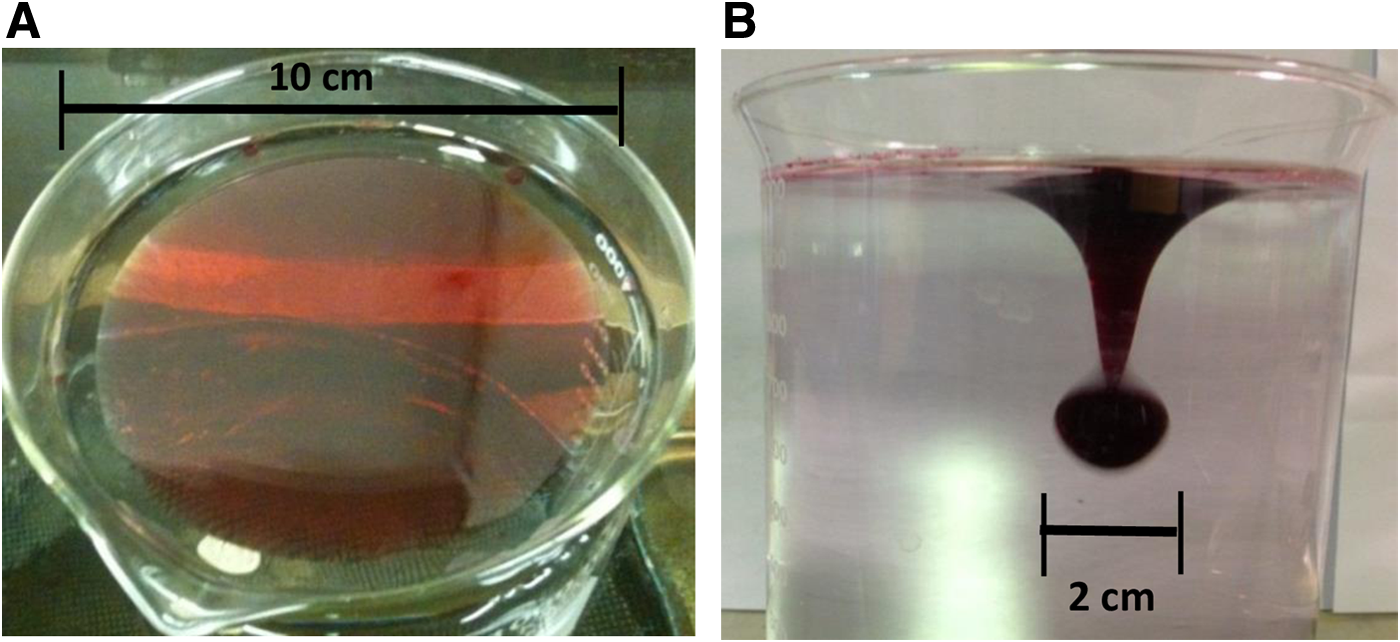
Model oil consisting of a binary mixture of benzene and 1,2-dichlorobenzene undergoing the Evaporation/Sinking process in fresh water.
Computations using Equation (5) for the rate constant revealed that the evaporation group, the one containing vapor pressure, is much larger numerically than the dissolution group. The computed evaporation-to-dissolution group ratios for hexane, cyclohexane, and pentane were 9400, 800, and 4500, respectively, and 26 for benzene. These were obtained using mass transfer coefficient values representative of water at the sea surface. These model results support the conclusion that dissolution is negligible compared to evaporation when both occur simultaneously, as was shown by others (Boehm et al., 1982; French-McCay, 2004). It should be noted that dissolution only experiments performed with benzene/1,2-dichlorobenzene(ODB) mixtures resulted in a time period over 100X longer than the evaporation experiments (Stevens, 2014), thus supporting the model result that dissolution is a much slower weathering process than evaporation. From this point onward the evaporation process is featured.
Theoretical time-series calculations were performed as a numerical experiment to track the behavior of both volatile and nonvolatile compositions plus the slick mass density as evaporation proceeded; see Fig. 3. The volatile component overall air-side mass transfer coefficient, KA [m/min], was approximated based on published correlations (Thibodeaux, 1996; Gulliver, 2011). A value of KA=0.27 m/min was used for benzene and represents typical sea surface wind velocity conditions that make evaporation much faster than the laboratory measurements. Based on the initial mixture volumes, the state variable Xo=4.0 and X (t) in Fig. 3 decreases with increasing time; it terminates with a value of 1.57 at 195 s. This final value is the weathering time, τs [s], for the slick density to achieve the critical value that occurs at
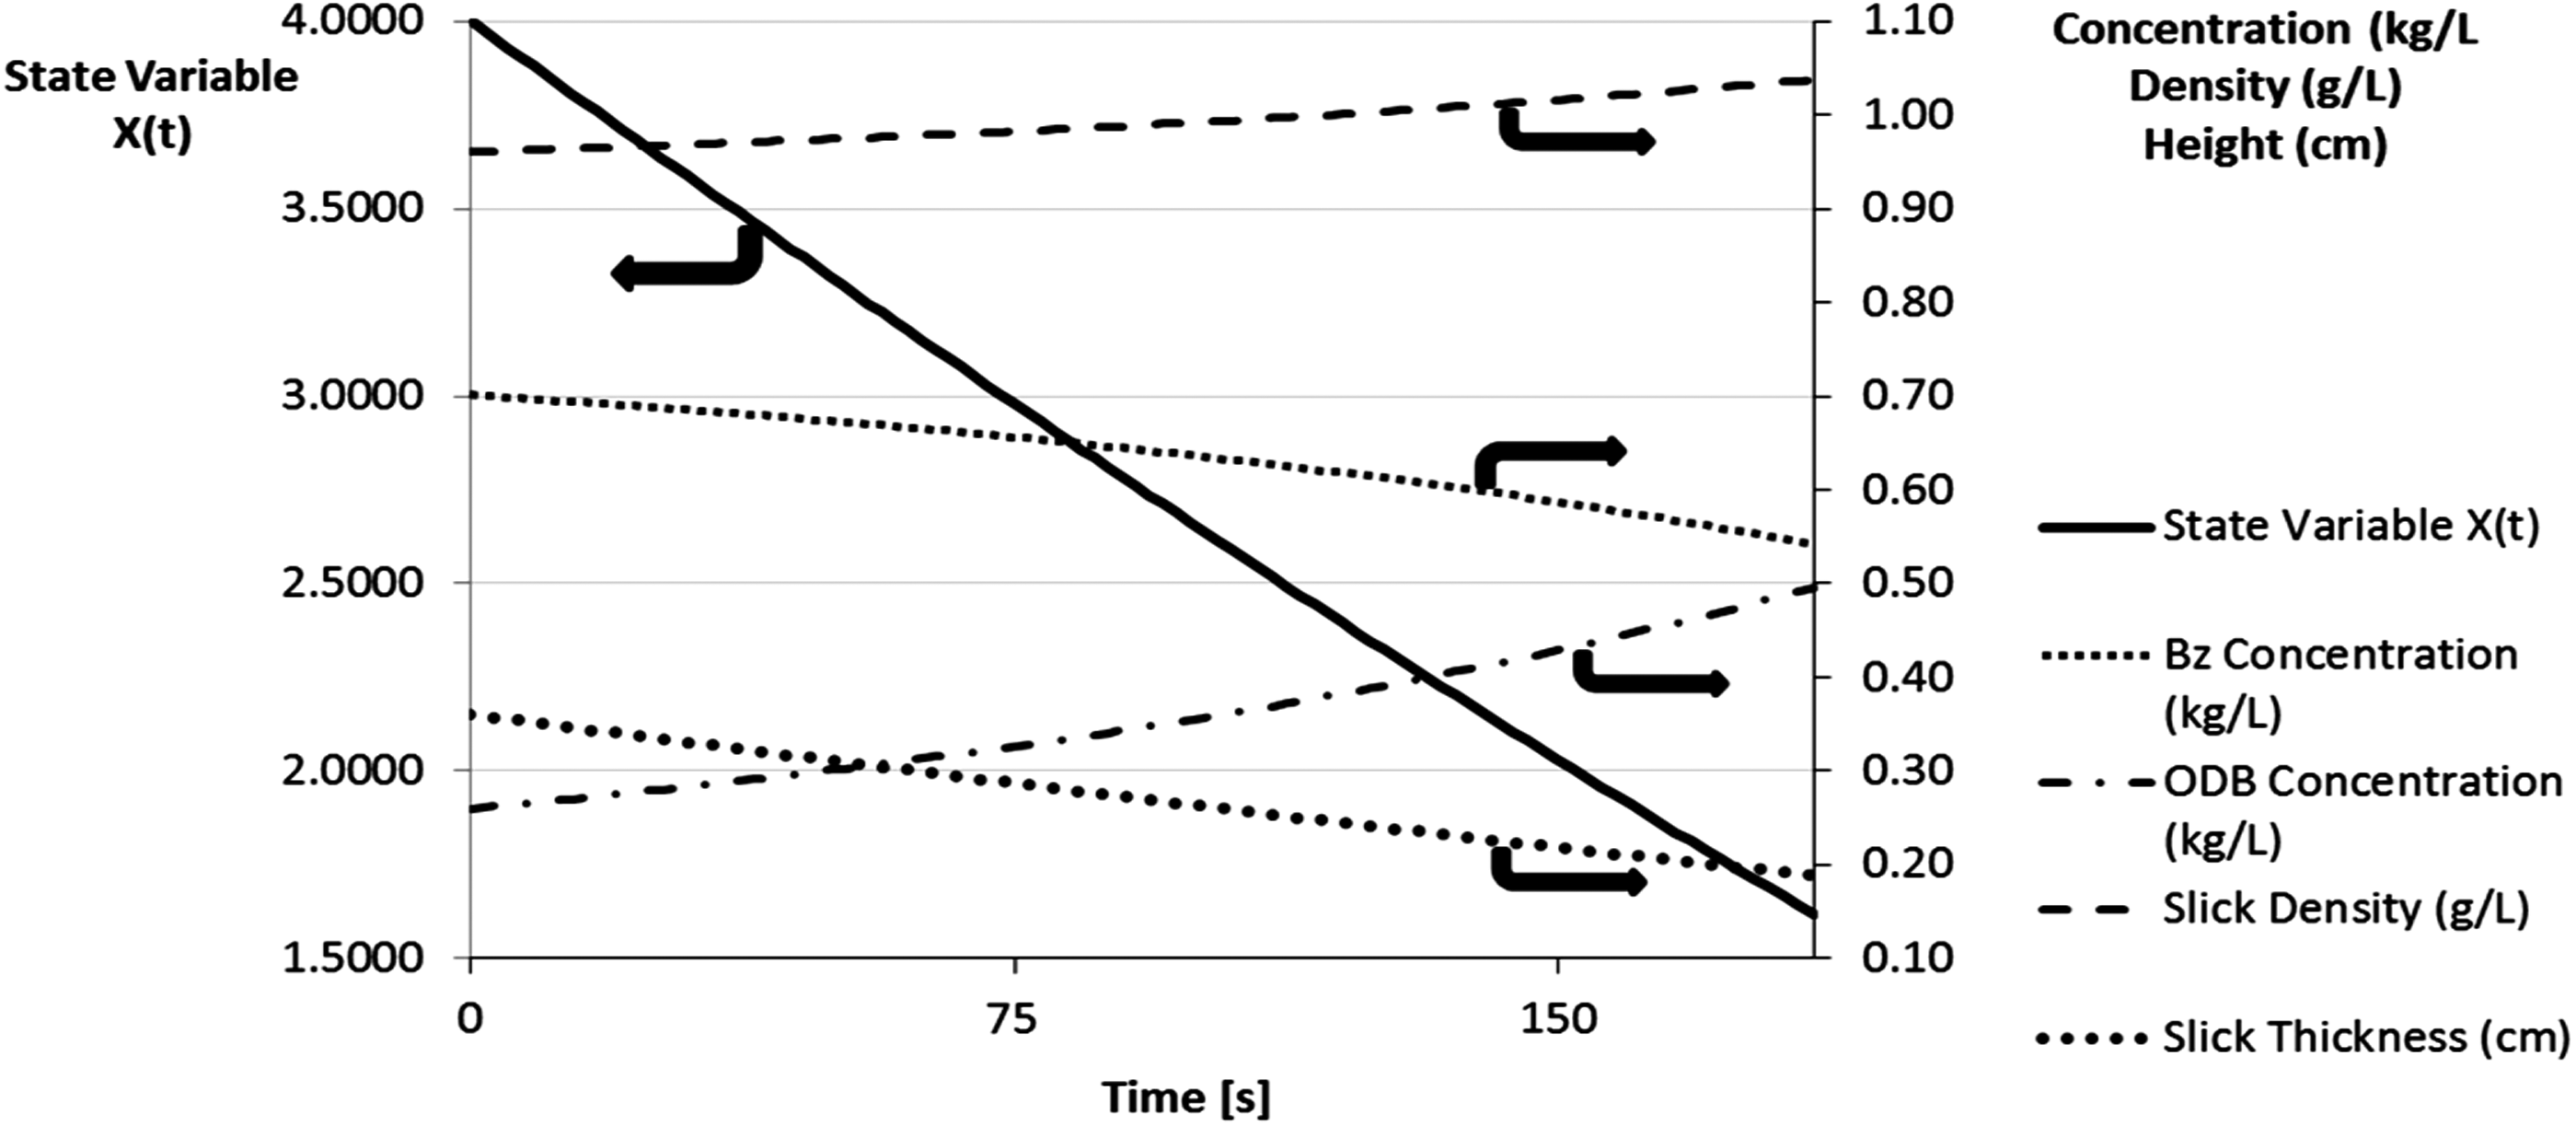
Numerical calculations performed with the theoretical binary model for a hypothetical, “model oil” slick, floating on fresh water and undergoing the EVAPO-SINK process. Displayed graphically is the projected time-series behavior for a benzene-ODB mixture. The five plotted line traces include the model state variable X (t), it decreases in magnitude from initial value of 4.0 and ends at 1.6. At a time of 195 s the residual fraction of model oil disappears below the surface. With X (t) known the other four variables can be obtained. Benzene, the light/volatile, decreases while the heavy/semi-volatile ODB increases. Also shown is slick density, it increases with time. At value of 1.04 g/mL the slick sinks. The slick thickness also decreases, while surface area remains constant.
At this time in the evaporation process an oil droplet forms underneath the slick and falls downward. Before this time the slick density increases with time, as does the concentration of ODB, the heavy component. The light component concentration, slick volume, and slick thickness decreases with time. These projected results, displayed graphically in Fig. 3, confirm one's intuition concerning the expected time-series behavior of the dependent variables of the binary oil mixture.
At this juncture an initial determination addressing the question “Where does all the oil go?” can be proposed. Using the model for a hypothetical oil made of a volatile component and a nonvolatile component, the volumes of four subfractions of the spill can be estimated as follows. The initial volume spilled or placed on the surface is a known value,
There are two alternative scenarios in which only three subfractions are formed. One is the case where the density of the heavy, nonvolatile fraction,
This completes the development of the theoretical binary model for potential use on sea surface oil slicks. The unique feature of this weathering algorithm, compared to traditional equations, is oil droplet sinking. In addition, it provides a means for estimating the subvolume oil fractions produced as a result of weathering on the surface.
Experimental Methods
Experiments were designed to test the validity of the proposed theoretical model. “Model oils” rather than actual oils were used at this proof of concept stage. Binary mixtures were formulated using two pure, oil-like chemicals; see Table 1 for their physical properties. The volumes of each chemical were selected so that the mixture's initial density was less than fresh or salt water, ranging from 0.96 to 0.99 g/mL. Both 1-chloronaphthalene and ortho-dichlorobenzene (ODB) were used as the nonvolatile, heavy component. Although they are semi-volatile, their vapor pressures are over 100 times lower than the volatiles. Benzene, hexane, cyclohexane, toluene, 1-chlorobutane, and pentane were used as the volatile, light component. A small quantity of Oil Red O dye was added to the clear mixture for better observation of droplet growth and sinking. To ensure consistency 100 mL batches were prepared and initial composition analyzed by GC before spilling.
The evaporation-sinking (E-S) apparatus used for simulating surface oil spills was a simple device. The individual experiments began with the placement of a 20 mL mixture on the surface of a beaker containing 1 L fresh or salt water with 30 0/00 salinity. Thirty grams of salt was dissolved in 1 L of distilled water, resulting in a measured density of about 1.012 g/mL. The E-S apparatus was kept in a water bath at a constant temperature (28°C±1°C) and evaporation was performed in a laboratory fume hood. The blower speed was set on an “entering slit-flow” air velocity of 80 ft/s, however, anemometer readings above the slick surface were below its detection limit. Fluttering paper strips confirm the presence of a low, horizontal wind velocity above the slick. With the blower off no fluttering occurred and this confirmed a calm/stagnant air condition.
The mixture was poured directly on the surface of the water where a uniform thickness of floating oil [aka, slick] was produced (Fig. 2A). As weathering occurred, the slick began to sag downward as a dense pendulous volume formed underneath. When the critical density was reached, the sagging pendant-drop broke off from the slick underside and settled toward the bottom of the beaker (Fig. 2B). In each experiment, the time required for the droplet to fall was recorded and defined as drop-time, τs. A pipette was used to retrieve the cumulative on-bottom mass and measurements of volume, density, and composition performed. Total drop volume was measured directly using the retrieving pipette. Density of the drop was determined by transferring a sample of the drop to a 1 mL volumetric vial and measuring it's mass with a Mettler Toledo (AB104) balance.
Initial and final mass compositions were determined by gas chromatography. A small sample of the drop was transferred to a 2 mL Agilent vial with a septum cap. Samples were manually injected for testing in a Hewlett Packard HP 5890 series GC. A flame ionization detector (FID) and capillary column were used in the GC. Composition was determined using a four point calibration curve with each calibration sample tested in triplicate.
Results and Discussion
Model evaluation calculations confirmed the theoretical equations displayed correct time-series behavior patterns for the five dependent variables. Figure 3 displays the slick density increasing with increasing evaporation time. This is the key dependent variable that drives droplet sinking and reflects the decreasing volatile concentration and increasing nonvolatile concentration. Verifying this behavior by measuring the evaporation time period for sinking, τs, as required by Equation (8) was the primary test objective in the experimental protocol. A total of 58 experiments were performed using nine binary mixtures aimed at observing the sinking process and obtaining τs values experimentally. The data collected before each experiment were the initial slick composition. This yielded X0 values, the state variable at the beginning of the evaporation/sinking process. The evaporation process was allowed to proceed with the surface-slick undisturbed. When the water surface was oil-free the time, τs, was recorded and the on-bottom oil was collected. Total droplet volume and mass were measured. Density measurements were performed on the collected on-bottom material. Gas chromatography procedures, noted previously, quantified the volatile and nonvolatile density within the sample. These data appear in Table 2.
NA, not available.
Benzene-ODB mixtures required approximately 1300 s to sink in fresh water; while hexane and cyclohexane drop times in fresh water were 200 and 600 s, respectively. With 1-chloronaphthalene (1-CNAP) as the heavy component, drop times of 1100, 700, and 2400 s were observed for benzene, 1-chlorobutane, and toluene, respectively. The highly volatile pentane-ODB mixtures sank quickly, with droplets forming during the oil pouring process. This made recording the drop-time very problematic. The model theoretical drop time for pentane is 50 s. This was the approximate time needed to transfer the mixture to the E-S device for testing.
Graphical displays of the evaporation-sinking process kinetic data appear in Fig. 4A, B, where slick density is shown to increase with evaporation time. Figure 4A is for mixtures with ODB as the heavy component and Fig. 4B is for 1-CNAP. The terminal τs values for each experiment are displayed, so is the terminal slick density. The initial densities of binary mixtures appear in Table 2 column 3. Superimposed on the data in both figures are nonlinear, convex lines that represent the theoretical model best fit. These lines start at t=0 with the initial slick density and end at the terminus point with critical density, ρc, at t=τs. For benzene in ODB both the fresh and salt water results appear. Although some numerical variation occurred in the measured critical density, the differences were in the third significant figure with all values approximately 1.04 g/mL for fresh water and absolute errors±2%. This value is slightly larger than the density of the fresh water at 28°C, 0.996 g/mL (Green and Perry, 2008). Benzene-ODB mixtures required 1550 s and a density of 1.068 g/mL to sink in salt water. The overall behavior displayed in Fig. 4 is consistent with the theoretical model weathering time in Equation (8) and the theoretical calculations in Fig. 3.
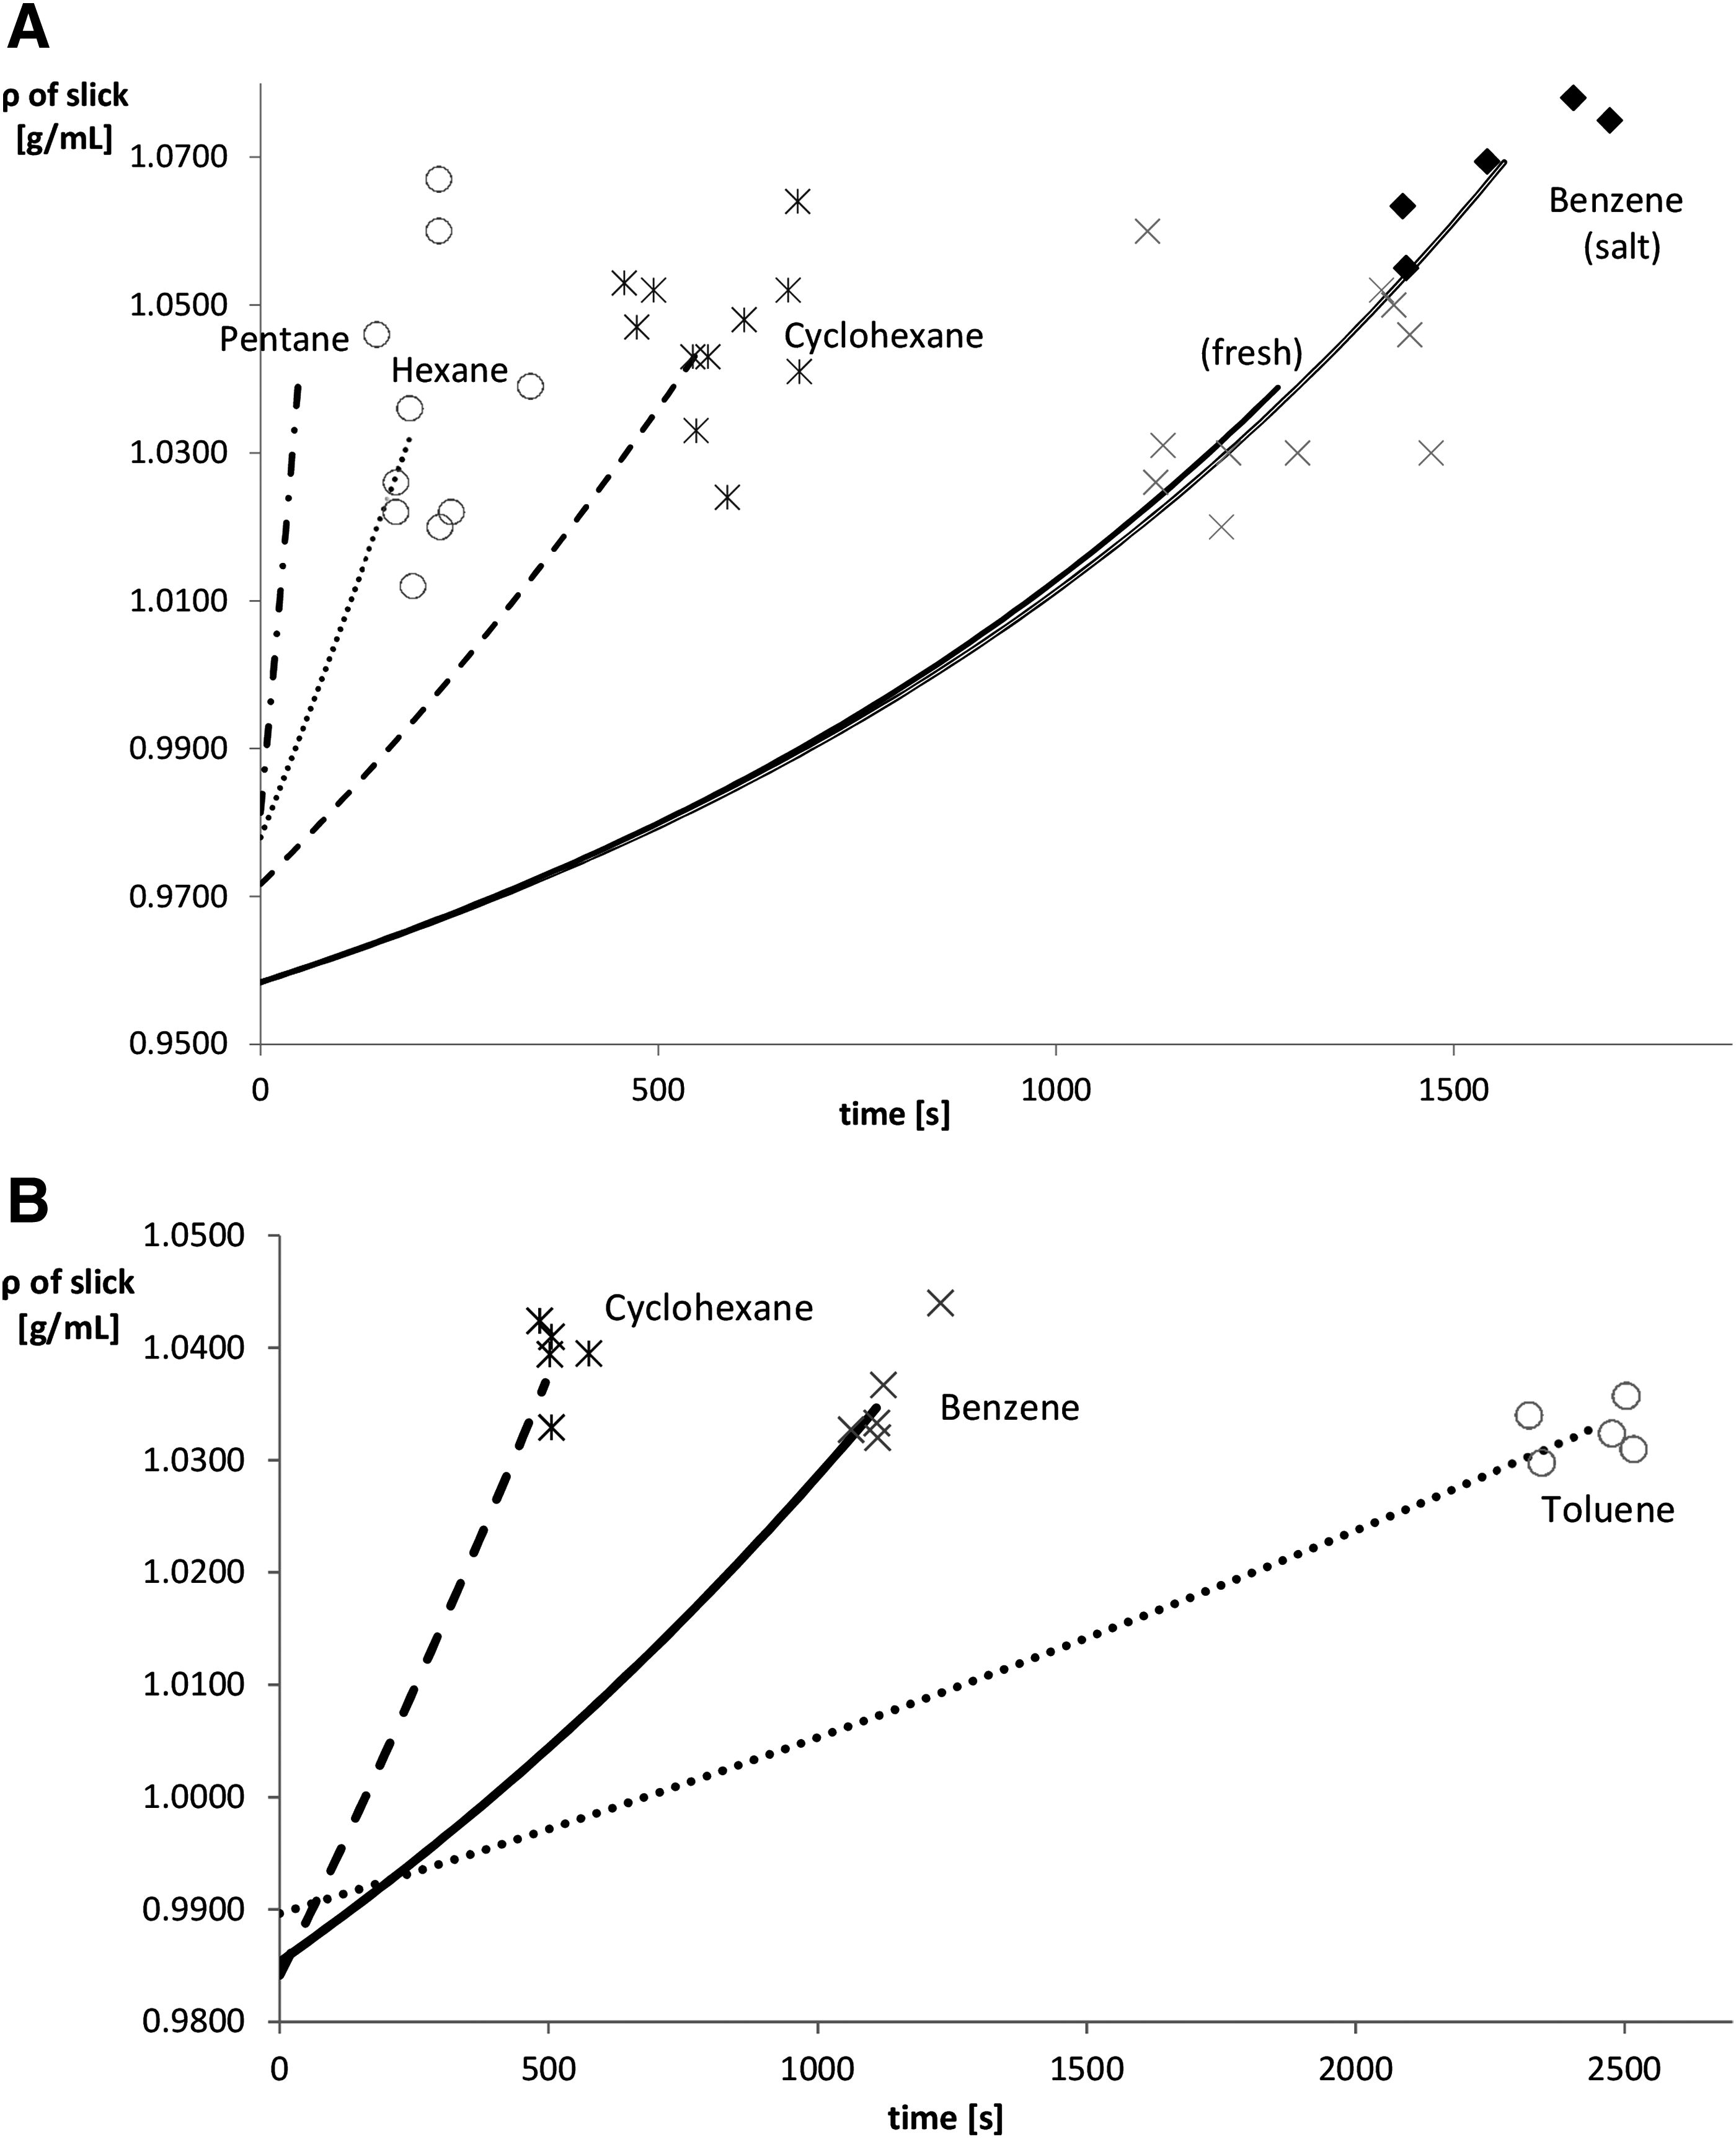
Fitted values for the overall air-side mass transfer coefficient, KA [m/s], the single adjustable parameter, appear in Equation (5). Using Equations (8) and (5) with evaporation produces each best-fit curve shown in Fig. 4. The KA values reflect evaporation at low wind conditions, such was the case in the E-S apparatus. The model fitted values appear in column 7 of Table 2. It appears that the blower wind speed setting produced ventilation and a range of air-side mass transfer coefficients on the low end of typical seas surface conditions (Boehm, 1982; MacKay and Yeun, 1983). Trials performed with the blower off resulted in significantly higher evaporation drop times; for Hexane-ODB the average time was 500 s, more than double the value with the fan on. This suggests that without fresh air moving through the fume hood, volatile accumulation in the headspace above the E-S apparatus retards the evaporation rate.
With measured values of critical density, listed in Table 2 column 6, fresh water density and droplet diameter obtained from on-bottom measured volume, the surface tension of the mixture could be obtained using Equation (7). These values appear in Table 2 column 8 and are in agreement with previously reported measurements (Lam and Benson, 1970). This indicates that the light component evaporation process must continue, producing a droplet with density greater than the surrounding water so as to overcome the oil-water interfacial tension force attaching it to the underside of the slick.
Theory dictates that volatile component vapor pressure is the primary factor determining the evaporation rate of the binary mixture (Ghiassi et al., 2012) and it appears prominently in the kinetic parameter K, where Equations (5) and (8) can be combined and simplified to give the relationship
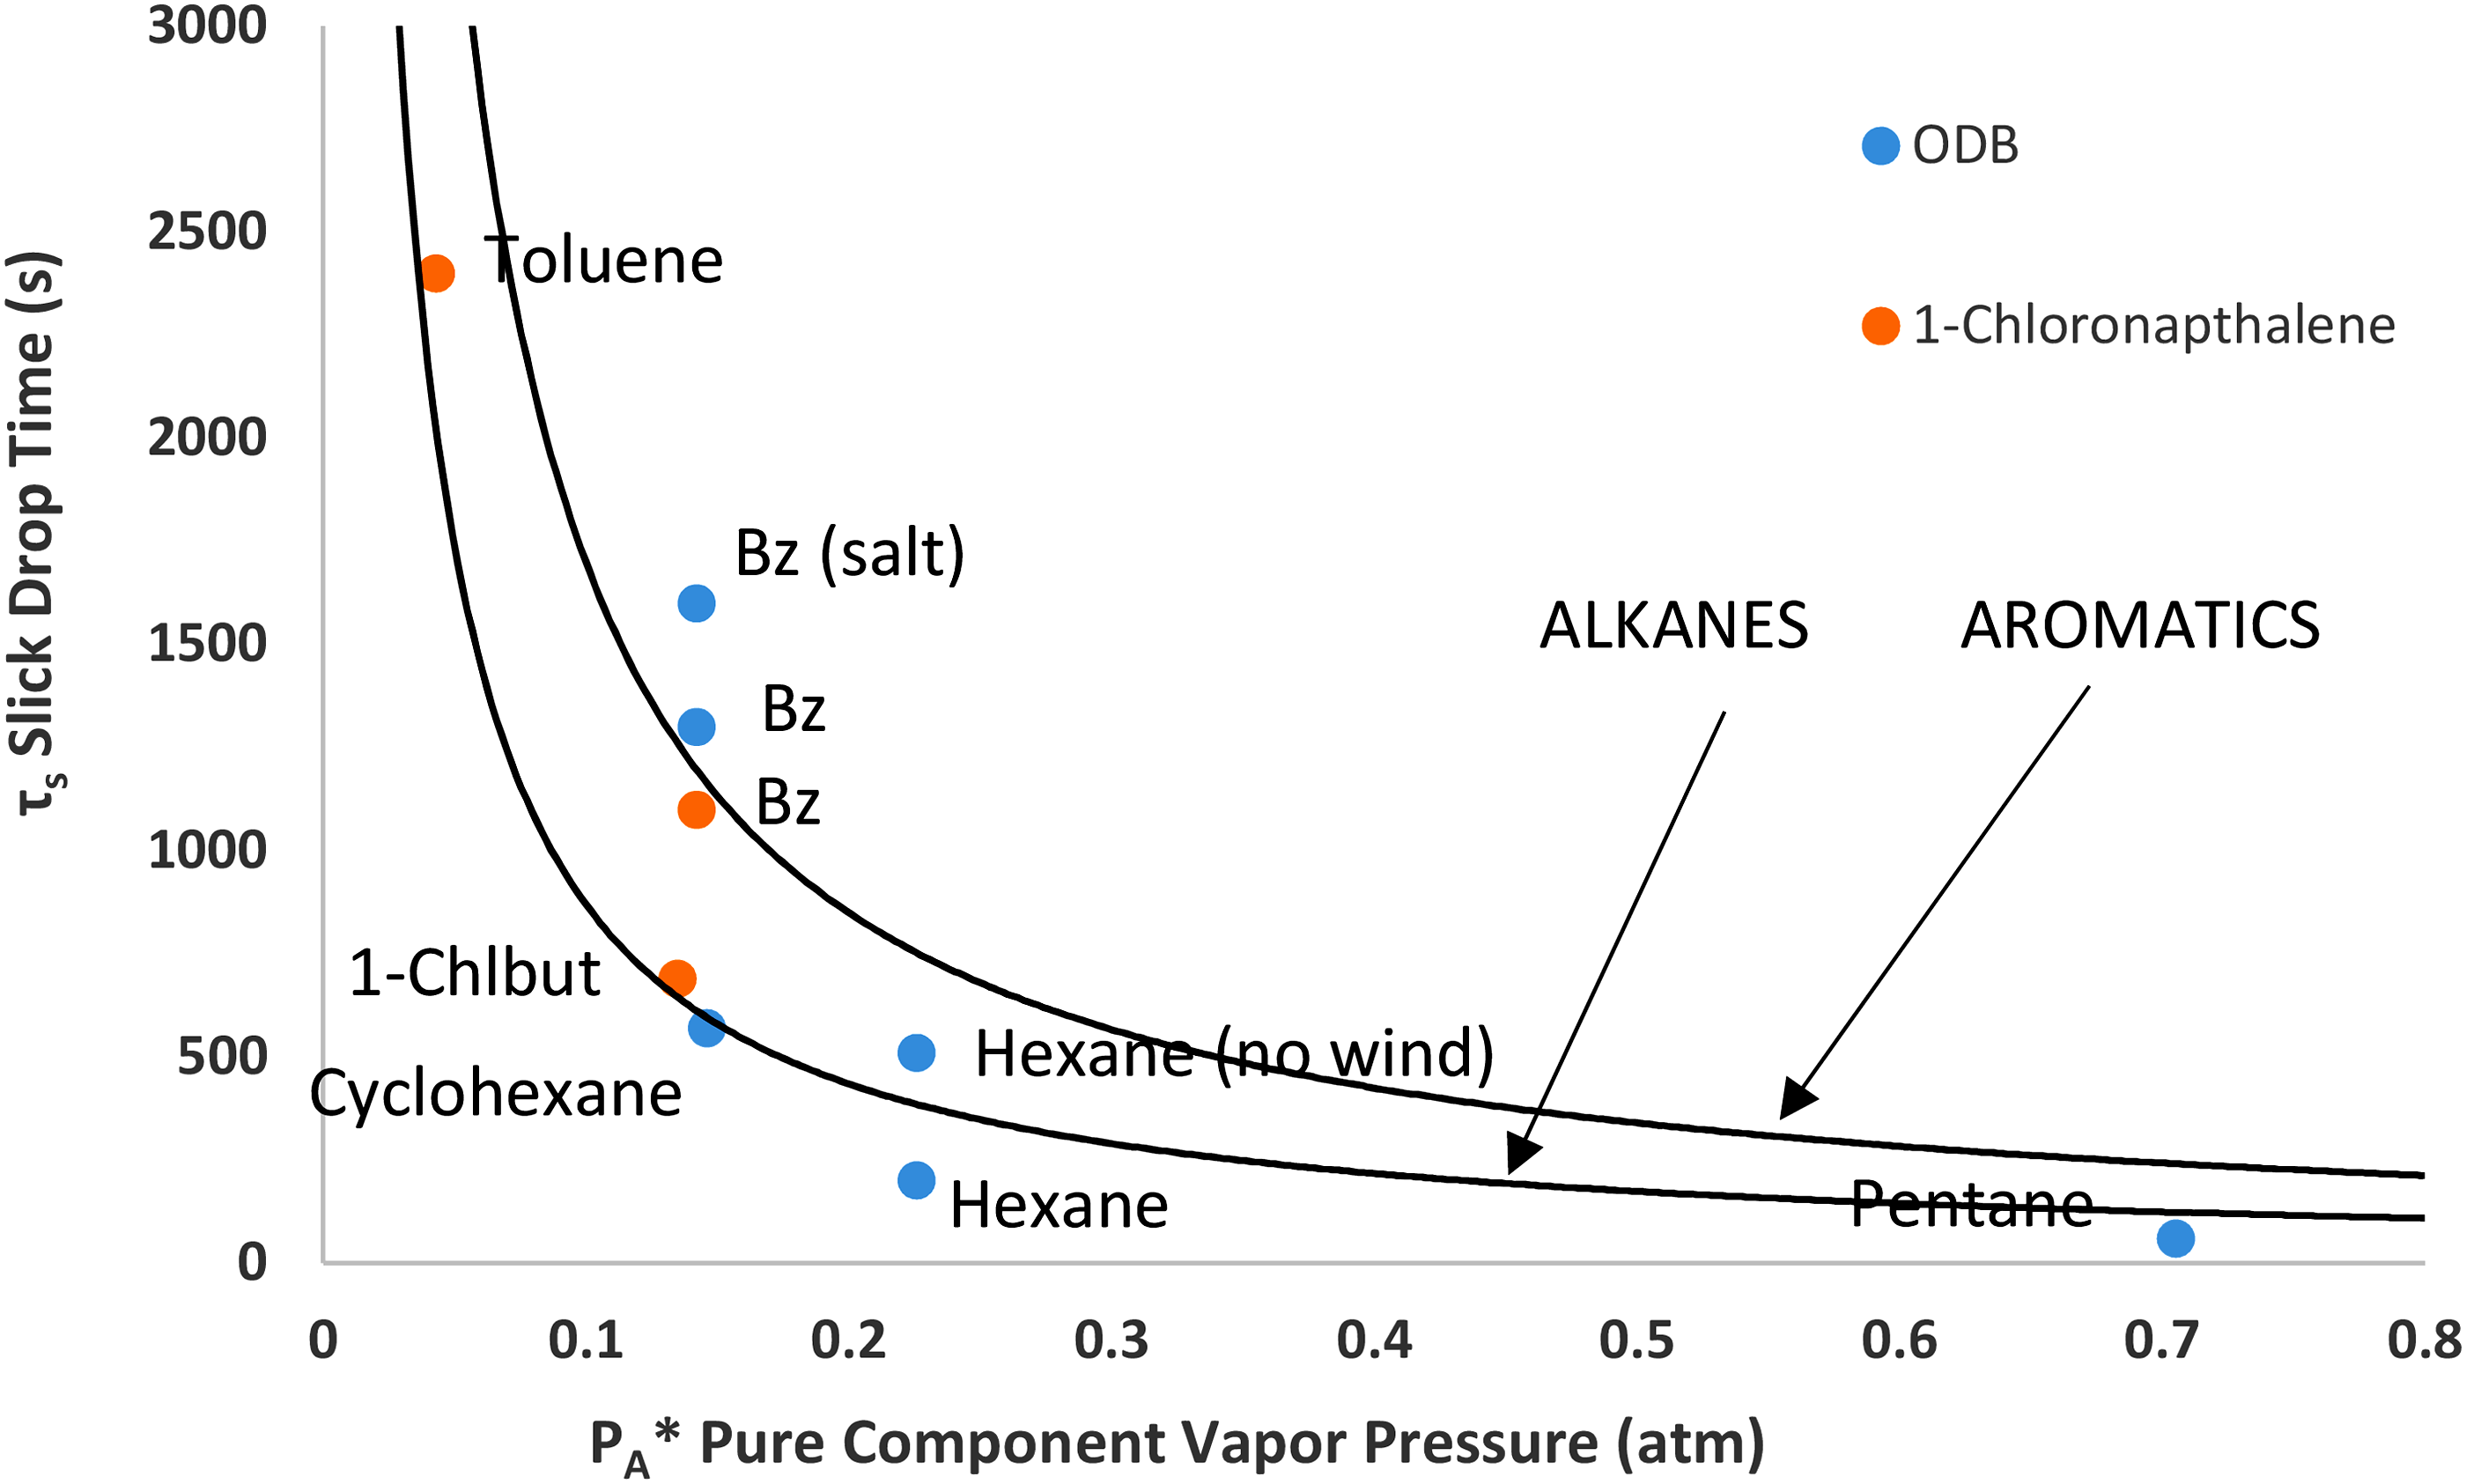
This graphical display contains experimental data and theoretical model trend lines. Simply put, the theory maintains that the evaporation time lapse for oil droplets to sink below the water surface varies inversely to the vapor pressure of the light component. Two theoretical trend lines capture the behavior of the data. The upper line is for the aromatics and the lower is for the alkanes. The more volatile alkane droplets fall at shorter evaporation times than the aromatic droplets.
Closure and Implications
Oil spills will likely occur with increased frequency as drilling and production continues to move into deeper waters. Conventional wisdom maintains that oil floats naturally and much is known about surface spills, however, the presence of on-bottom oil is often reported (Wilson et al., 1986). Co-settling of oil with suspended solids in the water column is, by conventional wisdom, the presumed process explaining oil appearance on the sea bottom for surface spills that occur near shore in shallow waters. For offshore spills in deep water, copepod fecal pellets and marine snow settling is targeted and presumed to play a similar role delivering oil onto the sea bed. This study makes the case that unaided by other settling particles, natural mineral oils with the correct mix of light-to-heavy components may offer another pathway for surface-spilled oil to appear on the sea floor.
Crude oils are known to have a significant fraction of high density hydrocarbons consisting of asphaltenes and other high molecular weight components. Increased concentration of these, by evaporation and solubilization of the light fraction, will produce a non-neutral buoyant droplet that remains suspended in the water column or sinks to the ocean floor. Proof of concept experiments were specifically designed to demonstrate heavy residue sinking would occur under the right condition. The proposed light-heavy binary model provides a theoretical approach for including this alternative process, thus producing a more robust estimation procedure for quantifying the amount and assessing the fate of surface-spilled oil in the marine water and helping answer “Where does all the oil go?” It extends earlier models to include buoyancy directly so as to aid in identifying the oil fractions that will stay afloat, remain suspended, and sink.
The issue of this study was the initiating event of the oil fractionation processes. In effect it addresses the short-term fate, which is dominated by transport. The ultimate or long-term final fate of the four subfractions produced by the EVAPO-SINKING process is an extremely broad subject and beyond the scope of this article. Long-term fate is dependent upon the specific mechanisms and rates of the subsequent individual weathering, reaction, etc. processes. However, they are all subsequent processes and must by necessity follow some initiating event that produces multiphase fractions.
This binary mixture model highlights the means by providing a first principle, simple theoretical structure for such an initiating approach, making it possible to quantify when and how much (i.e., volume) of each phase fraction is produced. It does so using a simple and transparent binary component, volatile (A) and nonvolatile (B), model to estimate the density and weathering time required to produce droplets from an oil slick due to evaporation at the surface. The model and experiments demonstrate that four fractions of oil are initially produced. Although simple in mathematical structure, the model captures the combined evaporation-sinking process. Tested in the laboratory with model oils, the proof of concept was demonstrated. In addition, it provides the fundamental theoretical approach with experimental protocols for taking the idea to the next level using multicomponent mixtures and mineral oils.
The linkage of the development placed in the context of oil spill transport mechanisms
The ocean surface sea state physics plays a major role in both the evaporation and dissolution weathering of oil on the sea surface. Specifically, oil as a floating surface slick will be transformed into submerged droplets. Likely in a natural environment slick, formed and existing, during calm winds with no breaking waves, the evaporation-sink behavior will be similar to the laboratory experiments where weathering is evaporation dominated. Dissolution from the underside of a slick is extremely slow in comparison. During active, but mildly turbulent sea-states, the physical processes will break up the floating slick layer and force some droplets below the surface where dissolution occurs. Likely some droplets will resurface and coalesce into slick patches where evaporation can restart. With the next slick breakup event the process continues. Violent, deep-plunging surface waves will produce droplets of small diameters, some of these droplets may never resurface. Clearly, the drop size distribution produced below the sea surface is an important factor for the process. Dissolution below the surface will decrease the diameter and buoyancy so as to hinder their rapid return to the surface. Droplet dissolution mass transfer area per unit volume of oil under water is very high for the very small, in comparison with the mass transfer area per unit oil volume for a floating slick. So, mass transfer rates for on-surface evaporation and below surface dissolution may be comparable. Clearly, at the sea surface, weathering of oil is a very complex process that involves both evaporation and dissolution. Obtaining experimental data and observational information concerning dissolution-sinking is a necessary next step for understanding and quantifying the total oil spill weathering processes that occur both on and below the sea surface.
How the approach could be applied to crude oil solutions?
The first principle approach, although applied to simple mixtures, is also applicable to crude oil solutions. The link is the binary mixture theory. Oil solutions are much too complex to consider all the chemical components. Typically, the practice is to create five to eight pseudo-components that reasonably represent the physical and chemical properties of the oil solution. These properties include molecular weight, density, interfacial tension, vapor pressure, solubility, reactive decay, and so on. Average properties for the pseudo-components are computed for the five to eight mole fractions. As activity coefficients play a role in quantifying nonideal molecule interactions for the individual chemicals in mixtures, it is assumed to do so for mixtures of pseudo-chemicals. Based on the light-to-heavy component composition distribution of the particular oil density profile for the equivalent pseudo-component mole fractions are categorized. Based on these a pseudo binary mixture, one consisting of a volatile/light (component A) and a nonvolatile/heavy (component B), can be formulated. With it so designated the binary mixture theory model applies and the equations presented above are used directly and unchanged.
However, there remains the issue of how well the pseudo-component concept works in representing oil solutions undergoing evaporation when formulated from known tertiary and quaternary pure chemical mixtures. Studies comparing the exact tertiary and quaternary mixture evaporation-sinking model results with their pseudo-component equivalents have apparently not been tested.
Footnotes
Acknowledgment
The Cain Department of Chemical Engineering and Gulf of Mexico Research Institute (GOMRI) provided all financial resources for the work. Several undergraduate students provided valuable service doing experiments, reviewing the literature, making computations, etc. They include Katrina Rickels, Jessica Owens, Ta'Ryan Lloyd, and Steven Nguyen.
Author Disclosure Statement
No competing financial interests exist.
References
Supplementary Material
Please find the following supplemental material available below.
For Open Access articles published under a Creative Commons License, all supplemental material carries the same license as the article it is associated with.
For non-Open Access articles published, all supplemental material carries a non-exclusive license, and permission requests for re-use of supplemental material or any part of supplemental material shall be sent directly to the copyright owner as specified in the copyright notice associated with the article.