




Abstract
Abstract
A kinetic model was developed to describe the Cr(VI) reduction with acetate biodegradation by Escherichia coli 33456 in a fixed film reactor. A laboratory-scale column reactor was used to verify the model system. Batch kinetic tests were independently performed to determine biokinetic parameters used in model simulation. With assumed values of initial biofilm thickness (Lf0), the mathematical model simulated well experimental results for effluent concentrations of Cr(VI) and acetate, suspended E. coli cells, and Cr(III) production. The concentration of suspended E. coli cells reached 11.4 mg cell/L while the thickness of attached E. coli cells was estimated to be 27.8 μm at a steady state condition. At steady state, removal efficiencies of Cr(VI) and acetate were about 92% and 90%, respectively, under influent Cr(VI) loading rate (11.3 g/[m3·day]) and acetate loading rate (664.4 g/[m3·day]) at a hydraulic retention time of 10.7 h, while the effluent concentration of Cr(III) was ∼1.65 mg/L. The kinetic model not only provided insights into underlying mechanisms of Cr(VI) reduction with acetate biodegradation but also can be used as a powerful tool to assist in the design of pilot-scale or full-scale biofilm processes to treat Cr(VI)-containing wastewater.
Introduction
C
Conventional chemical treatment involves reduction of Cr(VI) to Cr(III) by adding a reducing agent under low pH (2–3) conditions and subsequent adjustment of solution pH to near neutral pH ranges to precipitate Cr(III). Unlike the conventional chemical treatment methods for Cr(VI) reduction, biological treatment processes do not require the addition of costly chemical agents for pH adjustment, and therefore, may provide an attractive alternative to the existing technique for Cr(VI) removal (Wang and Chirwa, 1998). The ability of some microorganisms to reduce highly soluble and toxic Cr(VI) to less toxic and soluble Cr(III) has been reported (Lovley and Phillips, 1994; Wang and Xiao, 1995). Previous work has shown that a Cr(VI)-reducing strain, Escherichia coli ATCC 33456, has the ability to reduce Cr(VI) under both aerobic and anaerobic conditions and that anaerobic Cr(VI) reduction proceeded at a higher rate than aerobic activity (Shen and Wang, 1993; Wang and Shen, 1997). They demonstrated the ability of Cr(VI) reduction by E. coli ATCC 33456 in the batch tests. However, relatively few efforts have been directed toward the development of fixed biofilm process to treat Cr(VI)-containing wastewater, mainly due to insufficient knowledge about the kinetics of Cr(VI) reduction from a non-steady-state to a steady-state condition in a continuous flow fixed biofilm process.
To optimize design and operation of fixed biofilm process for Cr(VI) reduction, a thorough understanding of the kinetic characteristics of microbial transformation of Cr(VI) is needed. The aim of this work was to evaluate the performance of Cr(VI) reduction using ceramic particle as a supporting medium in a fixed E. coli biofilm reactor. A kinetic model system has been developed based on the mechanisms of diffusive mass transport and dual-Monod kinetics (Guha, 2004). The model was verified using the column experiments for Cr(VI) reduction by E. coli cells. The effluents of Cr(VI) concentration and Cr(III) production were evaluated and compared by modeling and experimental results. In addition, the growth of attached and suspended E. coli cells was determined during the continuous flow column test. Furthermore, the flux of Cr(VI) into biofilm and concentration profiles of Cr(VI) at different operation times were also evaluated.
Kinetic Model
Biofilm model
Several biofilm kinetic models have been developed to describe process performance for adsorption and biodegradation in the reactor (Ying and Weber, 1979; Speitel et al., 1987; Kim and Pirbazari, 1989) Monod kinetics was used to describe the behaviors of biodegradation. They found that adsorption is the dominant removal mechanism during the initial phase of adsorber operation, but in the later stages biodegradation controls the steady-state effluent concentrations. In our study, the kinetic biofilm model only incorporates the mechanisms of liquid film diffusion and dual-Monod kinetics for Cr(VI) reduction with acetate biodegradation. Since a ceramic particle is a nonadsorbing supporting medium, the mechanisms of adsorption and intraparticle diffusion were not considered in this kinetic model system.
Reaction stoichiometry
The reaction stoichiometry of simultaneous Cr(VI) reduction and organic acids (as acetic acid) utilization by E. coli cells in an anaerobic fixed biofilm reactor is suggested as follows (Chirwa and Wang, 2000):
Based on the above reaction stoichiometry, acetate was used by E. coli cells for growth and served as electron donor for Cr(VI) reduction while Cr(VI) was served as the terminal electron acceptor (Wang and Chirwa, 1998; Guha, 2004). Thus, the E. coli cells degraded acetate to bicarbonate and reduced Cr(VI) to form Cr(III).
Model assumptions
To model the kinetics of Cr(VI) reduction with acetate utilization by E. coli cells, the following assumptions are made: (1) a stagnant layer covers the biofilm; (2) Cr(VI) and acetate are transported from bulk liquid to biofilm phase through the stagnant-liquid layer by molecular diffusion (Speitel et al., 1987); (3) biofilm growth does not affect the flow pattern of liquid in the reactor; (4) the ceramic particles are spherical in shape; (5) the biofilm is homogeneous and the density of the biofilm is constant (Speitel et al., 1987; Kim and Pirbazari, 1989); (6) there is no adsorption on ceramic particle; (7) no inhibition on E. coli 33456 occurred from Cr(VI) concentration; (8) both Cr(VI) and acetate for mass transfer phenomenon in biofilm are dominated by diffusion based on Fick's law (Kim and Pirbazari, 1989); and (9) dual-Monod kinetics was applied, where Cr(VI) is the electron acceptor and acetate is the electron donor (Guha, 2004). Figure 1 shows the conceptual basis of Cr(VI) and acetate concentration profiles distributed in biofilm on ceramic particle.
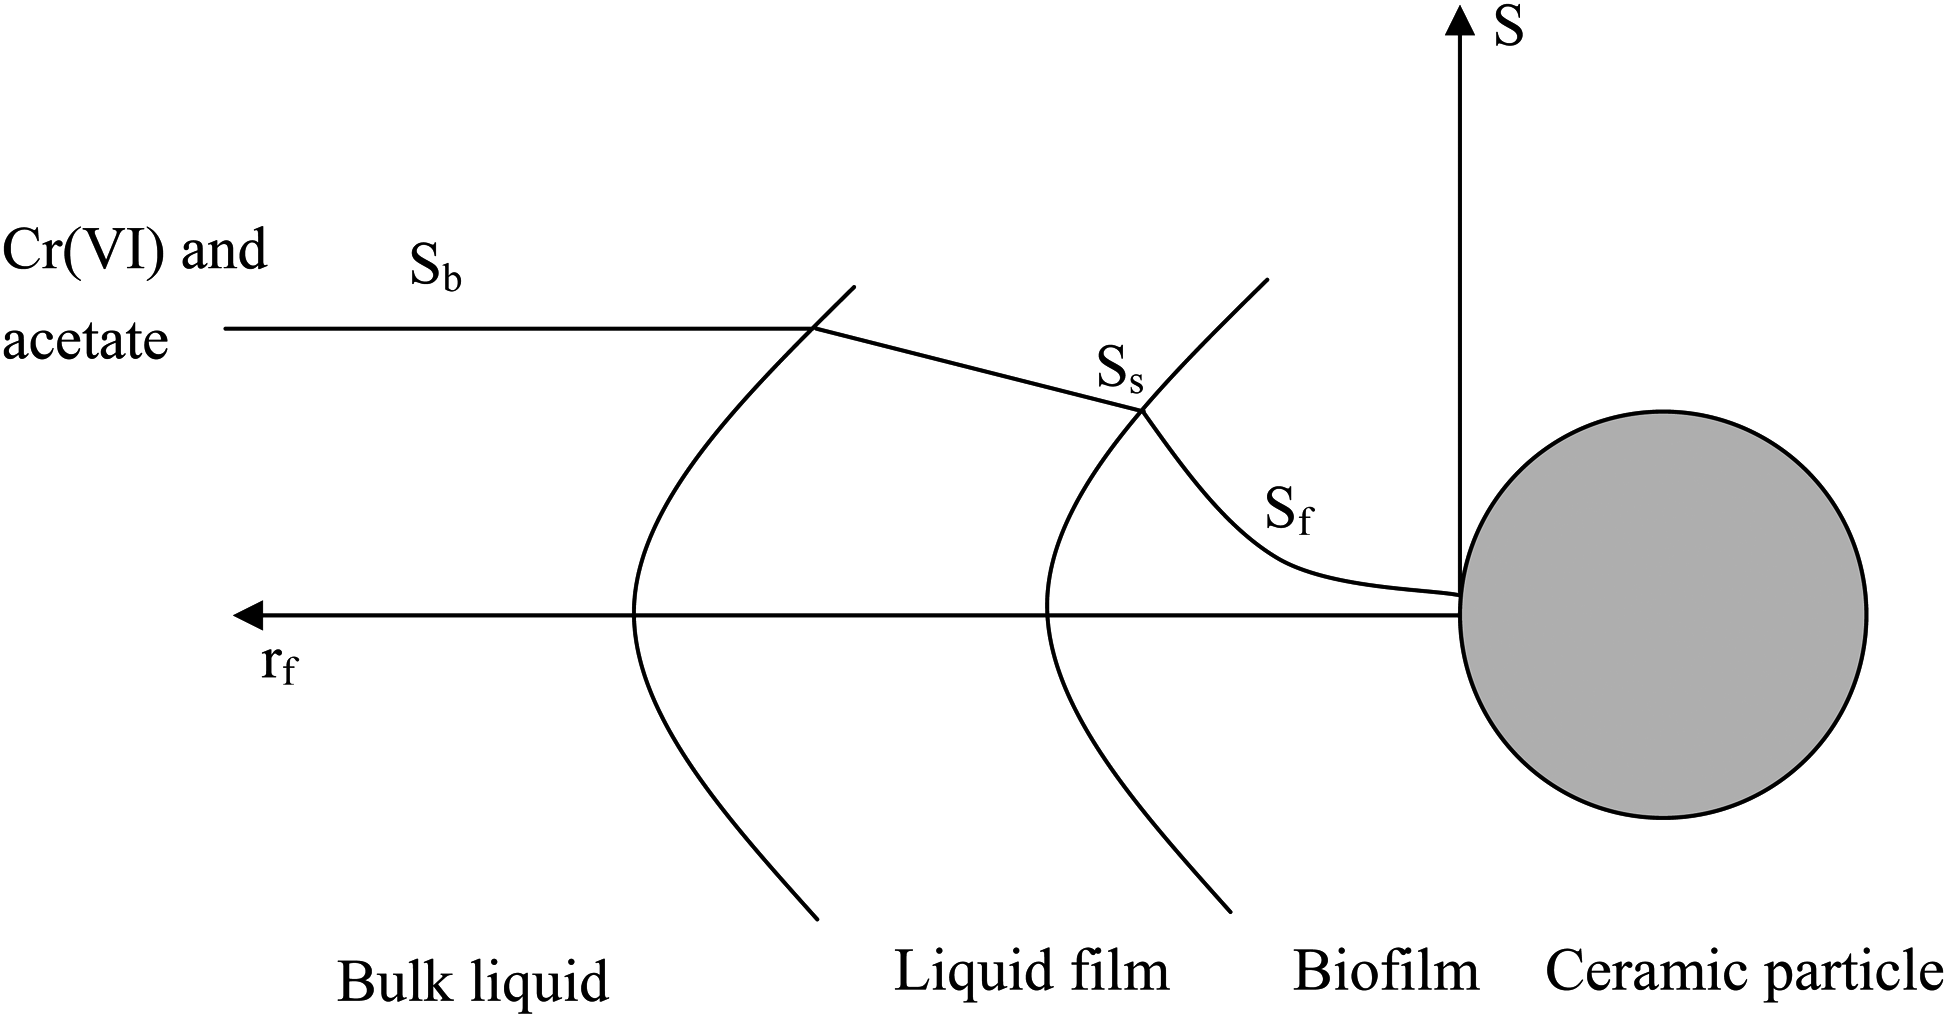
Conceptual basis of Cr(VI) and acetate concentration profiles distributed in biofilm on ceramic particle.
Kinetic model development
A mathematical model system for the kinetics of Cr(VI) reduction with acetate biodegradation by E. coli cells in a biofilm reactor was derived in this study. Guha (2004) used dual-Monod kinetics to describe Cr(VI) reduction with lactate biodegradation by a dissimilatory metal reducing bacteria, Shewanella simidu (BrY-MT) ATCC 55627, where Cr(VI) is the electron acceptor and lactate is the electron donor. Thus, dual-Monod kinetics was applied to describe Cr(VI) reduction with acetate biodegradation by E. coli cells in biofilm and bulk liquid phases, where Cr(VI) is used as the electron acceptor and acetate is used as the electron donor.
A simple reactor system in which the biofilm model can be applied is the completely mixed biofilm reactor. All the Cr(VI) and acetate concentrations are the same in bulk liquid phase, and all E. coli cells at the liquid/biofilm interface are exposed to the same Cr(VI) and acetate concentrations (Chang and Rittmann, 1987). The column reactor having a sufficiently high recycle flow rate can be regarded as a completely mixed flow reactor that greatly simplifies the mathematical description of the system because concentration profiles along the column need not be considered.
The governing equations of the Cr(VI) concentration in the liquid phase of a completely-mixed, packed-bed reactor were described as follows (Chang and Rittmann, 1987):
where Sbc and Sba are concentrations of Cr(VI) and acetate, respectively, in the bulk liquid (MsL−3); Sbc0 and Sba0 are concentrations of Cr(VI) and acetate, respectively, in the feed (MsL−3); Ssc and Ssa are concentrations of Cr(VI) and acetate, respectively, at liquid/biofilm interface (MsL−3); Xb is the concentration of suspended E. coli cells in the bulk liquid (MsL−3); Xf is the density of E. coli biofilm (MxL−3); Lf is the thickness of E. coli biofilm (L); kfc and kfa are the liquid film transfer coefficients of Cr(VI) and acetate, respectively (LT−1); k is the Monod maximum specific utilization rate of acetate (MsMxT−1); Y is the growth yield of E. coli cells (MxMs−1); b is the decay coefficient of E. coli cells (T−1); Ksc and Ksa are Monod half-velocity coefficients of Cr(VI) and acetate (MsL−3), respectively; bs is the specific shear-loss coefficient of E. coli biofilm (T−1); Q is the flow rate of the feed solution (L3T−1); V is the effective volume of reactor (L3); Af is the total surface area of supporting media (L2); γ is the mass ratio of Cr(VI) reduced per acetate consumed (MsMs−1); and ɛ is the bed porosity of the reactor.
The nonsteady-state form of mass transfer diffusion across the liquid-biofilm interface and Cr(VI) reduction with acetate biodegradation in the biofilm can be described by Fick's law and dual-Monod kinetics (Tsai et al., 2005):
where Sfc and Sfa are the concentrations of Cr(VI) and acetate, respectively, in the biofilm (MsL−3); Dfc and Dfa are the diffusion coefficients of Cr(VI) and acetate, respectively, in the biofilm (L2T−1); and rf is the radial distance in the biofilm (L). Equations (5) and (6) require two boundary conditions. First, the slope of the Cr(VI) and acetate concentrations at the surface of a supporting medium must be zero. Second, the flux entering the interface from the liquid film must be equal to the flux leaving the interface into the biofilm.
Simultaneous removal of Cr(VI) and acetate was accomplished in a fixed biofilm reactor with pure culture that consisted of Cr(VI)-reducing E. coli with acetate as the sole added carbon and energy source (Wang and Chirwa, 1998). Concerning the biofilm thickness, the major enhancing factors include cell growth, shear loss from liquid flow, and self-loss of E. coli cells. It is noted that the biofilm thickness might have progressively increased and reach a threshold value or a maximum value before biofilm shearing occurred from the ceramic particles to the bulk liquid. The temporal variation for biofilm growth can be described by the following equation (Liang et al., 2007):
where Lf is the biofilm thickness (L); and Af is the total surface area of a ceramic particle (L2).
To compute the concentration of Cr(III) produced from reduction of Cr(VI) by E. coli cells, a mass balance for Cr(III) must be formulated according to the Cr(III) effluent concentration, the net fluxes of Cr(VI) reduced to Cr(III) by the attached E. coli cells and the Cr(VI) concentration in the bulk liquid was reduced to Cr(III) by suspended E. coli cells. The Cr(III) production can be described as the following equation:
where Cp is the Cr(III) concentration in bulk liquid and α is the conversion factor for the reduction of Cr(VI) to Cr(III). A quantity for Cr(VI) flux is important for the understanding of fixed biofilm process. This quantity is easily computed using the orthogonal collocation method solution.
Since the Cr(VI) flux from the bulk liquid phase into the biofilm is linear, the flux is easily computed with (Nkhalambayausi-Chirwa and Wang, 2005):
where Jfc is the flux of Cr(VI) from bulk liquid phase into E. coli biofilm phase (MsL−2T−1) and kfc is equal to Dwc/Lw. Dwc is the diffusion coefficient of the Cr(VI) in the bulk liquid (L2T−1) and Lw is stagnant liquid-layer thickness (L).
Materials and Methods
Supporting media
The raw materials of commercial ceramic particles (CCP) consist of clay mostly obtained from farmland and the CCP was originally purchased from the aquarium (Taichung, Taiwan). To verify the model system, ceramic particles with 0.6 cm in diameter were chosen as the supporting media for biofilm attachment because they are inert media and have an accurately known surface area for E. coli cells attachment. The total surface area of CCP in the reactor was 2,787 cm2.
E. coli 33456 culture inoculum
E. coli ATCC 33456 was originally purchased from the American Type Culture Collection and has been in our laboratory collection since 2006. The E. coli culture used in all experiments was prepared by washing the harvested E. coli cells twice in 0.85% NaCl solution and then resuspended and obtained through gradient centrifugation in a modified basal mineral medium supplemented with trace metal and vitamin solutions. The mineral salt medium for E. coli culture was similar as described by Chirwa and Wang (2000). The mineral salt medium for E. coli culture was prepared by dissolving (per liter) NH4Cl, 1.013 g; NaH2PO4·2H2O, 0.62 g; K2HPO4, 2.5 g; MgSO4·7H2O, 0.0103 g; CaCl2·2H2O, 0.00425 g; FeCl3·3H2O, 0.00085 g. The trace metal stock solution contained FeCl3·6H2O, 0.243 g; MnCl2·2H2O, 0.06 g; ZnCl2, 0.041 g; CuCl2·2H2O, 0.036 g; CoCl2·2H2O, 0.036 g; Na2B4O7·10H2O, 0.015 g; Na3-citrate, 2.205 g; (NH4)6Mo7O27·4H2O, 0.026 g; KH2PO4, 5.104 g; NaH2PO4·H2O, 3.105 g; (NH4)2SO4, 1.980 g; NH4Cl, 18.450 g; CaCl2·2H2O, 2.205 g; MgCl2·6H2O, 3.049 g; NiCl2·6H2O, 0.025 g in 1 L of deionized water; along with 5 mL of a trace vitamin B12 stock solution. The 5.0 mM sodium acetate (295 mg acetate/L) was added as carbon source and an electron donor for E. coli growth in the mineral salt medium. A sterilized stock solution of potassium chromate (K2CrO4) was prepared for use of Cr(VI). E. coli cells were harvested during the log growth phase in nutrient broth after incubation at 35°C for 16 h.
Batch biokinetic experiments
Independent batch biokinetic experiments for acetate biodegradation and Cr(VI) reduction were performed in the batch reactors to determine four biokinetic parameters, which were (1) growth yield of E. coli cells (Y); (2) decay coefficient of E. coli cells (b); (3) Monod maximum specific utilization rate (k); and (4) Monod half-velocity coefficients of acetate and Cr(VI) (Ksa, Ksc). First, a batch kinetic experiment employed a working volume of 5 L glass reactor, wherein initial Cr(VI) and acetate concentrations of 5 and 50 mg/L, respectively, was seeded with the acclimated 8 mg cell/L of suspended E. coli cells to evaluate Cr(VI) reduction with acetate biodegradation. This kinetic test was used to determine the growth yield (Y) and decay coefficient (b). Second, nine batch kinetic experiments with initial Cr(VI) concentration of 5 mg/L and initial acetate concentrations varied from 100 to 500 mg/L were then conducted to determine the maximum specific growth rate (μmax) and half-velocity coefficient for acetate (Ksa). The bioreactors were run at a temperature 35°C±1°C using a heater controller and a mixing speed of 250 rpm. Pure nitrogen at a rate of 1.2 L/min was used to purge batch reactor for maintaining anaerobic condition. The pH was maintained at an optimal level of 7.1±0.2 by a buffer solution. Samples were withdrawn at the onset of batch experiments, and subsequently at regular intervals for measurement of acetate, Cr(VI) and E. coli cells concentrations.
Continuous-flow column tests
The objectives of continuous-flow column tests was to investigate Cr(VI) reduction and validate the kinetic model. In all these experiments, the terminal electron acceptor was Cr(VI) as K2CrO4 and the electron donor was acetate, which provide the source of carbon and energy to the E. coli cells (Guha, 2004). The reactor was inoculated by charging 75 mL of a E. coli suspension containing 4.3 mg cell/L. The reactor was then operated with an initial Cr(VI) concentrations of 5–20 mg/L and initial acetate concentration of 295 mg/L containing mineral salt medium at a hydraulic retention time of 10.7 h. An anaerobic fixed biofilm reactor with a high recycle flow rate (Qr/Q=30) for maintaining a completely mixed stirred tank reactor was applied to conduct the experiments of Cr(VI) reduction with acetate biodegradation. The effective working volume of reactor is 320 mL, which corresponds to an influent flow rate of 720 mL/day. The reactor temperature was maintained at 35°C±0.1°C using a circulating water bath (Yih Der, Inc.) for water jacket of the bioreactor. The ceramic particles were placed in the reactor zone between two plates used for fixation. Earlier work has shown that Cr(VI) reduction by E. coli cells was inhibited in the presence of oxygen (Shen and Wang, 1994). The test column was purged using 99.999% nitrogen gas filtered by a Whatman glass filter to establish an anaerobic condition for experiments. The pH was buffered at 7.1±0.2 by adding HPO42−/H2PO4− in the feed solution (Nkhalambayausi-Chirwa and Wang, 2001). Figure 2 depicts the laboratory-scale experimental setup of the fixed biofilm reactor for Cr(VI) reduction with acetate biodegradation.
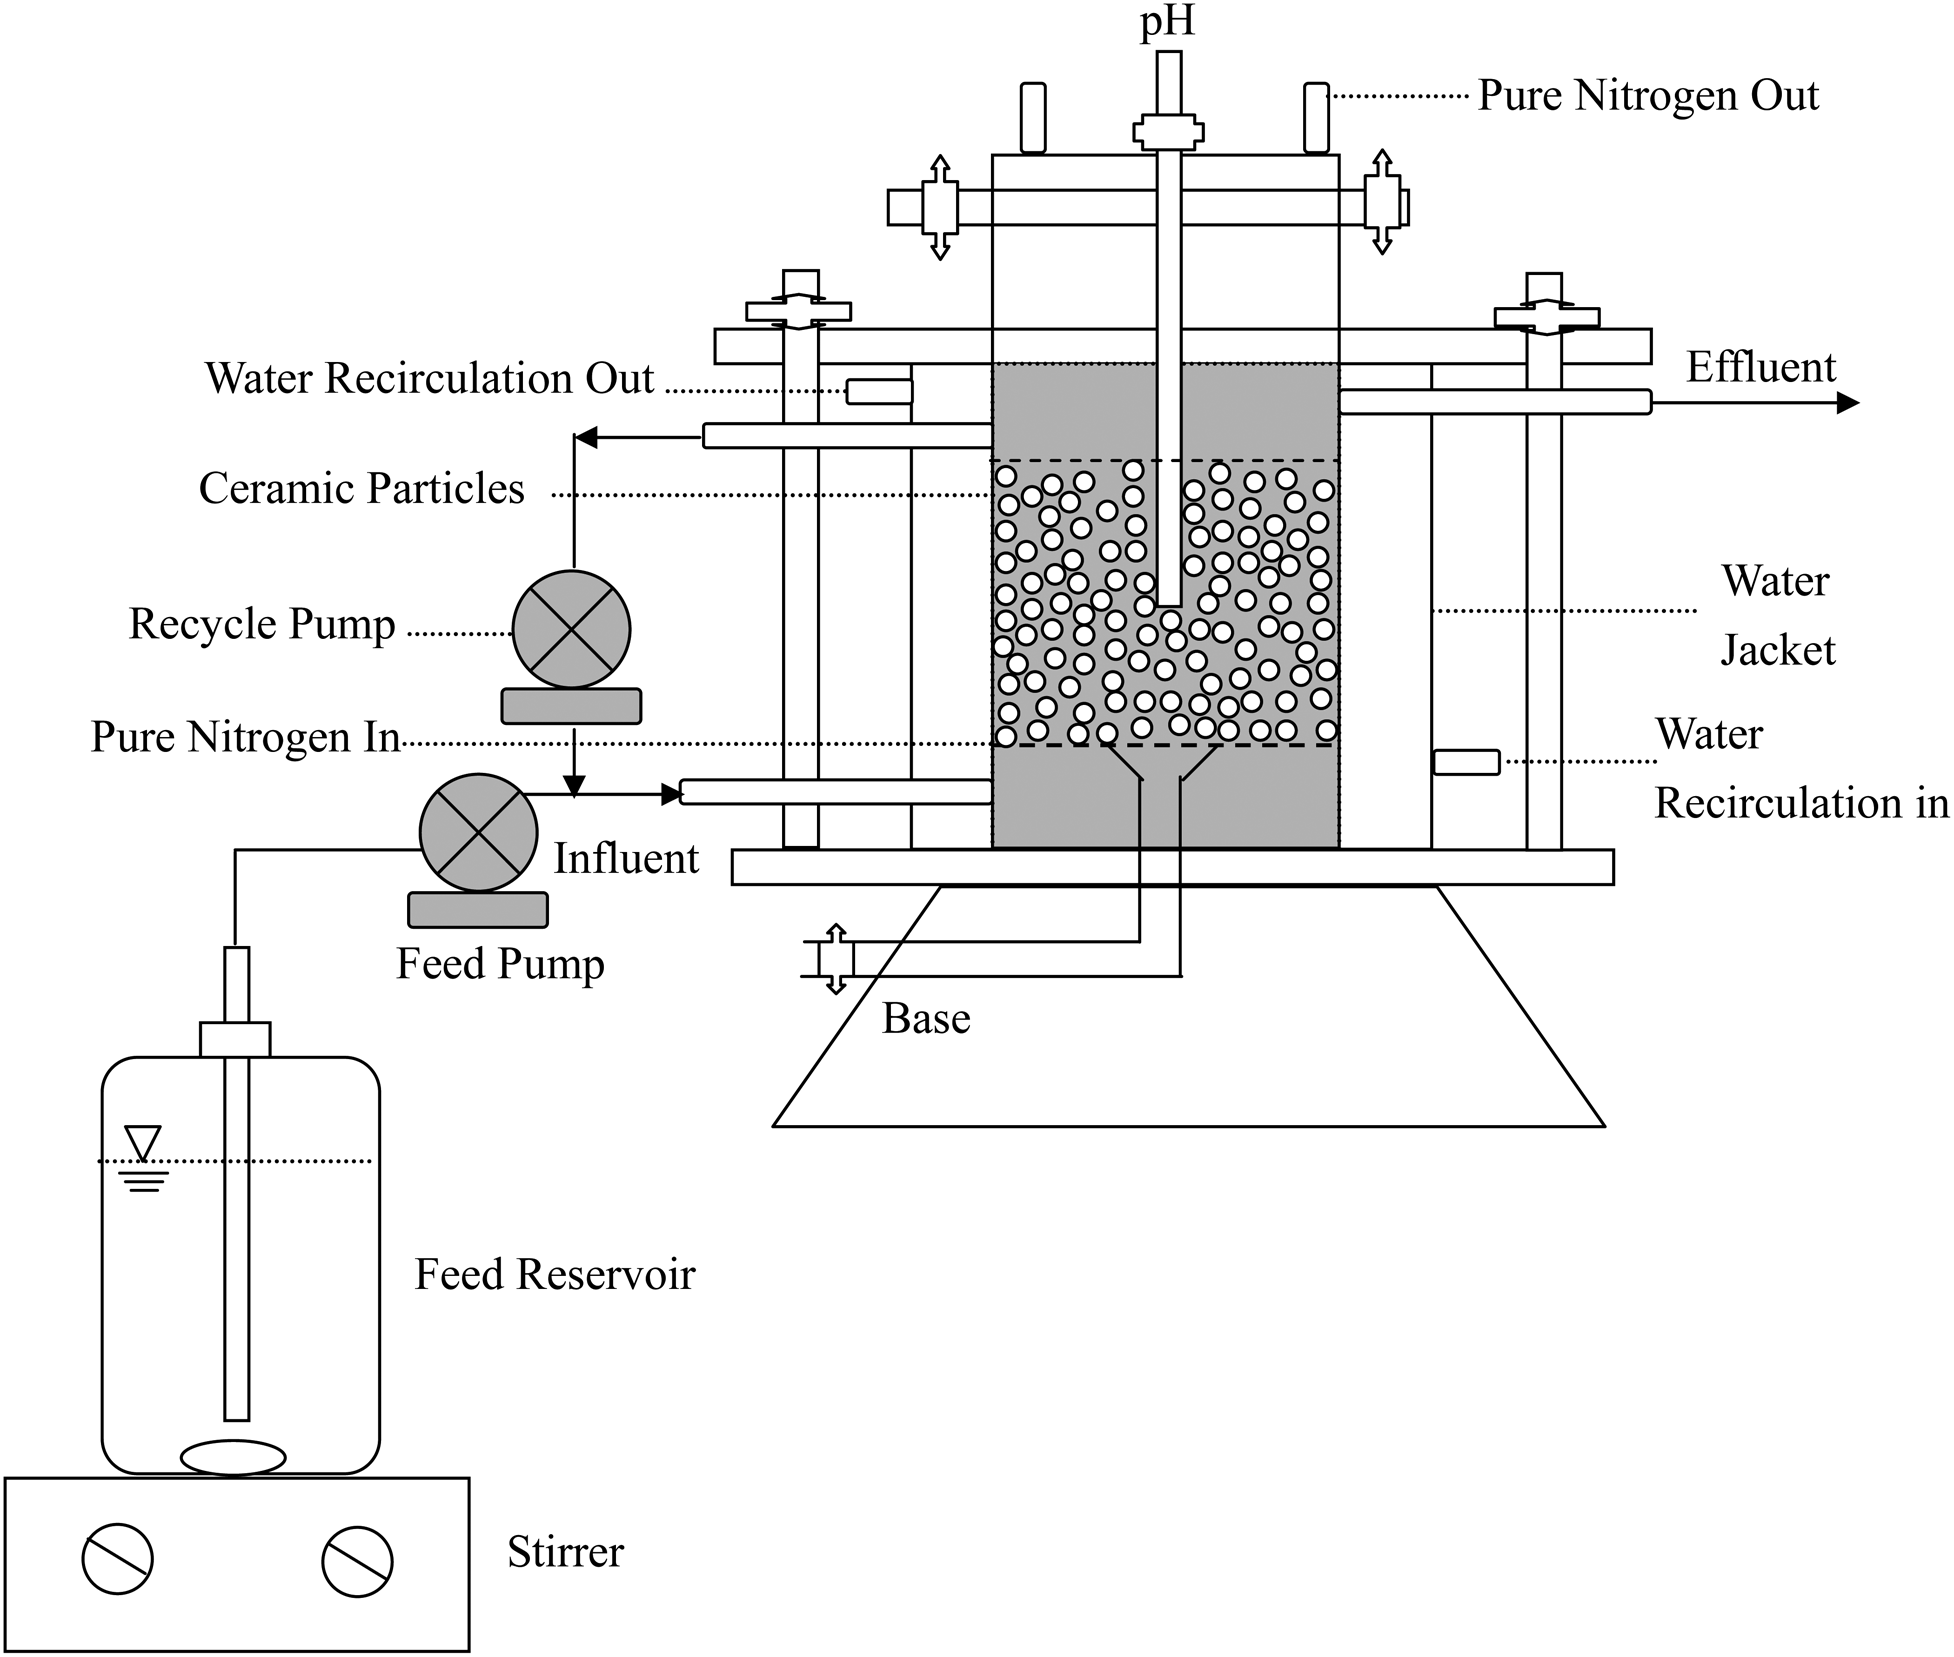
Experimental setup for Cr(VI) reduction with acetate biodegradation.
Measurement of E. coli biofilm density
E. coli biofilm grown on ceramic particle was used to measure biofilm density. At the end of the column tests, 150 ceramic particles with biofilm were transferred, one by one with tweezer to preclude inclusion of interstitial water, to a tared aluminum pan. The ceramic beads containing E. coli biofilm were weighed before and after drying in the oven to determine E. coli biofilm mass. Clean ceramic particles were immersed in clean water and picked out to measure the amount of attached water on ceramic particles by the same methods. The E. coli biofilm volume was obtained by calculating the difference of the two measurements. The density of E. coli biofilm thus computed by dividing the biofilm mass by biofilm volume was 0.836 mg cell/mL.
Analytical methods
Cr(VI) content was spectrophotometrically determined at 540 nm using a UV-VIS spectrophotometer (Shimadzu; model UV-1700), following the colorimetric method with 1,5-diphenyl-carbazide in acid solutions, as described in Section 3500 B of the Standard Methods (American Public Health Association, 2005). The concentration of Cr(III) was measured using an ICS 1500 Ion Chromatograph system (Dionex Corporation) that was equipped with an HPIC-CS5 column, and quantified at 520 nm using a UV-VIS detector (Wang and Shen, 1997; Chirwa and Wang, 2000). Filtered liquid samples were analyzed for acetate. Acetate was measured using an Agilent model 6850 gas chromatograph equipped with an flame-ionization detector and a 1.8-m (6-ft) glass column with Supelco packing No. 1-1889M (80/120 Carbopack B-DA/4% Carbowax 20M) (Gupta et al., 1994). All tests were duplicated and the relative experimental error of Cr(VI) analysis was estimated to be within±5%. The E. coli cells density of the liquid cultures was determined by measuring the absorbance of a 1 cm cuvette at 610 nm using a UV-VIS spectrophotometer (Shimadzu; model UV-1700) and correlated to dry cell weight (Wang and Shen, 1997; Bae et al., 2000). The dry cell mass density (mg/L) was found to follow the following regression equation: X (mg/L) =−1.4184+461.03 (OD610). Viable cells attached on ceramic particle were observed by using serial dilution technique and confirmed by plating on nutrient agar and incubated at 35°C for 24 h (Wang and Shen, 1997).
Results and Discussion
Determination of biokinetic parameters
Figure 3 depicts the experimental data on the variations of Cr(VI) reduction, acetate biodegradation, and the growth of suspended E. coli cells versus operation time. The experimental data of Cr(VI) reduction with acetate biodegradation and suspended E. coli cells concentrations facilitate a priori estimation of biokinetic parameters by evaluating the growth rate of suspended E. coli cells and acetate biodegradation. The relevant techniques employed for determination of biokinetic parameters from the experimental data of the batch tests are discussed below.

Batch kinetic test for Cr(VI) reduction, acetate biodegradation, and the growth of E. coli cells.
The yield coefficient (Y) for suspended E. coli cells is assumed approximately constant over the range of acetate concentration encountered in the growth phase. The slope of a linearized plot for the increase in suspended E. coli cells concentration (ΔX) versus decrease in acetate concentration (ΔS) is the yield coefficient, as presented in Fig. 4a. The growth yield for E. coli cells was 0.227 mg cell/mg acetate.
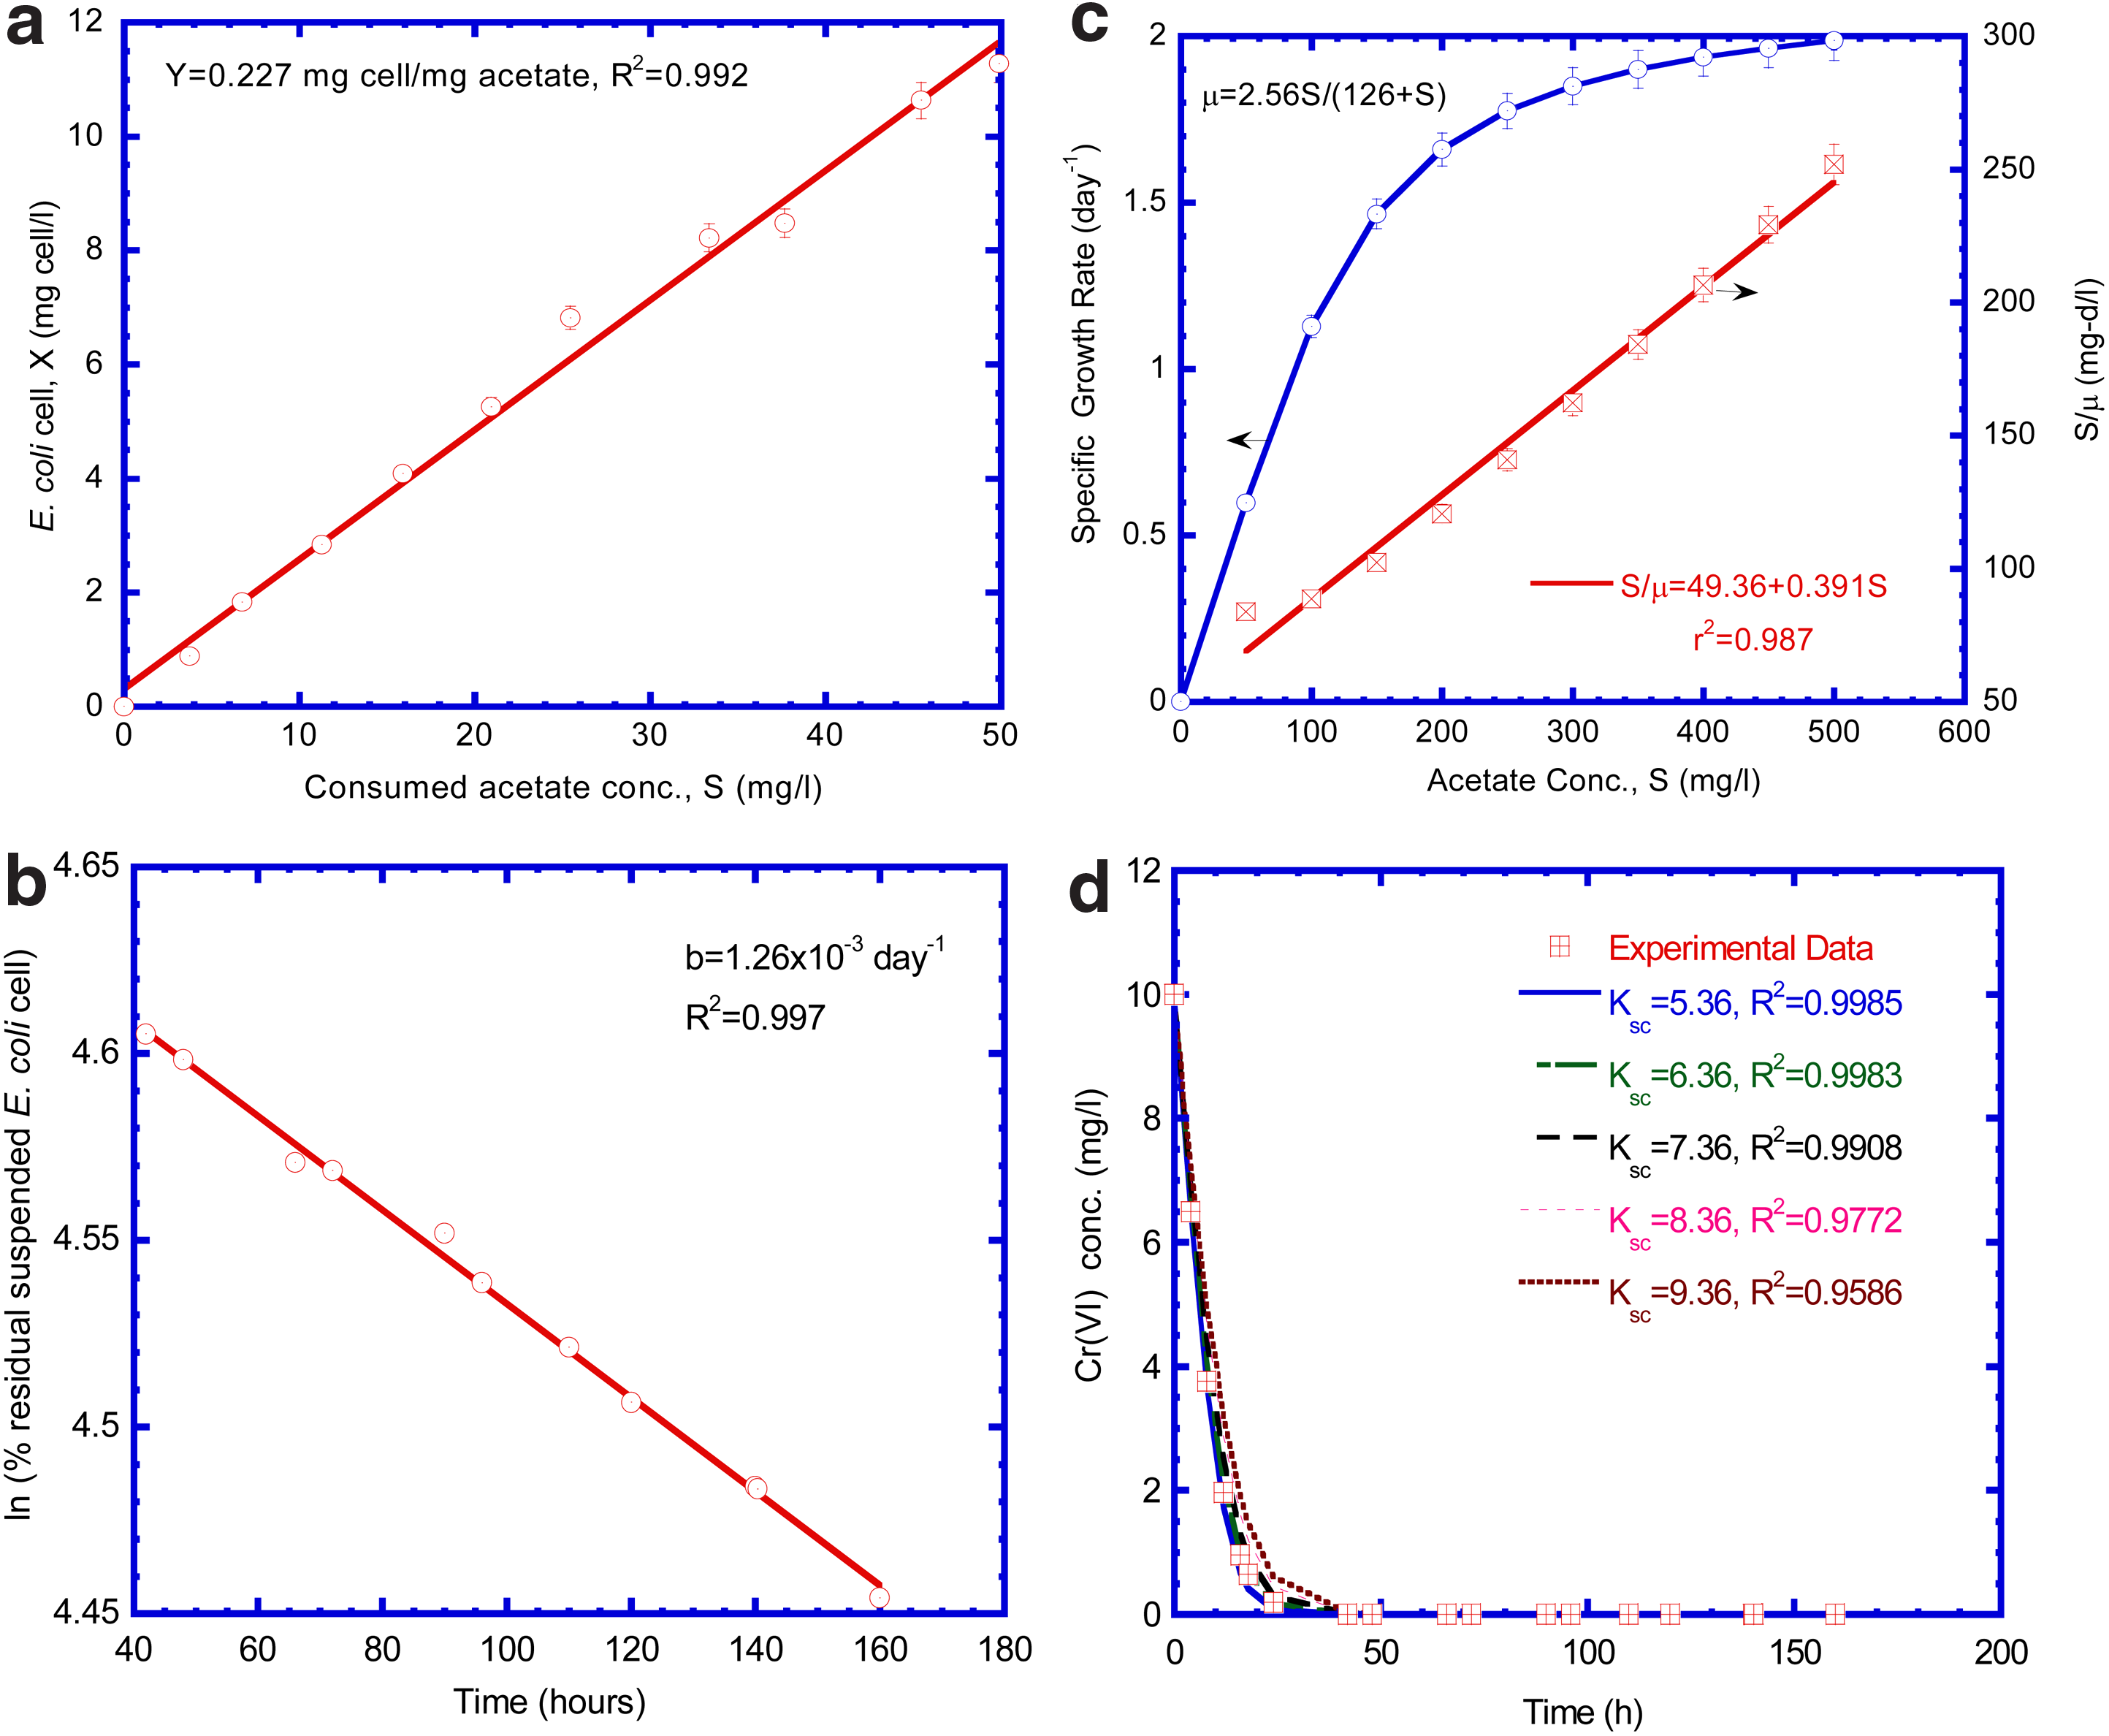
Batch kinetic tests to determine
The data in the endogenous phase can be applied to estimate the decay coefficient of the E. coli cells. In the endogenous phase, the cell concentration decreased with time and the decay coefficient (b) was determined from the slope of a linearized plot of lnX versus time in the endogenous phase in Fig. 4b. The decay coefficient for E. coli cells was equal to 1.26×10⁻³ day−1.
The rate of a microbial reaction could be described by the Monod expression as a function of limiting substrate concentration (Kumar et al., 2000):
where μ is the specific growth rate (T−1); μmax is the maximum specific growth rate (T−1); Sa is the acetate concentration (MsL−3); and Ksa is the Monod half-velocity coefficient for acetate (MsL−3). Equation (10) could be linearized to determine the biokinetic parameters (Ksa, μmax) using Lineweaver-Burk plot (Kumar et al., 2000):
Regression analysis is used to find the best fit for a straight line on a plot of
Somasundaram et al. (2009) conducted batch kinetic experiments under anaerobic conditions to evaluate various biokinetic parameters. Experimental results show that the growth yield for chromium reducing bacteria, maximum specific growth rate, and Monod half-velocity coefficient were equal to 0.2215, 2.1312 day−1, and 80 mg/L, which was close to the values of biokinetic parameters obtained in our study.
Once the growth yield of E. coli cells (Y), Monod maximum specific utilization rate of acetate (k) and decay coefficient of E. coli cells (b) were determined from the slopes of growth and endogenous phrases, respectively, in the batch kinetic test, then the Cr(VI) reduction rate with acetate biodegradation and the growth rate of suspended E. coli cells described by dual-Monod kinetics were used to determine the value of the Monod half-velocity coefficient of Cr(VI) (Ksc). The Cr(VI) reduction rate with acetate biodegradation and the growth rate of suspended E. coli cells can be represented by the following Equations (12)–(14), respectively (Guha, 2004):
where Sc and Sa are the concentrations of Cr(VI) and acetate, respectively. (MsL−3); X is the concentration of suspended E. coli cells (MxL−3). The model-predicted Cr(VI) concentration with respect to time is determined using dual-Monod kinetic model system [Eqs. (12)–(14)] by assuming Ksc value for model simulation. The model-generated and experimental Cr(VI) concentrations varied with time are presented in Fig. 4d. A best-fit Ksc value was obtained by comparing model-generated Cr(VI) reduction with experimental data in the batch test. The correlation coefficients (R2) obtained in the regression analysis of model prediction and experimental data were greater than 0.95 for different Monod half-velocity coefficients of Cr(VI) (Ksc). The best-fit Ksc value for Cr(VI) was 5.36 mg Cr(VI)/L (R2=0.9985). Shen and Wang (1993) conducted the batch kinetic experiments to investigate the Cr(VI) reduction under anaerobic conditions. They found the value of Ksc was 6.24 mg Cr(VI)/L, which was close to the value obtained in this study.
Determination of mass transfer coefficients
The diffusion coefficient of acetate in bulk liquid (Dwa) was determined from the empirical formula of Wilke and Chang (1955). The formula can be expressed by the following equation
where φb is association parameter; Mb is molecular weight of water; T is absolute temperature in K; μb is absolute viscosity of the solution in centipoises for water; and Va is molar volume of the solute as liquid at its normal boiling point. Molar volumes of solutes can be estimated from the atomic volume of their atoms (Perry and Chilton, 1973). The computed value of Dwa is equal to 1.68 cm2/day.
Diffusion coefficients in biofilm are generally less than those in the liquid phase due to the diffusional resistance to the transport of the chemical species, which is posed by bacteria and their extracellular materials. The diffusion coefficient in the biofilm is obtained by multiplying the diffusion coefficient in the bulk liquid phase by a factor of 0.8 to correct the additional diffusional resistance in the biofilm (Williamson and McCarty, 1976). The diffusion coefficient of acetate in biofilm (Dfa) was equal to 1.344 cm2/day. Lazaridis and Charalambous (2005) found that the diffusion coefficient of Cr(VI) in bulk liquid (Dwc) has a mean value of 2.1×10⁻¹⁰ m2/s (0.18 cm2/day), which was applied as Dwc in this study. Thus, the computed value of molecular diffusion coefficient for Cr(VI) in the biofilm (Dfc) was equal to 0.144 cm2/day.
The liquid-film transfer coefficient (kf) computed from the empirical formula for the packed-bed reactor was described in the following equation (Cussler, 1997):
where vs is the superficial flow velocity through column (LT−1); Re is Reynolds number=
An empirical formula derived by Speitel and DiGiano (1987) was used to determine specific shear-loss coefficient (bs) of the E. coli biofilm on the ceramic particle. The computed value of bs for E. coli biofilm was 0.121 day−1.
Model calibration
This kinetic model system assumes that the initial biofilm thickness can start to grow at time zero; thus, we introduced three initial biofilm thicknesses to estimate Cr(VI) reduction for calibrating and fitting the experimental data. The best-fit Lf0 value for prediction was acquired by comparing the model-predicted result with experimental data, and the results were represented quantitatively by the least-square value (LSV) (Liang et al., 2007):
where Spre,i and Sexp,i are Cr(VI) concentration of model prediction and experimental data, respectively. N is the number of data point. The LSV provides a quantitative comparison of the agreement between a predicted and experimental data. As the LSV increases, the level of agreement between the model prediction and experimental data decreases.
Cr(VI) reduction with acetate biodegradation
Cr(VI) reduction by E. coli cells was observed in the fixed biofilm reactor. Concentrations of Cr(VI), acetate, suspended E. coli cells, and Cr(III) production were monitored with respect to time. In these studies, initial concentration of Cr(VI) was varied from 5 to 20 mg/L, whereas the initial acetate concentration was kept at 295 mg/L and initial concentration of suspended E. coli cells was equal to 4.3 mg cell/L. Table 1 presents the biokinetic and reactor parameters determined from batch kinetic tests and used for kinetic model prediction. The initial E. coli biofilm thickness (Lf0) was assumed so that the model predicted the Cr(VI) and acetate concentration results very well.
Figure 5a presents the Cr(VI) effluent concentration varied with time at different initial biofilm thicknesses. The best-fit Lf0 value, which resulted in the best model prediction for experimental data was equal to 5.5 μm with the lowest LSV of 0.178 for Cr(VI) effluent concentration. The variation of effluent acetate concentration with respect to time is shown in Fig. 5b. The curves of Cr(VI) and acetate concentrations were described in three parts. First, the Cr(VI) and acetate concentrations sharply increased to ∼2.7 mg Cr(VI)/L (0.53 Sbc0) and 134.5 mg acetate/L (0.456 Sba0) at the first day, respectively. At this period of time, there was no significant Cr(VI) reduction with acetate biodegradation. The Cr(VI) and acetate concentration curves were the same as a typical dilute-in curve, which was a characteristic of the completely mixed reactor while the reactor was filled with mineral salt medium at time zero. The second part of Cr(VI) and acetate curves ran from 1 to 25 days, when the curves started to deviate from the dilute-in curves of the reactor. The effluent Cr(VI) and acetate concentrations leveled off and then decreased. During this period, the Cr(VI) and acetate concentrations rapidly decreased due to significant growth of E. coli biofilm. The third part of the Cr(VI) and acetate concentration curves ran from 25 to 146 days at a steady-state condition. The effluent Cr(VI) and acetate concentrations was about 0.385 mg Cr(VI)/L (0.077 Sbc0) and 28.5 mg acetate/L (0.0965 Sba0), respectively, when the E. coli biofilm and suspended E. coli cells reached a maximal growth at this stage. The removal efficiency for Cr(VI) and acetate were about 92% and 90%, respectively, under influent Cr(VI) loading rate (11.3 g/[m3·day]) and acetate loading rate (664.4 g/[m3·day]) at a steady-state condition.
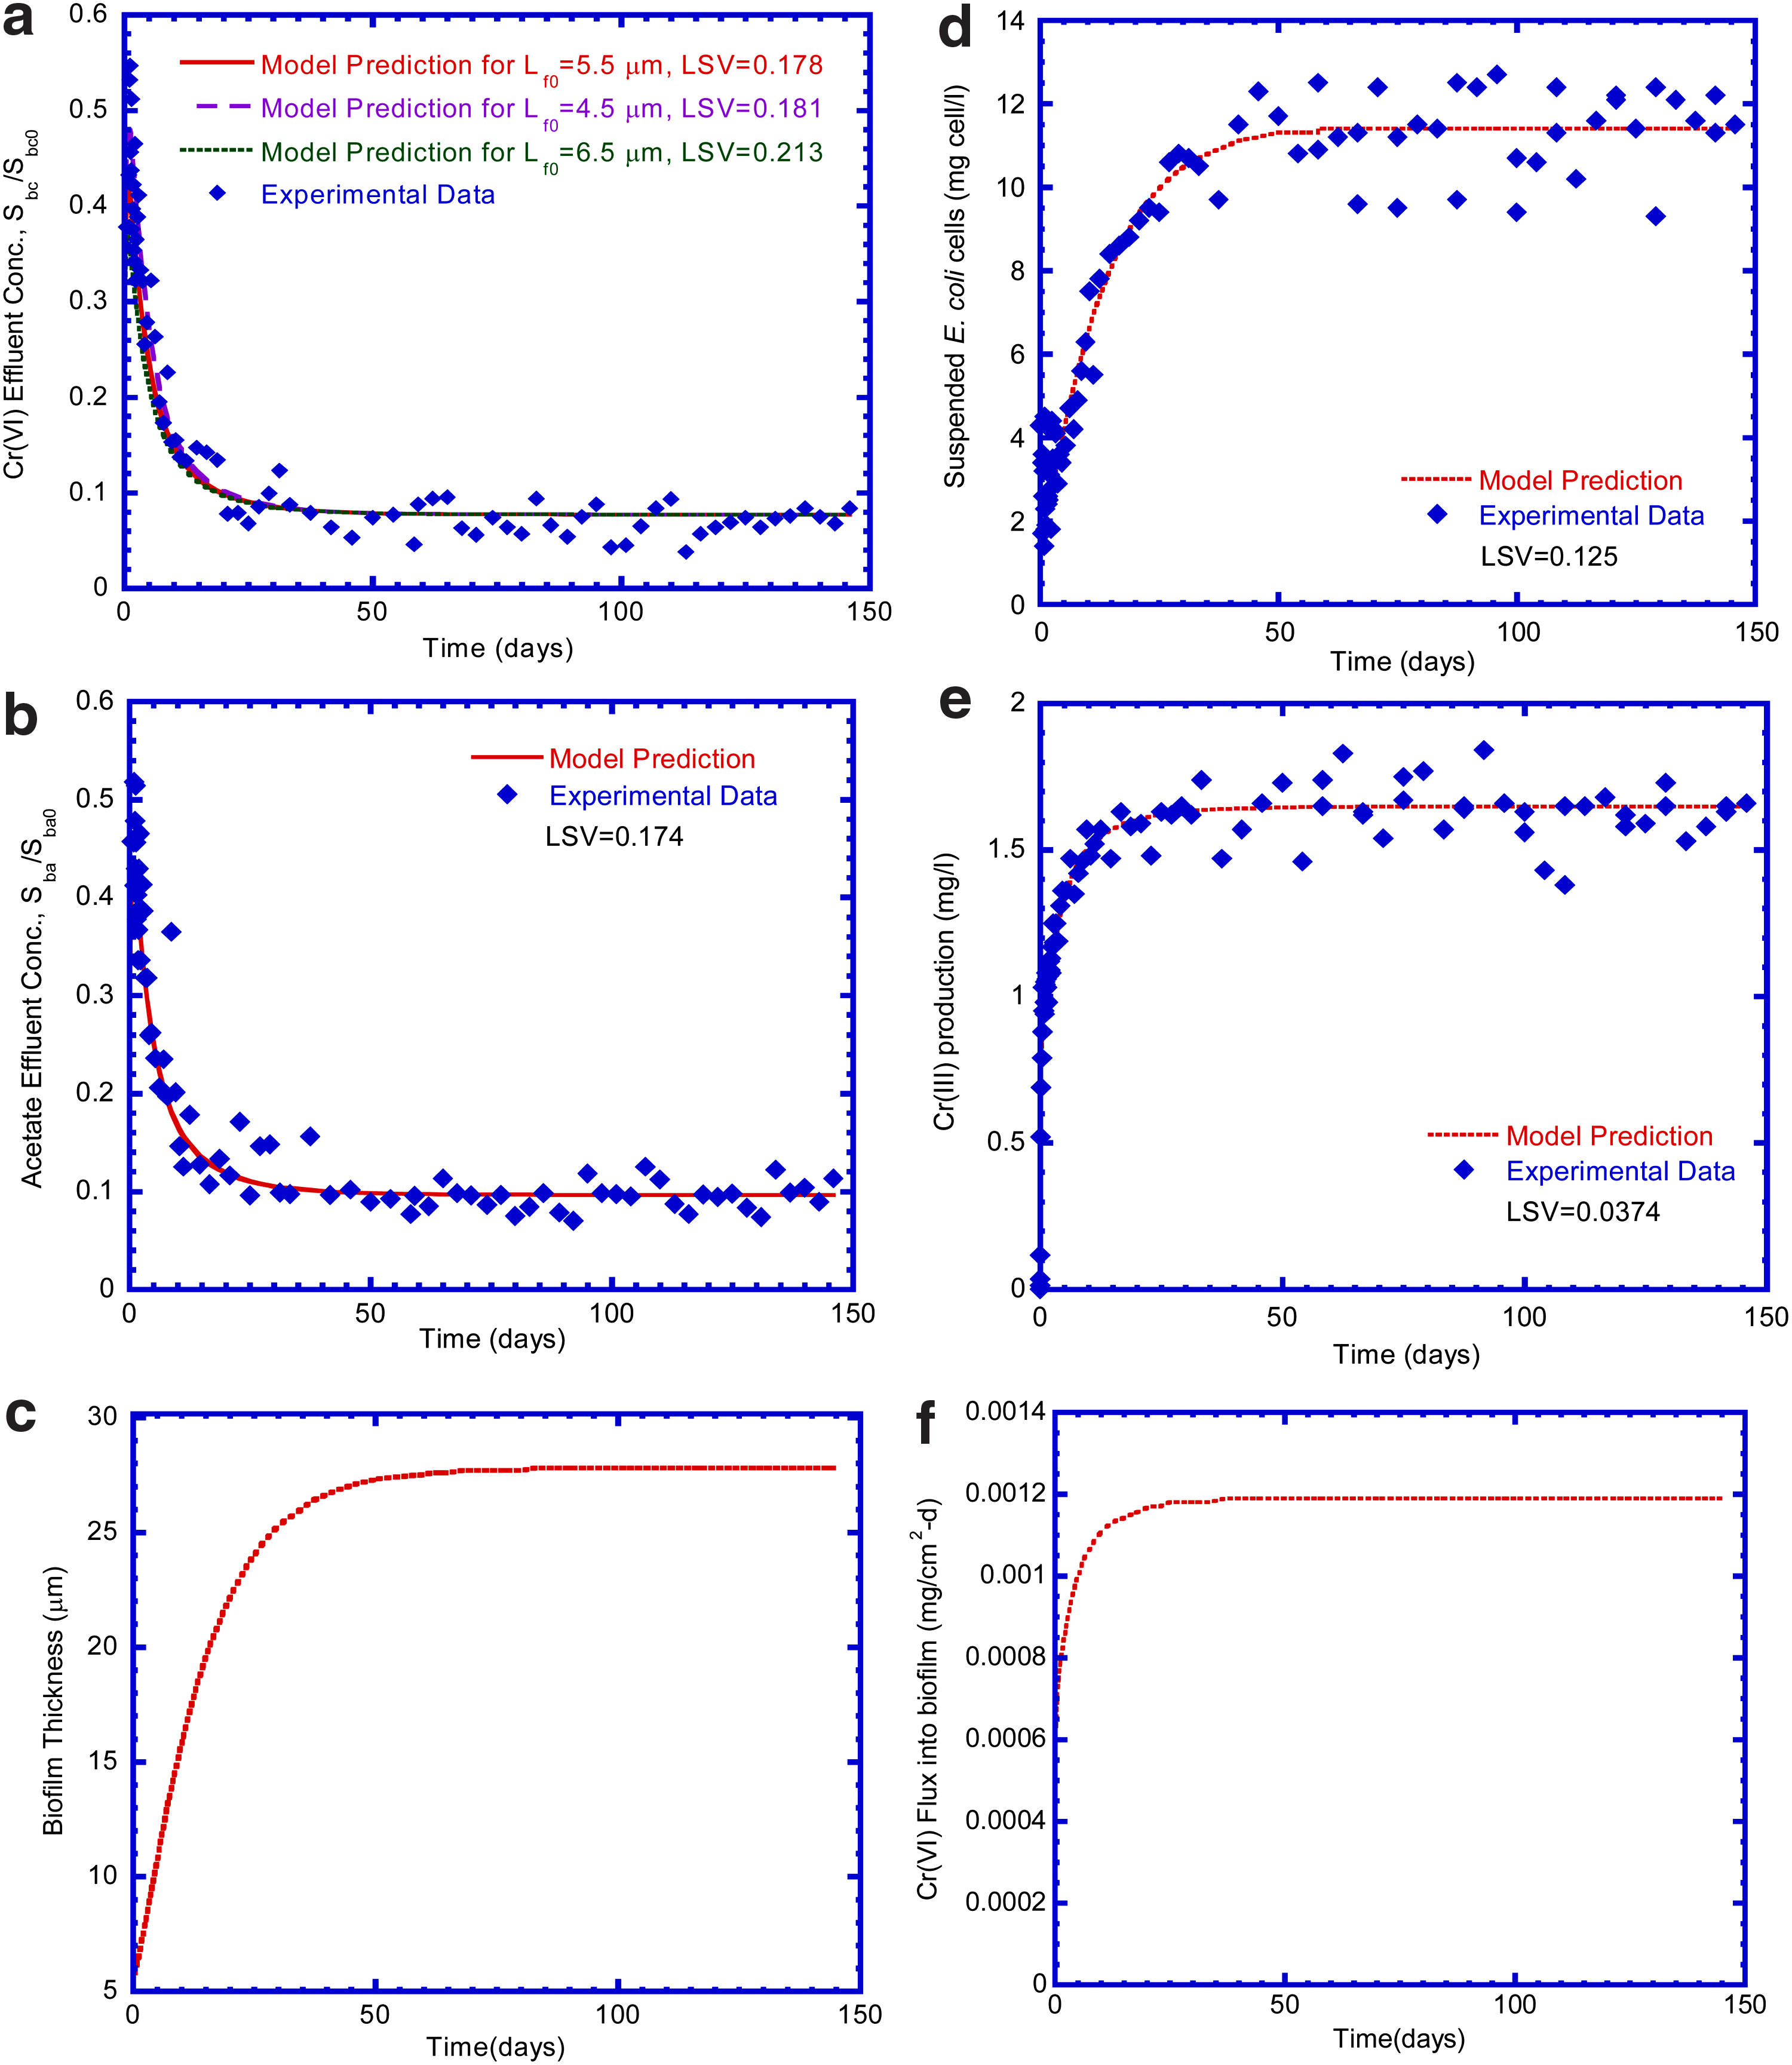
Experimental data and model prediction
Growth E. coli biofilm
Figure 5c shows the growth curve of E. coli biofilm varied with time by model prediction. There was no elapsed time required for E. coli biofilm to start to grow. E. coli biofilm is vigorously reducing Cr(VI) and biodegraded acetate at a transient period of 40 days. Then, E. coli biofilm thickness reached up to a maximum value of 27.8 μm at a steady-state condition from day 40 to 146 while Cr(VI) was vigorously reduced by E. coli biofilm.
Growth of suspended E. coli cells
One indicator of the generating cells growth was the concentration of suspended E. coli cells in the effluent. The general trend of the suspended E. coli cells concentration in effluent by model prediction was similar to the experimental data obtained from completely mixed continuous-flow column test, as depicted in Fig. 5d. Good agreement existed between model prediction and experimental data for suspended E. coli cells growth in the fixed biofilm reactor owing to low LSV of 0.125. The growth curves of E. coli biofilm and suspended E. coli cells presented the same trend of variation with time, which indicated attached and suspended E. coli cells bio-reduced Cr(VI) and degraded acetate simultaneously in the fixed biofilm reactor. The log-growth rate during 20 days represented that the suspended E. coli cells actively bio-reduced Cr(VI) and biodegraded acetate simultaneously. At the steady state, the concentration of suspended E. coli cells was ∼11.4 mg cell/L.
Cr(III) production
Reduction of toxic Cr(VI) to less toxic Cr(III) is an electron consuming process (Bae et al., 2000). To verify Cr(VI) reduction in fixed bed reactor, production of Cr(III) was observed in this test. The production of Cr(III) varied with time presented in Fig. 5e. The Cr(III) concentration at the steady state was ∼1.65 mg/L (0.33 Sb0). The model-predicted concentration of Cr(III) maintained the same trend with the experimental result after 20 days. The model simulation is fair agreement with the experimental results because a moderate LSV of 0.037 was obtained. Approximately 33% of Cr(VI) was converted to Cr(III) at a steady-state condition. Shen and Wang (1993) reported that Cr(III) formed from Cr(VI) reduction was probably attached on the surface of cells. Furthermore, previous work of others also proposed that microbial Cr(VI) reduction occurs most likely on the cell surface (Imai and Gloyna, 1990; Wang et al., 1990). They found that intracellular Cr(III) cannot be removed from cells as the cell membrane remains intact during Cr(VI) reduction (Aaseth et al., 1982). The formation of insoluble Cr(III) on the cell surface was thought to offer protection to cells from toxicity of Cr(VI). In our study, the experimental result shows that the reduced Cr(VI) was not completely transformed to Cr(III). This consequence could occur because the insoluble Cr(III) attached on the surface of E. coli biofilm and accumulated in the biofilm was not quantitatively determined.
Cr(VI) flux into biofilm
Figure 5f presents the model-predicted Cr(VI) flux diffusing from bulk liquid into biofilm. Cr(VI) flux represents E. coli biofilm reduction. At the beginning of the test, the Cr(VI) flux started out at zero as E. coli biofilm growth was negligible. The Cr(VI) flux increased abruptly as the E. coli biofilm grew at logarithmic rate during 40 days. During this period, the E. coli biofilm thickened and consumed Cr(VI) vigorously in the fixed biofilm reactor. Thus, the difference in Cr(VI) concentration in bulk liquid and the biofilm/liquid interface increased, which significantly increased the Cr(VI) flux into biofilm due to reduction activity. During 5–10 days, the Cr(VI) concentration in effluent continued to decrease and then reached a constant concentration under a steady-state condition. The Cr(VI) flux reached a constant value and remained maximal, which was about 1.2×10⁻³ mg/[cm2·day].
Concentration profiles of Cr(VI) and acetate
Rittmann and McCarty (1981) defined three characteristic concentration profiles including fully penetrated case, deep case, and shallow case. The fully penetrated biofilm case has a negligible decrease from the surface concentration (Ss) while the deep biofilm case has the maximum decrease because the substrate concentration reaches zero at or before the attaching surface. The shallow biofilm case is intermediate, having a concentration at the attaching surface (Sw) between 0 and Ss. The Cr(VI) and acetate concentration profiles in liquid film and biofilm at different biofilm thicknesses and times are shown in Fig. 6. The E. coli biofilm thicknesses are 5.5 μm at 0.1 h and 27.8 μm at 146 days, respectively. The Cr(VI) and acetate simultaneously diffused through the liquid film into E. coli biofilm to form a concentration profile due to diffusional resistance. The Cr(VI) and acetate concentration profiles at 0.1 h exhibit the same flat line because both concentration profiles were determined at the very beginning of the column test. The Cr(VI) and acetate concentration profiles show the same flat line in the biofilm, which could be called “fully penetrated” biofilm (Fig. 6a). The E. coli biofilm thickness at 146 days was about 27.8 μm at a steady-state condition. At this stage, the Cr(VI) and acetate concentration profiles form a slope straight line in the bulk liquid and a curve in the biofilm phase (Fig. 6b). The biofilm could be called a “shallow” biofilm at this stage according to the definition of concentration profile in the biofilm (Suidan et al., 1987).
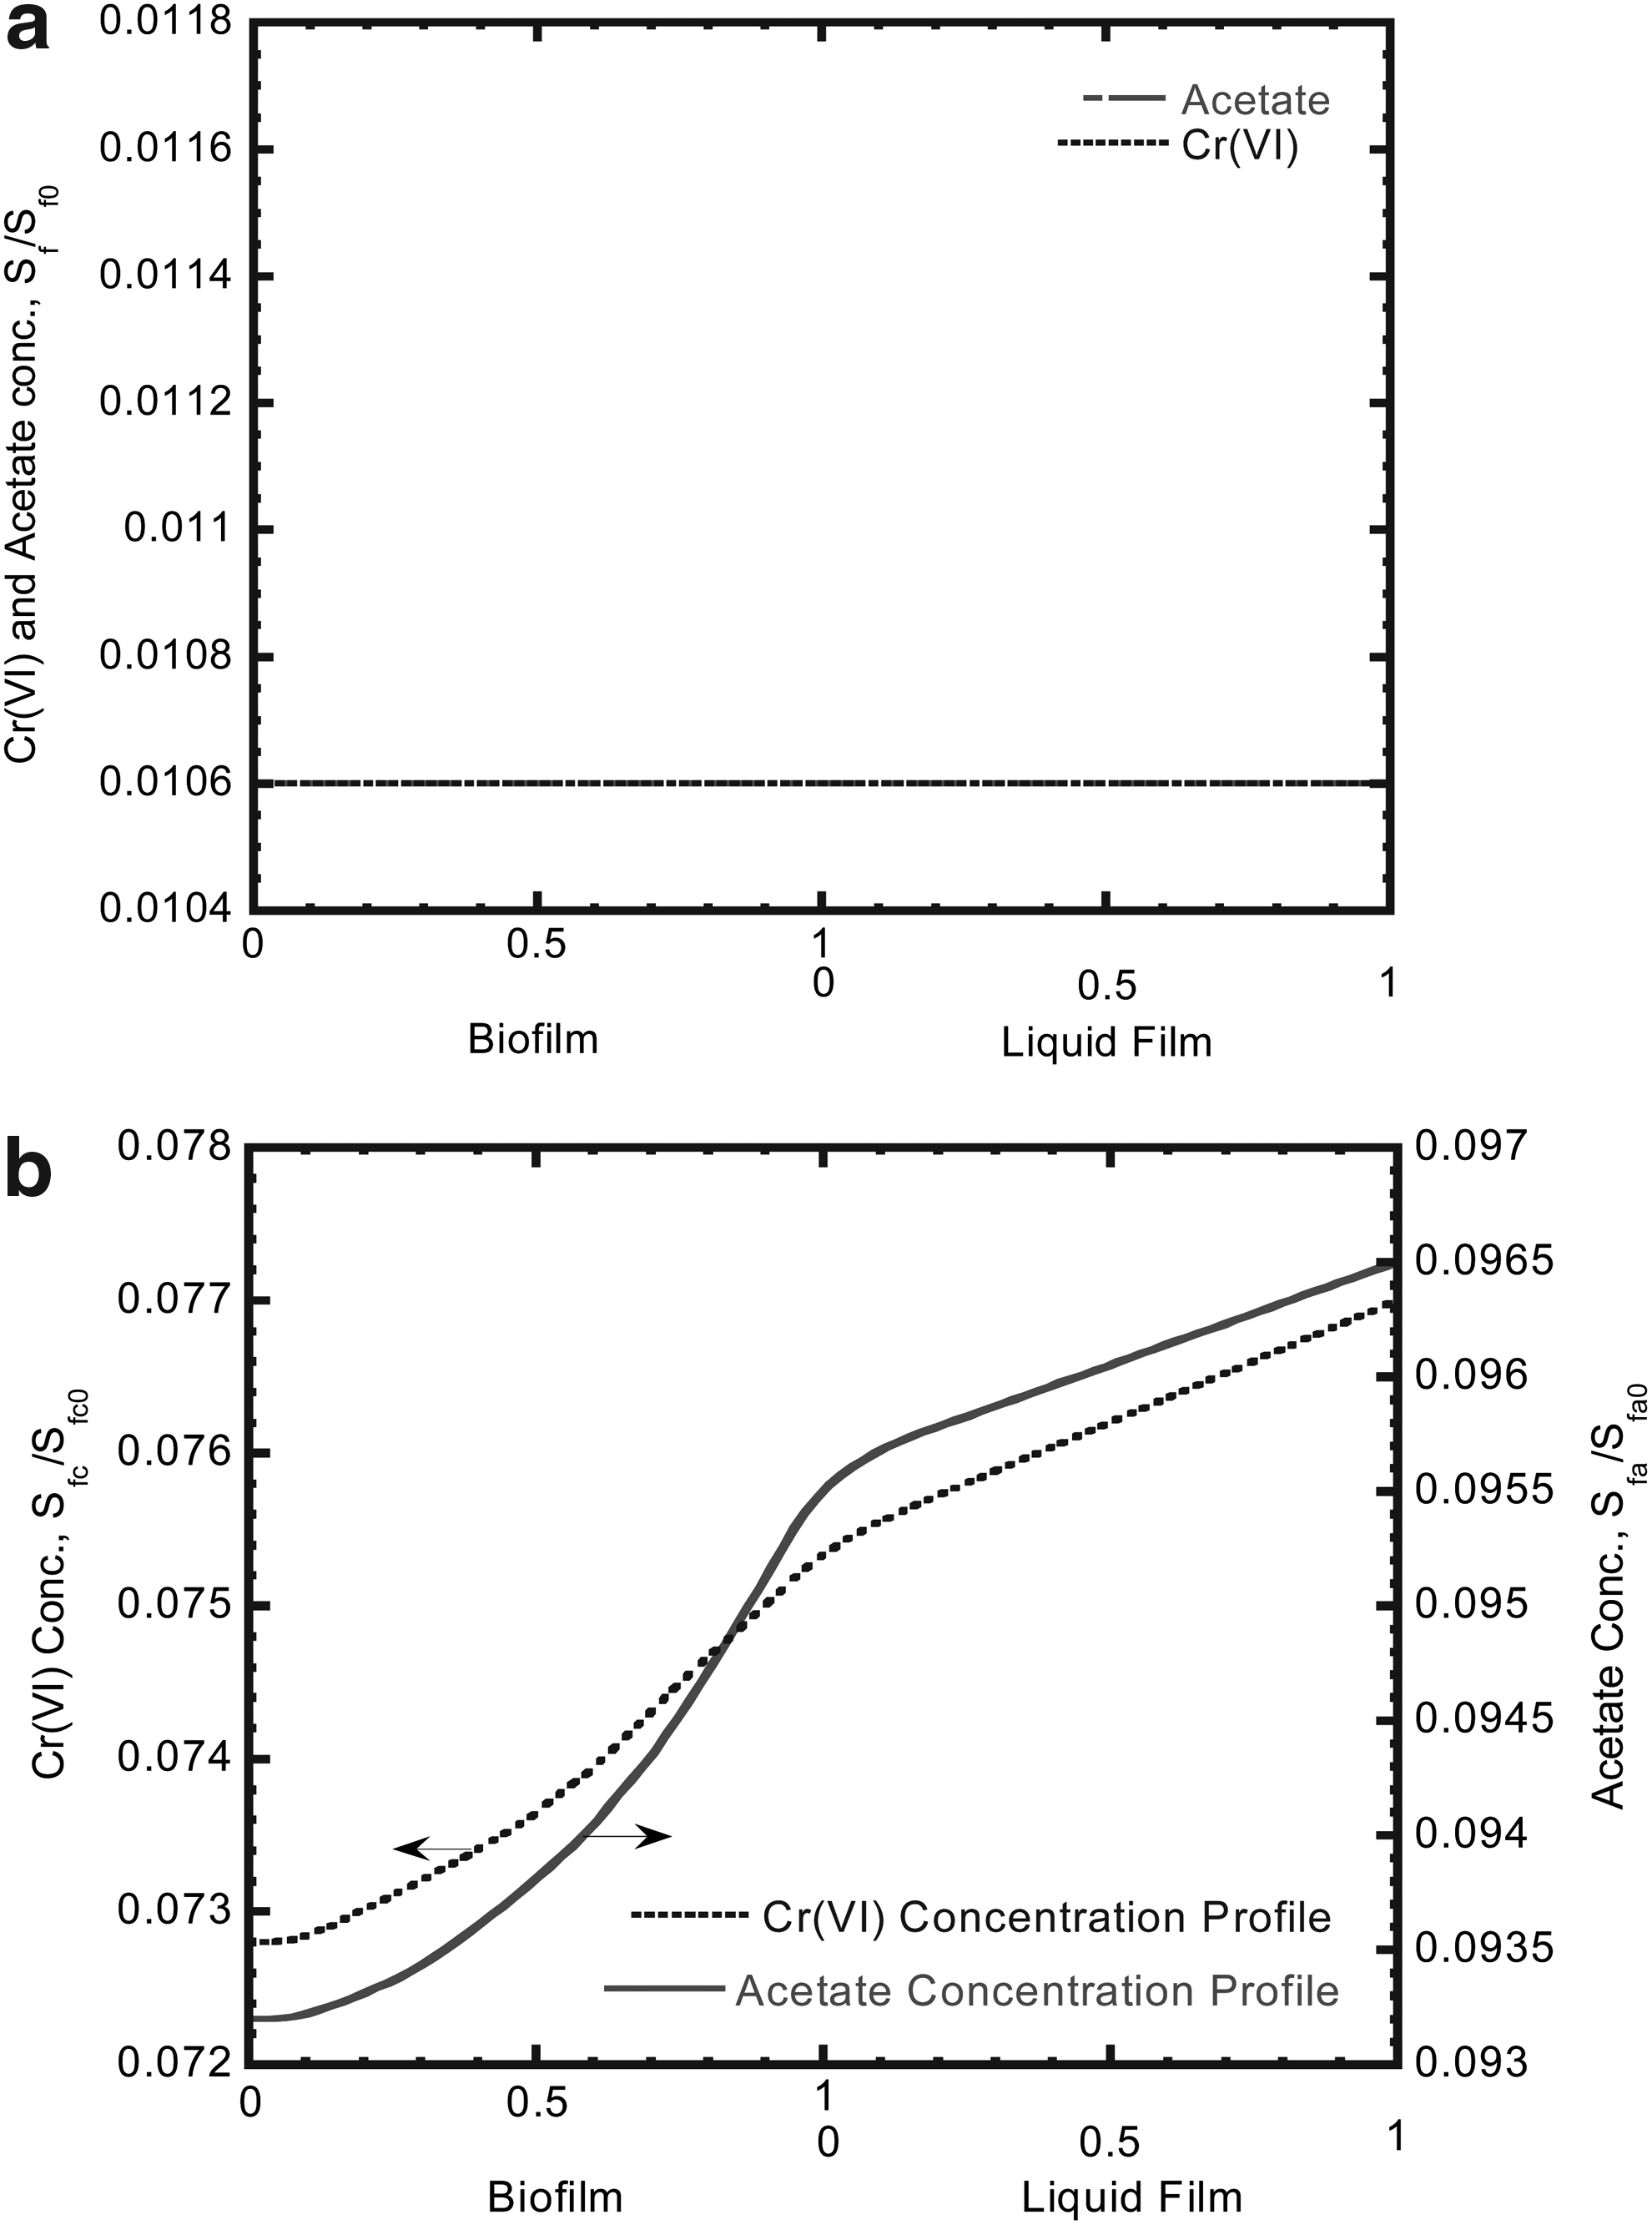
Cr(VI) and acetate concentration profiles in the liquid film and biofilm at different biofilm thicknesses and times
Cr(VI) reduction at different influent Cr(VI) concentrations
Figure 7 shows that Cr(VI) reduction varied with time in the fixed biofilm reactor under influent Cr(VI) concentrations of 10 and 20 mg/L. As can be seen in Fig. 7a and b, the general trend of the variation of effluent Cr(VI) concentration curves is almost the same under influent Cr(VI) concentrations of 10 and 20 mg/L. The model predicted the experimental results well according to the low values of LSV. Nkhalambayausi-Chirwa and Wang (2001) conducted a fixed biofilm reactor for simultaneous Cr(VI) reduction and phenol biodegradation. They found that the removal efficiency reached up to 100% when influent Cr(VI) concentration was about 10 mg/L. As the influent Cr(VI) concentration was maintained at 20 mg/L, the removal efficiency of Cr(VI) still reached up to ∼97%. In their study, however, when the influent Cr(VI) concentration was increased to about 32 mg/L, the removal efficiency for Cr(VI) at a steady-state condition was sharply decreased to about 47%, indicating that Cr(VI) at high concentration inhibited biological activity. In this study, the steady-state Cr(VI) removal efficiencies ranged from 95% to 99% for influent Cr(VI) loading rate of 22.5 g/[m3·day] and 93–98% for influent Cr(VI) loading rate of 45 g/[m3·day]. There was no significant inhibition of Cr(VI) reduction found in this study.
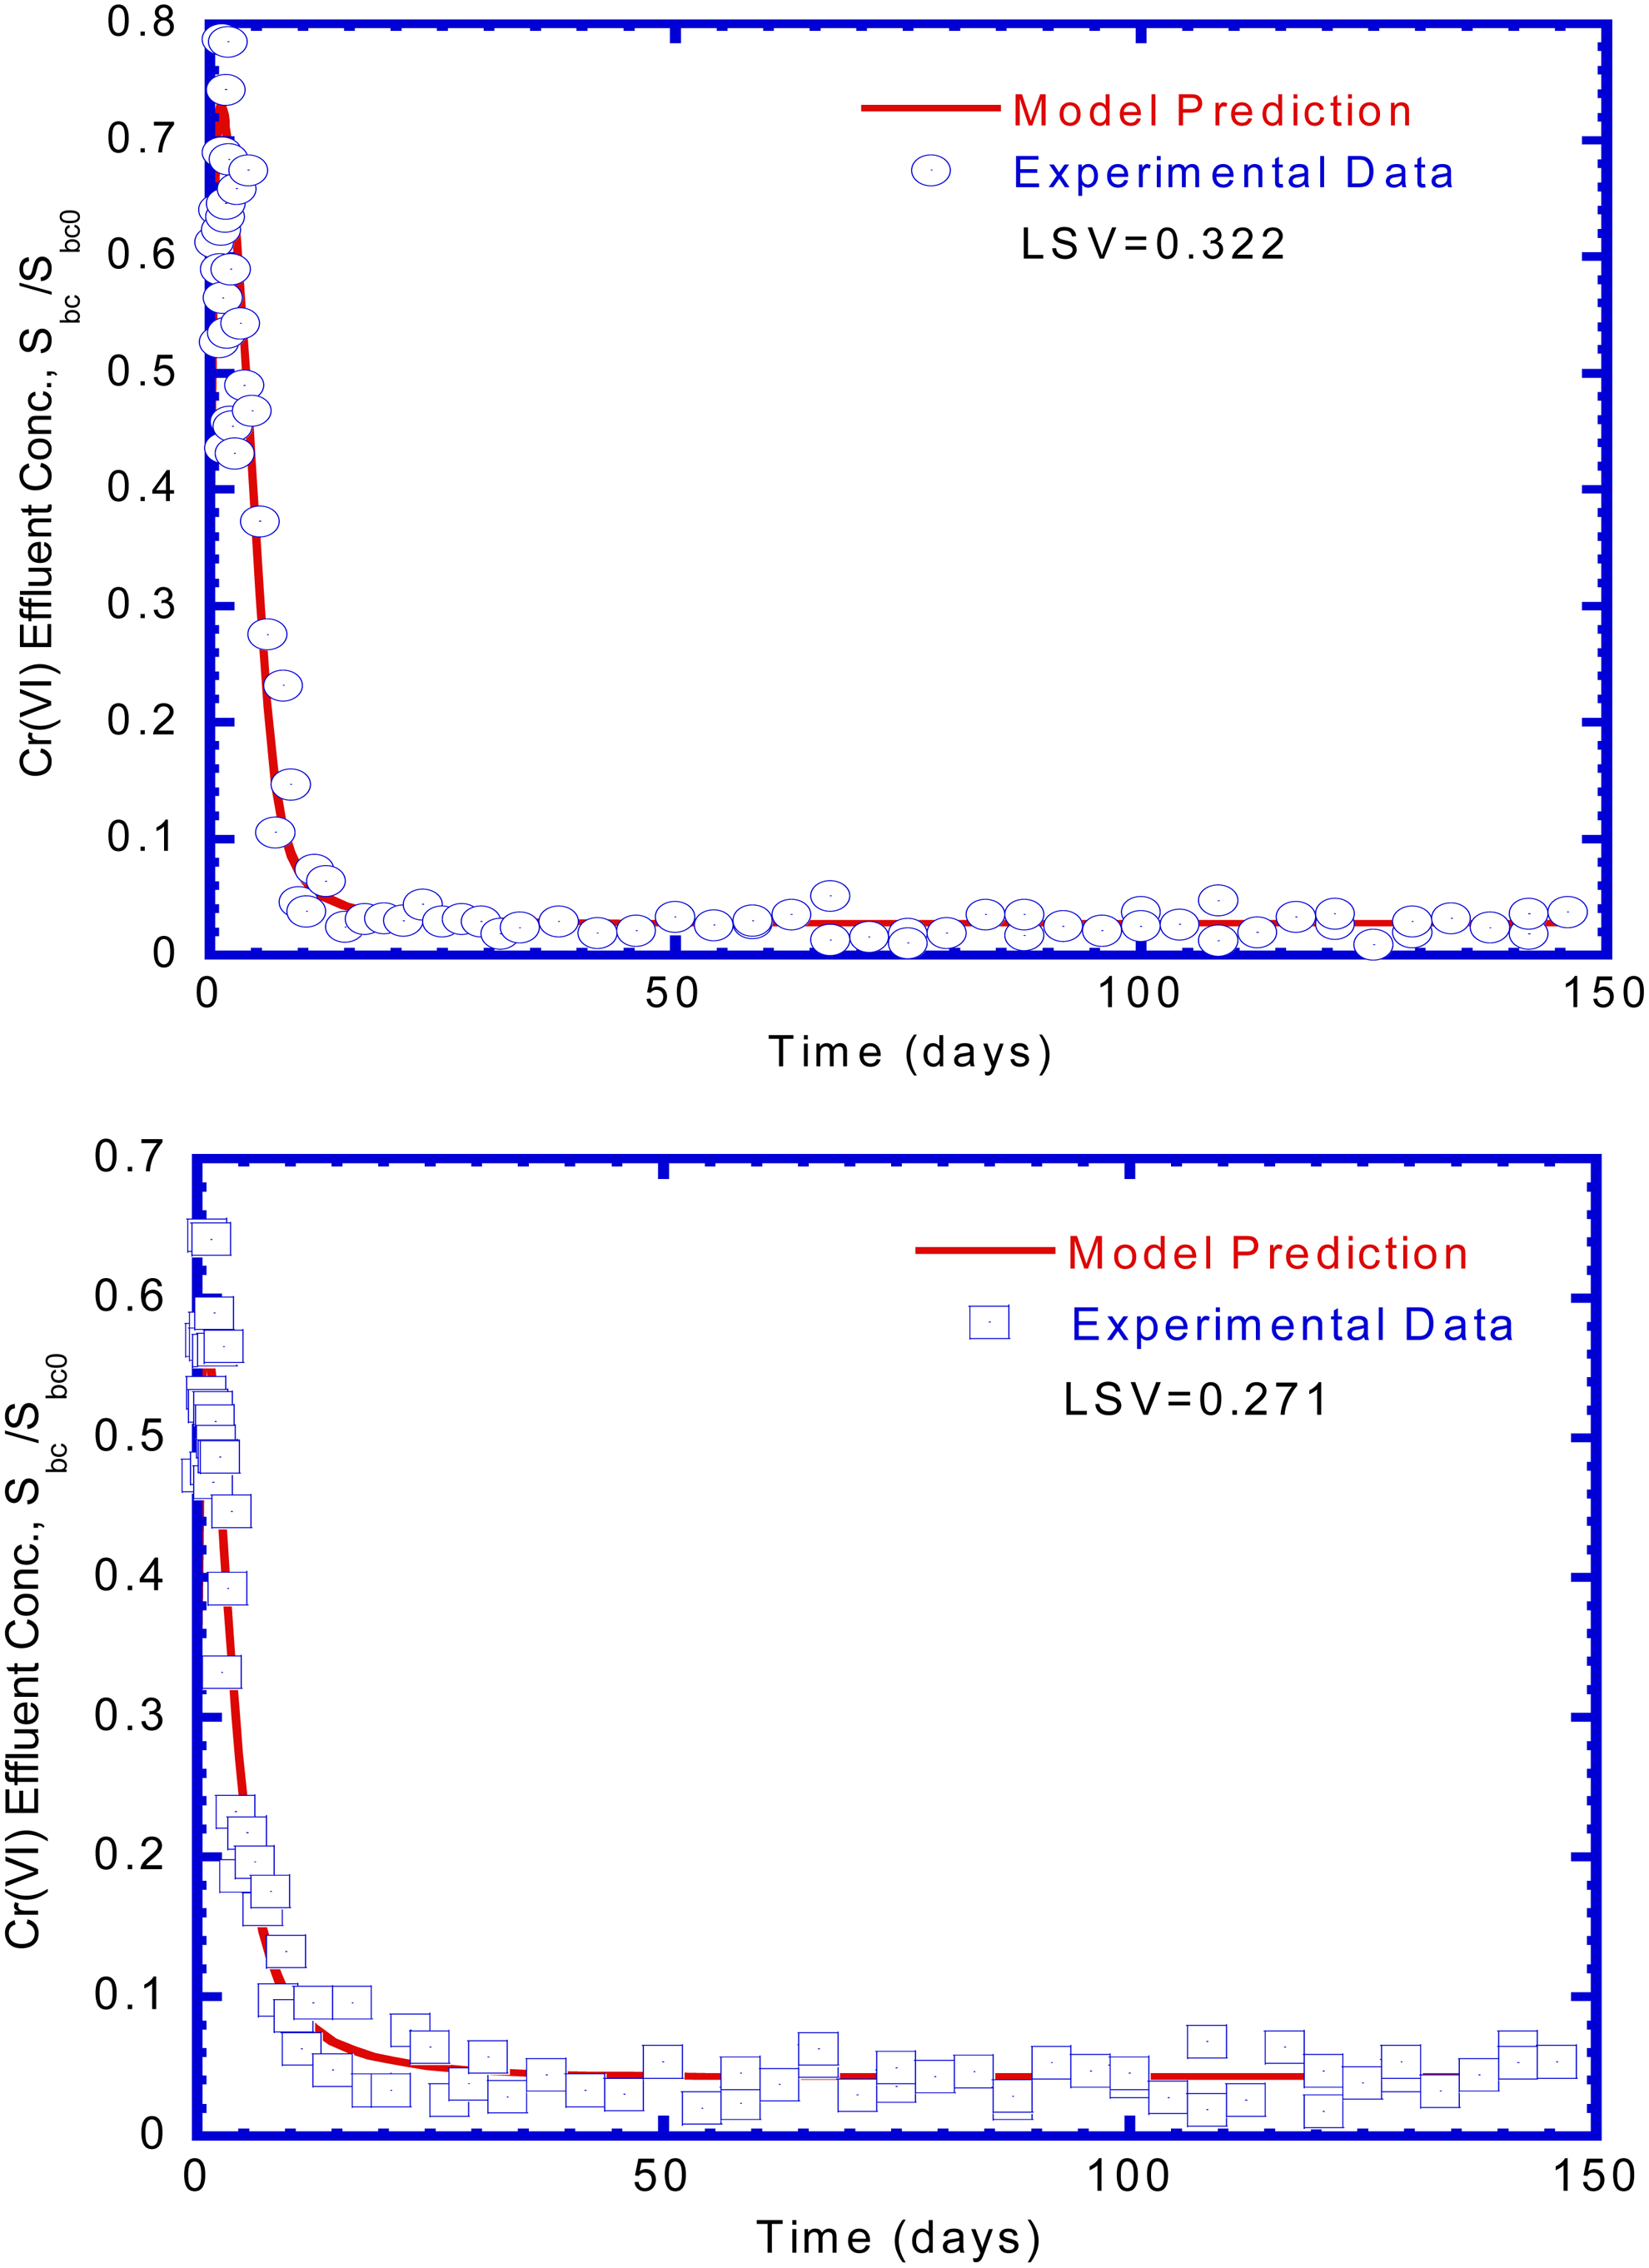
Experimental data and model predictions for effluent Cr(VI) concentrations in the column tests
Cr(VI) reduction under anaerobic and aerobic conditions
The time course of Cr(VI) reduction by E. coli cells under anaerobic and aerobic condition is shown in Fig. 8a. Anaerobic E. coli culture was obtained by purging the culture with nitrogen gas, while dissolved oxygen level of about 6.4±0.2 mg/L was obtained by continuously purging the culture with air. The experimental data in Fig. 8a show a higher Cr(VI) reduction rate by anaerobic E. coli culture than that by aerobic E. coli culture. This observation was in close agreement with the results obtained by Shen and Wang (1993) who found an apparent uncompetitive inhibition behavior of oxygen toward Cr(VI) reduction activity in the batch test. However, in our study, the complete Cr(VI) reduction was obtained after an operation time of about 50 h by bubbling with nitrogen. This experimental result of complete Cr(VI) reduction was similar to that obtained by Shen and Wang (1993).
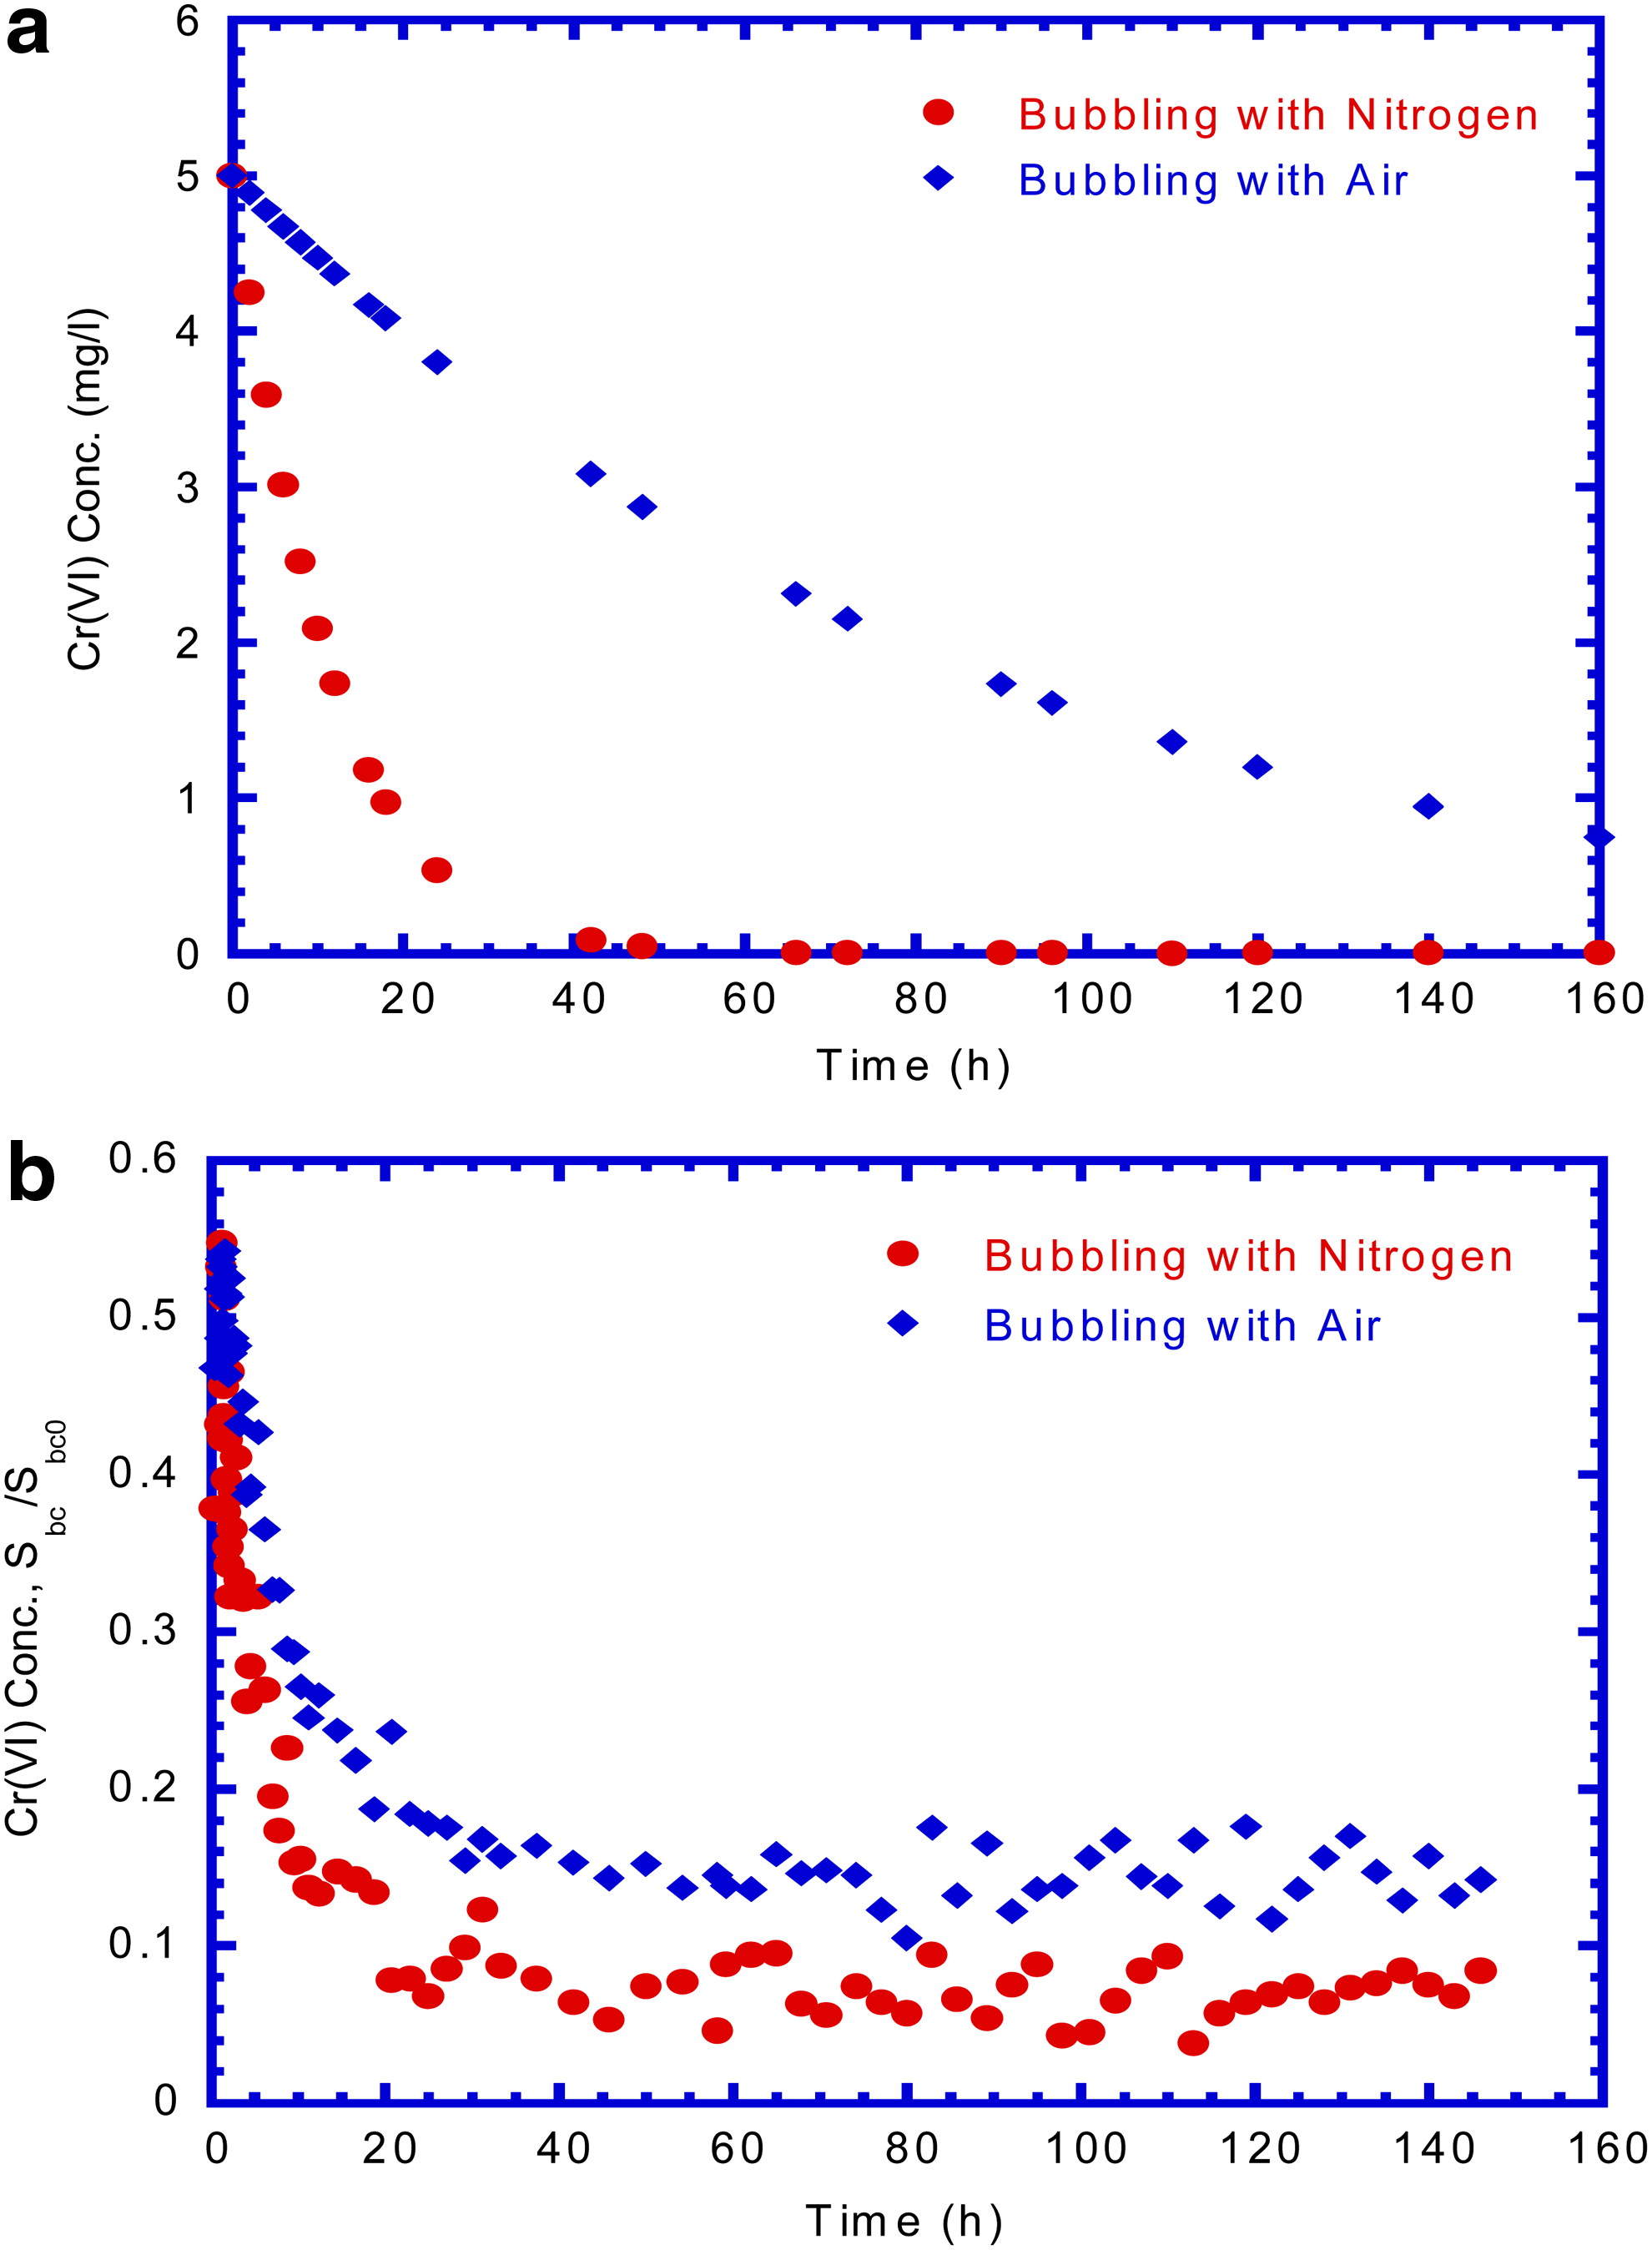
Cr(VI) reduction by E. coli cells with bubbling nitrogen and air
Figure 8b presents the effluent Cr(VI) concentration varied with time in the column tests by bubbling with nitrogen and with air. The general trend of effluent Cr(VI) concentration curves are similar in both control conditions. At steady state, the removal efficiency of Cr(VI) concentration was found to be 92% to 86%, respectively, under anaerobic and aerobic condition. The experiment data show that Cr(VI) reduction was repressed by dissolved oxygen and that anaerobic cultures showed a higher rate of Cr(VI) reduction than aerobic cultures (Shen and Wang, 1993).
Microbial community on ceramic particle
Figure 9 shows the amount of attached E. coli distributed on the surface of a ceramic particle at different times. The attached E. coli is rod shaped. Comparing Fig. 9a with b, it is evident that the amount of attached E. coli increased with operating times from 5 to 75 days. On day 75, the fixed biofilm process had reached a steady-state condition and the amount of grown attached E. coli approached the maximum (Fig. 9b).
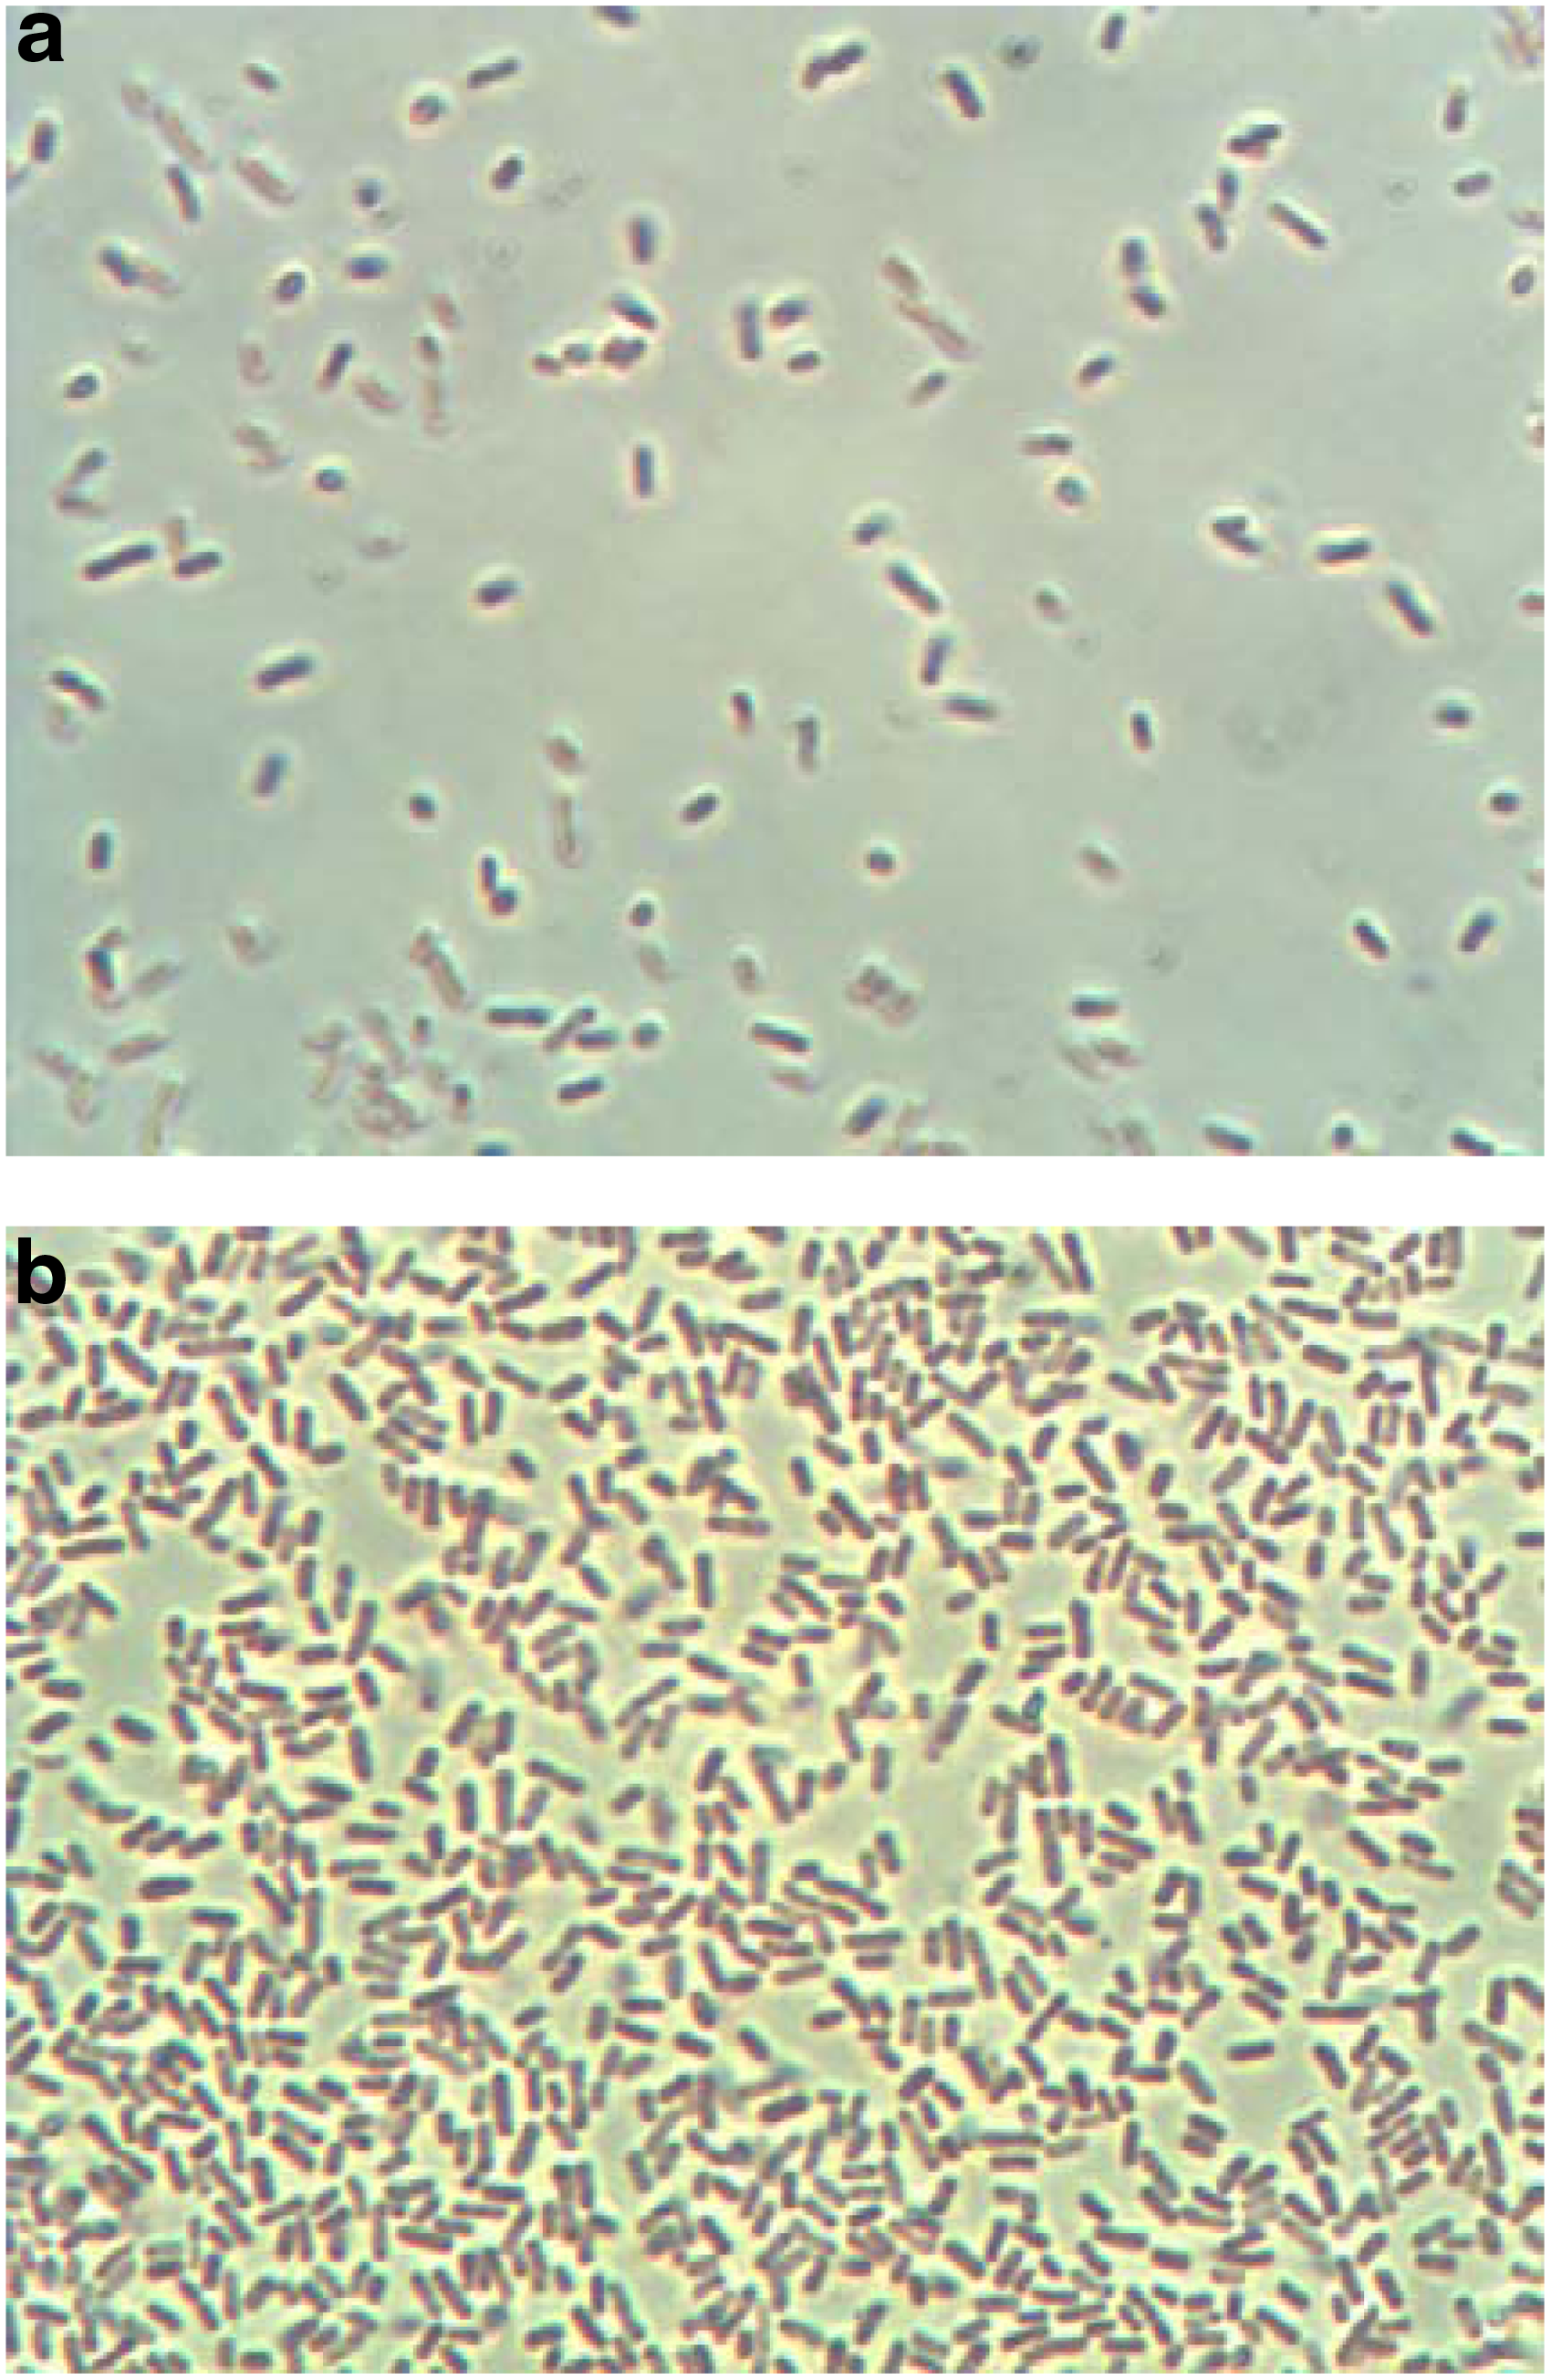
Amount of E. coli on ceramic particles at different operation times
Conclusions
The model system was derived to describe the Cr(VI) reduction with acetate biodegradation using ceramic particle as a supporting medium in a fixed biofilm reactor. Experimental results demonstrate that the fixed biofilm process is able to attain high efficiencies for Cr(VI) reduction and acetate utilization by E. coli cells. With assumed value of initial biofilm thickness (Lf0), the mathematical model fairly well simulated the experimental results for the effluent concentrations of Cr(VI) and acetate, effluent concentration of suspended E. coli, and Cr(III) production during the time course of process performance. Attached and suspended E. coli cells simultaneously reduced Cr(VI) and biodegraded acetate to approach a maximum growth at the steady state. The Cr(VI) flux diffusing from bulk liquid into biofilm increased rapidly as E. coli biofilm grew vigorously during the transient-state period. The effluent concentration of Cr(III) at a steady-state condition was ∼1.6 mg/L while influent Cr(VI) concentration was maintained at 11.3 g/[m3·day]. The steady-state Cr(VI) removal efficiencies ranged from 95% to 99% for influent Cr(VI) loading concentration of 22.5 g/[m3·day] and 93–98% for influent Cr(VI) loading rate of 45 g/[m3·day]. The experimental results closely agree with the results of the model simulation.
Footnotes
Acknowledgments
The authors would like to thank the Ministry of Science and Technology of Taiwan for partially supporting this research under Contract No. NSC 96-2221-E-166-004-MY2. Ted Knoy is also acknowledged for his editorial assistance.
Author Disclosure Statement
No competing financial interests exist.
Notations
γ=mass ratio of Cr(VI) reduced per acetate consumed (MsMs-1)
μb=absolute viscosity of water (ML-1T-1)
φb=association parameter
μ=specific growth rate (T-1)
Af=total surface area of ceramic particle (L2)
b=decay coefficient of E. coli cells (T-1)
bs=shear-loss coefficient of E. coli cells (T-1)
Cp=concentration of Cr(III) in bulk liquid (MsL-3)
Dfa=diffusion coefficient of acetate in biofilm (L2T-1)
Dfc=diffusion coefficient of Cr(VI) in biofilm (L2T-1)
dp=diameter of ceramic particle (L)
Dwa=diffusion coefficient of acetate in bulk liquid (L2T-1)
Dwc=diffusion coefficient of Cr(VI) in bulk liquid (L2T-1)
Jfc=flux of Cr(VI) from bulk liquid into E. coli biofilm (MsL-2T-1)
k=Monod maximum specific utilization rate of acetate (MsMxT-1)
kfa=liquid film transfer coefficient of acetate (LT-1)
kfc=liquid film transfer coefficient of Cr(VI) (LT-1)
Ksa=Monod half-velocity coefficient of acetate (MsL-3)
Ksc=Monod half-velocity coefficient of Cr(VI) (MsL-3)
Lf=thickness of E. coli biofilm (L)
Lf0=initial thickness of E. coli biofilm (L)
Lw=stagnant liquid-layer thickness (L)
M=mass, in general
Mb=molecular weight of solvent (M)
Ms=mass of chemicals
Mx=mass of E. coli cells
Q=influent flow rate (L3T-1)
Re=Reynolds number=
rf=radial distance in biofilm (L)
Sa=concentration of acetate (MsL-3)
Sba=concentration of acetate in bulk liquid (MsL-3)
Sba0=concentration of acetate in the feed (MsL-3)
Sbc=concentration of Cr(VI) in bulk liquid (MsL-3)
Sbc0=concentration of Cr(VI) in the feed (MsL-3)
Sc=concentration of Cr(VI) (MsL-3)
Sc=Schmidt number=
Sfa=concentration of acetate in biofilm (MsL-3)
Sfc=concentration of Cr(VI) in biofilm (MsL-3)
Ssa=concentration of acetate at liquid/biofilm interface (MsL-3)
Ssc=concentration of Cr(VI) at liquid/biofilm interface (MsL-3)
T=absolute temperature (K)
t=time (T)
V=effective working volume of reactor (L3)
Va=molar volume of solute A as liquid at its normal boiling point (L3 mol-1)
vs=superificial flow velocity through column (LT-1)
Xb=concentration of E. coli cells in bulk liquid (MxL-3)
Xb0=initial concentration of E. coli cells in bulk liquid (MxL-3)
Xf=density of E. coli cells in biofilm (MxL-3)
Y=growth yield of E. coli cells (MxMs-1)
α=conversion factor for reduction of Cr(VI) to Cr(III) (MsMs-1)
ɛ=reactor porosity (dimensionless)
μmax=Monod maximum specific growth rate (T-1)
υ=kinematic viscosity (L2T-1)