
Abstract
Abstract
Swine waste from a full-scale anaerobic digester was treated for nitrogen removal through partial nitritation coupled to anaerobic ammonium oxidation (anammox) in a 20-L sequencing batch reactor. Digested waste came from an 8,000-head farm in North Carolina and was characterized by high ammonium content (>2,000 mg N/L) and a relatively high C:N ratio compared with influent of other anammox systems reported in the literature. The reactor was operated with intermittent pulses of oxygen, with dissolved oxygen concentrations maintained continuously below 0.1 mg/L. Under the final operating conditions, the reactor consumed 96% of the influent ammonium and 90% of the total N, with low nitrate in the effluent; no external alkalinity was required to maintain near-neutral pH. The majority of nitrogen removal occurred through anammox activity, which was supported by several observations indicating that nitrification/denitrification (with either nitrite or nitrate) was not the primary means of N removal. Oxygen consumption was at least 49% less than would be expected for complete nitrification of the waste, and the observed consumption of chemical oxygen demand and alkalinity were much less than would have been required for nitrification/denitrification. Nitrous oxide yield was 11% of the removed N, likely as a side product of aerobic ammonium oxidation; ammonia stripping was negligible. This study demonstrated that nitritation/anammox treatment of high-strength, anaerobically digested swine waste is technologically feasible in a one-reactor system under oxygen-limited conditions.
Introduction
S
Our group has investigated the technological and economic feasibility of coupling anaerobic digestion of swine waste for power generation with nitrogen removal through nitrification [the aerobic oxidation of ammonium to nitrite/nitrate; Equation (1)] and denitrification (Staunton et al., submitted; Bunk, 2012). That study was conducted in a pilot-scale nitrification/denitrification system at one of the few swine farms in NC performing full-scale anaerobic digestion in covered lagoons with methane capture. The system was determined to be technologically feasible, but the operating cost might not be economically feasible primarily due to the oxygen and supplemental alkalinity required for complete nitrification.
In 1995, a new bacterium belonging to the phylum Planctomycetes was discovered that can oxidize ammonium anaerobically using nitrite as a terminal electron acceptor (Mulder et al., 1995; Strous et al., 1998). The theoretical reaction is shown in Equation (2), although the actual molar stoichiometry of nitrite removed per unit ammonium removed has been determined empirically to be approximately 1.3, and nitrate has also been observed as a product (Strous et al., 1998; Wett et al., 2010).
The anaerobic ammonium oxidation (anammox) process has since been proven to be a cost-effective technology for treating wastewaters rich in ammonium-N and low in biodegradable organic matter (Jetten et al., 2002). If the primary nitrogenous species in an influent waste is ammonium, anammox must be coupled to the first step of nitrification, the aerobic oxidation of ammonium to nitrite (nitritation) by ammonium-oxidizing bacteria (AOB). A system that utilizes nitritation/anammox as a primary nitrogen removal process should require less than half as much oxygen and reduced alkalinity compared with a nitrification/denitrification system, and no external electron donors would be required due to the autotrophic nature of the bacteria involved.
Despite the potential advantages, there have been limited studies that combine anaerobic digestion of swine waste with nitrogen removal by anammox (Hwang et al., 2005, 2006; Karakashev et al., 2008; Yamamoto et al., 2008; Molinuevo et al., 2009; Zhang et al., 2012; Daverey et al., 2013). Of these, only three studies utilized one-reactor systems (Figueroa et al., 2012; Zhang et al., 2012; Daverey et al., 2013), with the others performing the aerobic and anaerobic reactions in separate reactors. None of these studies provided an in-depth analysis of the stoichiometry of the anammox process when treating high-strength nitrogenous waste (>1,000 mg NH4+-N/L) with a high concentration of chemical oxygen demand (COD/NH4+-N>1.0).
There are three key challenges involved with successful treatment of waste by nitritation/anammox in a single reactor: converting a fraction of the ammonium to nitrite in stoichiometric balance with the remaining ammonium; preventing out-competition of the anammox bacteria by heterotrophic denitrifiers capable of utilizing nitrite as an electron acceptor; and minimizing the oxidation of nitrite to nitrate by nitrite-oxidizing bacteria (NOB). In addition, although nitrite is a necessary substrate, its accumulation must be controlled because it is inhibitory to anammox bacteria (Jin et al., 2012). This is especially problematic in wastewaters that contain a high concentration of ammonium, which could lead to a high concentration of nitrite in the reactor.
These challenges can be addressed by utilizing a sequencing batch reactor (SBR) under oxygen-limited conditions, with intermittent input of oxygen superimposed on otherwise anoxic conditions; such alternating conditions are analogous to how SBRs can achieve nitrification/denitrification in a single reactor (Palis and Irvine, 1985). This reactor configuration should allow for controlled conversion of ammonium to nitrite and simultaneous or sequential conversion of the nitrite to nitrogen gas through anammox. Aerobic ammonium oxidizers have a higher affinity for oxygen than NOB (Pérez et al., 2014), and oxygen limitation has been shown to be an effective technique for the inhibition of NOB at full scale (Lackner et al., 2014). This setup should also allow for the majority of influent biodegradable COD to be consumed aerobically, minimizing the amount of COD available as an electron donor for denitrification and stabilizing nitrogen removal by the anammox process.
In this study, we evaluated the technical feasibility of a single-reactor nitritation/anammox system for removing nitrogen from anaerobically digested swine waste. Of particular interest were the operation of an SBR for controlled nitritation and a stoichiometric analysis of the relative contributions of anammox versus denitrification for nitrogen removal.
Experimental Protocols
Experimental design and overview
Anaerobically digested swine waste was obtained from a covered anaerobic lagoon at Butler Farms in Lillington, NC. General characteristics of the farm and the digested waste composition from samples collected over a 9-month period as part of an on-site pilot study are provided elsewhere (Staunton et al., in press). The present study was carried out in a laboratory system comprising a 20-L (working volume) SBR.
Because there is limited experience with nitritation/anammox treatment of digested swine waste in an SBR, we approached reactor design and process operation heuristically. Without a priori knowledge of the optimum loading rate, cycle time, or frequency of intermittent oxygen addition, the reactor was operated for a long period (over 450 days) in which these variables were adjusted. The goal was to increase the loading rate while maximizing ammonium removal and minimizing nitrite accumulation, recognizing that the key groups of bacteria (AOB and anammox bacteria) grow very slowly. Details of operating conditions before the final conditions were selected are provided in Appendix A.1 of Supplementary Data.
The SBR was initially seeded with a combination of granular anammox biomass from an anammox reactor operated by the City College of New York and return activated sludge from the Orange Water and Sewer Authority wastewater treatment plant (Chapel Hill, NC) as a source of AOB. After an episode of excess aeration, in which nitrite accumulated to inhibitory levels and anammox activity did not resume, the reactor was reseeded with ∼900 mL of cyclone underflow from a full-scale, sidestream deammonification system at the Hampton Roads (Virginia) Sanitation District.
The final reactor design and operating conditions (as described below and in Appendix A.1 of the Supplementary Data) were established 65 days before the termination of the study. The design, operation, and performance information provided below are from this period only. A single batch of digested swine waste from Butler Farms was used over this period and stored at 4°C. The start of the final period of operation is defined as day 0 and any data shown in Supplementary Data for periods preceding that day are shown as negative values.
Chemicals
All chemicals and standards were purchased from Fisher Scientific (Pittsburgh, PA) unless otherwise noted. Compressed air (breathing air, grade D), oxygen (USP grade), nitrogen (industrial grade), and helium (UHP, grade 5.0) were purchased from Airgas (Durham, NC). The standard for gas chromatographic (GC) analysis of the major gases was obtained from Scott Specialty Gases (Plumsteadville, PA) and consisted of 20% oxygen (O2) and 1% carbon dioxide (CO2), with the balance being nitrogen (N2). Nitrous oxide (N2O, 99%) was obtained from Sigma-Aldrich (Allentown, PA).
Reactor design
General features of the reactor design are provided below, with a schematic shown in Fig. 1. Other physical details of the reactor and its components are summarized in the Supplementary Data.
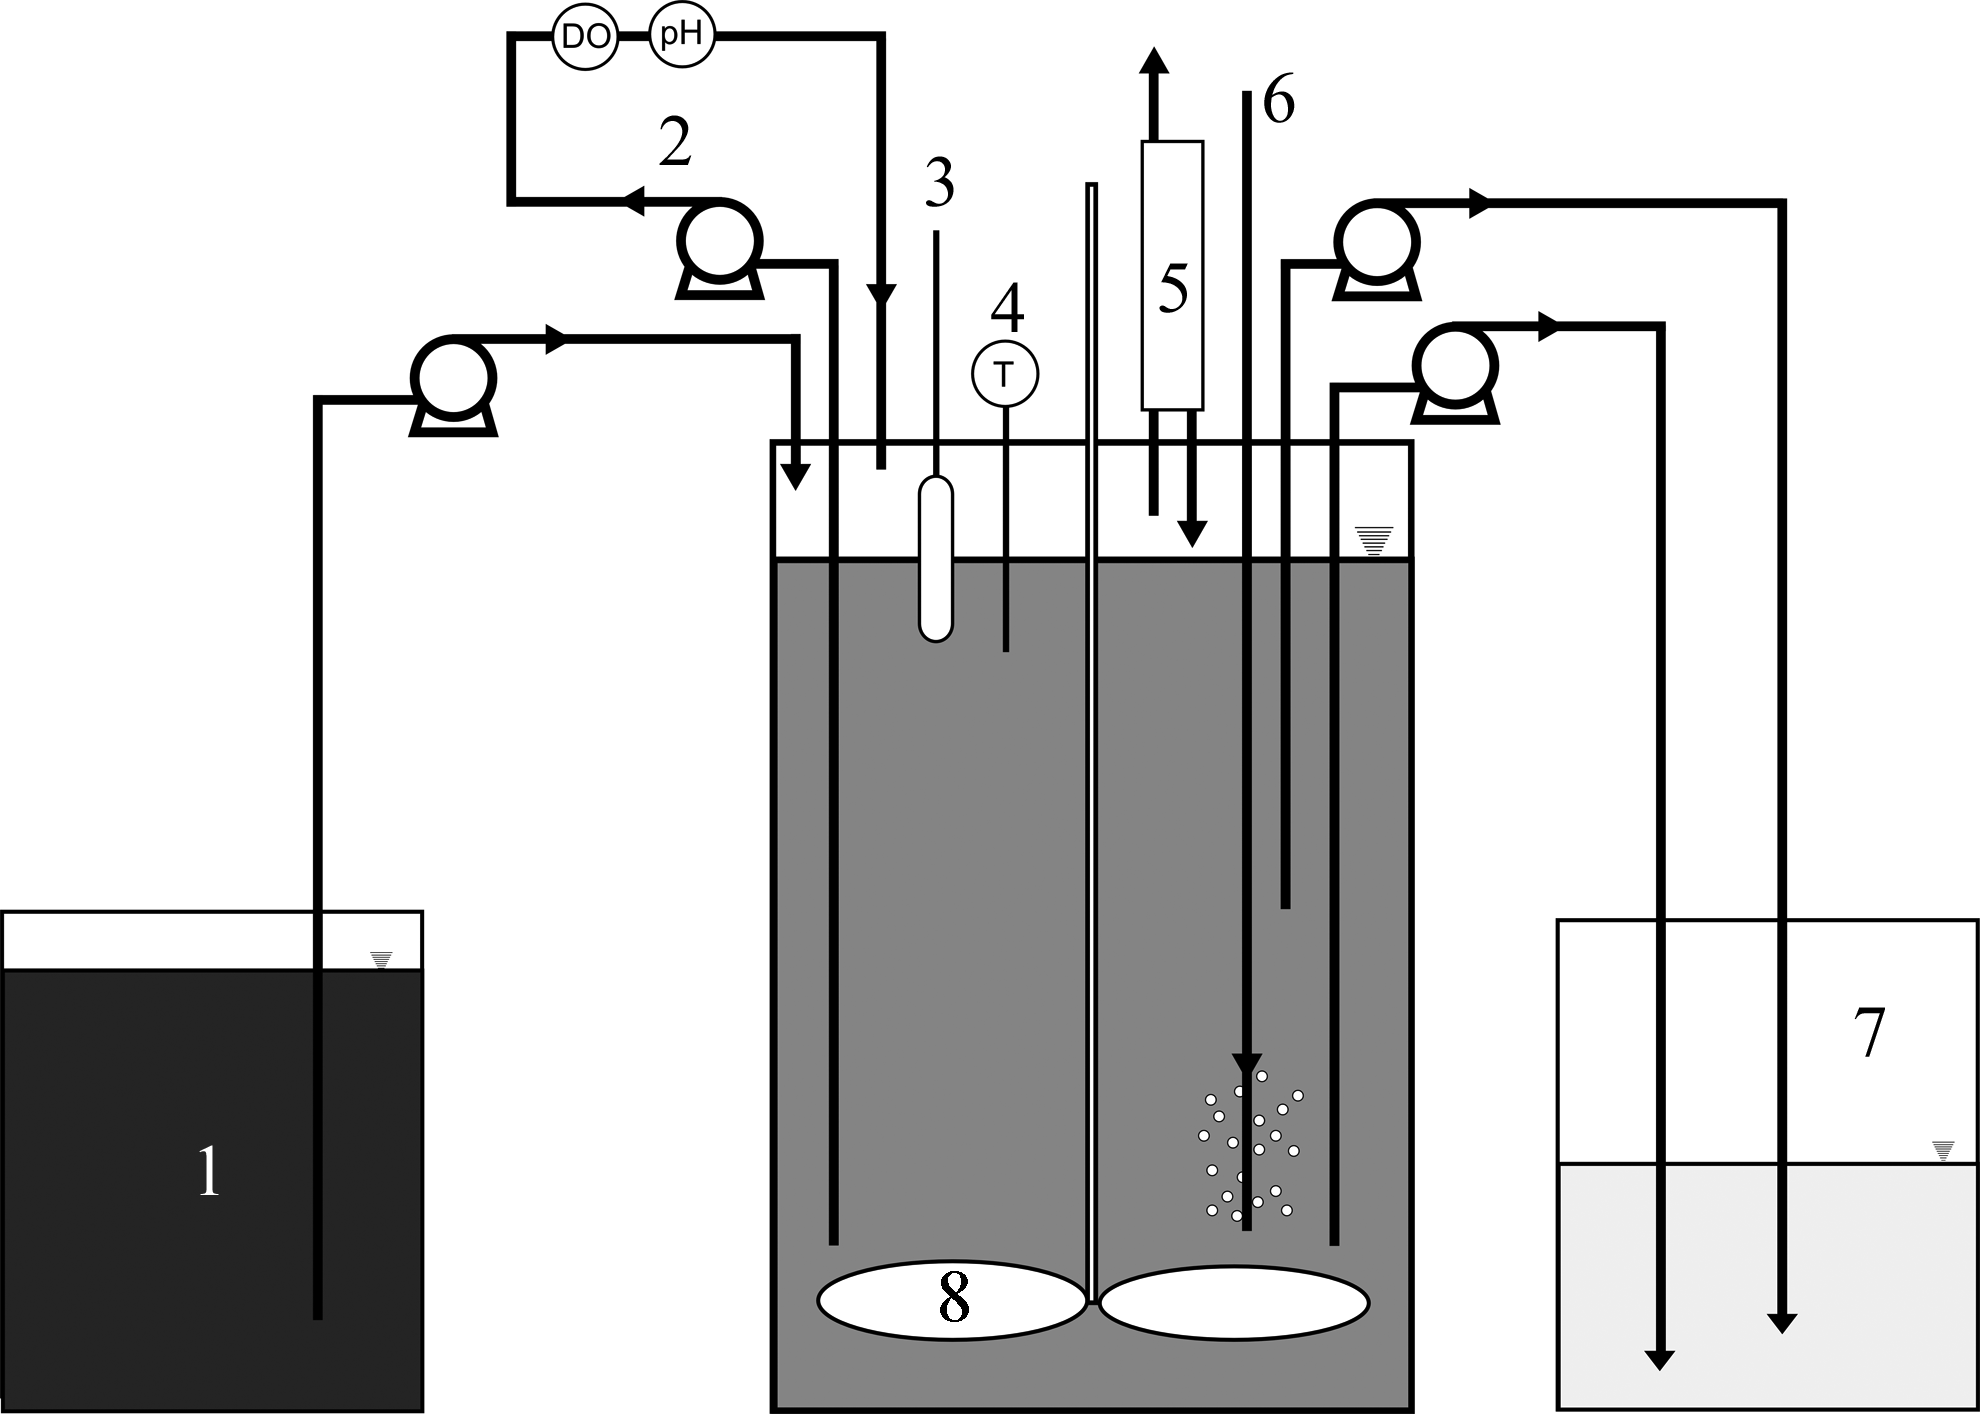
Schematic diagram of lab-scale nitritation/anammox reactor. 1: Anaerobically Digested Swine Waste/System Feed. 2: Recirculation Loop for Monitoring pH and DO. 3: Floating Level gauge 4: Temperature Probe. 5: Off-gas Condenser. 6: Oxygen Diffuser. 7: Effluent Storage Tank. 8: Impeller Mixer.
The reactor consisted of a 20-L (working volume) cylindrical stainless steel (SS) vessel with an inside diameter (ID) of 28.2 cm and a depth of 40.3 cm; the liquid level in the reactor was 34.6 cm. The reactor vessel was flanged with a 1.3-cm-thick SS plate, to which the top headplate (also 1.3-cm-thick SS) was bolted. A 0.16-cm butyl rubber gasket between the headplate and flange provided a gastight seal. The upper ∼55% of the liquid volume contained Kaldnes K1 media (Pentair Aquatic Eco-Systems, Inc., Apopka, FL), which have a protected specific surface area of 500 m2/m3 (∼6 cm2/piece). The reactor was suspended in an insulated water bath maintained at 35°C with a precision immersion circulator (Techne TU-20D, rated temperature stability 0.005°C; Cole Parmer instrument Co., Vernon Hills, IL).
Tubing was inserted through the reactor headplate for influent, effluent, a recirculation loop for monitoring pH and dissolved oxygen (DO), temperature probe, O2 supply, and off-gas. The reactor headplate was also equipped with a 3.2-cm-diameter sample port with a threaded nylon plug made gastight with a 0.16-cm-thick butyl rubber gasket. The reactor was vented such that headspace pressure was near atmospheric pressure. The off-gas line was equipped with an SS water-jacketed condenser (18.4 cm long, 2.8 cm ID); cold (6–8°C) water flowed through the jacket cocurrent with the off-gas, and the condensate was returned to the reactor. All other openings in the headplate were sealed gastight with PTFE or nylon Swagelok® fittings.
Reactor pH and DO were measured with Hanna Instruments (Woonsocket, RI) BlackStone BL981411 pH Mini controller and model HI8410 DO controller, respectively; both controllers were used as in-line meters rather than for process control. Temperature was measured with a ProSense RTD0100-06-030-H thermistor.
Pure oxygen was delivered to the reactor through a 3.2-mm ID SS perforated lance diffuser. The diffuser had two sets of five perforations (16-mm openings) on opposite sides of the lance at vertical intervals of 1.25 cm from the bottom of the lance. Oxygen flow was controlled at 1 L/min with an Omega (Stamford, CT) FMA5400/5500 mass flow controller at a source pressure of 345 kPa gauge. Each pulse of oxygen was timed using an Auber (Alpharetta, GA) ASL-51 timer.
Feed and reactor effluent were transferred with dedicated peristaltic pumps (MasterFlex computerized drive with Easy-Load II head and high-performance precision Norprene® L/S 36 tubing, 9.5 mm ID; Cole-Parmer). The feed and decant volumes were pumped from or into, respectively, a 2-L graduated cylinder until the target volume was delivered.
Mixing in the reactor was provided by a mechanical mixer suspended from the reactor headplate through gastight shaft housing with ceramic seals. The mixer was driven by a direct current motor with a speed controller and was run continuously at 135 RPM, except for settle and decant periods. It consisted of two impellers located at different depths, with the lower impeller providing most of the mixing of the fluid phase. The upper impeller was installed at the liquid surface to maximize oxygen transfer from the reactor headspace.
Operating conditions
The reactor cycle was 2 days, with 1.0 L of digested swine waste fed per cycle. Each cycle was divided into four periods: feed (10 min), react, settle (1 min), and decant (5 min). All reported times are nominal; any time not accounted for in the feed, settle, and decant periods was utilized in the react period. Due to the heterogeneous biomass within the reactor (Supplementary Data A.7), it was not possible to accurately quantify the solids inventory and therefore not possible to quantify an effective solids retention time.
To promote oxygen-limited conditions, oxygen was provided with intermittent pulsing at a frequency determined empirically; the final condition was 6 s O2 flow, followed by 37 min without flow. The volume of O2 delivered per pulse was measured independently (Supplementary Fig. S1). An oxygen transfer efficiency study was conducted to assess diffuser performance (Supplementary Fig. S2). Oxygen was also measured in the reactor off-gas to assess system oxygen transfer (combined transfer from the diffuser and the reactor headspace) using a mass balance analysis (not shown). Oxygen transfer efficiency through the diffuser was only 0.43%; the overall system transfer was 83%±7%, indicating that the majority of oxygen transfer was from the headspace.
Sample collection
Single samples were collected routinely from the reactor effluent or occasionally from the internal recirculation line (especially for intracycle sampling events). Samples were immediately filtered through Whatman GF/B glass fiber filters and frozen for subsequent analysis. Samples were analyzed less than 1 week after collection.
Physical and chemical analyses
Physical and chemical analyses were performed as previously described (Staunton et al., in press), except for total nitrogen (TN) and total dissolved N (TDN). Typically, triplicate measurements were made from a single dilution (100× −2,000× as needed), but periodically a single measurement each of triplicate dilutions was performed to ensure method accuracy.
Total N and TDN were measured by oxidizing unfiltered and filtered samples (diluted 1,000× −10,000× as needed), respectively, with Fluka brand potassium persulfate (Sigma-Aldrich) under alkaline conditions according to the method of Solorzano and Sharp (1980). Ammonium chloride was used to prepare standard curves.
Shards of plastic from abraded K1 media were observed in the reactor effluent, which contributed to measured effluent total COD (tCOD). To account for the contribution of plastic tCOD during routine measurements, the actual mass of effluent tCOD was estimated from the ratio of consumed soluble COD (sCOD) to consumed tCOD, excluding the plastic. At the termination of reactor operation, the reactor contents were passed through a 75-μm (Tyler Standard Mesh No. 200) sieve to separate the plastic shards from the majority of the other solids; the sCOD and tCOD concentrations of the unretained volume were then measured and subtracted from the respective influent values to calculate consumption. The ratio of consumed sCOD to consumed tCOD was ∼0.7 (data not shown), which was combined with measured sCOD values to estimate the actual mass of nonplastic tCOD in the reactor effluent.
Off-gas composition and flow
After passing through the condenser, reactor off-gas was routed to a Gow-Mac series 350 GC with a thermal conductivity detector (Gow-Mac Instrument Co., Bethlehem, PA) fitted with a Valco injection valve and digital valve interface (Valco Instrument Co., Houston, TX). Unless an off-gas analysis was desired, the off-gas flowed continuously through the injection valve and bypassed the GC. Periodically, samples of off-gas were diverted to the GC by automatic injection. Injections were timed to correspond with the end of a pulse of oxygen and halfway between pulses (every 18.55 min).
The GC was operated isothermally at 35°C with a detector temperature of 58°C and detector current of 110 mA. The column was a CTR-1 coaxial packed column (Alltech Associates, Deerfield, IL), 2 m long×0.6 cm diameter. The carrier gas was helium with a flow rate of 60 mL/min at 207 kPa gauge. Injection valve control and data acquisition, integration, and analysis were performed by an SRI Model 203 PeakSimple Chromatography Data System (SRI Instruments, Torrance, CA). Concentrations of O2, CO2, N2, and N2O were quantified by comparison with standards of known composition. Off-gas ammonia was captured in 0.2% boric acid and the concentration determined as aqueous ammonium.
To determine the off-gas flow rate, the flow was diverted to a 10-L Tedlar® bag and the bag filled for the duration of a reactor cycle. Volume of the collected gas was measured by water displacement.
Intracycle analysis
To assess dynamic conditions in the reactor during a cycle, samples were taken at 0.5, 1, 2, 4, 6, 12, 24, 32, 38, and 48 h after the start of a cycle; the samples were analyzed for nitrogenous species and COD.
Maximum rate estimates
Near the end of reactor operation, the maximum rates of relevant biological processes were determined in two separate in-reactor experiments, each consisting of four consecutive periods. In both cases, the rate experiment was started immediately after a normal feeding. In period (i), strictly anoxic conditions were imposed by purging the reactor with N2, followed by intermittent pulsing of N2 at the pulsing frequency normally used to supply O2; nitrite consumption was measured to estimate the combined rate of denitrification and anammox. In period (ii), the sparge gas was switched to O2 for ∼10 h at the normal pulsing frequency, which allowed for nitritation, anammox, and denitrification. In period (iii), oxygen was bubbled continuously through the reactor with the sampling port in the headplate open (although no DO accumulation was observed during this period); nitrite and ammonium consumption were measured to estimate the combined rate of nitritation and anammox. In period (iv), the sparge gas was switched to N2, the headspace purged, and the headplate closed to provide anoxic conditions; on the assumption that all biodegradable COD would have been consumed before period (iv), measuring nitrite and ammonium consumption allowed the maximum rate of anammox to be determined. The maximum rate of denitrification was estimated by the difference in rates of nitrite consumption between period (i) and period (iv). The maximum rate of nitritation was estimated from the rates of change in ammonium and nitrite in periods (iii) and (iv).
Data analyses
The mass of each constituent into or out of the reactor over a cycle was calculated by multiplying the concentration by the incremental volume fed (loading) or decanted (discharge). If a concentration was not measured over a given interval of cycles, it was assumed to equal the average of the concentrations from samples bracketing that interval. Cumulative masses were used to determine daily loading and removal rates for constituents of interest by linear regression. The r2 for cumulative mass versus time was typically greater than 0.95, with the exception of effluent ammonium, for which r2 was 0.85; this was largely a result of continual improvement in ammonium removal under the final operating conditions through the end of the study.
The first three TDN measurements were rejected because they were less than the sum of the independently measured total inorganic nitrogen (TIN) species. Other outliers were determined by a statistical method described previously (Richardson et al., 2012). For gas-phase data, the sum of measured gases was rejected if either any individual component was rejected as an outlier or if the sum was determined to be an outlier. Statistical analyses were done with SAS v 9.3.
Results
Reactor performance
Influent and effluent concentrations of each constituent of interest are summarized in Table 1. Ammonium-N was 85% of the influent TDN and 80% of the influent TN. The ratio of influent tCOD/TN was 1.8, and the ratio of alkalinity/TN in the influent was 3.8 mg CaCO3 (mg N)−1. Because the reactor pH remained near neutral without the addition of any external source of alkalinity, the alkalinity in the influent was sufficient to support the net demand associated with the various nitrogen transformation mechanisms occurring in the reactor.
Data represent mean±standard deviation. Number of samples analyzed is in parentheses. Units are mg/L, except units for pCOD/VSS (mg COD/mg VSS) and alkalinity (mg CaCO3/L).
Assumes all inorganic N in the influent is ammonium.
Particulate COD (sCOD subtracted from tCOD).
Measured on sample passed through a 75-μm screen.
N/D, not determined.
Cumulative mass loading and discharge diagrams generated to assess system performance are shown in Fig. 2; rates calculated from these data are summarized in Table 2. Under the final operating conditions represented by these data, the reactor removed 95% of the influent ammonium and 90% of the total N. Dissolved nitrogen accounted for 66% of the effluent TN. Effluent TDN consisted of 49% NH4+–N, 16% NO2−–N, 13% NO3−–N, and 18% soluble organic N. Nitrate in the reactor effluent accounted for only 1.2% of the removed ammonium. Although difficult to discern in Fig. 2, the concentrations of NH4+–N and TN in the reactor effluent continued to decline through the end of the study (Supplementary Fig. S3).
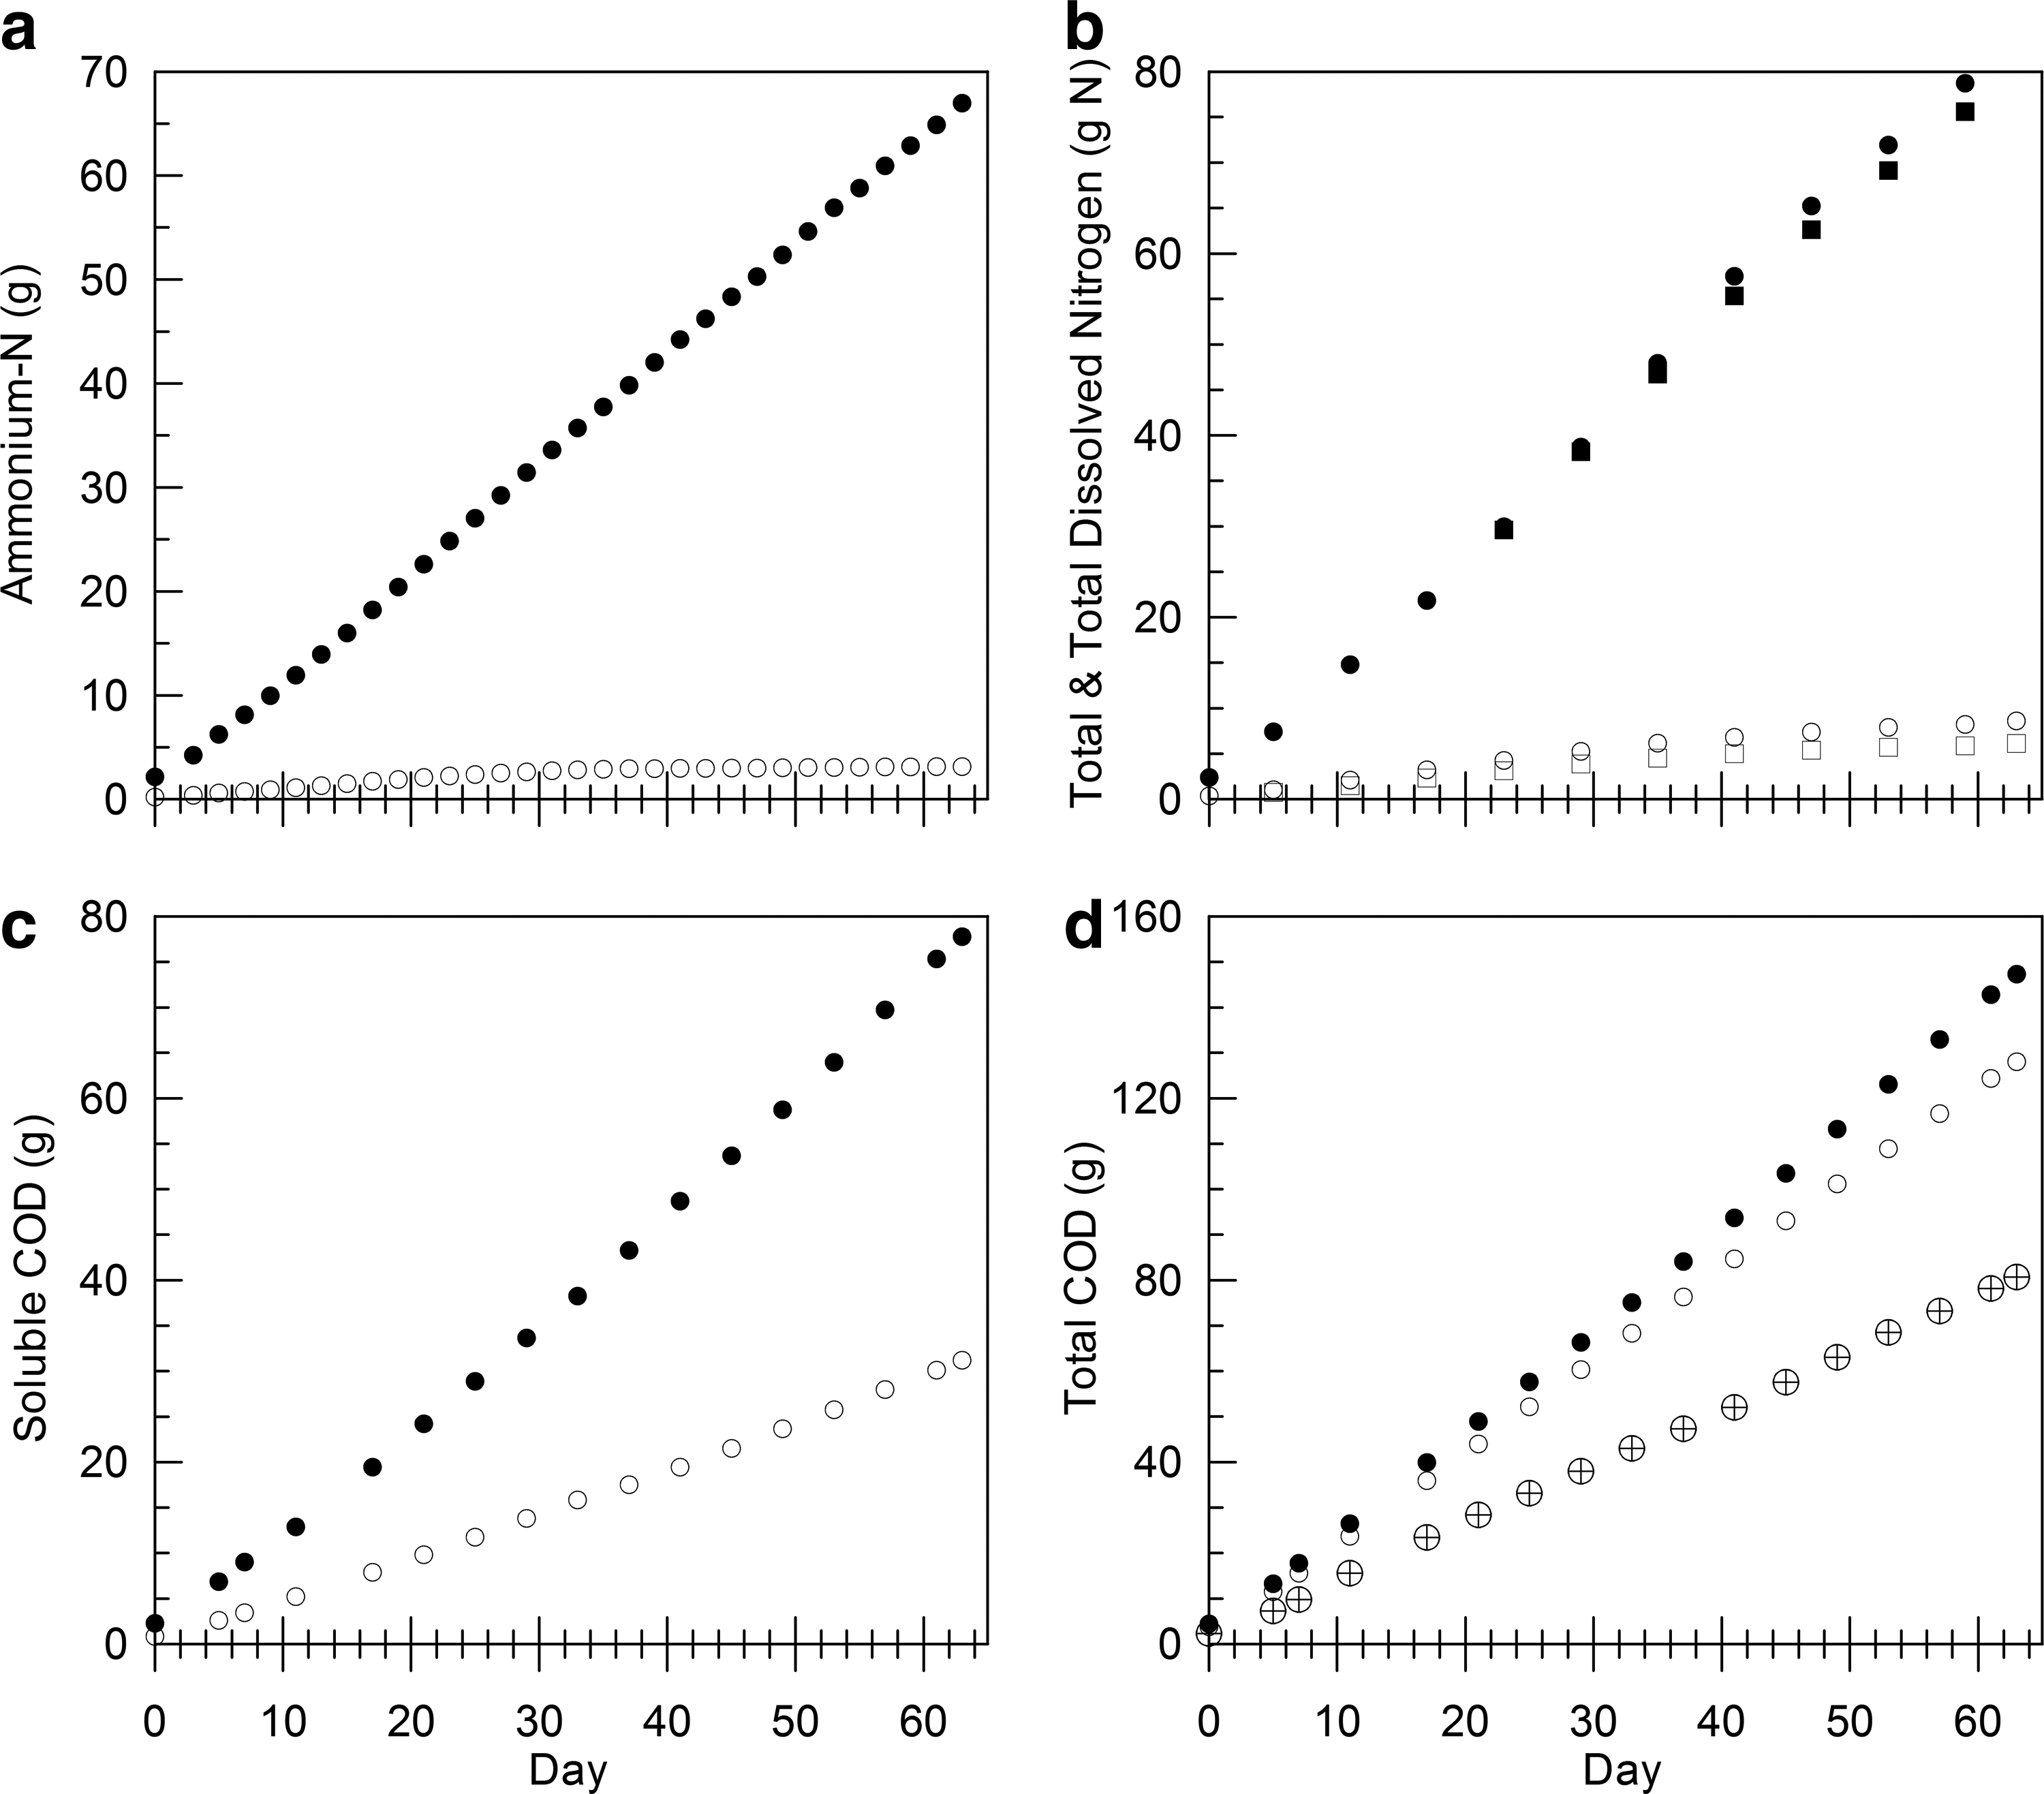
Cumulative mass loading and discharge rates for the anammox SBR for
Slope of linear best fit divided by reactor volume (g/[m3·day])±95% confidence interval; r2 is given in parentheses. Literature loading and removal rates in comparable systems are shown in Supplementary Table S4.
95% confidence interval determined by propagation of uncertainty (Caldwell and Vahidsafa, 2014).
tCOD discharge rate and percent removal are based on estimated effluent mass.
Oxygen loading based on measured volume of O2 per pulse and known number of pulses per day. Oxygen discharge based on measured composition and off-gas flow rate. Oxygen% removal indicates transfer efficiency. Error is based on off-gas measurement error (Table 3).
Reactor off-gas
The sum of the measured gases (CO2, N2, O2, and N2O) accounted for an average of 94% of the total off-gas (Table 3). Of these gases, the most important for stoichiometric analysis are N2O, N2, and O2. On a mass basis, nitrogenous gases accounted for 75.0%±7.7% of removed TN, with 11.4%±1.0% of the removed TN converted to N2O. Stripping of ammonia to the gas phase was negligible, accounting for <0.01% of the removed NH4+-N (data not shown).
Data represent mean±standard deviation (number of samples accepted; number of samples rejected as outliers). Units are mol%.
Includes only the samples for which all four gases were quantified.
Intracycle analysis
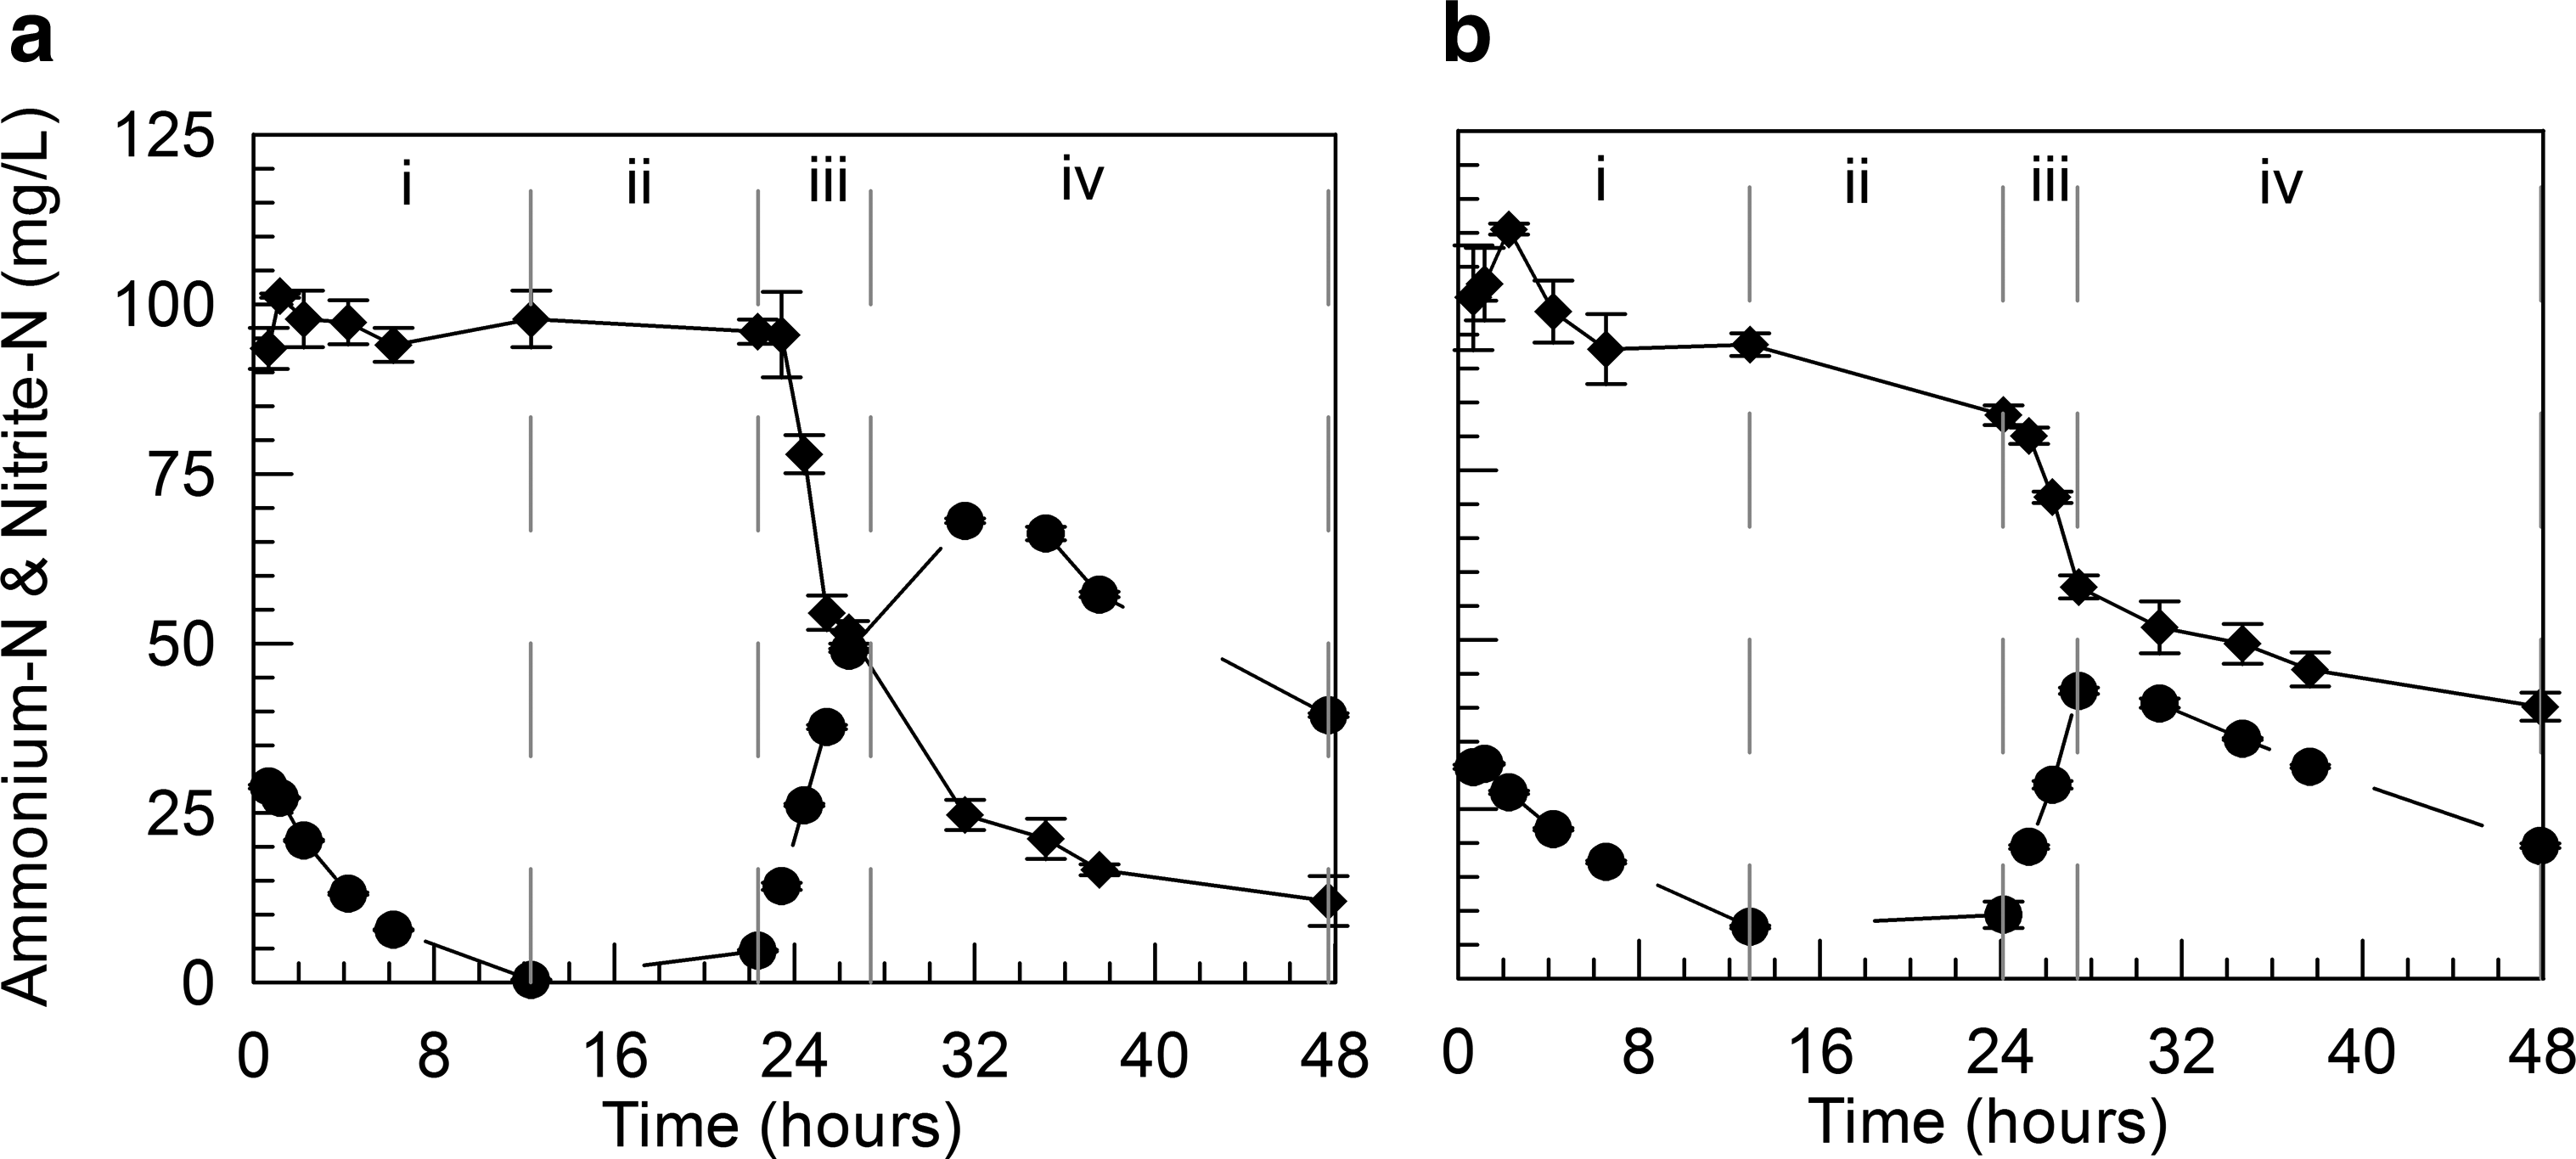
Intracycle sampling was used to estimate rates of change of individual constituents during the course of a cycle (Fig. 3). Neither the rate of tCOD removal nor the rate of sCOD removal was significantly different than zero (p>0.05; Table 4), but nitrogen was removed throughout the cycle. Solubilization of particulate N occurred within the first hour of the cycle, with most solubilization occurring before the first sampling event. Between the first two sampling events, all particulate N consumed in the reactor accumulated as dissolved organic N (p>0.05) and both species remained constant for the duration of the cycle.

Concentration profiles of
Data represent slope of best-fit line±95% confidence interval (n=10).
Cumulative mass discharge from the final 25 days of operation as reported in Supplementary Table S2.
No significant difference from 0.
Comparing rates determined from intracycle sampling with the rates based on cumulative mass over the reported period of reactor operation (Table 4), the removal rates for TDN and TN were greater based on cumulative mass analysis than on intracycle sampling. The rates of removal for NH4+-N and TIN were similar in both methods.
Maximum rates
Maximum rates of relevant biological processes were determined in duplicate in-reactor experiments (Fig. 4). The conditions imposed over the course of each experiment are summarized in Table 5; note that the condition during period (ii) in each experiment was comparable with normal reactor operation. During the anammox only period (period iv), TIN was removed at a rate of 69 and 51 mg/[L·day] for replicates A and B, respectively, in good agreement with the rates of N removal calculated from cumulative masses (Table 4). The stoichiometry of the anammox reaction estimated from these rates was 2.2 and 1.8 NO2−–N/NH4+-N, respectively.
Duplicate
Frequency of gas addition: I, intermittent; C, continuous.
Biological reactions promoted: D, denitrification; N, nitritation; An, anammox.
Beginning and ending pH values for replicate A and replicate B.
Increase in pH was likely due to purging the headspace of CO2 with the reactor top open.
After accounting for the contribution of anammox to nitrite consumption in period (i), denitrification consumed NO2−–N at a rate of 16 mg/[L·day] in both experiments. In comparison with maximum rates of TN removal shown in Table 4, denitrification could account for no more than 30% of the observed TN removal during normal reactor operation. The remaining TN removal therefore was due to anammox activity.
Discussion
Previous studies investigating anammox treatment of swine waste have explored both one-reactor (Figueroa et al., 2012; Zhang et al., 2012; Daverey et al., 2013) and two-reactor (Ahn et al., 2004; Hwang et al., 2005, 2006; Karakashev et al., 2008; Yamamoto et al., 2008; Molinuevo et al., 2009; Magrí et al., 2012) systems. Only studies in which the aerobic and anaerobic reactions were carried out in one vessel are applicable to this work. Previous one-reactor studies used swine waste with much lower ammonium content (225–420 mg NH4+-N/L), COD (380–420 mg/L), and COD/N ratio (0.6–1.0) than the waste used in this study. Additionally, two of the previous studies (Figueroa et al., 2012; Daverey et al., 2013) used extended feed periods (feeding occurred during 50–96% of the total cycle time), which avoided a high instantaneous concentration of ammonium and COD at the beginning of the reactor cycle. The only study that used a short feed period added ammonium chloride or sodium acetate to the influent waste to maintain a controlled COD/N ratio (Zhang et al., 2012). All these studies were done at a smaller scale than the work presented here (1.5–6.5 L). None of the previous studies maintained the very low DO conditions used in this study and none looked at N2O emissions associated with nitritation/anammox treatment of anaerobically digested swine waste. Therefore, no previous study is exactly analogous to the present work.
Typical anammox stoichiometry has been reported to be 1.3 NO2−–N/NH4+-N, although earlier studies on anaerobically digested swine waste reported 1.7–2.1 NO2−–N/NH4+-N (Ahn et al., 2004; Hwang et al., 2005; Yamamoto et al., 2008). These systems were operated in such a way that the contribution of heterotrophic denitrification from nitrite should have been minimal, so the reason for the deviation from typical anammox stoichiometry is unknown.
COD removal
Installing an anaerobic digester upstream of a nitritation/anammox system allows for maximizing the amount of COD to be used for biogas production from swine waste and minimizing the COD load to the N removal system (Staunton et al., in press). Minimizing the COD load should help autotrophic N removal by minimizing the potential contribution of heterotrophic denitrification to net N removal; in turn, maximizing autotrophic N removal reduces the overall oxygen requirements. Earlier work on nitrification/denitrification of the same digested swine waste (Staunton et al., submitted) indicated seasonal variability of the COD/N ratio; sufficient COD for complete denitrification was available only in winter months when gas production in the covered lagoon at the farm decreased. Because reactor performance in the present study was evaluated with a single batch of waste, COD variability was not an issue. To fully assess potential seasonal variability of COD content of the digested waste and its impact on a nitritation/anammox system, an on-site pilot study would need to be performed.
There was significant removal of COD across the reactor (Tables 2 and 3), with three potential mechanisms that could be responsible for the observed removal: aerobic oxidation, denitrification with nitrate, or denitrification with nitrite. The half-saturation coefficient for oxygen has been reported to be lower for aerobic heterotrophs than for AOB (Béline et al., 2007), suggesting that the heterotrophs would be more competitive for the limited O2 supply under microaerobic (low DO) conditions. It is likely therefore that aerobic activity was a significant COD removal mechanism in the SBR under the final operating conditions. Using data shown in Fig. 2 and Table 4, the maximum aerobic COD removal rate would have been 0.03 g COD g/[VSS·d]; this rate is well below the typical value for activated sludge treatment of municipal wastewater (Metcalf and Eddy, 2003), indicating that most of the VSS was not associated with COD removal. As noted below, denitrification also contributed to COD removal in the SBR.
The intracycle analysis (Fig. 3) showed no significant change in the concentration of COD throughout a cycle, which indicates that any COD consumption primarily occurred before the first sampling event. Nitrogen removal was observed throughout the cycle, indicating that autotrophic N removal, rather than heterotrophic denitrification, was the primary N removal mechanism. Furthermore, support for a primarily autotrophic mechanism of N removal is provided by the estimated rate of denitrification with nitrite during the maximum rate experiments.
Nitrogen removal
Microaerobic conditions that existed in the reactor likely promoted the partial oxidation of ammonium to nitrite rather than complete nitrification to nitrate (Lackner et al., 2014); due to the difference in the oxygen half-saturation coefficient between AOB and NOB (Pérez et al., 2014), low DO conditions generally favor nitritation and preclude competition for nitrite by NOB relative to anammox bacteria (Wett et al., 2010). Aerobic oxidation of nitrite was not observed even under fully aerobic conditions (Fig. 4), and NOB were not detected in the reactor (Staunton, 2014), suggesting that nitrate in the reactor effluent was produced as a side product of anammox (Strous et al., 1998). Alternatively, the high concentration of free ammonia could have adversely impacted the activity of NOB in the system (Anthonisen et al., 1976).
Effluent nitrate was far below the amount predicted by anammox stoichiometry (Strous et al., 1998), which suggests nitrate consumption by denitrifiers. Recently, nitrate formation due to anammox was found to be inversely proportional to the solids retention time (Lee et al., 2013), and the retention time in the present study was quite long. However, even systems with indefinite retention of anammox biomass exhibited significant nitrate accumulation, whether the bacteria were grown in suspended culture (Wett et al., 2010) or as a biofilm (Veuillet et al., 2014).
Intracycle concentration of nitrite (Fig. 3a) suggested that the reactor cycle consisted of two phases: an AOB-limited phase (decreasing concentration of nitrite) and an anammox-limited phase (increasing concentration of nitrite). This apparent biphasic behavior of nitrite throughout a cycle places constraints upon the effluent concentration of nitrite. To maintain maximum N removal, the concentration of nitrite must remain above the half-saturation coefficient throughout most of the cycle; for the biomass in this study, the estimated half-saturation coefficient for NO2− was 2.7 mg N/L (Supplementary Fig. S4). The AOB-limited phase was likely the result of the oxygen-limited nature of the system and the oxygen demand exerted by non-nitrogenous species.
Net nitrogenous oxygen consumption over the reported period of reactor operation (Supplementary Data) was between 1.47 g O2 (g TN)−1 (assuming aerobic oxidation of COD) and 2.33 g O2 (g TN)−1 (assuming removal of COD by denitrification), resulting in an anammox stoichiometry between 0.75±0.06 and 2.1±0.3 NO2−–N/NH4+-N. However, anammox stoichiometry less than 1.0 NO2−–N/NH4+-N is not possible. Assuming typical anammox stoichiometry of 1.3–1.7 NO2−–N/NH4+-N, the net nitrogenous oxygen demand would be 1.94–2.15 g O2 (g N)−1, which supports a conclusion that COD removal probably occurred by a combination of aerobic oxidation and denitrification.
Aerobic oxidation of ammonium requires 7.1 g alkalinity as CaCO3 per g ammonium-N oxidized. Assuming a stoichiometry of 1.3–1.7 g NO2−–N/g NH4+-N for anammox and assuming that all organic N removed would have been ammonified first, the alkalinity required for net TN removal would have been ∼9,500–11,700 mg/L as CaCO3. The alkalinity in the digested swine waste would barely have met this minimal demand (Table 1), but denitrification would have contributed additional alkalinity. Regardless, the net alkalinity consumption was sufficient to maintain neutral pH in the reactor without any requirement for added alkalinity. Alkalinity addition can represent an expensive operating cost for full-scale nitrification/denitrification (Bunk, 2012); eliminating the need for external alkalinity represents significant operational savings.
Ammonium removal was excellent overall and reached 99% by the end of reactor operation (Supplementary Table S3). Other studies on nitritation/anammox treatment of anaerobically digested swine waste reported 50–96% ammonium removal and 50–80% TN removal (Figueroa et al., 2012; Zhang et al., 2012; Daverey et al., 2013). Single-reactor nitritation/anammox systems treating municipal digester centrate report 70–90% TN removal (Jardin and Hennerkes, 2012; Ramalingam et al., 2012; Liu et al., 2013; Nelson and Nifong, 2013; Zekker et al., 2013). Limitations in the N removal capacity of an anammox system are generally associated with the production of nitrate due to anammox (Wett et al., 2010), and some authors (Rosenthal et al., 2009) have stated that anammox can remove a maximum of 88–89% influent TN due to the produced nitrate. This study achieved a maximum TN removal of 93%, likely due to the relatively high COD content that promoted denitrification of the majority of nitrate produced by anammox.
Nitrous oxide production
Nitrous oxide yield is of increasing interest in biological nitrogen removal systems due to its significant global warming potential (Intergovernmental Panel on Climate Change, 2007). The observed yield of 11% N2O per unit TN removed is higher than typically observed (0.6–6%) in either one- or two-reactor anammox systems (Hu et al., 2013). One study has reported an N2O yield of 10.9% during prolonged aeration of a nitritation/anammox system (Domingo-Félez et al., 2014). Nitrous oxide is not a known side product, nor an intermediate of anammox activity (Kartal et al., 2011), and highly enriched anammox cells have been shown to produce very little N2O (Lotti et al., 2014). The stoichiometry of COD/N was insufficient for denitrification to be a dominant mechanism for the production of N2O in the present study. Therefore, AOB are the most likely source of N2O; this is consistent with what was found in the nitrification/denitrification system used to treat this waste in a previous study (Staunton et al., in press).
Low dissolved oxygen and increased nitrite concentration have both been positively associated with N2O production (Kampschreur et al., 2009). These are the same conditions that existed in the reactor in this study, so the high yield of N2O is not surprising. Overall, however, the inherent impact of nitrogen removal from anaerobically digested swine waste on N2O production is not well characterized.
Summary
Partial nitritation and anammox were successfully applied to swine waste from a full-scale anaerobic digester. The main finding of this study was that an SBR can be operated under oxygen-limiting conditions to control the extent of AOB activity while suppressing NOB activity. Aerobic activity was the primary mechanism of COD removal, although denitrification contributed to overall N removal. Most of the COD was removed at the beginning of the SBR cycle.
Over 99% of influent ammonium and over 90% of influent TN can be removed in a one-reactor nitritation/anammox system, with the majority of N removal occurring through autotrophic mechanisms. N2O emission accounted for 11% of the removed N and was likely a result of AOB activity.
Footnotes
Acknowledgments
The authors thank Alex Rosenthal of the City College of New York and Andrea Nifong, formerly with the Hampton Roads Sanitation District, for providing anammox seed cultures. Dr. Glenn Walters of the UNC-Chapel Hill Design Center was responsible for design and fabrication of most of the reactor system and the authors are grateful for his insights on reactor troubleshooting. The authors thank Professor Steve Whalen for his assistance with nitrogen and gas analyses and also thank Professor Marc Deshusses (Duke University) for valuable discussions on reactor performance. Finally, the authors thank Tom Butler and other personnel at Butler Farms for providing access to the site and their logistical assistance throughout the project.
Author Disclosure Statement
All authors confirm that no competing financial interests exist.
References
Supplementary Material
Please find the following supplemental material available below.
For Open Access articles published under a Creative Commons License, all supplemental material carries the same license as the article it is associated with.
For non-Open Access articles published, all supplemental material carries a non-exclusive license, and permission requests for re-use of supplemental material or any part of supplemental material shall be sent directly to the copyright owner as specified in the copyright notice associated with the article.