
Abstract
Abstract
Primary sludge (PS) is a renewable and sustainable energy source, but pretreatment often is required to accelerate hydrolysis of organic solids. Pulsed electric field (PEF) treatment has been proven effective for waste activated sludge (WAS), but its impact on PS is not known. We evaluated the impacts of PEF pretreatment of PS on energy recovery by methanogenesis and fermentation to volatile fatty acids (VFAs). PEF treatment achieved successful microbial inactivation of PS and it modestly enhanced conversion of PS chemical oxygen demand to methane (by ∼8%) and to VFAs by fermentation (by ∼7%) by increasing hydrolysis rates. Thus, the impact of PEF treatment was small for PS alone, compared to the much more significant increases in methane conversion from WAS or WAS+PS. This difference points to the value of optimizing ratios of PS:WAS for PEF treatment, whether the goal is methanogenesis or fermentation to VFAs.
Introduction
T
Waste activated sludge (WAS) and primary sludge (PS) together represent 80% of the organic carbon from the influent wastewater (Shizas and Bagley, 2004). Hence, they present an excellent opportunity to capture the sludges' renewable energy either (1) directly as renewable methane through methanogenesis or electric current in microbial electrochemical cells (MXCs) or (2) as fermented soluble volatile fatty acids (VFAs), which can be utilized as an internal substrate for denitrification and phosphorus removal. Slow solids hydrolysis is a key factor limiting energy capture (Rittmann et al., 2008; Wang et al., 2009; Velasquez-Orta et al., 2011), and sludge pretreatment that makes hydrolysis of the sludges' organic solids more rapid will increase the capture of resources, while minimizing the solids for disposal (Lalaurette et al., 2009).
Various pretreatment techniques have been used to increase hydrolysis rates: for example, heat treatment, ultrasonication, acid or alkaline chemicals treatment, microwave, and a combination of those techniques (Haug et al., 1978; Kim et al., 2003; Park et al., 2004; Eskicioglu et al., 2006; Pilli et al., 2011; Cho et al., 2012). These pretreatment techniques have not yet been adopted successfully at full scale due to high capital cost, energy use, and chemical consumption. A new alternative is Focused Pulsed® (FP) treatment, which has been studied for improvement of anaerobic digestion in wastewater treatment plants (Rittmann et al., 2008; Salerno et al., 2009; Zhang et al., 2009; Lee et al., 2010; Lee and Rittmann, 2011). FP works on the principle of pulsed electric fields (PEFs) and it has been specifically adapted for sludge pretreatment. PEF has been shown to increase methane gas production from anaerobic digestion of WAS and subsequent reduction of biosolids (Rittmann et al., 2008; Salerno et al., 2009). It also has proven advantageous as an electron donor for denitrification at wastewater treatment plants (Lee et al., 2010).
The initial target for PEF pretreatment was WAS (Salerno et al., 2009). While WAS consists mostly of stabilized cell biomass, PS contains relatively more bioavailable crude lipids, proteins, and carbohydrates. PS represents a sizeable fraction of total solids that are generated in a wastewater treatment plant (up to 60% by volume) and sent to the anaerobic digester (Metcalf & Eddy, Inc., 2003). In addition, PS characteristics vary depending on the seasons and location. PEF treatment of PS alone has not been investigated to date, although thickened mixed sludge (TMS) (1:1 mixture of PS and WAS) has shown modest improvements with PEF treatment (Rittmann et al., 2008) in a full-scale anaerobic digester.
In this study, we first assess the effect of PEF treatment of PS on sludge characteristics and microbial inactivation. Next, we evaluate the effects of PEF treatment on methanogenesis through biochemical methane potential (BMP) assays. We also perform batch fermentation experiments with and without PEF treatment, using methanogen-inhibited conditions, to evaluate the production of organic acids as an electron donor and carbon source for a range of wastewater applications, such as denitrification, enhanced biological phosphorous removal, and MXCs.
Materials and Methods
PEF treatment of PS
PS was collected from the primary clarifier underflow at the Mesa Northwest Wastewater Reclamation Plant (MNWWRP) in Mesa, AZ. We treated 30 L of the PS in the FP alpha unit (OpenCEL/Trojan Technologies, London, ON, Canada) located at the Swette Center for Environmental Biotechnology (SCEB) (Tempe, AZ). System and key process variables are described in previous studies (Salerno et al., 2009; Lee et al., 2010), and more details about FP can be obtained at www.opencel.com. We maintained a sample conductivity of 0.175 mS/cm during FP treatment. With a field strength of 30 kV, the treatment intensity (TI) was 33 kWh/m3 (Salerno et al., 2009).
BMP and fermentation
BMP tests were performed based on previous studies (Owen et al., 1979; Angelidaki et al., 2009). BMP reactors were set up with a 200-mL working volume in 250-mL serum bottles. Anaerobic digested sludge (ADS) from a well operating anaerobic digester in MNWWRP served as the inoculum after degassing in a 37°C shaker for 4 days. Triplicate control and PEF-treated PS samples were mixed with ADS in the volumetric ratio of 3:7 (ADS:sample), and buffer and nutrient supplements were added, as described in Angelidaki et al. (2009). Butyl rubber septa and aluminum caps were used for sealing the serum bottles after N2 gas sparging for 10 min to establish anaerobic conditions. The bottles were incubated at 30°C on a shaker table (150 rpm). Negative controls contained the ADS and basal medium alone. Methane gas produced from the ADS inoculum was subtracted from the production from control and PEF-treated PS. The chemical oxygen demand (COD) of the produced CH4 was calculated from the following:
We performed three serial enrichments for PS fermentation with an ADS inoculum that was selectively inhibited for methanogenesis using 50 mM of 2-bromoethanesulfonic acid (BES) (Parameswaran et al., 2011). The first enrichment consisted of a 1:1 volume ratio of PS:ADS and was operated for 15 days, after which 10% of the reactor contents by volume were transferred to a subsequent serum bottle with PS for two more serial enrichments with batch operation times of 15–20 days. At the end of three serial enrichments for control or PEF-treated PS, we performed batch fermentation experiments with the enriched inoculum (10% v/v) for a period of 28 days and with 50 mM BES. The serial enrichment of fermentative bacteria was performed to evaluate the impact of PEF treatment on the kinetics of VFA production from PS.
Determining the hydrolysis rate based on methane production
When hydrolysis is the rate-limiting step, the rate of CH4 production in batch BMP tests can be used to estimate hydrolysis kinetics (Pavlostathis and Giraldo-Gomez, 1991; Bolzonella et al., 2005). First-order hydrolysis kinetics in terms of CH4 production in a batch reaction is given by the following:
where M=cumulative methane production from the BMP assay at time t (mL)
Mmax=ultimate methane yield from the BMP assay at the end of the incubation time (mL)
khyd=first-order hydrolysis rate constant (day−1).
Equation (1) provides an accurate representation of the BMP results when (1) hydrolysis is the rate-limiting step, (2) the maximum methane production at the end of the batch tests (Mmax) represents the total concentration of hydrolyzable COD at the beginning of the tests, and (3) hydrolysis kinetics can be represented as first order in the concentration of hydrolysable COD.
Rearranging Equation (1) yields the following:
which is a straight line with a slope whose magnitude is the hydrolysis rate constant (khyd). We obtained khyd by performing linear regression of ln[1−{M/Mmax}] versus t.
Analytical methods
The amount of gas was measured with a frictionless glass syringe (PERFEKTUM; Popper and Sons, New Hyde Park, NY) inserted into the septum until its pressure was equal to atmospheric. Gas composition was by sampling the gas phase using a 500-μL gas-tight syringe and performing gas chromatography and thermal conductivity detection (GC-TCD; GC 2010; Shimadzu, Kyoto, Japan) after separation on a packed column (Shincarbon ST 100/120, 2m; Restek, Bellefonte, PA). N2 was the carrier gas with a constant pressure and flow rate of 5.4 atm and 10 mL/min, respectively. We employed temperatures of 120, 145, and 150°C for injection port, column, and detector, respectively, and the current was 45 mA. Methane (CH4), hydrogen (H2), and carbon dioxide (CO2) were detected by GC-TCD. Calibration was performed using an analytical grade gas standard (CH4:CO2:H2=40%:30%:30%; Matheson Tri-Gas, Twinsburg, OH).
PS characteristics were assayed with total COD (TCOD), semisoluble COD (SSCOD), total suspended solids, volatile suspended solids (VSS), NH3-N, VFAs, and soluble proteins. Semisoluble means that COD analysis was performed on the permeate after filtration through a 1.2-μm glass fiber filter (Whatman™, Maidstone, United Kingdom), as described in Lee et al. (2010). COD and NH3-N were measured using HACH Kits and a spectrophotometer (DR2700; HACH, Loveland, CO). Soluble proteins were analyzed with the bicinchoninic acid method (Brown et al., 1989), using a BCA Protein Assay Kit (Sigma-Aldrich, St. Louis, MO). Bovine serum albumin was used for the standard calibration curves of protein measurement. We used the following two methods to measure VFAs: HACH VFA Kit and high-performance liquid chromatography (HPLC). For initial VFA characterization, we used HACH kit. For analysis of other VFAs from the fermentation bottles, an HPLC was used for separation of the acids, as described in Parameswaran et al. (2009).
The statistical differences of PS-TCOD conversion to CH4 and VFAs between control and PEF treatment were evaluated using the Mann–Whitney U test by SPSS 22 (IBM, Armonk, NY) for BMP and fermentation.
Results and Discussions
PS characteristics after PEF treatment
Table 1 shows the comparison of PS before and after FP treatment. TCOD and suspended solids have similar concentrations in both cases, which means that FP did not cause net oxidation of volatile solids. However, soluble components such as SSCOD, VFAs, and proteins increased in PEF-treated PS by 78–86%, since microbial cell membranes, walls, and macromolecules were disrupted. The increases of soluble organics were modest for PS compared to WAS, which showed a 4,800% increase of SCOD with a lower TI, ∼19.8 kWh/m3 (Salerno et al., 2009). The very low fraction of SSCOD-to-TCOD in control and PEF-treated PS (<3%) indicates that hydrolysis of the organic solids in PS was the main source of the methane and VFA production. PEF treatment also increased the sample temperature from 29°C to 49°C, although Sheng et al. (2011) showed that similar temperature increases were not responsible for changes of sludge characteristics.
Protein as BSA.
BSA, bovine serum albumin; PEF, pulsed electric field; SSCOD, semisoluble chemical oxygen demand; TCOD, total chemical oxygen demand; TSS, total suspended solids; VFA, volatile fatty acid; VSS, volatile suspended solids.
Stability of PEF-treated PS under psychrophilic conditions
A significant benefit of PEF treatment of PS could be microbial inactivation. Sheng et al. (2011) showed that PEF treatment inactivated the cyanobacterium Synechocystis PCC 6803, based on culture plating. In this study, we evaluated microbial inactivation by monitoring for changes in soluble COD, VFAs, and VSS for control and PEF-treated PS during storage at 4°C. Figure 1 shows that control PS underwent rapid degradation during storage at 4°C: SSCOD increased to about 2,000 mg/L after 50 days of storage. In contrast, PEF-treated PS maintained stable SSCOD values of around 500 mg/L for the entire 54 days. The increase in SSCOD for the control PS was accompanied by a decrease in the VSS, while PEF-treated PS had a constant VSS concentration. Degradation also could be measured as VFAs, shown in Fig. 2. Only the control PS had VFA production, predominantly propionate. Inactivation by PEF was repeatable, as shown by data for a second trial (Supplementary Fig. S1). Hydrolytic bacteria in PS could be spore or nonspore forming, given the complexity of PS. Spore-forming bacteria could resist inactivation by PEF, while other bacteria (e.g., nonspore-forming hydrolytic bacteria, fermenters) in PS could be inactivated. However, the microbial inactivation with PEF at 4°C indirectly indicates that the fraction of spore-forming hydrolytic bacteria was very limited for hydrolysis of PS, since PEF-treated VSS was stable during long-term storage (Fig. 1).
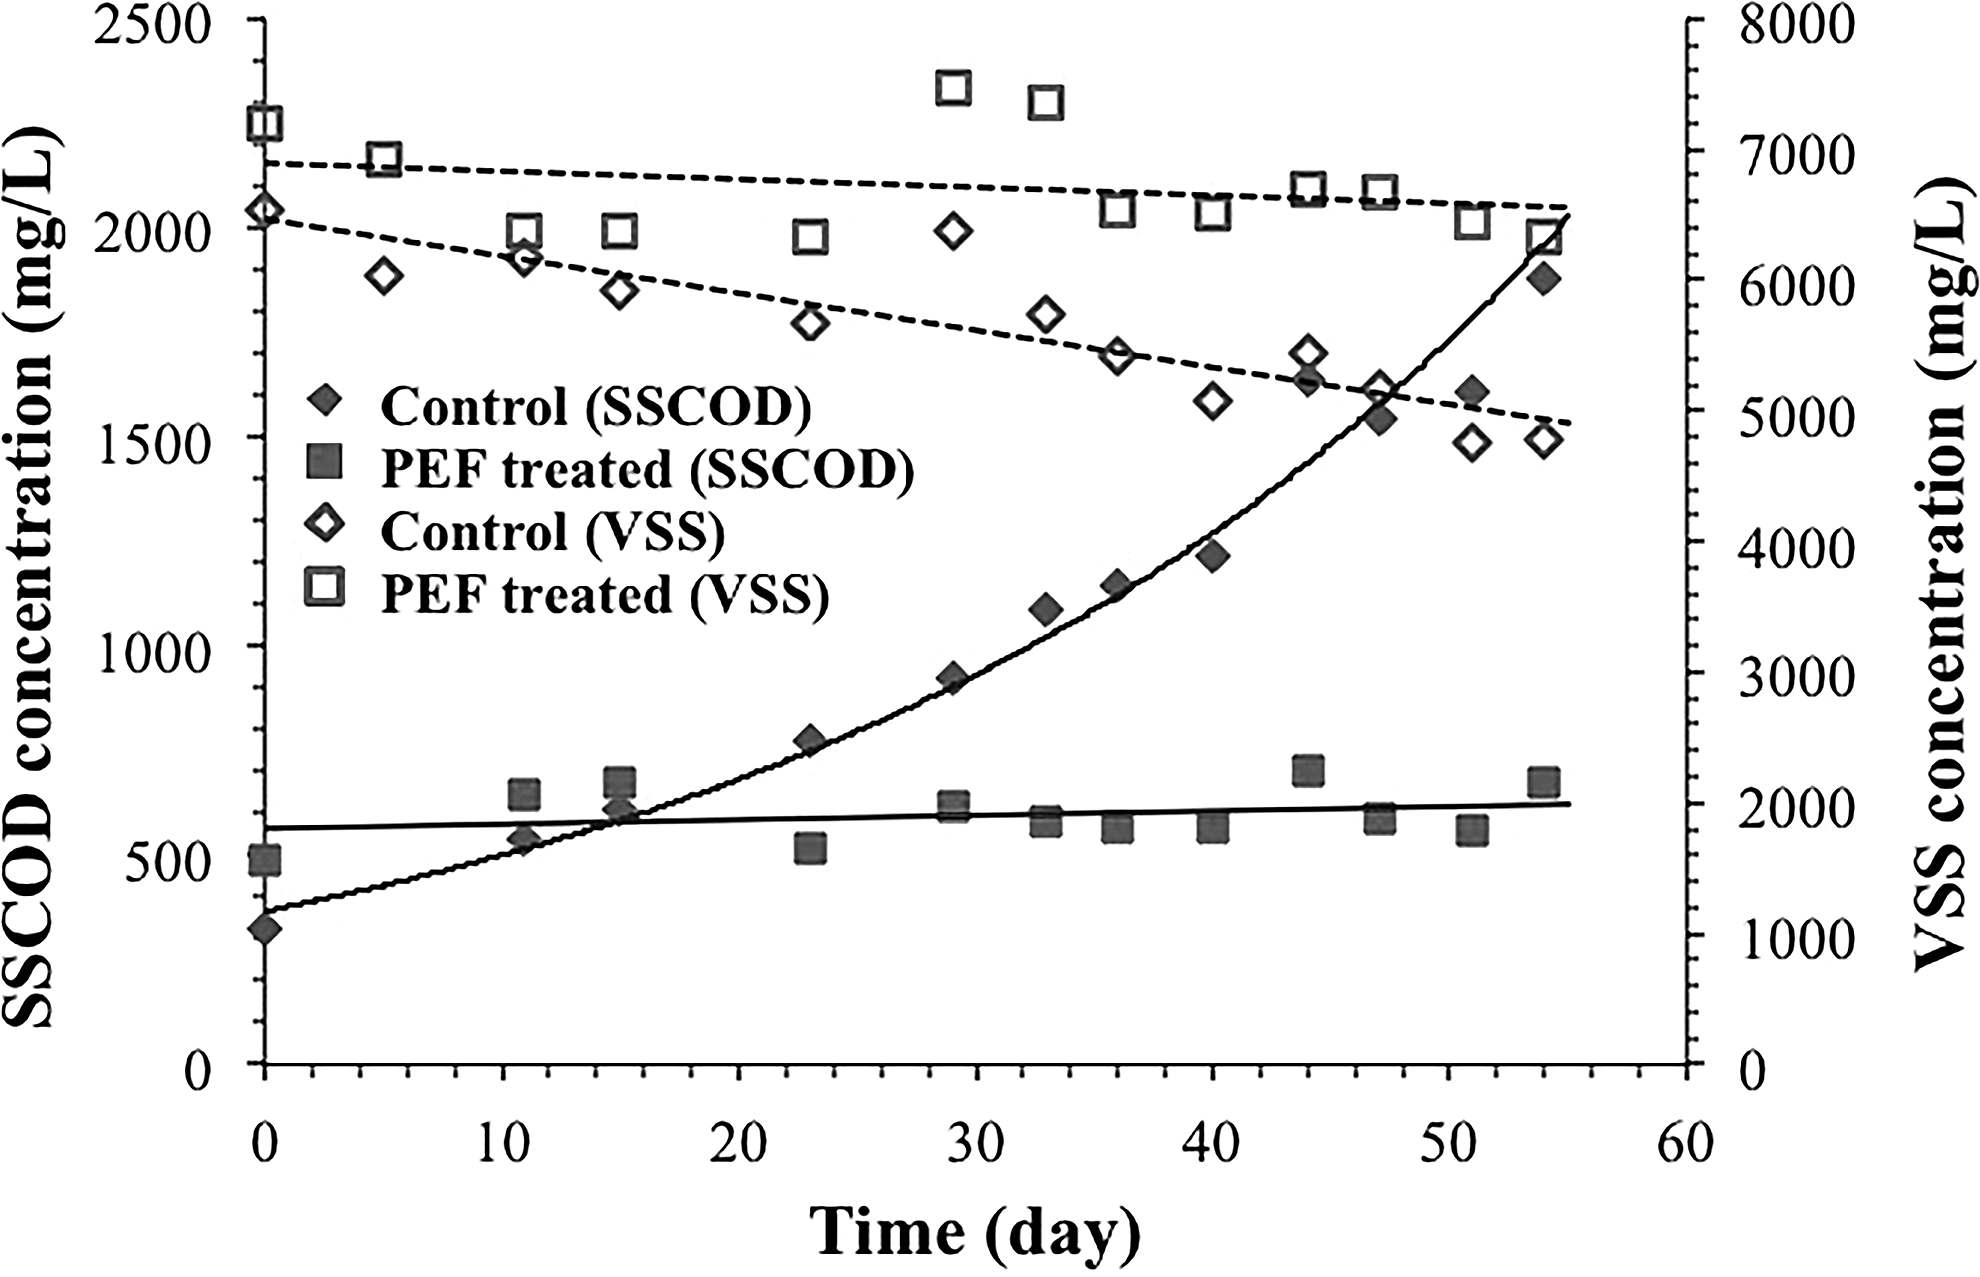
Changes of semisoluble chemical oxygen demand and volatile suspended solids concentrations of control and pulsed electric field (PEF)-treated primary sludge (PS) during storage at 4°C. Solid and dotted lines, used to highlight trends, were generated using the Trendline function in MS Excel.

Volatile fatty acid (VFA) profiles of control and PEF-treated PS during storage at 4°C. The number of days on top of each bar graph corresponds to the time since storage began.
Biochemical methane potential
As shown in Fig. 3, the initial rate of methane production in BMP assays was rapid for control and PEF-treated PS over ∼10 days, after which the rate decreased. Even though the trends for control and PEF-treated PS are similar, the CH4 production rate was higher for PEF-treated PS between 3 and 14 days when particle hydrolysis likely played a major role for controlling the rate of methanogenesis. At the end of the BMP assay, the PEF-treated PS had yielded 8% more methane and its fractional COD conversion increased from 32% to 34.5%, an 8% relative increment; the difference of CH4 conversion from PS-TCOD was significant between control and PEF (p-value <0.05).
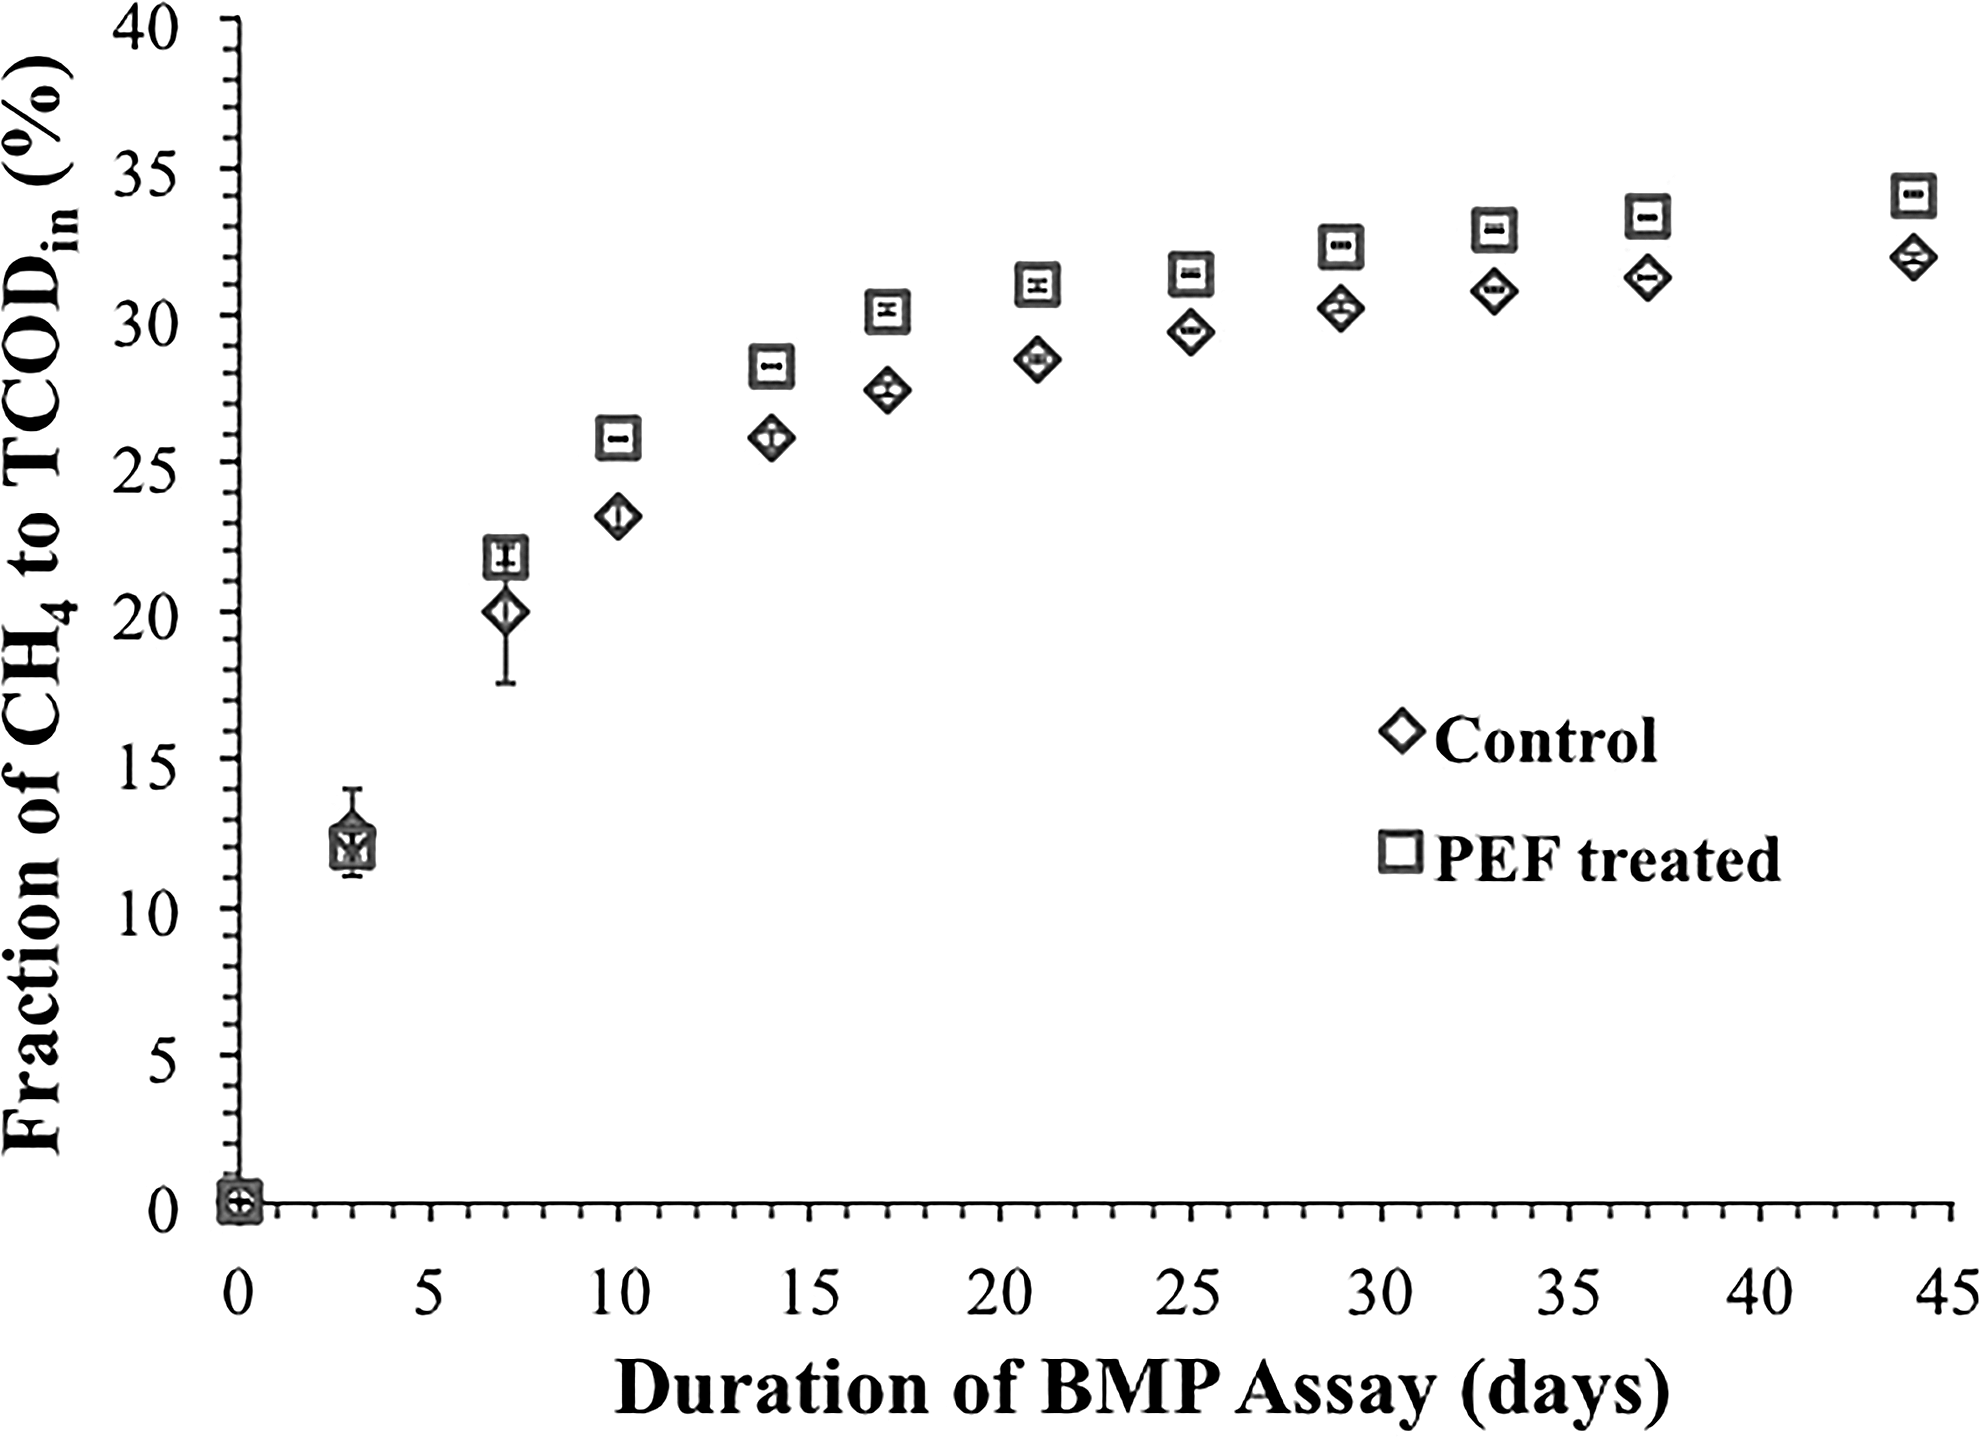
Cumulative CH4 results for control and PEF-treated PS in biochemical methane potential assays as a fraction of the total chemical oxygen demand of the starting PS.
Using the first-order model [Eqs. (1) and (2)], we computed the hydrolysis rate constants (khyd-BMP) as 0.105 (±0.005) and 0.119 (±0.012) (day−1) for control and PEF-treated PS, respectively. Other studies place the PS-hydrolysis rate constants in a similar range, between 0.09 and 0.17 (day−1) (Ferreiro and Soto, 2003; Elbeshbishy et al., 2012), with local differences arising due to differences in operational condition (e.g., temperature), particle size of the PS solids, and compositions of carbohydrate, protein, and lipid. The 13% increase in the hydrolysis rate coefficient for PEF-treated PS, compared to control PS, may explain the increment to CH4 conversion within the initial 14 days. Methane production from control PS slowly caught up with the PEF-treated PS between 14 and 44 days, resulting in the small decline in the relative increase in CH4 production to 8%. These trends indicate that PEF-treated PS may be modestly effective at only short solid retention time.
Fermentation with methanogen inhibition
Figure 4 shows the results of batch fermentations over 30 days with 50-mM BES added to inhibit methanogenesis. The first and second enrichments showed similar results for total VFAs and pH. The initial lag time with PEF-treated PS fermentation reactors might have resulted from lower microbial activity after PEF treatment, even though PEF increased the initial soluble COD. This might have caused lower rates of hydrolysis and fermentation in the initial stage. In contrast, untreated (control) PS had an undisturbed starting population of indigenous fermenters in the PS, plus those from the inoculum. Therefore, the control could have had quicker VFA production by consuming soluble organics from easily hydrolysable solids. After around 10 days, the pH declined to <5.5 and total VFAs stabilized. PEF-treated PS always had pH 0.1–0.2 units lower than control PS, one indication of higher fermentation efficiency to VFAs. After a short lag period, the PEF-treated PS showed a slightly but consistently higher concentration of total VFA.
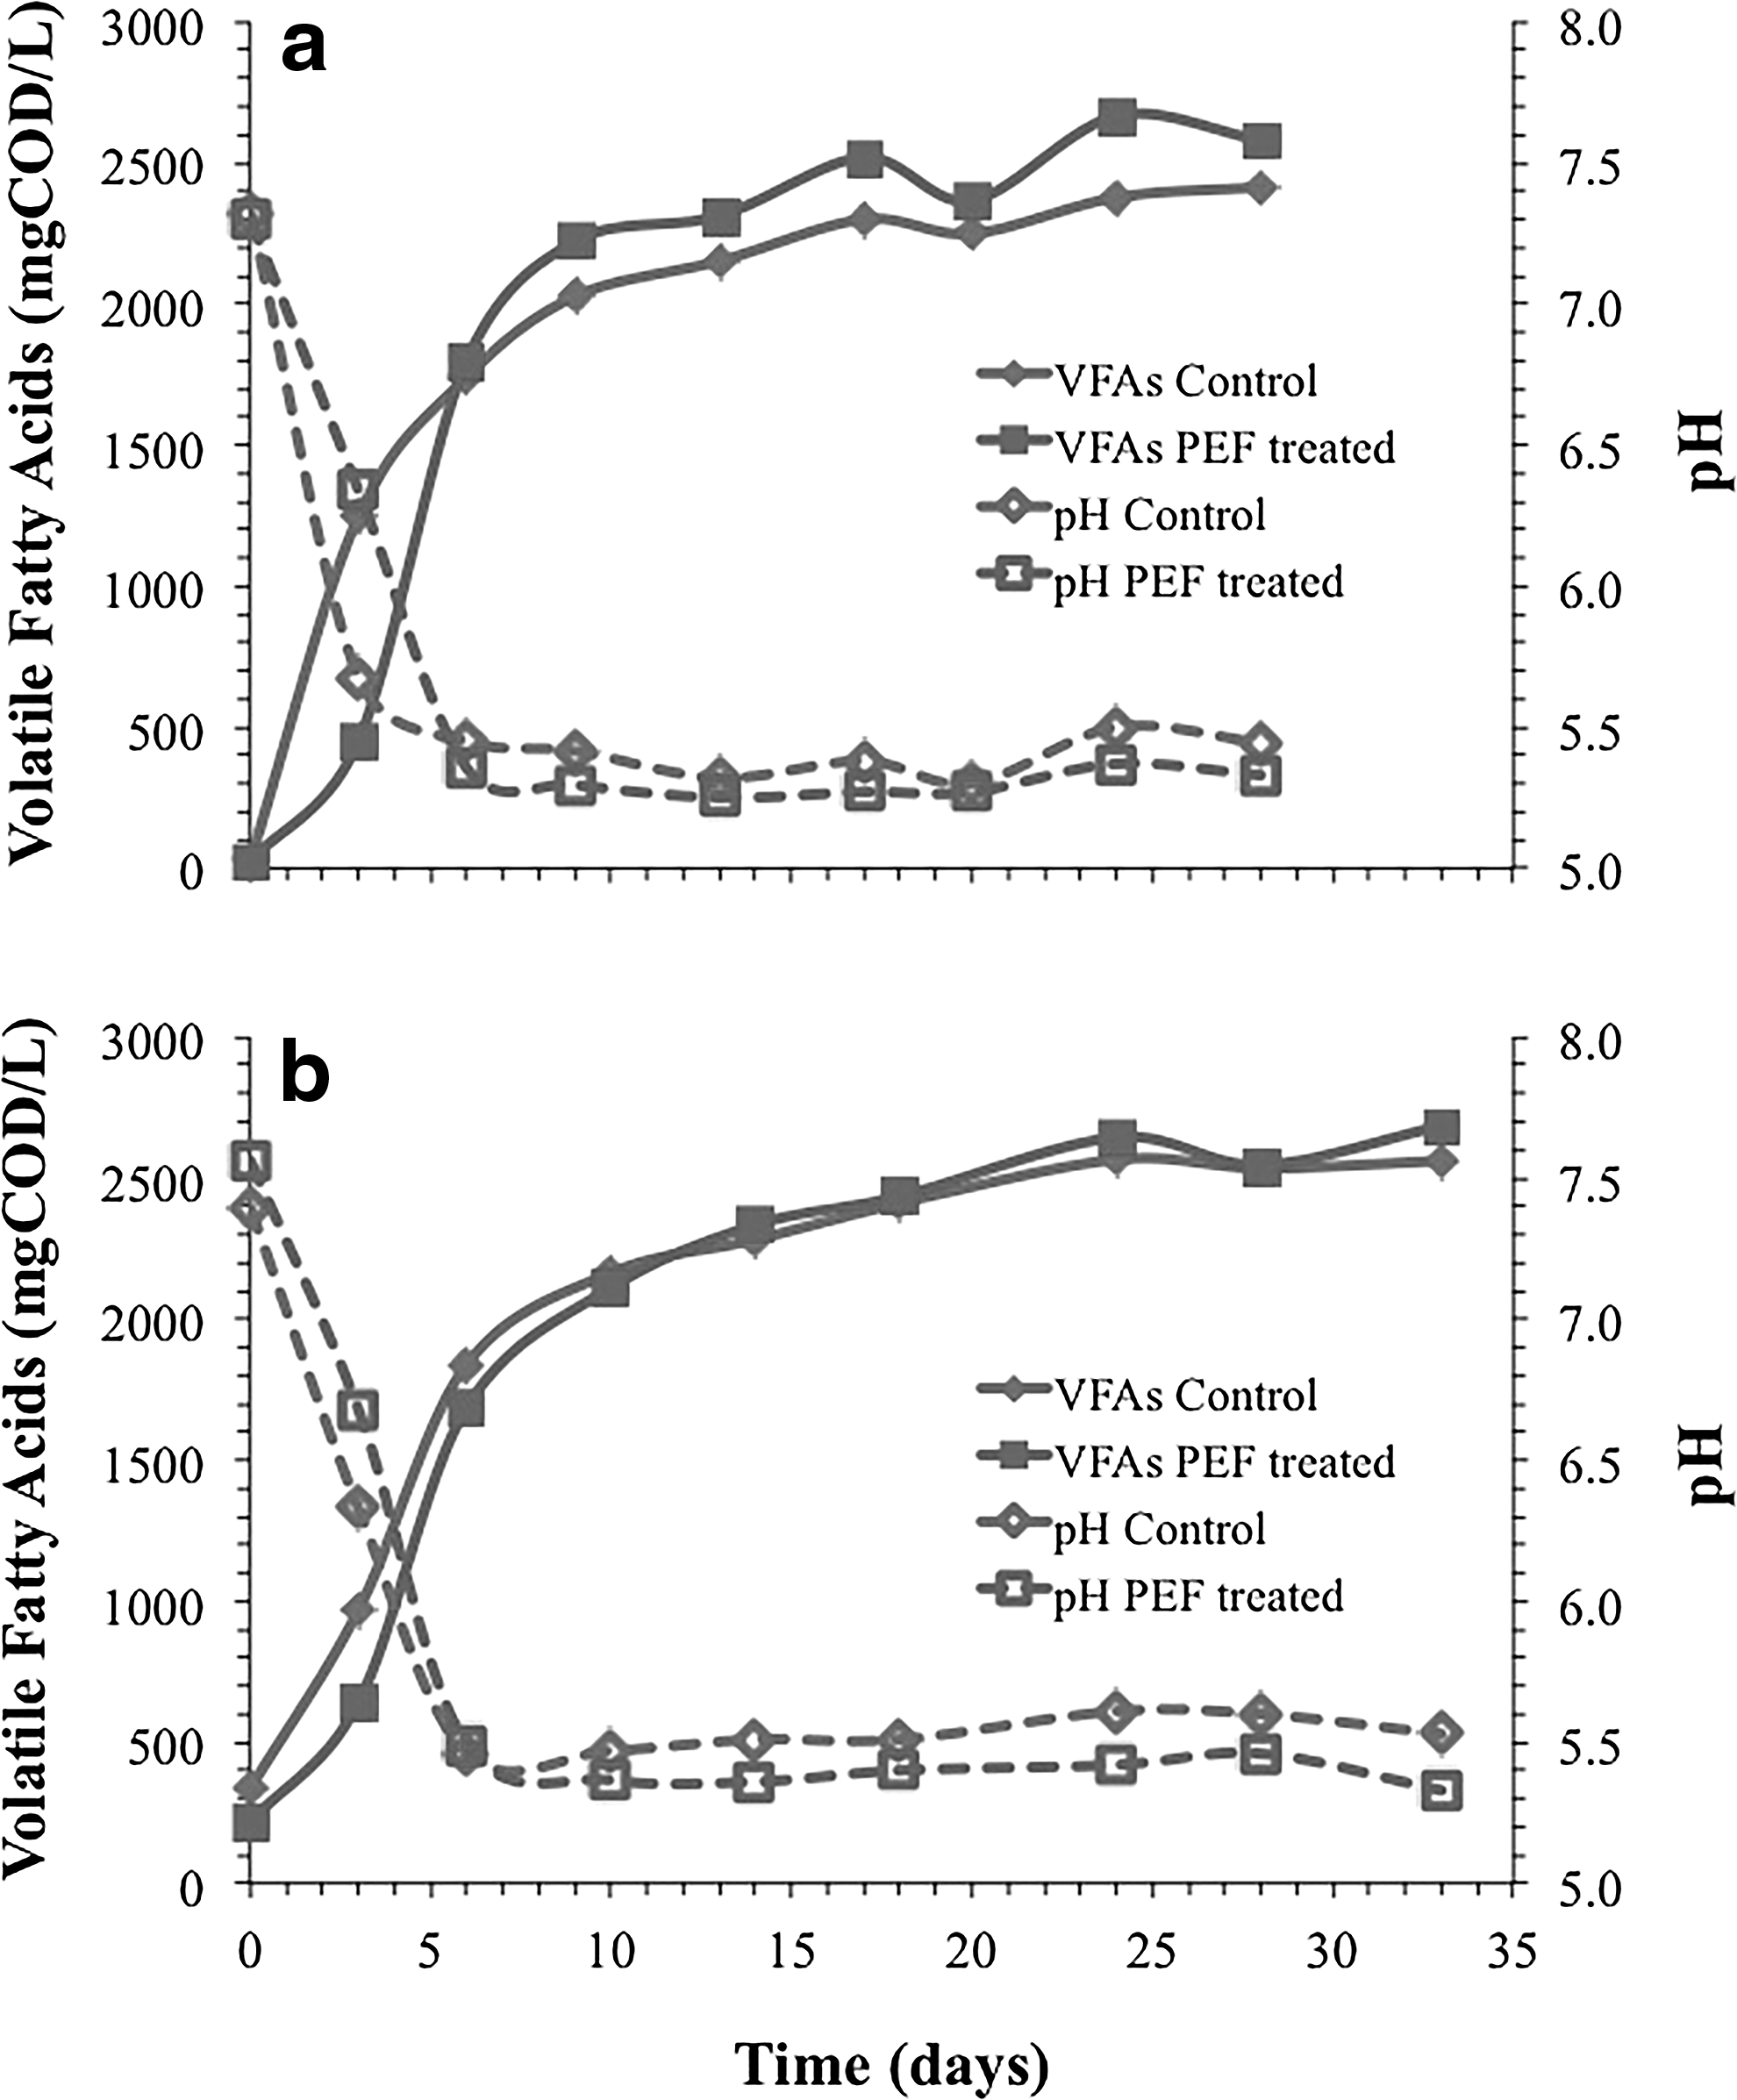
pH and VFA concentrations produced in the fermentation batch bottles:
Based on the VFA production, we also computed the hydrolysis rate constants (khyd-fermentation) using the first-order model: 0.204 (±0.009) and 0.254 (±0.089) (day−1) for control and PEF-treated PS, respectively. Thus, PEF-treated PS showed a 24% increase in the hydrolysis rate coefficient, compared to control PS, over 10 days. Higher khyd based on fermentation compared to BMP is consistent to Pratt et al. (2012). At the end of batch fermentation, the PEF-treated PS had accumulated 7% more VFAs and its fractional COD conversion (gVFA-COD/gTCODin) increased from 13% to 14%, a 7% relative increment; the difference of VFA conversion from PS-TCOD was significant between control and PEF (p-value<0.05). Although the relative increment after PEF treatment by fermentation is similar to the one in the BMP assay, the actual magnitude of ∼13% conversion in fermentation is much lower, compared to ∼30% in BMP during 30 days of operation. Hydrolysis and fermentation may have been limited due to three reasons. First, PS may have a substantial fraction of organic solids that resist hydrolysis (Jones et al., 2008; Rulkens, 2008). Second, the low pH after 10 days may have inhibited hydrolytic bacteria (Veeken et al., 2000). Third is feedback inhibition by the fermentation products (Raposo et al., 2006; Pratt et al., 2012).
Even though VFA accumulation with time had similar trends to methane production in BMP assays, total VFA produced in control and PEF-treated PS started to stabilize earlier (between 6 and 10 days), compared to BMP (after 10 days) (Figs. 3 and 4). Correspondingly, we also show in Fig. 5 that acetate production in all cases (control and PEF-treated PS of the first and second enrichments) stabilized in less than 10 days of batch operation. In contrast, other fatty acids (propionate, butyrate, isobutyrate, valerate, and isovalerate) increased to the end of the batch experiments (Supplementary Fig. S2). These results support a possible thermodynamic feedback inhibition of β-oxidation that converts longer fatty acids (e.g., butyrate) to acetate (McCarty and Smith, 1986; Rittmann and McCarty, 2001).

Changes of VFA profiles during the first and second enrichment fermentations for control and PEF-treated PS.
Is PEF treatment effective for PS only?
Table 2 shows that the methane production rates for PEF-treated sludges were 1.6, 1.7, and 1.1 times higher than the respective controls for TMS (50:50 ratio of WAS:PS), WAS alone, and PS alone, respectively. This highlights that WAS contributed significantly to the positive impacts observed with FP treatment of TMS (Rittmann et al., 2008). Consistent with the impact of PEF on methane production are the much larger increases in soluble COD after FP treatment of WAS (4,800%) (Salerno et al., 2009), compared to PS (79%) (Table 1). This large difference results from the severe disruption of WAS flocs and bacterial cells (Salerno et al., 2009). In contrast, PS has relatively more noncellular organic solids, and the organic solids are more readily biodegradable. Thus, PEF treatment of PS did not result in a big increase in SSCOD or a large increment of methane production. The VFAs after fermentation of sludges could generate sustainable electron donors for emerging technologies such as MXCs, denitrification, or advanced biological phosphorus removal (Tong and Chen, 2007; Lee et al., 2010; Choi and Ahn, 2014). Similar to the modest improvement of methane production using PEF-treated PS, PEF treatment did not result in a large increment of VFA accumulation from PS. However, our study points to the value of evaluating different ratios of PS and WAS for anaerobic digestion and fermentation to VFAs.
MPR, methane production rate; PS, primary sludge; VS, volatile solids; WAS, waste activated sludge.
Conclusion
PEF treatment of PS resulted in efficient microbial inactivation and modest improvements in the bioavailability of organic solids in PS. COD conversion efficiencies by methanogenesis and fermentation marginally increased by 8% and 7%, respectively, at the end of batch experiments. Hydrolysis rate coefficients increased by 13% and 24% as well. These results support that the maximum benefit to energy capture and solids reduction for wastewater treatment sludges should be achieved by PEF treatment of WAS, rather than PS. This points to the value of optimizing ratios of PS:WAS for PEF treatment, whether the goal is methanogenesis or fermentation to VFAs.
Footnotes
Acknowledgments
The funding for this work was provided by DoD-SERDP (No. ER-2239) and NSF-CBET (1335884). We also thank Dave Rath and his staff for assistance in obtaining samples at NWWRP. In addition, we thank Jared Alder for his valuable expertise in operating the FP alpha unit to treat samples.
Author Disclosure Statement
No competing financial interests exist.
References
Supplementary Material
Please find the following supplemental material available below.
For Open Access articles published under a Creative Commons License, all supplemental material carries the same license as the article it is associated with.
For non-Open Access articles published, all supplemental material carries a non-exclusive license, and permission requests for re-use of supplemental material or any part of supplemental material shall be sent directly to the copyright owner as specified in the copyright notice associated with the article.