
Abstract
Abstract
A new hydrophilic acrylic ester resin (MSE-resin) was synthesized by suspension polymerization from methyl methacrylate (MMA), sodium p-styrene sulfonate (SSS), and ethylene glycol dimethacrylate (EGDMA). Batch adsorption studies indicated that the optimum adsorption was achieved when pH was 5, contact time 180 min, adsorbent dose 0.2 g, initial concentration 2,000 mg/L, and temperature 313 K. Experimental data showed a good fit with the pseudosecond-order kinetic model. Intraparticle diffusion analysis indicated that the intraparticle diffusion was involved in the adsorption process, but it was not the only rate-limiting step. Adsorption isotherms of phenol were linearly correlated and found to be well represented by the Freundlich model. Thermodynamic parameters such as changes in the enthalpy (ΔH), free energy (ΔG), and entropy (ΔS) indicated that the process of adsorption phenol on MSE-resin was endothermic and spontaneous.
Introduction
W
Recently, various methods and technical processes such as catalytic oxidation, biodegradation, solvent extraction, and adsorption have been developed to treat the phenol-containing effluents efficiently (Stuber et al., 2005; Bilgili 2006; Tsai and Juang, 2006; Akhlaghian et al., 2014; Yang et al., 2006), among which adsorption is proved to be one of the most attractive and effective techniques in either laboratorial exploration or industrial application (Pan et al., 2005). As a widely used adsorbent, activated carbon exhibits a satisfactory performance for phenol removal (Ozkaya, 2006). However, its wider application is restricted due to its high regeneration cost and high attrition rate. Bentonite is a naturally available clay mineral and can be used as a low-cost adsorbent, but its adsorption capacity is relatively poor. Hence, bentonite as an adsorbent needs further modification (Al-Asheh et al., 2003). In the past few decades, one kind of an adsorbent with a high surface area has been always favorable for the organic and inorganic contaminants' removal (Zeng et al., 2010). Crosslinker is one of the most critical factors for the improvement of the surface area based on the formation of a large number of pores (Zeng et al., 2010). Usually, it makes the linear molecule change into a three-dimensional network structure through the newly formed crosslinking bonds, which leads to the porous surface of the polymeric adsorbent and provides adsorption channel during the whole process (Li et al., 2001). In addition, the adsorption capability of many polymeric adsorbents depends on the solvent condition. These hydrophobic adsorbents cannot efficiently contact phenol in an aqueous solution, whereas exhibit excellent adsorption capability for phenol in cyclohexane (Li et al., 2004). To overcome this drawback, the chemical modification of an adsorbent is performed by the introduction of hydrophilic monomers into the resin matrix. Huang et al. (2012) researched the HJ-M05 (a diethylenetriamine-modified resin) and MCl (a N-butylimidazole-modified resin) for phenol removal, and these modified resins exhibited excellent sorption properties (Zhu et al., 2011). However, preparation of these modified adsorbents is faced with an extremely serious problem, that is, the utilization of the recognized carcinogen, chloromethyl methyl ether.
Considering the above conditions, another preparation method that a balanced ratio of a hydrophilic monomer copolymerizes with a crosslinker was proposed (An et al., 2012). AbsElut Nexus is a hydrophilic commercial adsorbent, which is based on the copolymerization of methacrylate-divinylbenzene (MA-DVB) (Fontanals et al., 2007). Oasis HLB is a macroporous poly (N-vinylpyrrolidone/divinylbenzene) (PVP-DVB) copolymer (Zeng et al., 2010). Moreover, Fontanals et al. (2003, 2004) prepared 4-vinylpyridine-divinylbenzene (4VP-DVB) and N-vinylimidazole–divinylbenzene (NVIm-DVB). These adsorbents were tested in the sorption of phenol, and the results showed that the adsorbent with hydrophilicity can effectively increase the chances of contacting the water-soluble pollutant phenol and improve the adsorption capacity.
Therefore, in this study, we synthesized a hydrophilic acrylic ester resin (MSE-resin) by suspension polymerization. Introducing the hydrophilic monomer sodium p-styrene sulfonate (SSS) into the polymerization process may be possible to improve its adsorption capacity toward phenol. Its structure was characterized by Fourier transform infrared spectroscopy (FTIR), thermogravimetric analyzer (TGA), scanning electron microscopy (SEM), and BET surface area analysis. The effects of various factors (pH, dosage, contact time, initial concentration, and temperature) on the adsorption capacity are studied. The adsorption kinetics, isotherms, and thermodynamics are also investigated for the phenol removal.
Materials and Methods
Chemicals and reagents
Hexadecyltrimethylammonium bromide (CTAB) and sodium dodecyl sulfate (SDS), sodium chloride, n-heptane, methyl methacrylate (MMA), SSS, benzoyl peroxide (BPO), and phenol were purchased from Kelong Chemical Reagent (Chengdu, China). Ethylene glycol dimethacrylate (EGDMA), applied as a cross-linking reagent, was purchased from Aladdin Reagent Co., Ltd. (Shanghai, China). Hydrochloric acid and sodium hydroxide, applied to adjust the solution pH, were obtained from Beijing Chemical Reagent Co., Ltd. (Beijing, China). All reagents were of analytical purity grades and used without any further purification.
Synthesis of the adsorbent
A typical preparation of the MSE-resin was carried out through the traditional suspension polymerization. Figure 1 presents the elaboration process of preparation of the MSE-resin, which is similar to the Trochimczuk's porous copolymers of acrylonitrile (AN)/divinylbenzene (DVB) (Trochimczuk et al., 2001). First, 0.0835 g CTAB, 0.0165 g SDS, 5 g sodium chloride, and 95 mL of deionized water were mixed in a 250-mL three-necked round-bottomed flask equipped with a reflux condenser and mechanical stirrer. Under mechanical stirring, the mixture was heated to 343 K within 45 min. Then, the organic phase, containing 10.6 mL MMA, 0.7 mL EGDMA, 7.5 mL n-heptane, and 0.29 g BPO, was added into the flask. Subsequently, the SSS solution (4.12 g SSS and 20 mL deionized water) was introduced dropwise into the organic phase within 0.5 h. The resulted solution was polymerized at 348 K for 5 h (Hao et al., 2008). After cooling to room temperature, the prepared polymeric beads were rinsed successively with deionized water and ethanol five times. Finally, the products were dried under vacuum at 333 K for 24 h.
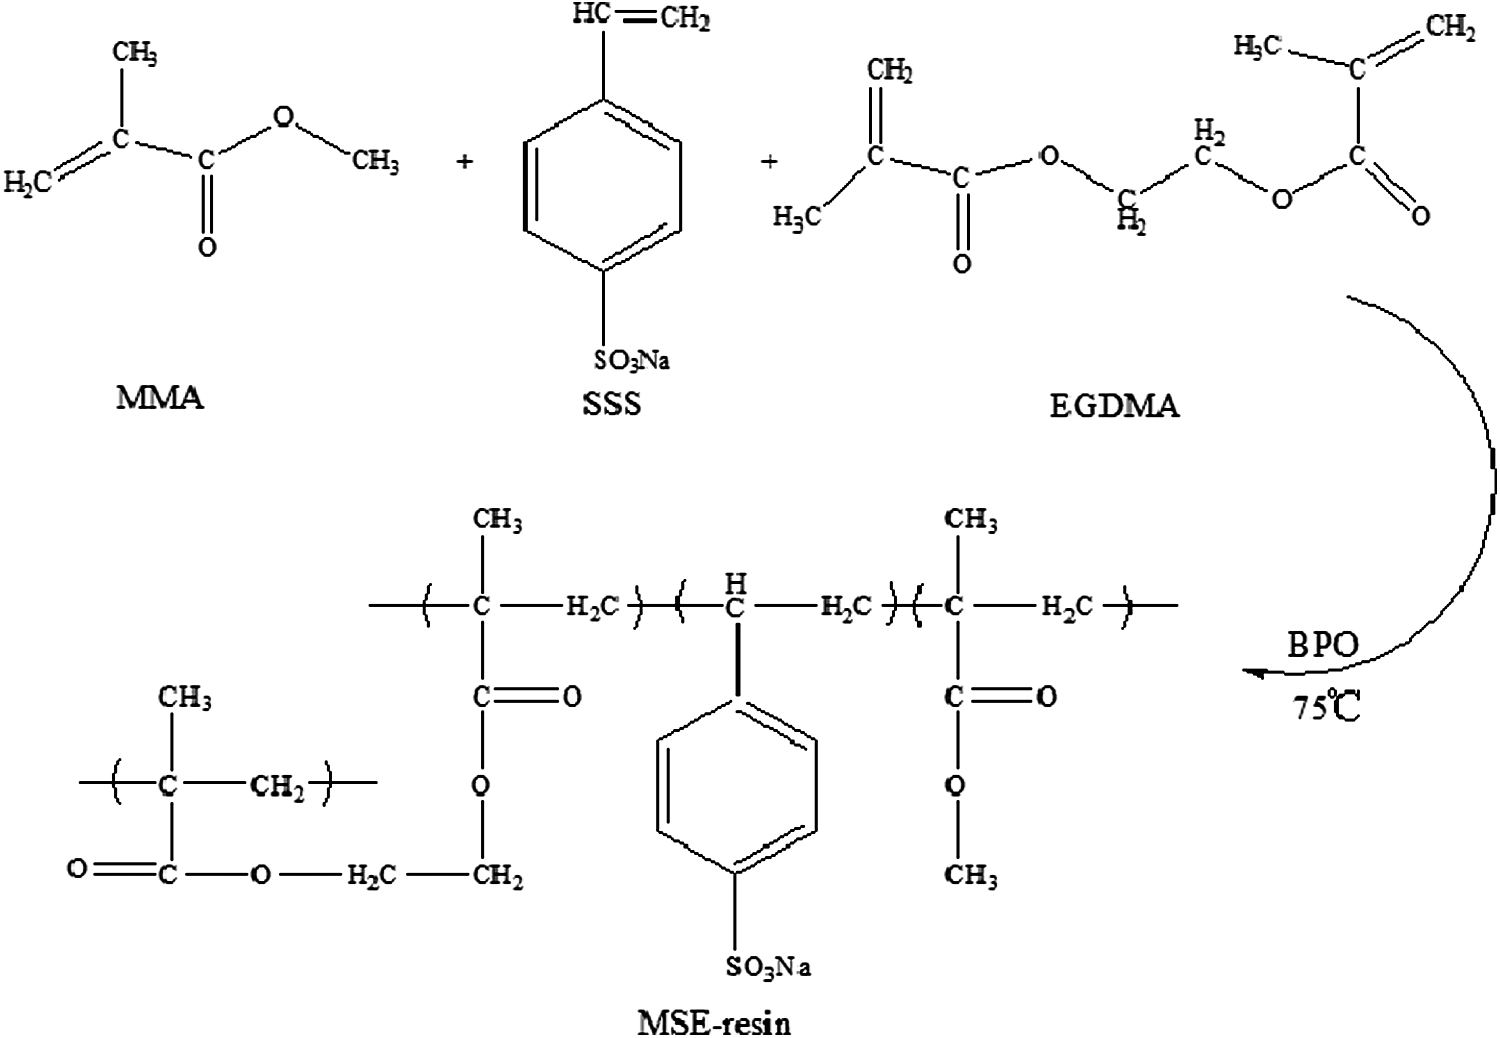
Synthesis reaction of the MSE-resin. EGDMA, ethylene glycol dimethacrylate; MMA, methyl methacrylate; MSE-resin, hydrophilic acrylic ester resin; SSS, sodium p-styrene sulfonate.
Characterization
The FTIR of sample was recorded on a Nicolet 6700 spectrophotometer to check functional groups of material (KBr pellet) in the region of 4000–400 cm−1. The heat resistance of the MSE-resin was measured by a TGA. The temperature was increased from room temperature to 500°C at a rate of 10°C/min in atmosphere. The morphologies of porous resins were characterized by Hitachi-S4700 SEM (Hitachi, Ltd., Tokyo, Japan). The BET surface area was determined by N2 adsorption–desorption isotherms at 77 K using an F-sorb 3400 automatic surface area and porosity analyzer (Bei Jing Gold Spectrum Technology Corp., Beijing, China). The adsorbents were outgassed at 333 K for 24 h on the degas port of the analyzer before the BET surface area measurement. The concentrations of phenol in aqueous solution were analyzed by ultraviolet (UV) analysis, performed on a UV-752 spectrophotometer (Shanghai Yoke Instrument. Co., Ltd., Shanghai, China) at 270 nm wavelength.
Batch adsorption experiments
Batch adsorption experiments were carried out in 100-mL flasks shaking in the constant temperature oscillator with a sealing device. Before the batch adsorption experiments, the MSE-resins were thoroughly wetted by deionized water for 12 h. The effect of pH on phenol removal was studied by shaking 0.2 g of adsorbent and 25 mL of 1,000 mg/L phenol solution at pH 2–12. To ensure that the adsorption reached equilibrium, the adsorption process was kept for 24 h. The pH of the aqueous solution was adjusted using stock solutions of 1 M HCl and 1 M NaOH. The effect of MSE-resin dose on phenol removal was determined by placing 25 mL of 1,000 mg/L phenol solution with desired doses (0.1–0.6 g) and shaking for 24 h.
Adsorption kinetics was carried out by shaking 2.0 g of adsorbent and 250 mL phenol solution at room temperature (283 K). The initial concentrations of the phenol solution were set to be 500, 1,000, and 2,000 mg/L, respectively, and 0.5 mL phenol solution was sampled at predetermined time intervals. The concentration of the residual solution was determined until the adsorption equilibrium was reached, and the adsorption capacity at contact time t was calculated (Chang and Juang, 2004):
where Qt is the adsorption capacity at contact time t (mg/g); Co and Ct are the concentrations of phenol (mg/L) at initial time and the contact time t, respectively; V is the volume of the solution (L), and W is the dose of resin (dry weight, g).
Adsorption isotherms were carried out as follows: about 0.2 g of the dry resin was accurately weighed and mixed with 25 mL of phenol solution, ranged from 500 to 3,000 mg/L with 500 mg/L interval. The flasks were then shaken in a thermostatic oscillator for 6 h at a desired temperature (283, 298, and 313 K). The concentration of the residual solution was measured, and the equilibrium adsorption capacity was calculated with Equation (2) (Nischang and Svec, 2009):
where Qe is the equilibrium adsorption capacity (mg/g); Ce is the equilibrium concentration of the phenol solution (mg/L).
The calibration curve for different concentrations of the phenol solution was first determined, as shown in Fig. 2. It was created by running different calibration standards (2, 4, 5, 8, 10, 12, 16, 20, 30, 50 mg/L). The absorbance values (A) were measured for each concentration (C) at λmax = 270 nm by the UV spectrometer. The linear relationship was attained by the values of concentration (C) versus the corresponding A values. The resulted calibration equation was calculated as follows:

Calibration curve for aqueous solution of phenol.
Results and Discussion
Characterization of MSE-resin
The FTIR spectrum was obtained, as shown in Fig. 3. The peaks at 3,000 and 2,950 cm−1 are attributed to the stretching vibration of -CH3 and -CH2 (Zeng et al., 2015), respectively. The bands observed at 1,731 and 998 cm−1 are separate due to the vibration of -C = O and -C-O-C- (Huang et al., 2014). The characteristic peaks at 1,382, 1,196, and 752 cm−1 in the spectrum are attributed to the stretching vibration of -SO3 (Zeng et al., 2015). Besides, three peaks at 1,631, 1,499, and 835 cm−1 are ascribed to the vibration of the benzene ring (Sobiesiak et al., 2006; Bortolato et al., 2012). Hence, the obtained target product is successfully synthesized by the suspension polymerization.

Fourier transform infrared spectra of MSE-resin.
TGA was employed to evaluate the heat resistance of the resin (Fig. 4). Below 241°C, the weight loss determined is 1.83%. It is probably caused by the loss of water and n-heptane from the MSE-resin. This investigated TGA result proves that the heat-resistant properties are good enough to be used as the absorbent in water treatment, because no marked weight loss was observed below 241°C.
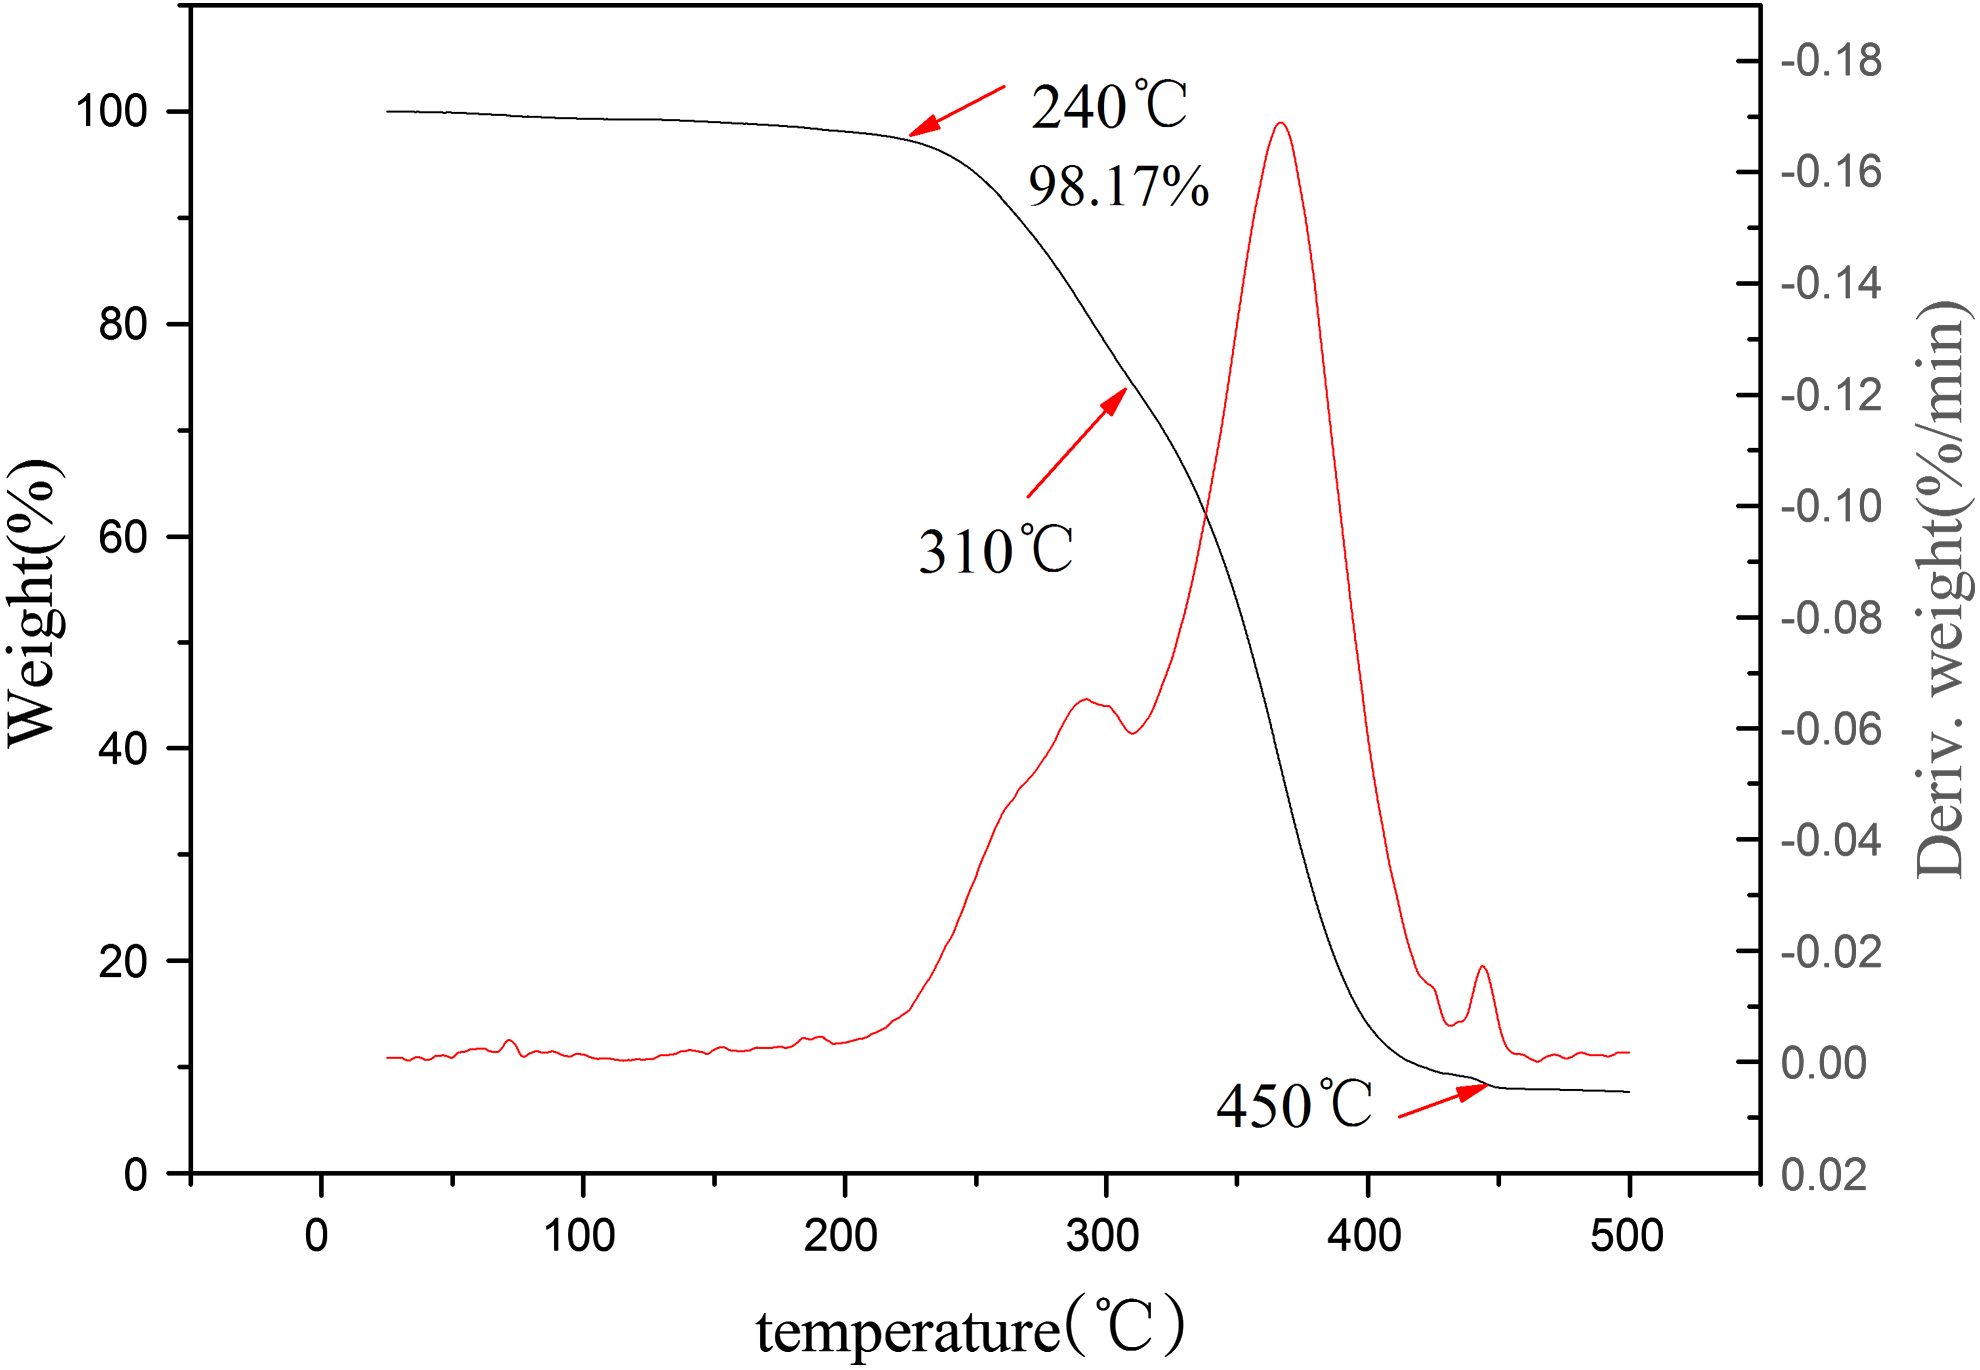
Thermogravimetric analyzer of the MSE-resin.
Figure 5 shows a macrophotograph of the MSE-resin, which illustrates that the MSE-resin particles possess good and regular shapes about 1 mm in diameter. Figure 6 shows the SEM images of the samples (Figure 6(a) and Figure 6(b) show the magnified 5000 times and 20000 times images respectively). As can be seen, a large number of pores with a pore diameter around 1 μm exist on the surface of resin, which can provide the adsorption channel for the sorption of phenol. This porous surface morphology is caused by the function of the cross-linking agent EGDMA, because it can make the MSE-resin constructed in three-dimension directions and then presented the stereo network structure.
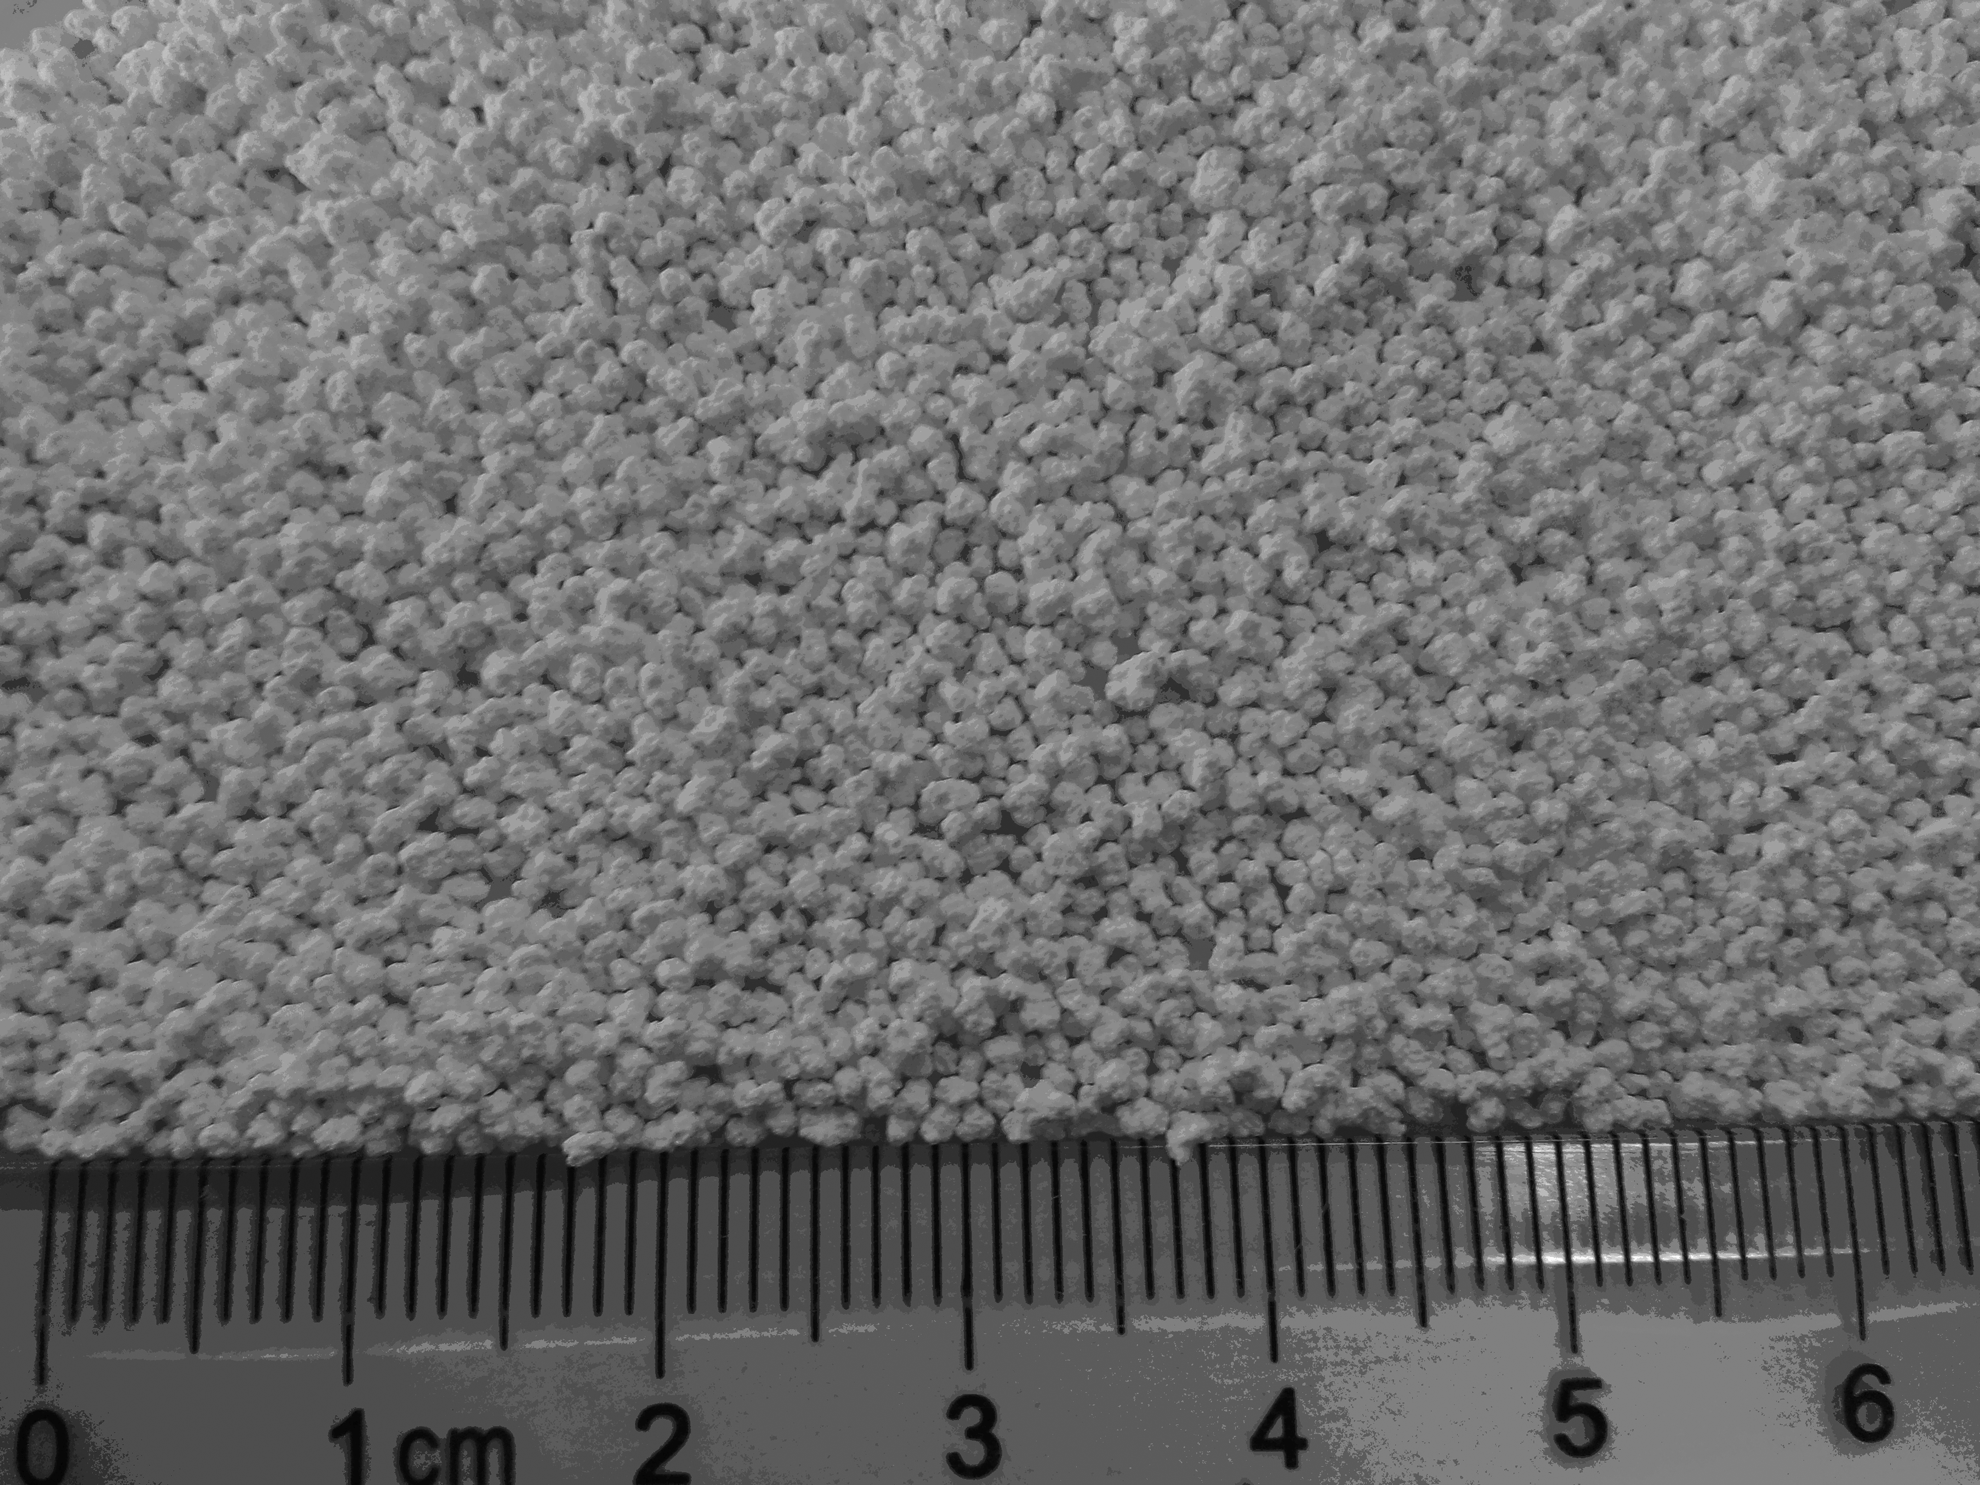
Photograph of MSE-resin.
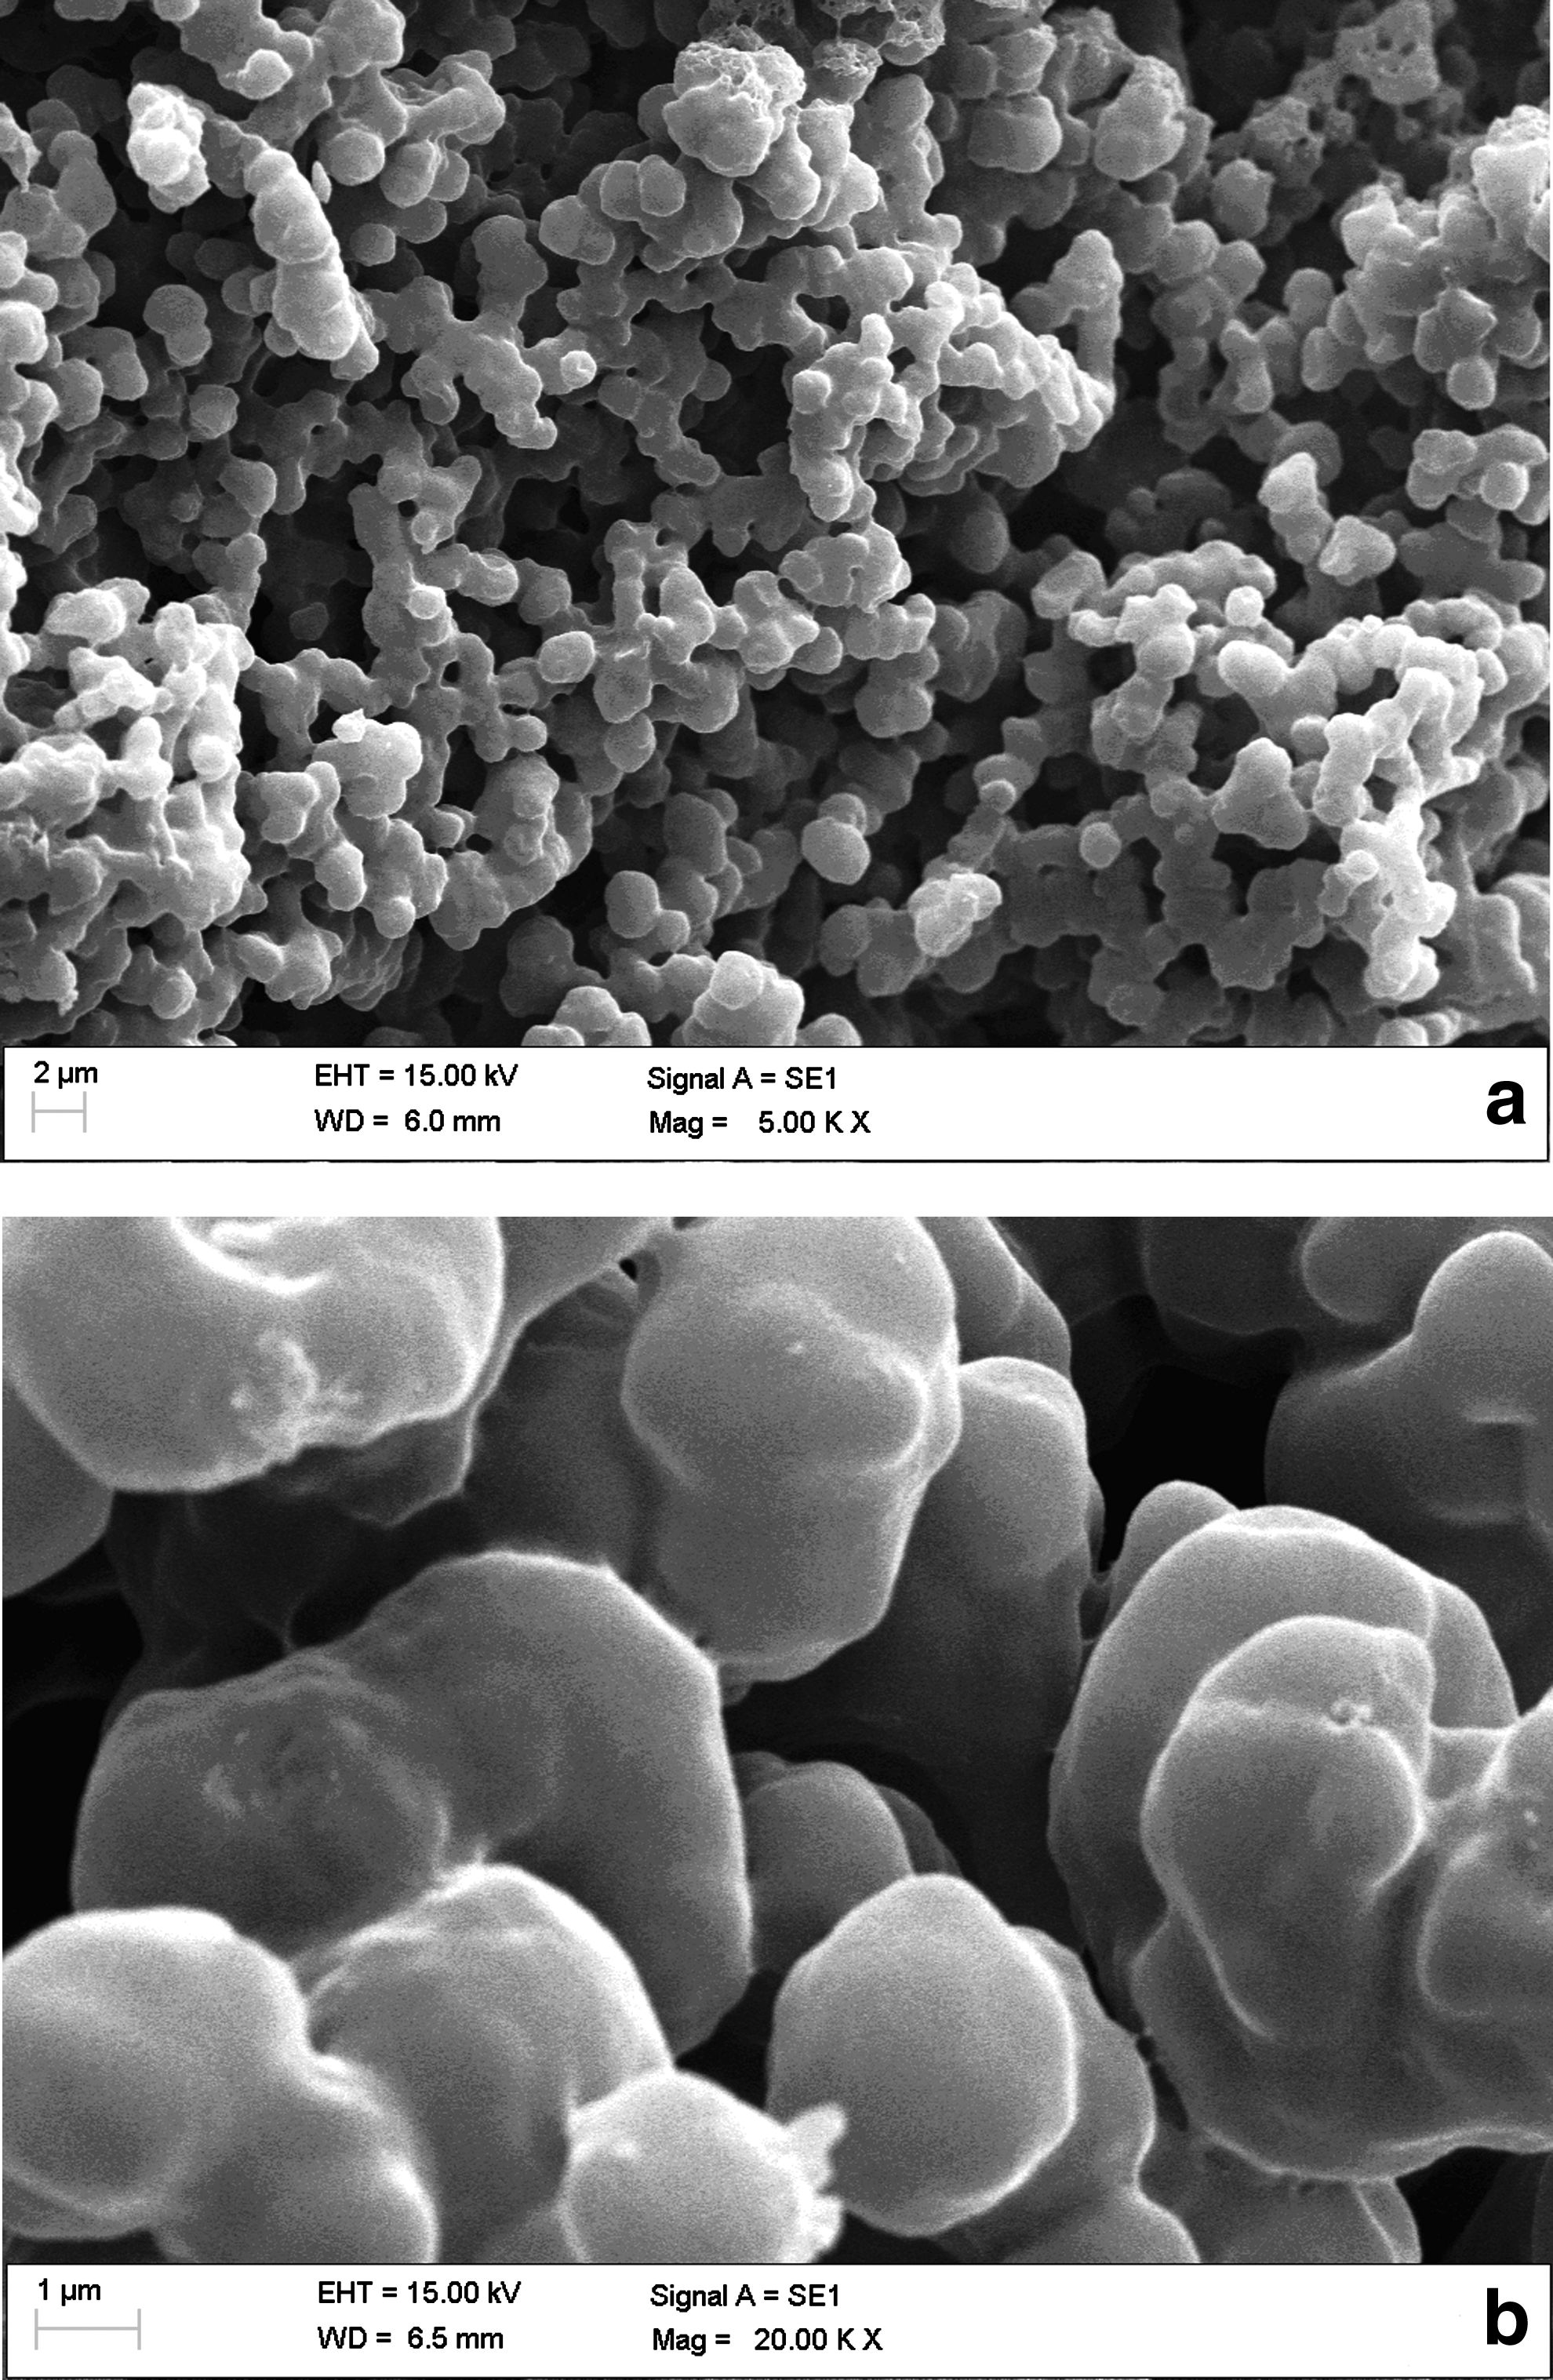
Scanning electron microscopy images of MSE-resin
Some important physical properties data and the N2 adsorption–desorption isotherms of the MSE-resin were examined and are listed in Table 1 and Fig. 7, respectively. Figure 7 presents two parts: when the relative pressure is below 0.9, the N2 quantity adsorbed exhibits one horizontal curve, which illustrates that there is no micropore or mesopore on the MSE-resin matrix; when the relative pressure is over 0.9, the N2 quantity adsorbed increases sharply, which proves that the synthesized MSE-resin mainly exists in the formation of macropores. This result is in agreement with the value of the average pore diameter of 849.34 nm in Table 1 and also has been revealed in the SEM images.
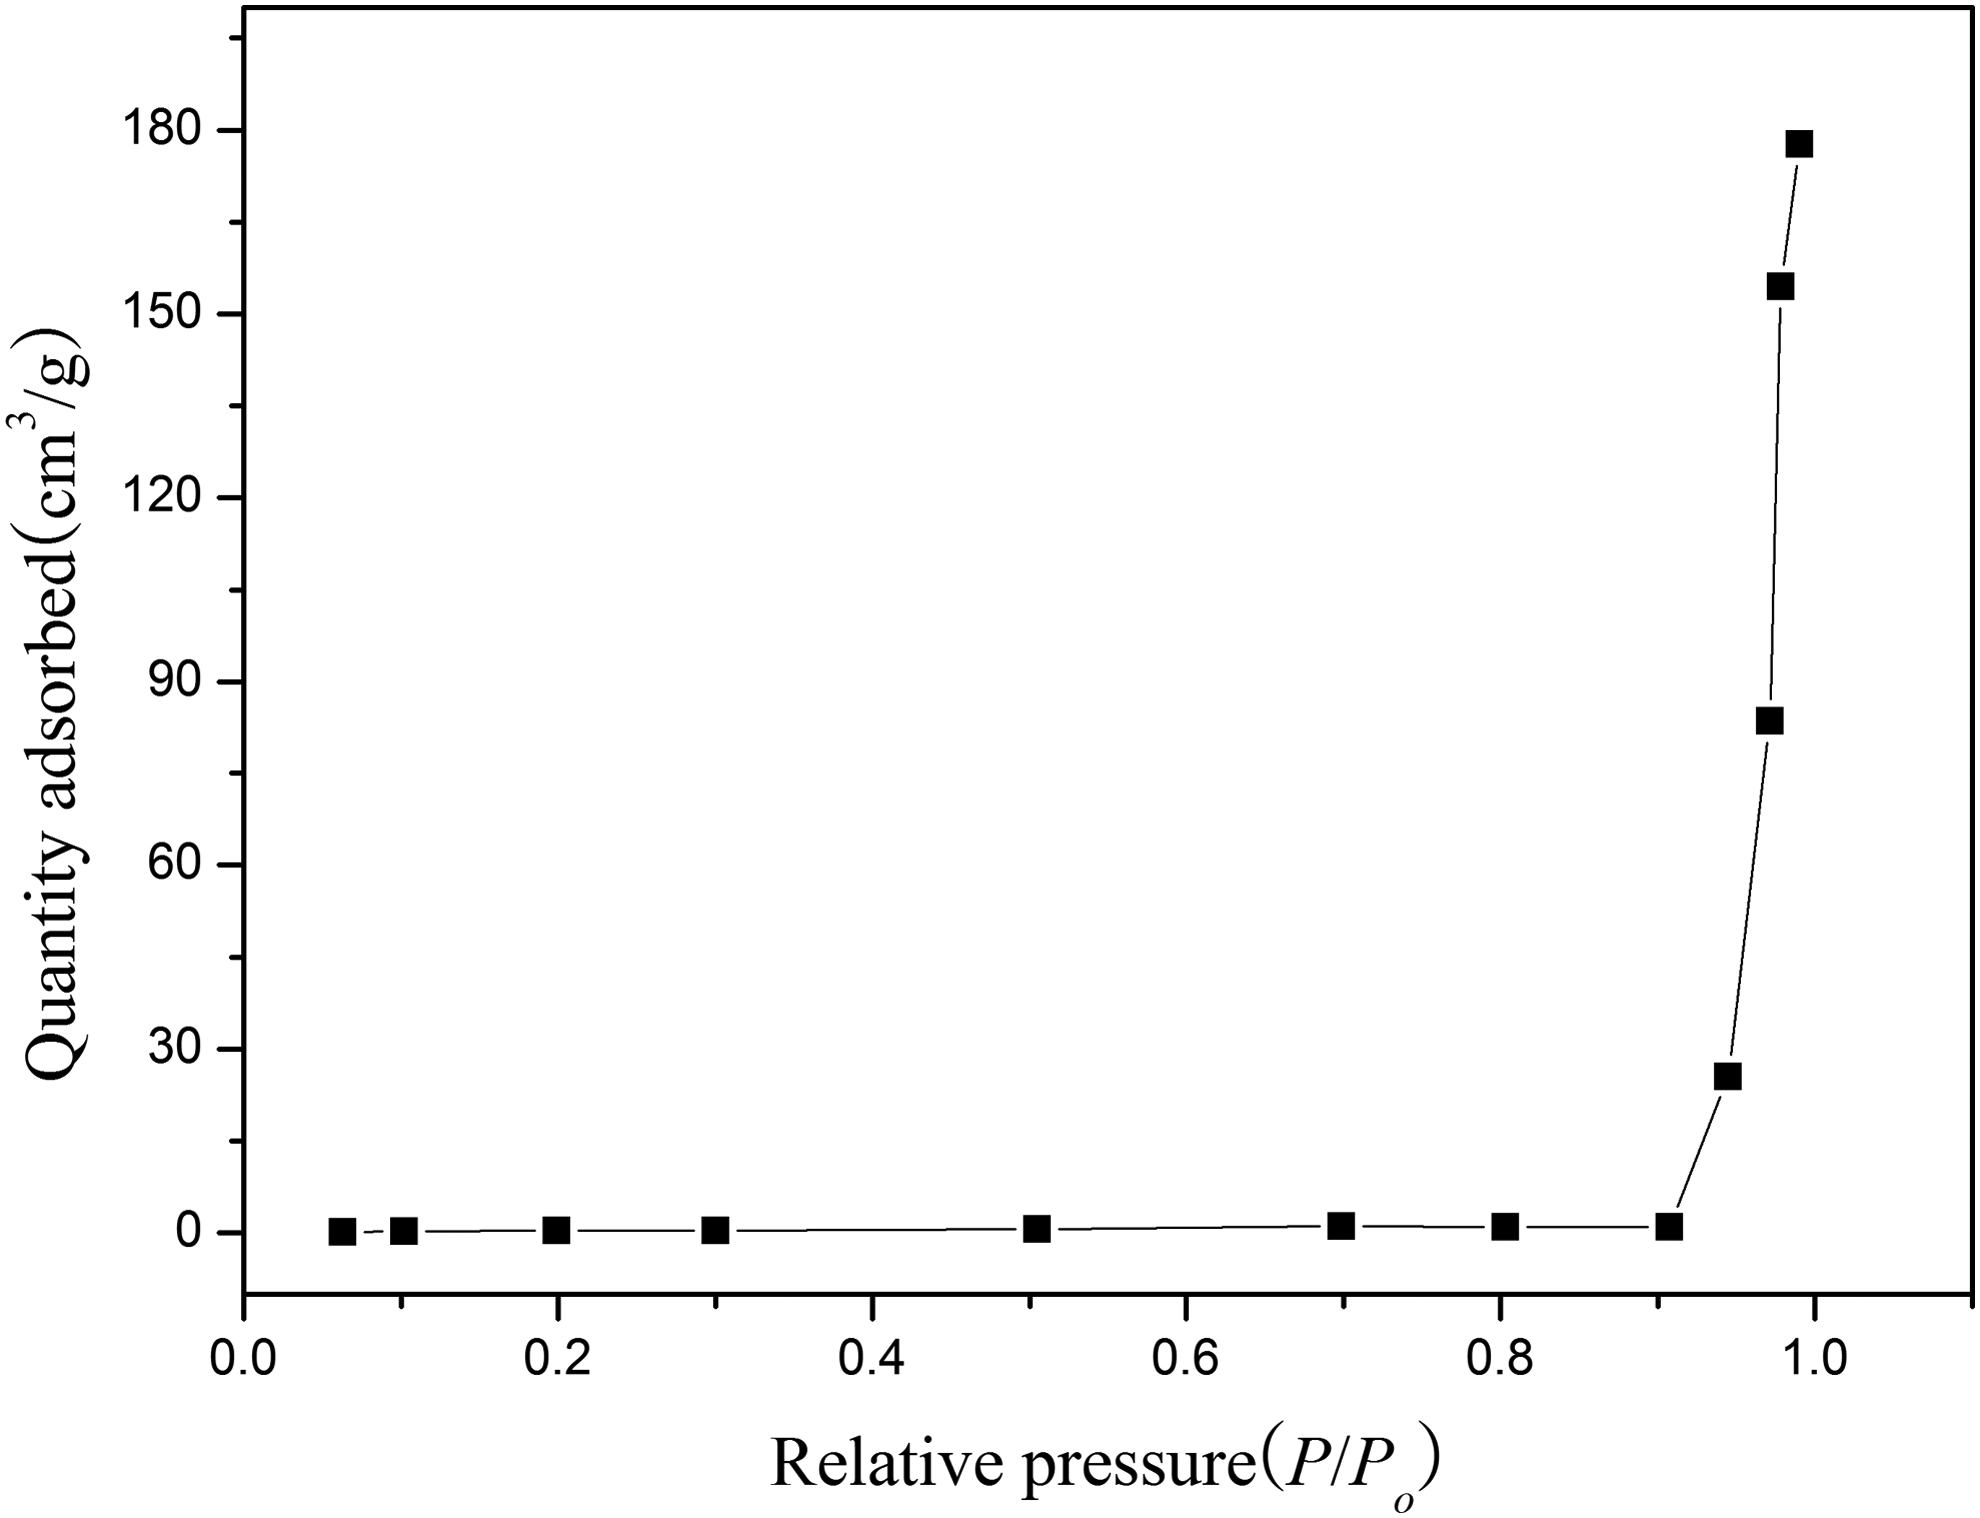
Nitrogen adsorption–desorption isotherm of MSE-resin.
MSE-resin, hydrophilic acrylic ester resin.
The above characterization analysis of the MSE-resin has proved that the synthesized polymeric adsorbent by suspension polymerization is the target product that we hope to obtain. To acquire the optimum adsorption condition and realize the characterizations of adsorption, the batch adsorption was carried out in detail.
Effect of solution pH
The solution pH, which primarily affects the degree of ionization of the phenol as well as the surface charge of the adsorbents, is one of the most important parameters in controlling the adsorption result (Zhao et al., 2010). Therefore, the effect of the solution pH (2–12) on the adsorption of the phenols by the MSE-resin was examined and is presented in Fig. 8.
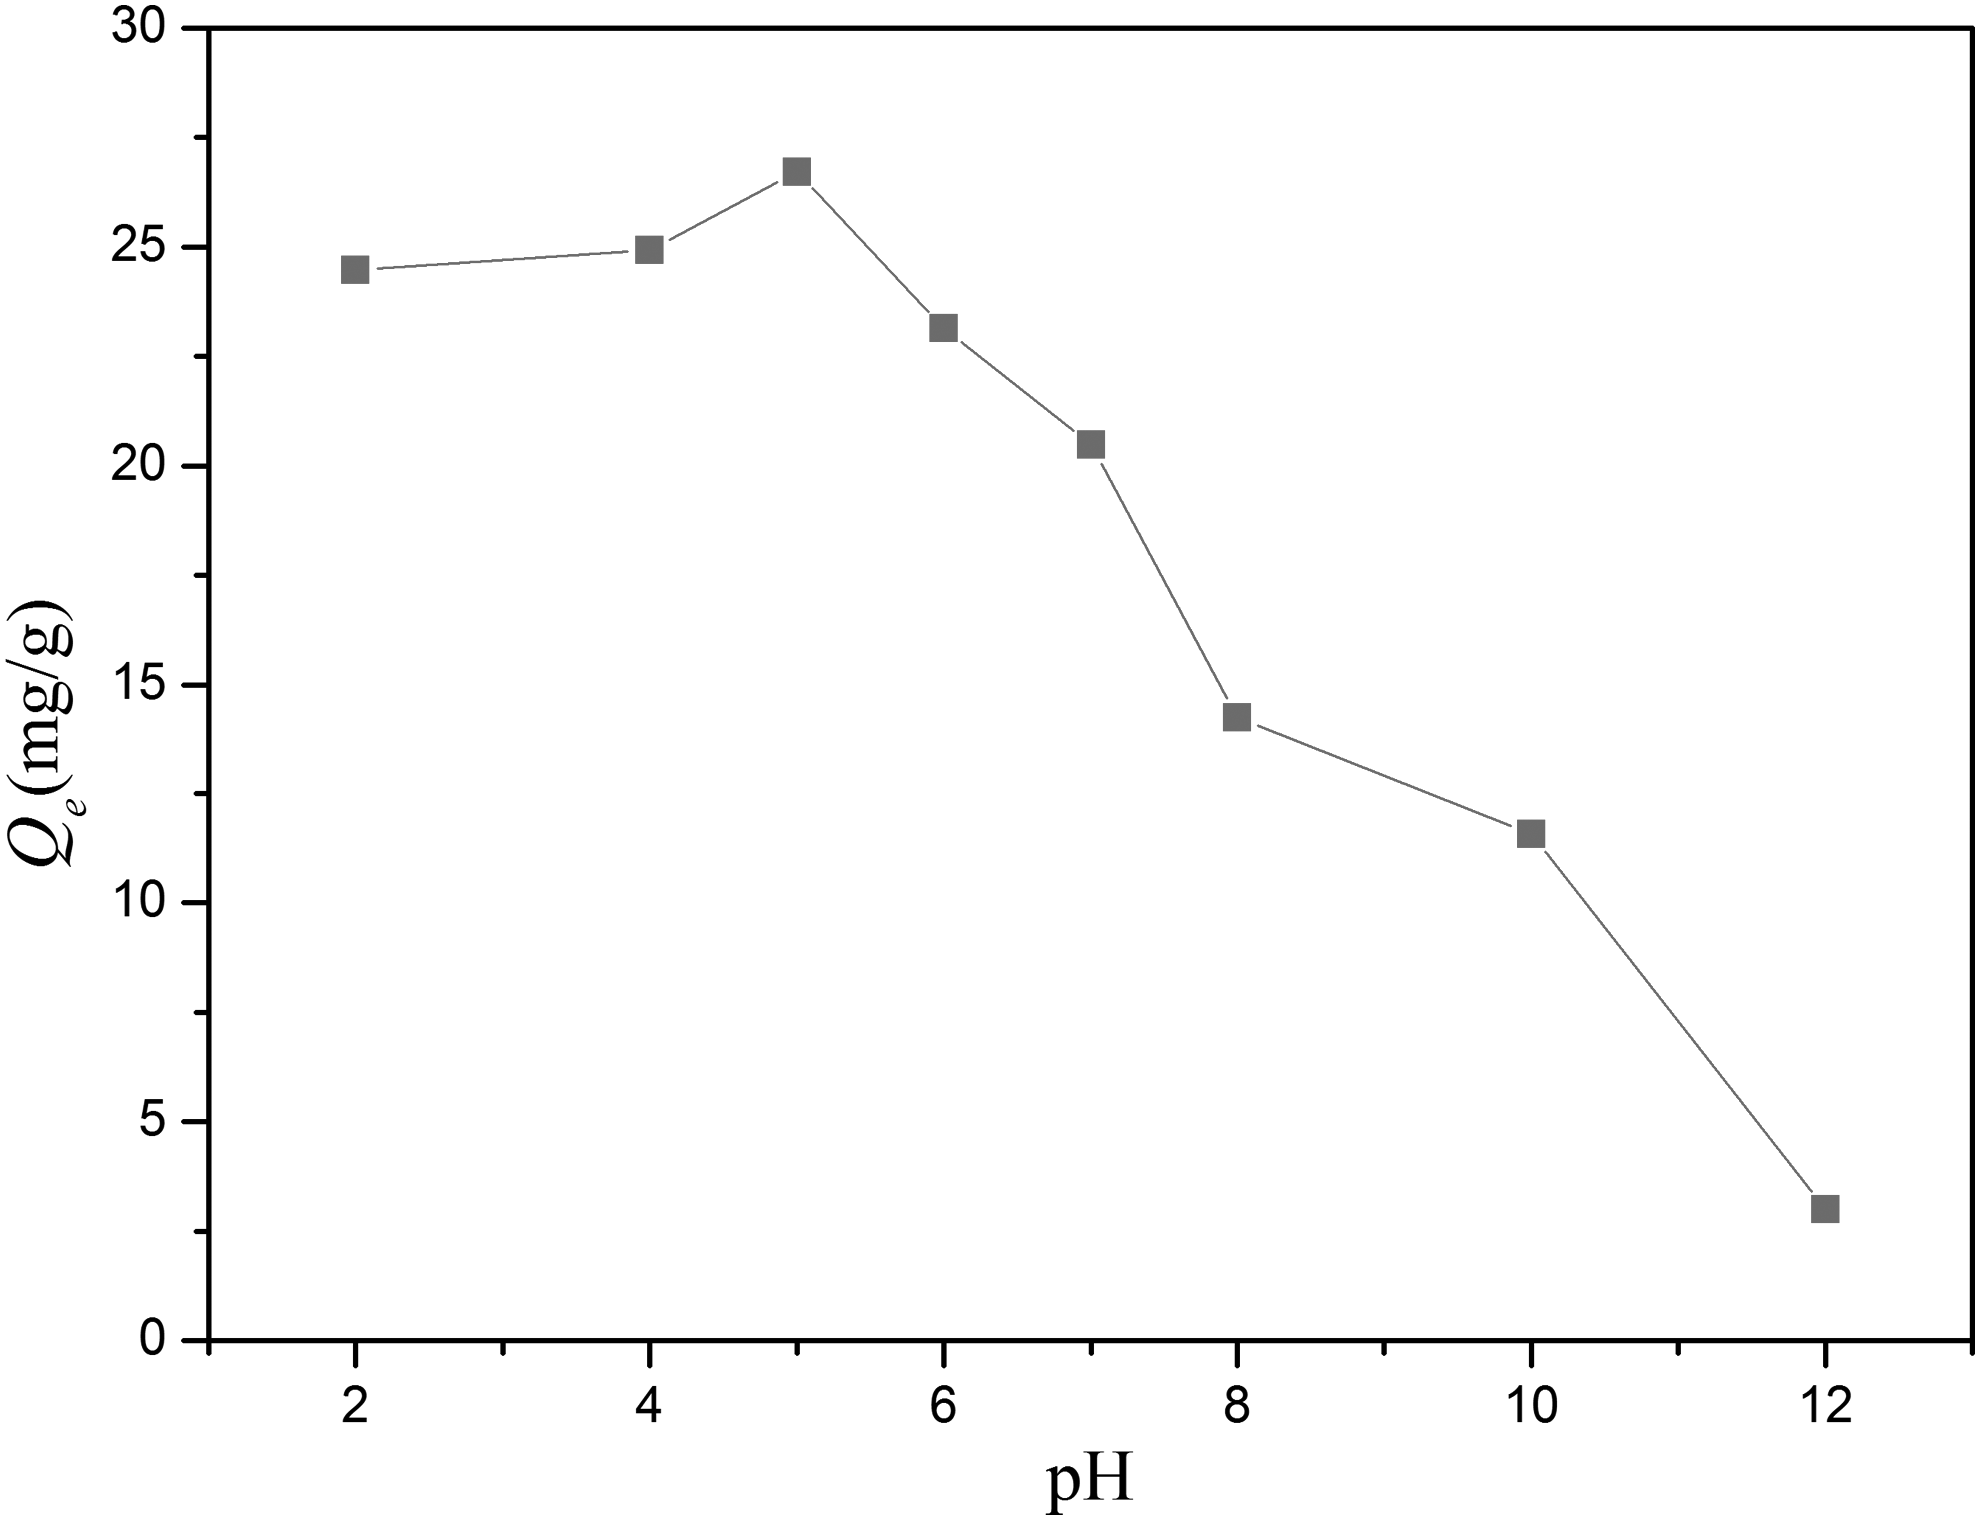
Effect of solution pH on phenol uptake.
Just as seen from Fig. 8, the adsorption capacity of the adsorbent strongly depended on the solution pH. The adsorption capacity slightly increases with increasing pH up to 5 and then decreases dramatically with pH beyond 7. The reason is that phenol molecules exist in different forms in different pH conditions. The dissociation constant pKa value of phenol is 9.95 (Huang et al., 2009); when the pH is over pKa, the phenol molecules are deprotonated and will be ionized to the negative ion, which leads to an electrostatic repulsion between the -SO3 on the MSE-resin matrix and the phenolic anion. While the solution pH is lower than pKa, the ionization will be limited. Phenol molecules mainly exist in protonated formation, which attributes to the interactions of the hydroxyl group based on phenol molecules with the functional groups on the MSE-resin.
When pH is below 7, there is an interesting phenomenon. The equilibrium adsorption capacity of the adsorbent achieves the largest value and reaches up to 26.7 mg/g at pH 5. The two kinds of driving forces (hydroxyl binding interaction and van der Waals force) play the most important role during the adsorption process (Huang et al., 2008b). It can be explained that when the pH value is below 5, there are higher concentrations of hydrogen ions H+ from the HCl solution used to adjust the pH of the phenol aqueous solution, and these H+ definitely occupy a large number of adsorption active sites on the MSE-resin, which weaken the hydroxyl binding interaction between phenol molecules and the functional groups on the MSE-resin (Liu et al., 2014a). Therefore, the adsorption capacity of the adsorbent, ultimately, is reduced. However, the pH value is varied from 5 to 7; a majority of phenols exist in the molecule state and depend on the van der Waals force to be adsorbed on the MSE-resin. The van der Waals force cannot endow the resin with the same adsorption capacity as the hydroxyl binding interactions do (Liu et al., 2014b). Thus the initial pH 5 of the phenol solution is the optimal condition for the phenol adsorption.
Effect of adsorbent dose
The adsorbent dose is an important process parameter to determine the capacity of an adsorbent at the operating conditions. The effect of the adsorbent dose on the adsorption capacity Qe (mg/g) and the removal (%) is illustrated in Fig. 9.
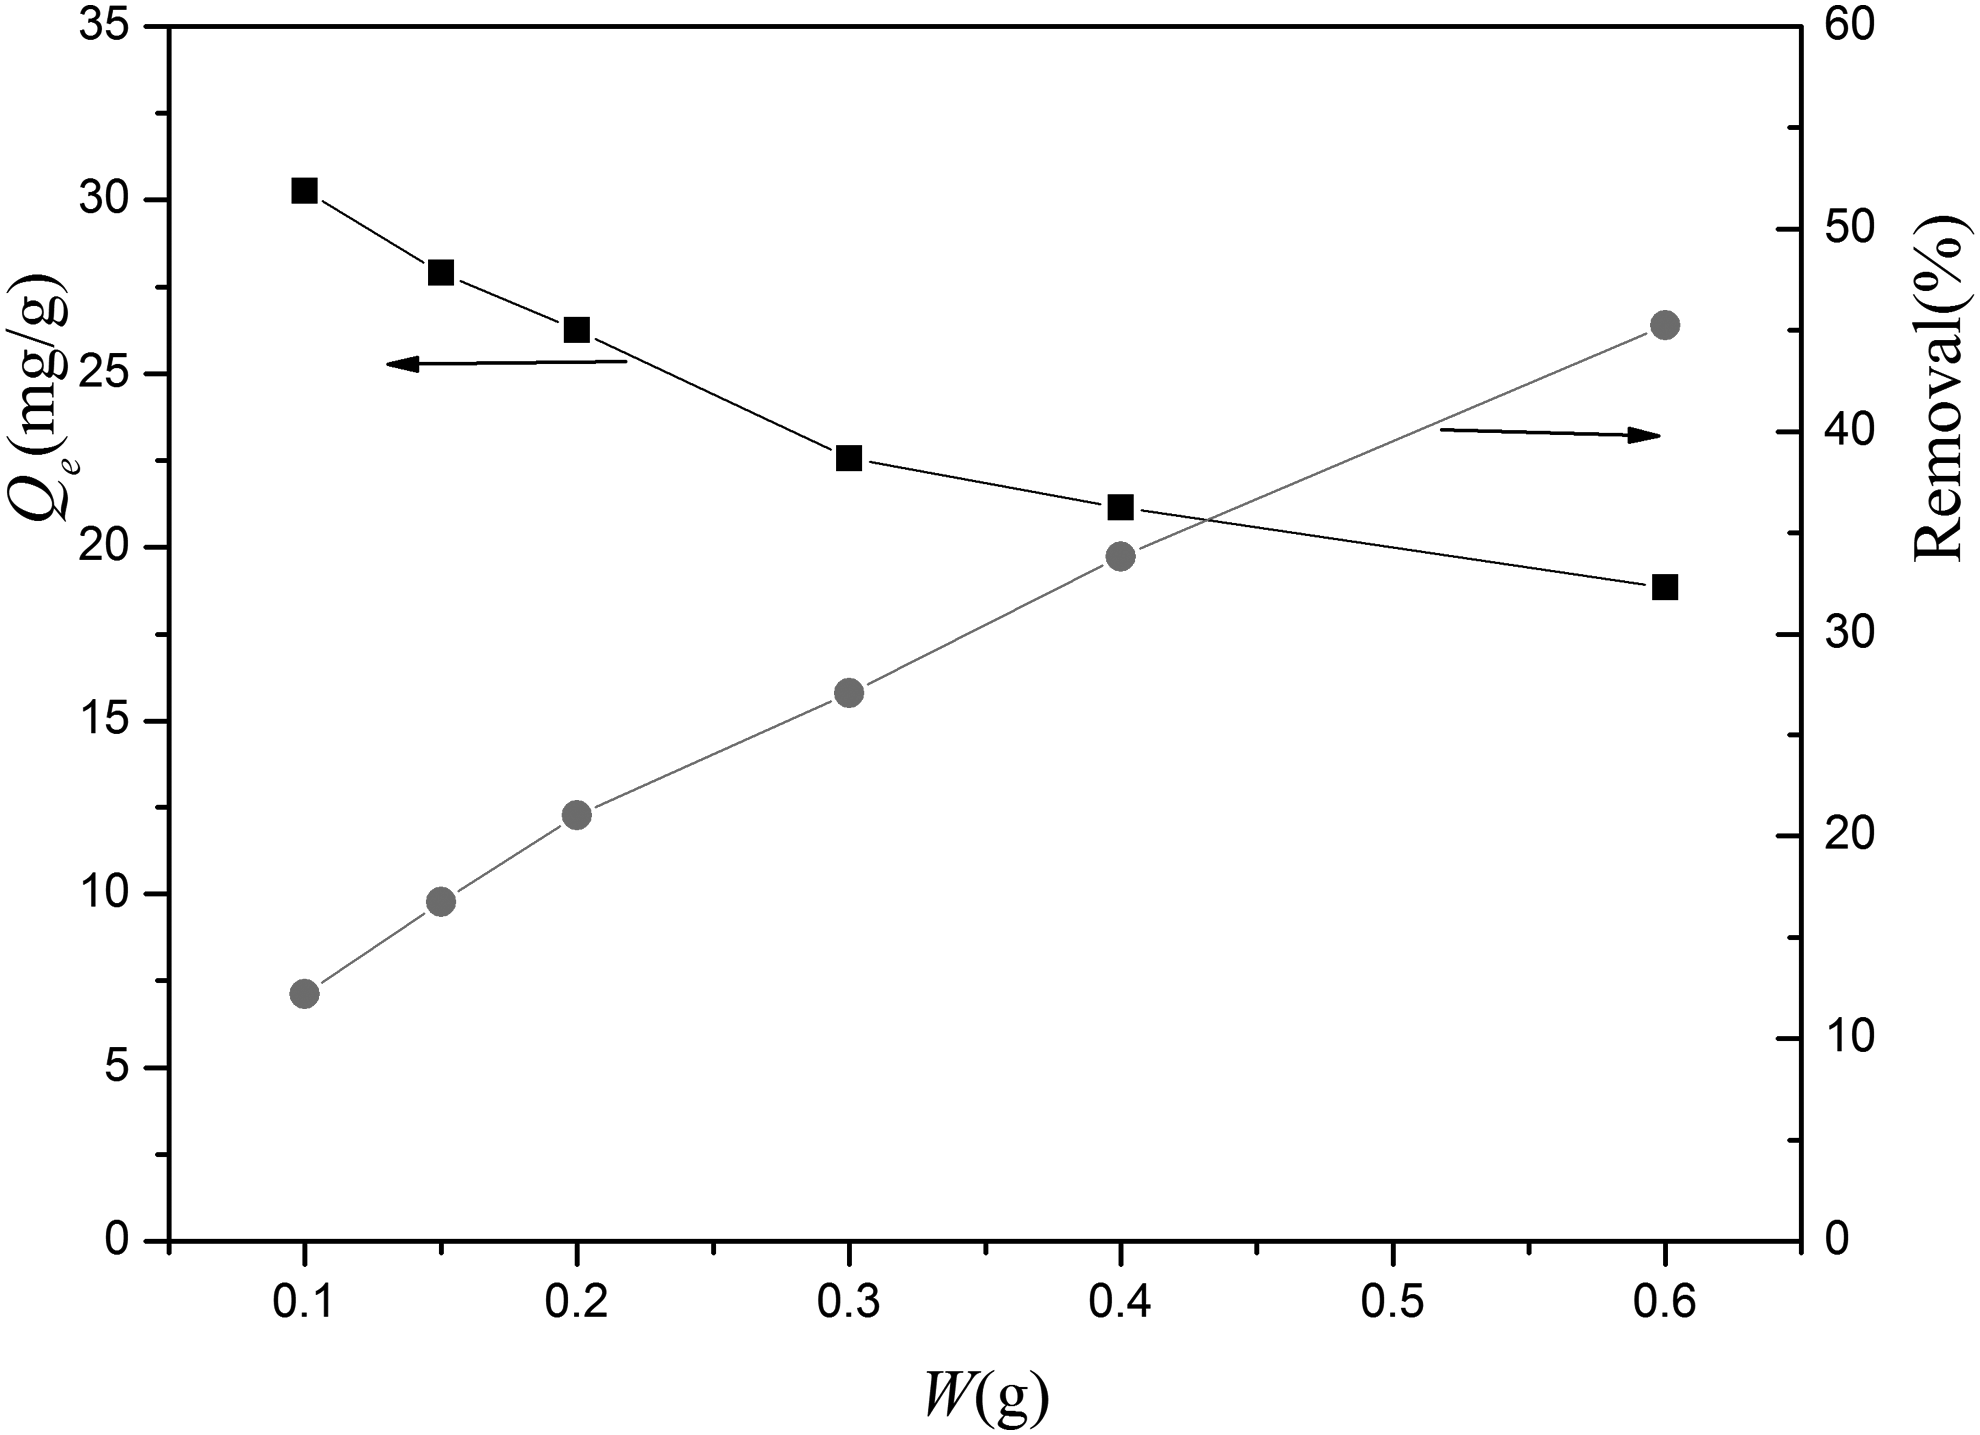
Effect of adsorbent dose on the adsorption capacity and the removal.
As the adsorbent dose was increased from 0.1 to 0.6 g, the equilibrium adsorption capacity decreased from 30.3 to 18.9 mg/g; meanwhile, the phenol removal efficiency increased from 12.2% to 45.2%. The increased percentage of phenol removal, with increasing MSE-resin dose, can be due to the increase of available adsorption active sites (Nematollahzadeh et al., 2015). However, the decreased equilibrium adsorption capacity of MSE-resin for phenol can be explained as a high amount of dose that leads to aggregation of adsorbent particles within a limited volume scale, which results in the total surface area being decreased and, meanwhile, the diffusion path length is increased (Olu-Owolabi et al., 2012).
Effect of contact time and initial concentration
Effect of contact time on the phenol uptake on MSE-resin at various initial concentrations (500–2,000 mg/L) is depicted in Fig. 10. It was found that the rate of phenol uptake was rapid within the first 25 min, then became slight, and at last kept constant after 180 min. During the beginning stage of adsorption, a large number of vacant adsorption active sites are available for phenol molecules to fill up rapidly. And with time, the vacant adsorption active sites retained are increasingly difficult to be occupied because of the repulsive forces between solute molecules (Huang et al., 2008c). After the saturation is reached on the exterior surface of the adsorbent, the slower migration of phenol molecules into the inner of the resin is subsequently followed. After all of these steps are finished, the adsorption process reaches to the equilibrium (Tan et al., 2009).
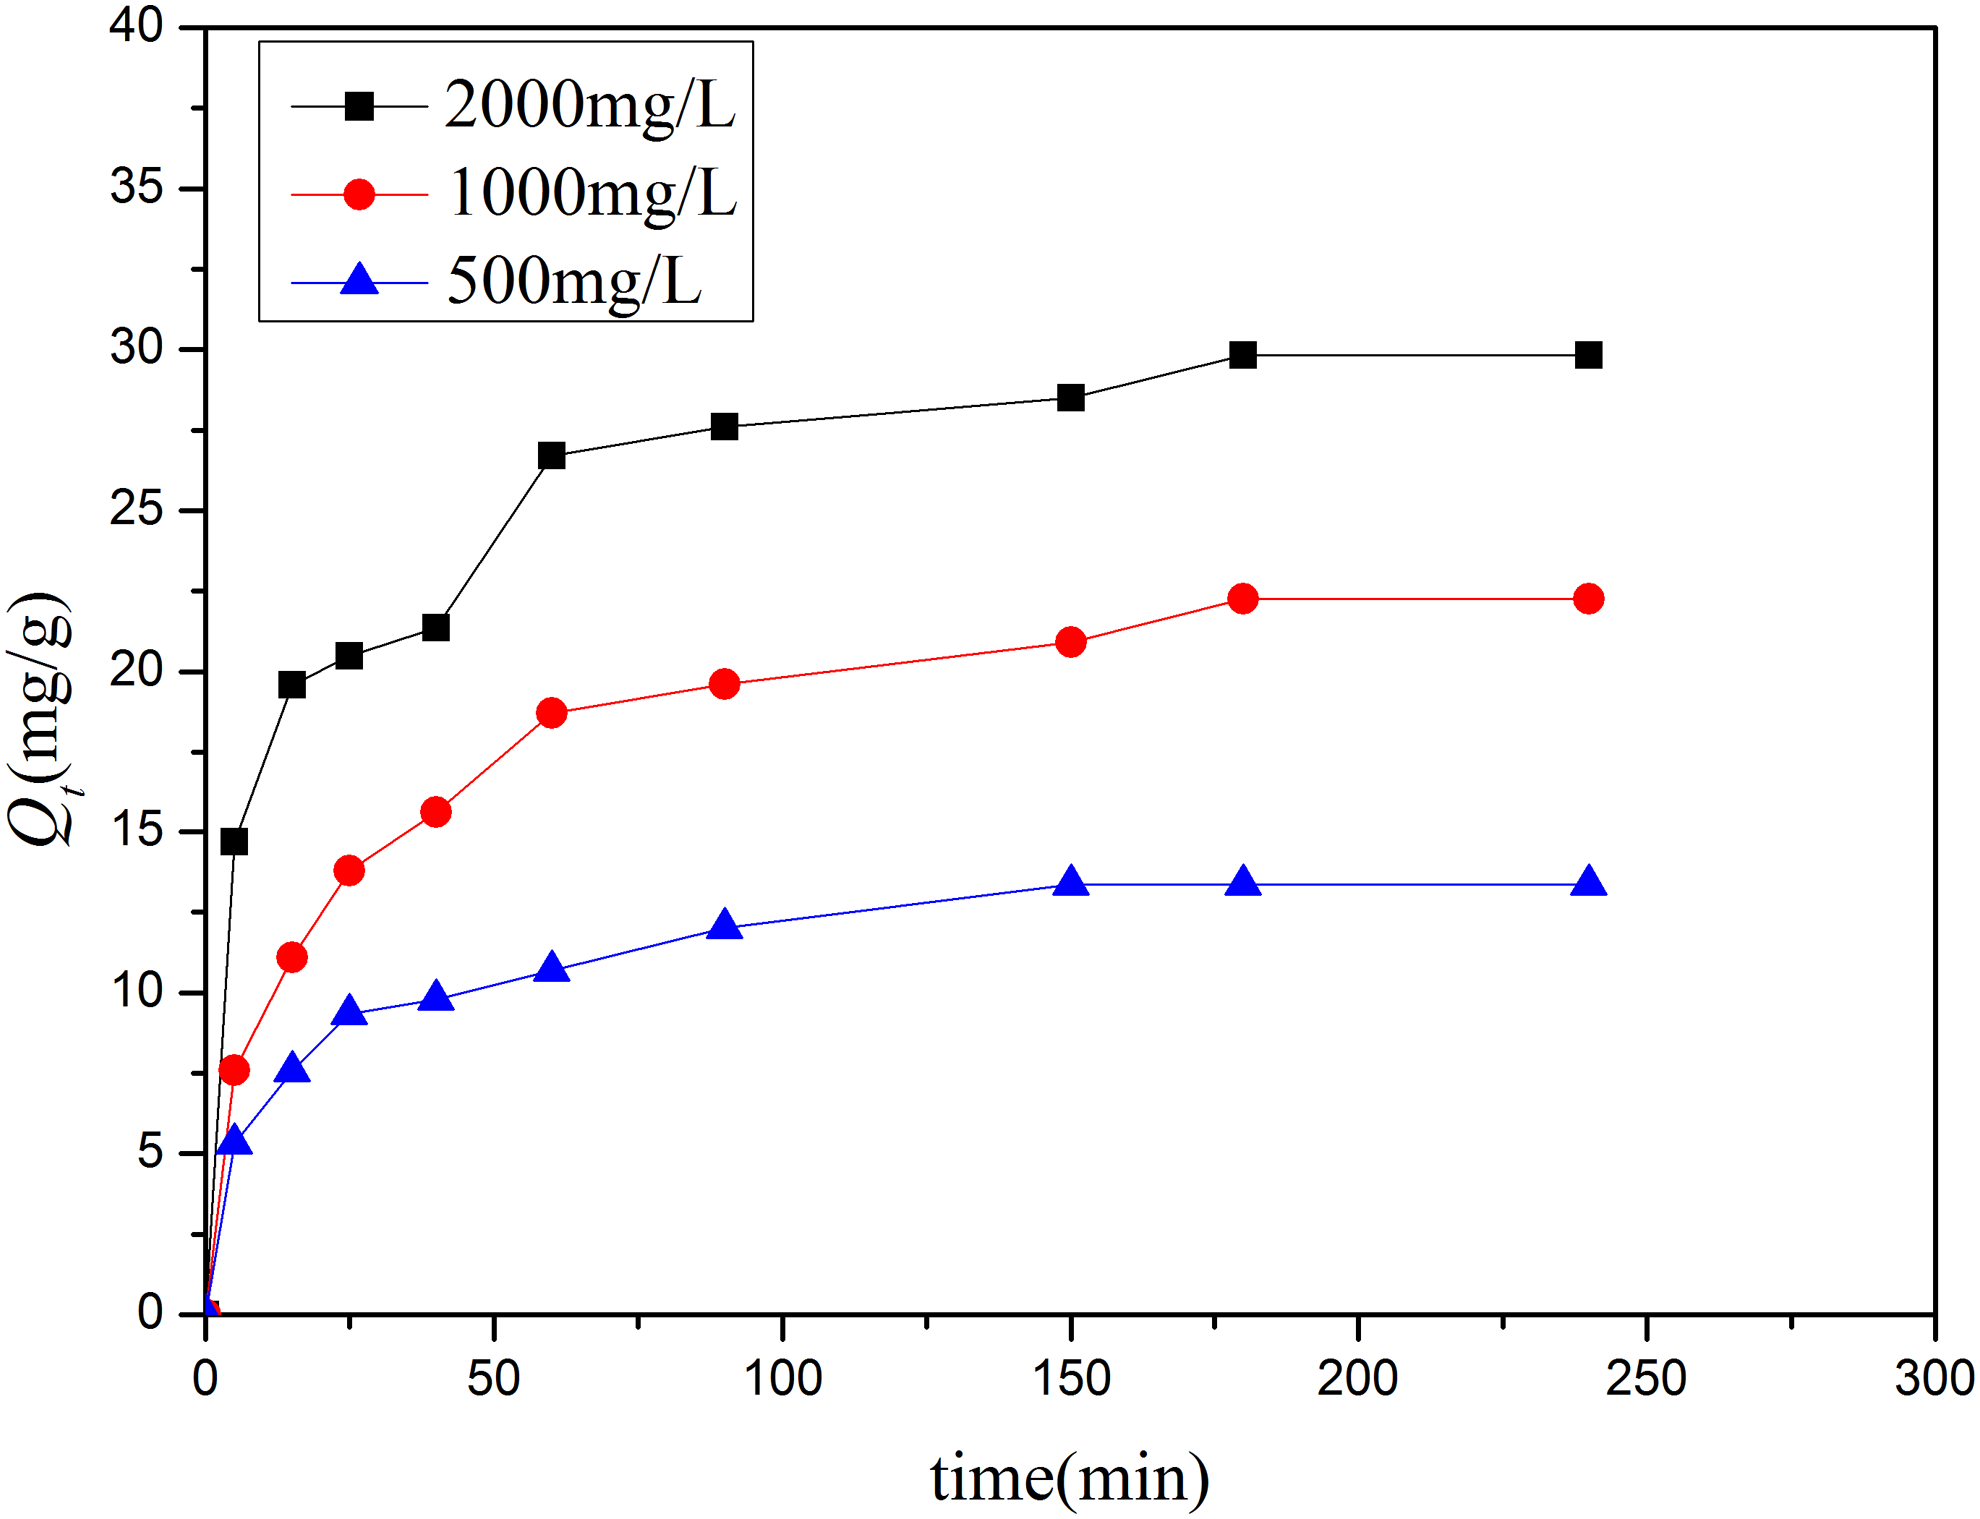
Effect of contact time and initial concentration on the adsorption of phenol.
It was also found that increasing the initial phenol concentrations resulted in the phenol uptake increasing. The different phenol uptakes may be explained in terms of the concentration distribution of phenol. Under the higher concentration, more phenol molecules can effectively contact with the available adsorption active sites of the adsorbent. Hence, the relative high initial concentration is beneficial to the phenol uptakes.
Adsorption kinetics
To investigate the adsorption mechanism, the pseudofirst-order adsorption, the pseudosecond-order adsorption, and the intraparticle diffusion models are used to fit the kinetic experimental data.
The pseudofirst-order kinetic model has been widely used to predict phenol adsorption kinetics (Al-Muhtaseb et al., 2011):
where Qt is the amount of adsorbed phenol (mg/g) on MSE-resin at contact time t; Qe is the maximum absorption capacity (mg/g); k1 is the pseudofirst-order rate constant for the adsorption process (min−1).
The slope and intercept of each linear region in Fig. 11 are used to calculate the firstorder rate constant (k1) and Qe/cal listed in Table 2.
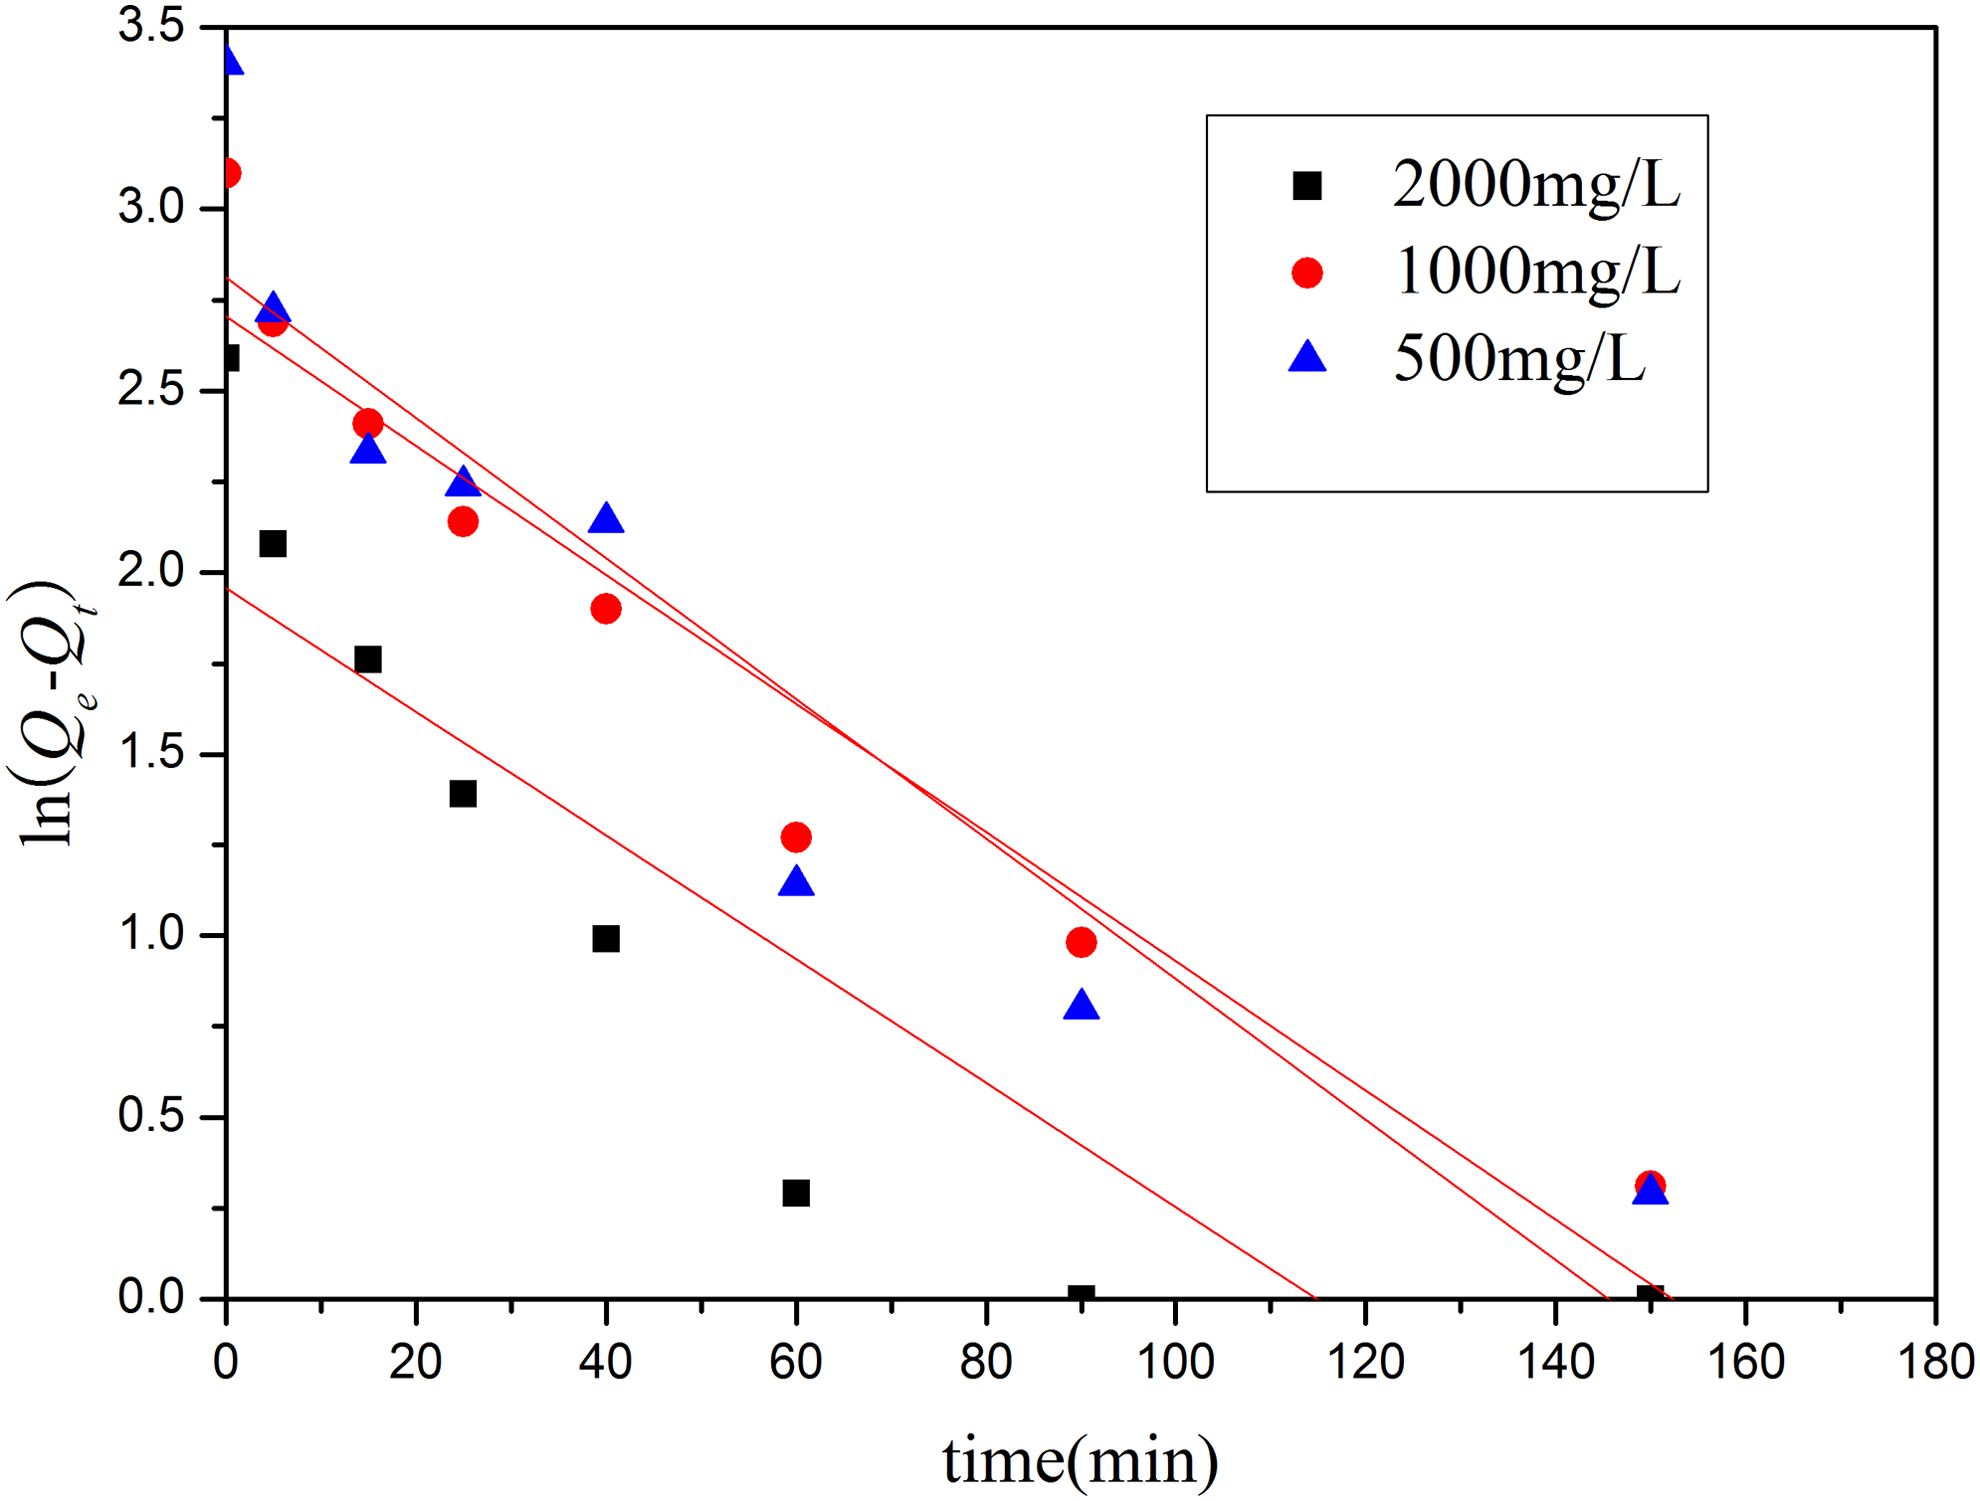
Fitting of pseudofirst-order model.
Qe/exp is the experimental Qe and Qe/cal is the corresponding calculated Qe, according to the equation under study with best-fitted parameters.
The adsorption kinetics can be also described by the pseudosecond-order model equation (Al-Muhtaseb et al., 2011):
where k2 is the pseudosecond-order model rate constant (g/mg · min).
Figure 12 shows the curves obtained from the experimental data (t/Qt) versus t. The corresponding rate constants (k2) and Qe/cal were also calculated and are listed in Table 2.
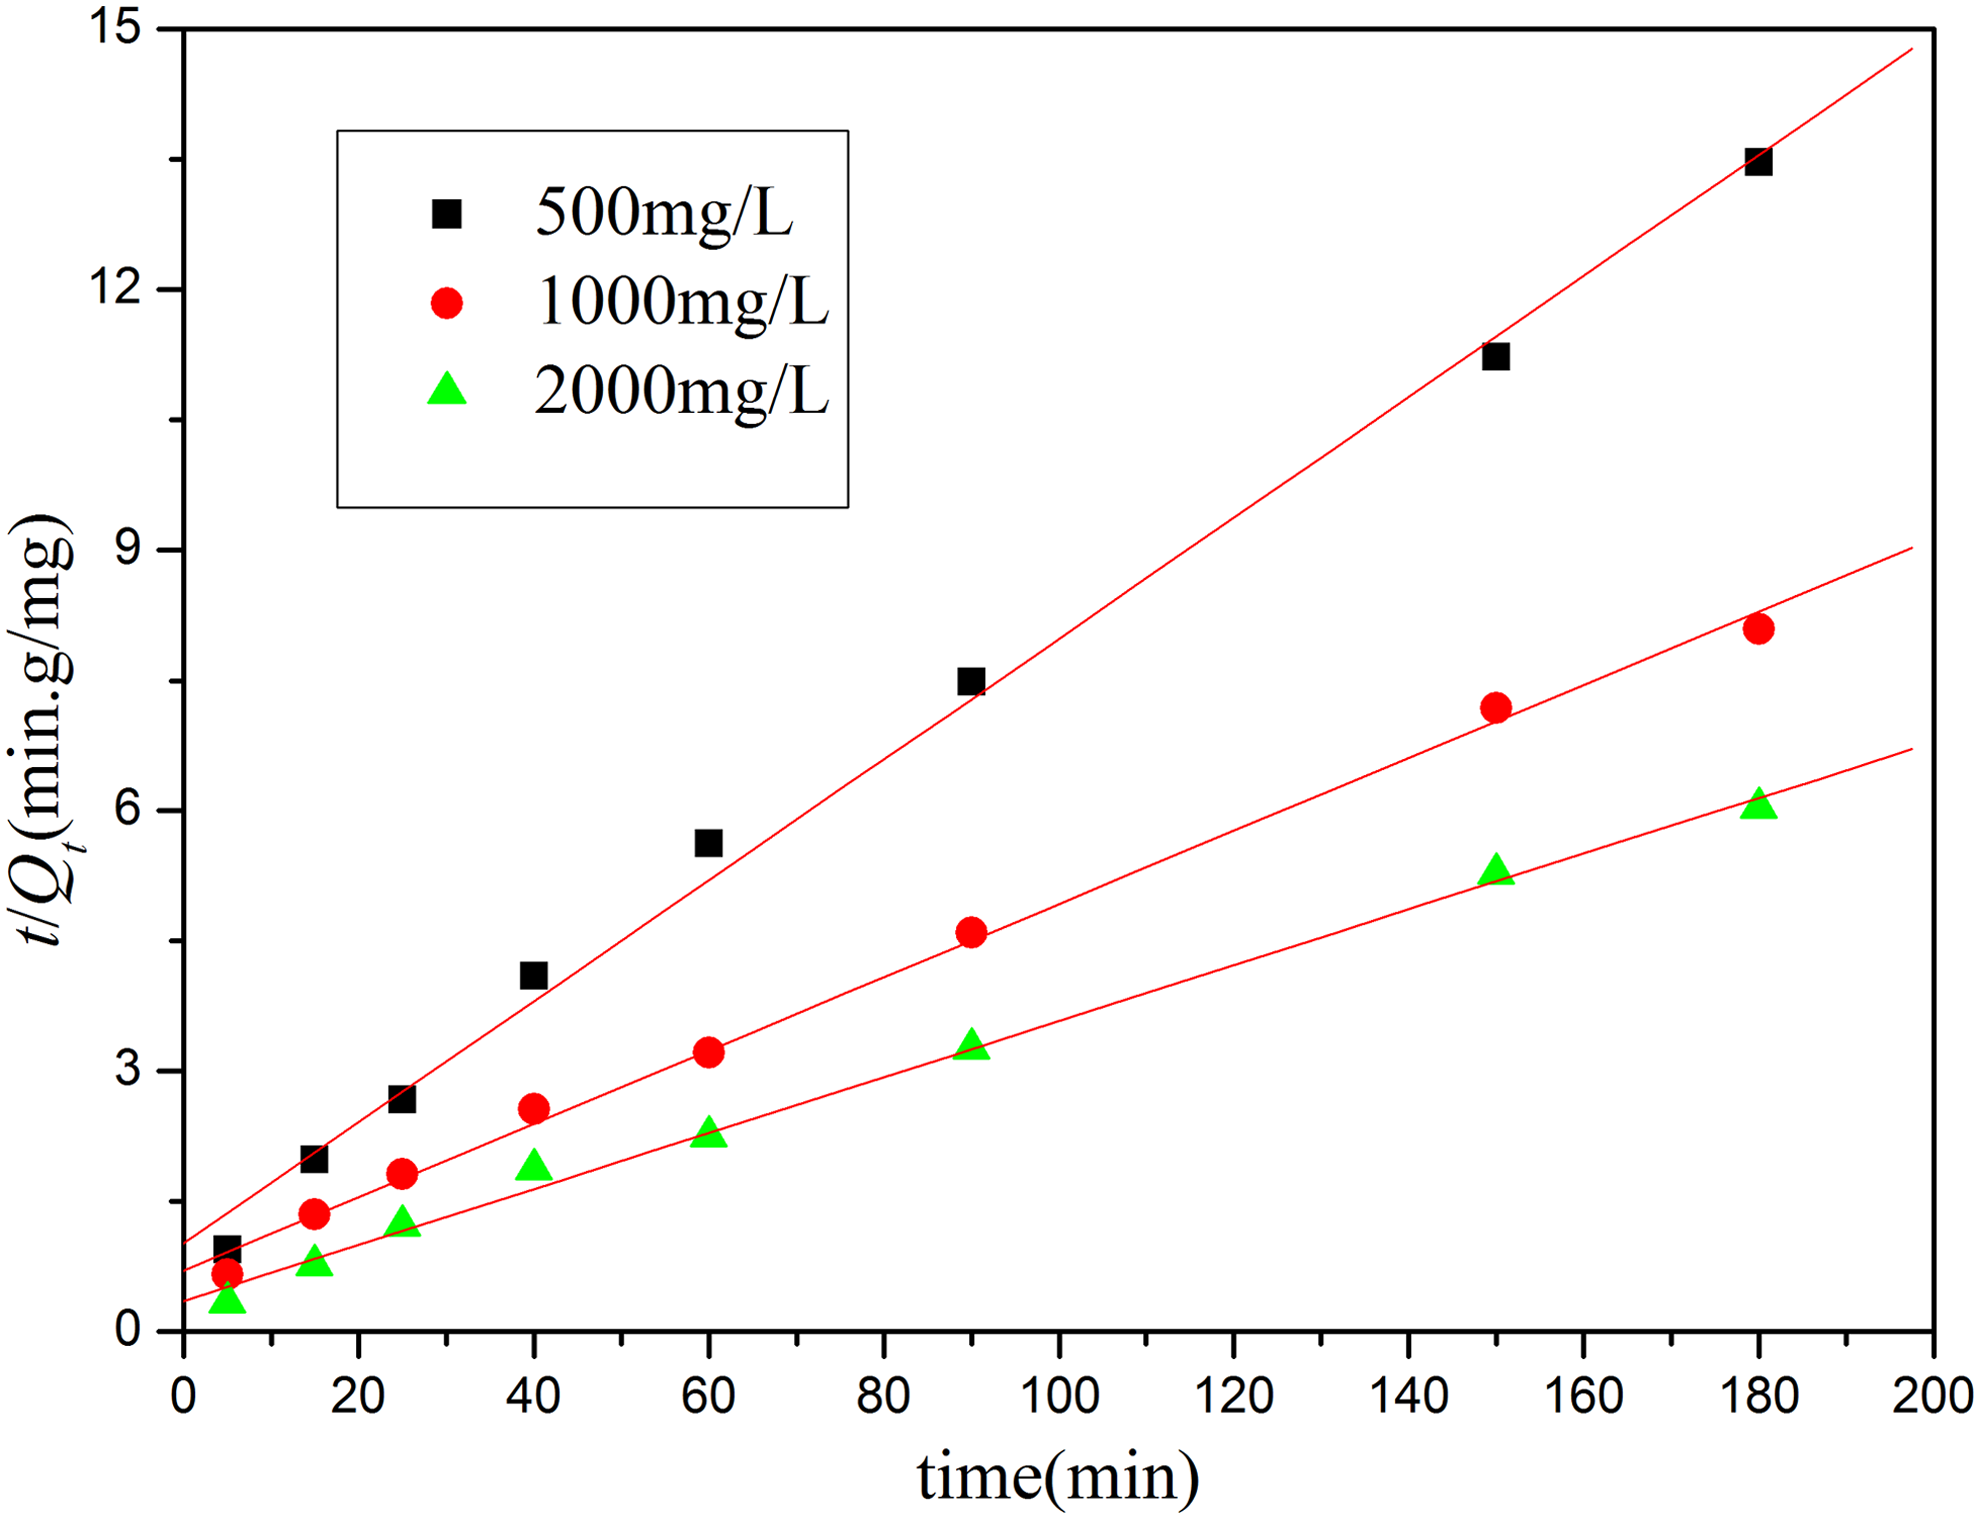
Fitting of pseudosecond-order model.
According to Table 2, the correlation coefficient R2 in the pseudosecond-order model was very close to 1.0. In addition, the calculated values Qe were also in agreement with the experimental values Qe in the pseudosecond-order model. Hence, these results indicated the satisfactory applicability of the pseudosecond-order model in predicting the kinetics of phenol adsorption on the MSE-resin.
Usually, the whole adsorption process, the adsorbate transported from the solution phase to the surface of the adsorbent particles, occurs in several steps (Roice et al., 2003). The overall adsorption process may be controlled by any one of the several steps, film or external diffusion, pore diffusion, surface diffusion and adsorption on the pore surface, or a combination of several steps (Sribastava et al., 2006). Since the above kinetic models cannot identify the diffusion mechanism, and the rate-controlling step affected the adsorption kinetics, the mechanism of phenol adsorption needs to be further investigated. Therefore, the kinetic experimental data were further analyzed by the intraparticle diffusion model (Sribastava et al., 2006). It is expressed as follows:
where kd is the intraparticle diffusion rate (mg/g · min1/2), and c is a constant. The kd and c were obtained by plotting Qt versus t1/2.
Values of kd, c, and R32 were calculated from the plots in Fig. 13 and given along with the correlation factors in Table 3. According to this model, if intraparticle diffusion is the rate-limiting step, then Qt versus t1/2 is linear, and the corresponding data must pass through the origin (intercept = 0). However, if the plots are linear, but do not pass through the origin, the rate of adsorption may be controlled by intraparticle diffusion together with other kinetic effects (Yin et al., 2010). As can be seen from Fig. 13, the line does not pass through the origin. This indicates that intraparticle diffusion is involved in the adsorption process, but it is not the only rate-limiting step. Other mechanisms are involved.
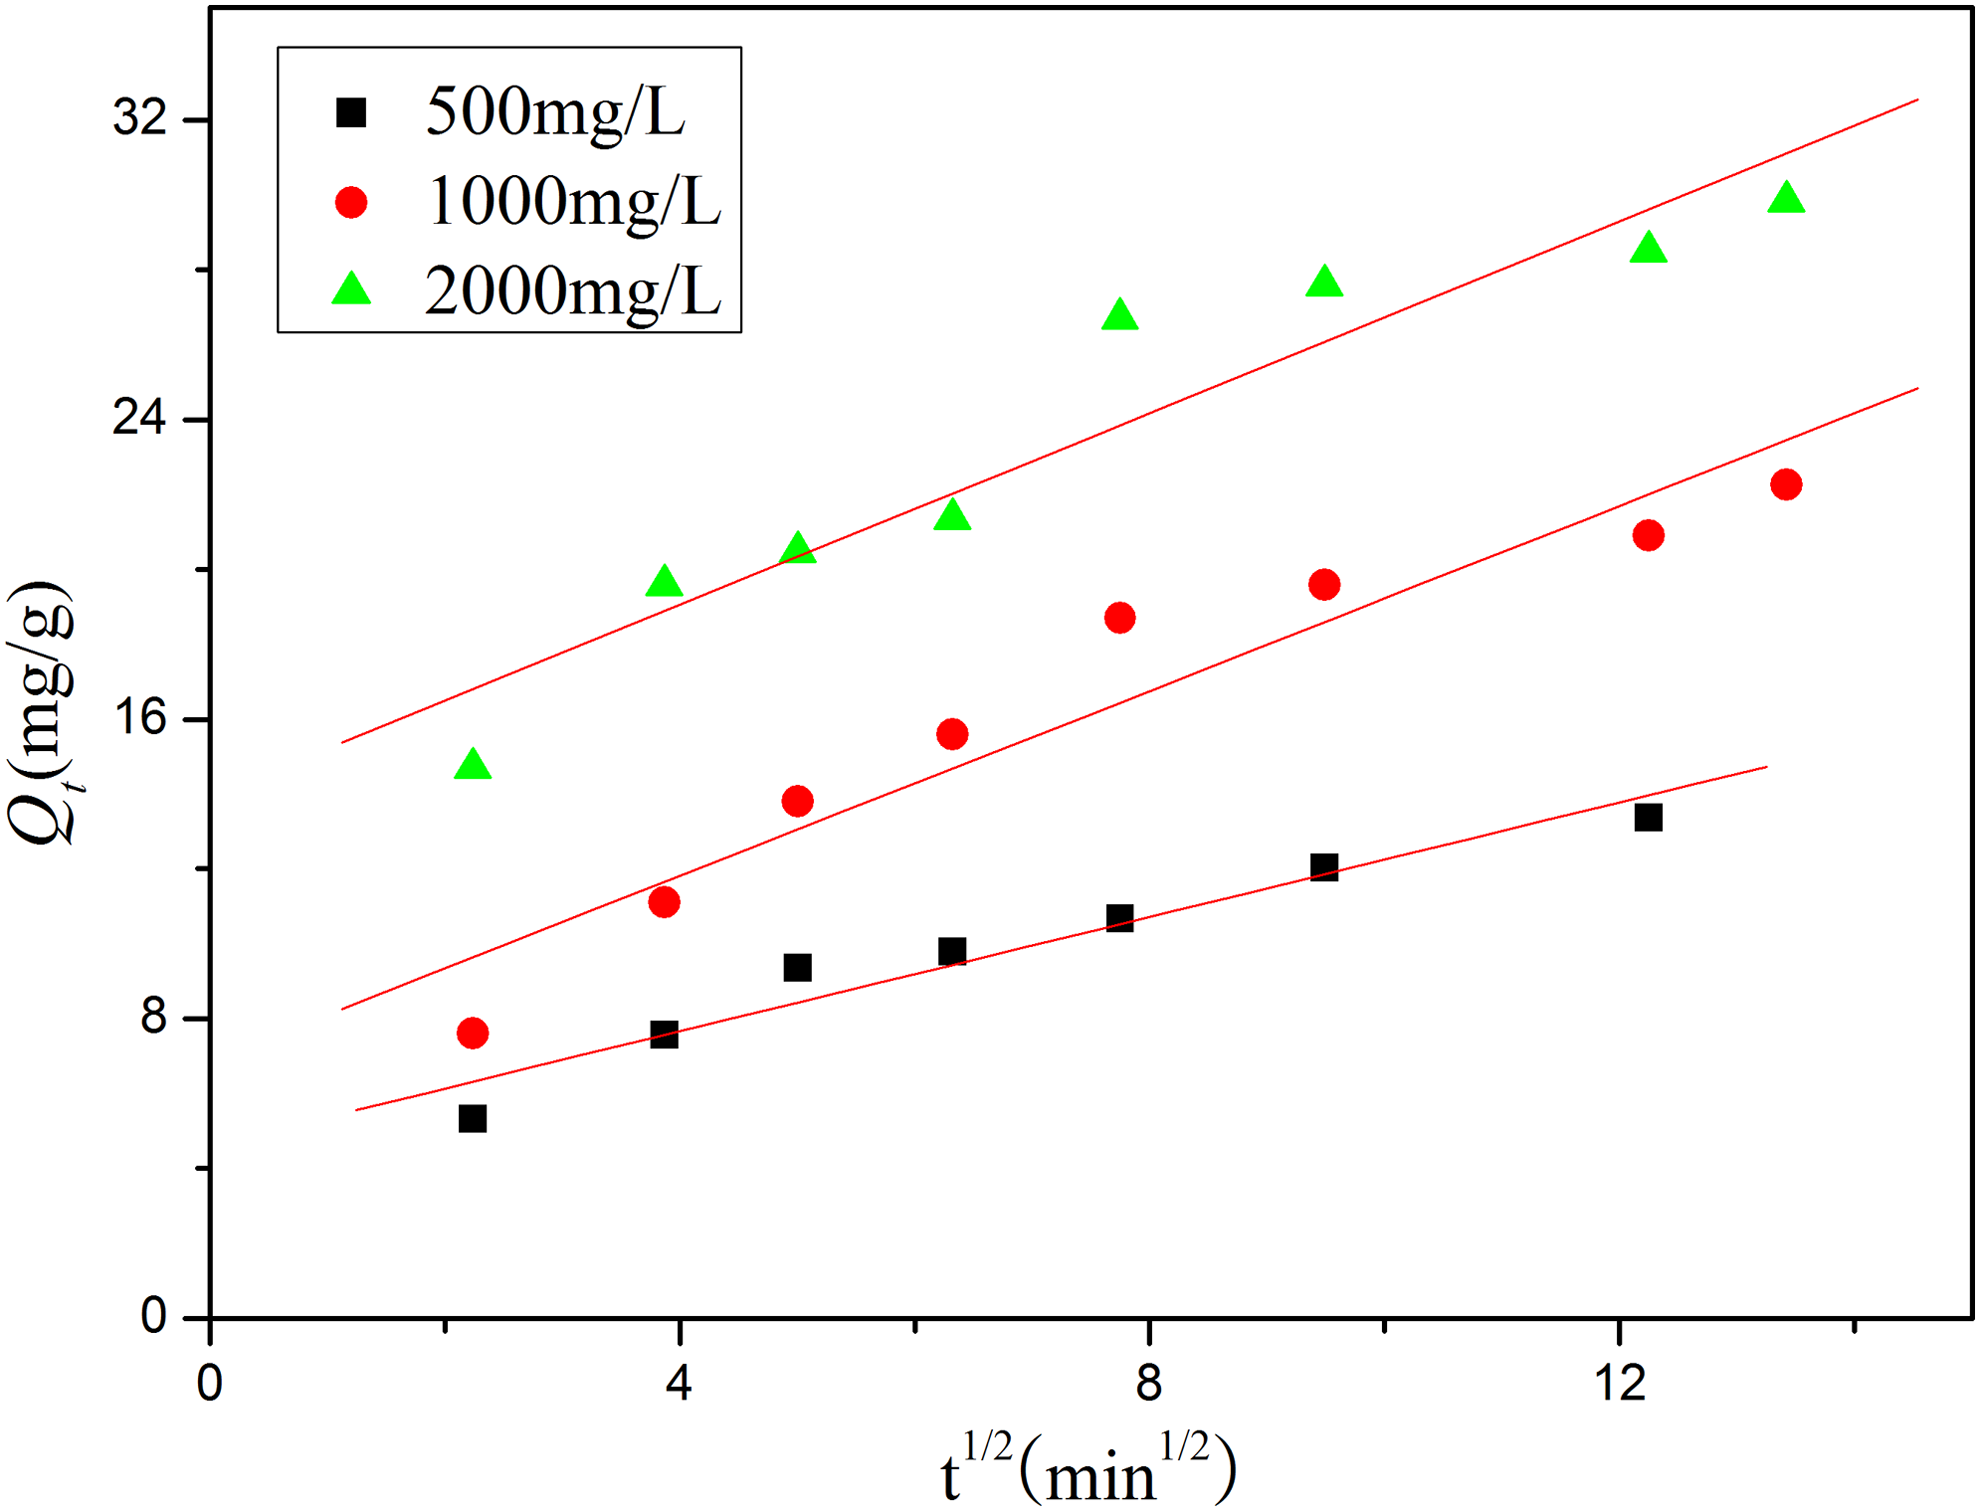
Fitting of intraparticle diffusion model.
Adsorption isotherms
Figure 14 presents the equilibrium adsorption isotherms of phenol from the aqueous solution on MSE-resin at three different temperatures (283, 298, and 313 K). The adsorption capacity of phenol on MSE-resin increases with the temperature, which suggests a favorable adsorption at higher temperature (Ma et al., 2014). However, knowing that the phenol uptakes conformed to a monolayer or multilayer adsorption process is necessary.

Adsorption isotherms of phenol on MSE-resin.
The Langmuir and Freundlich adsorption isotherm equations are the most frequently used for analyzing the experimental sorption equilibrium data (Huang et al., 2011).
The linear form of the Langmuir and Freundlich equations are represented as follows (Pan et al., 2008):
where Ce is the residual phenol concentration at equilibrium (mg/L); Qe is the equilibrium absorption capacity (mg/g); Qm is the theoretical monolayer capacity (mg/g); and KL is a Langmuir constant, which relates to the adsorption energy (L/g). In the Freundlich equation, the parameter KF ([mg/g][mg/L]1/n) reflects the adsorption capacity, and 1/n is the adsorption character.
These constants that can be evaluated from the intercept and the slope of the linear plots of the experimental data of Ce/Qe versus Ce and lnQe versus lnCe, respectively, are presented in Table 4. It is clear that the equilibrium data are better fitted to the Freundlich isotherm than the Langmuir isotherm from the relative R2 values. The Freundlich constants, KF values considered as a measure of the adsorption capacity, are ranged from 0.287 to 0.371 with temperature increasing. Also, the n values ranged from 1.414 to 1.548, implying that the studied adsorption isotherms can be considered nonlinear because the n values were in general outside the 0.95 < n < 1.05 range, established by Pignatello et al. (2006), as suitable for an isotherm to be considered linear. Besides, the values of n in the Freundlich isotherm model are over 1.0, which demonstrate a favorable adsorption (Qiu et al., 2014). The values of KF and n increase with the temperature (Table 4), which is consistent with the fact that the higher temperature is favorable for the adsorption. Thus, the phenol uptakes on MSE-resin at various temperatures follow a multilayer adsorption process. It can be explained that the porous structure and the relative smaller surface area of MSE-resin can provide available adsorption active sites for phenol removal. In contrast, the two driving forces between phenol molecules and MSE-resin played a key role in the process of adsorption (hydroxyl binding and van der Waals force mentioned when discussing the effect of pH).
Adsorption thermodynamics
To better illuminate the adsorption mechanism of phenol on MSE-resin, the adsorption thermodynamics parameters ΔH, ΔG, and ΔS were evaluated. The isosteric adsorption enthalpy change (ΔH) can be calculated with a derivative of the Van't Hoff equation (Liu et al., 2008):
where Ce is the equilibrium concentration of phenol (mg/L); T is the adsorption temperature (K); R is the ideal gas constant; and K is a constant. From Equation (9), ΔH can be conveniently figured out from the slope of the straight line of the lnCe versus 1/T (Fig. 15).

Thermodynamics plots of adsorption.
Adsorption Gibbs free energy ΔG (kJ/mol) can be calculated (Liu et al., 2008):
where n is the characteristic constant in the Freundlich isotherm; R is the ideal gas constant; and T is the adsorption temperature (K).
Adsorption entropy ΔS (J/mol · K) can be calculated using the Gibbs–Helmholtz equation (Liu et al., 2008):
The values of ΔH, ΔG, and ΔS for the adsorption of phenol on MSE-resin at different temperatures are presented in Table 5. According to these calculated results, the positive values of ΔH are <40 kJ/mol, which indicates a physical and endothermic adsorption process (Yuan et al., 2008). It can be explained as that the diffusion speed of phenol increases with the temperature, which makes the phenol molecules pass through the pore of the MSE-resin easily. Besides, owing to the interactions of hydroxyl bindings between the phenol molecules and water molecules, these adsorbed phenol molecules need to be desorbed before adsorption, which is endothermic. At the same time, the MSE-resin containing oxygen itself can form hydroxyl bindings with water molecules. Some adsorption active sites of the MSE-resin are occupied by water molecules. As a result, the water molecules must be desorbed from the MSE-resin, which is also an endothermic process. Although the adsorption of phenol on the adsorbent is exothermic, it does not compensate the first two conditions. Therefore, it concludes that the phenol uptakes on MSE-resin are an endothermic process. Moreover, adsorption of phenol on MSE-resin is spontaneous as indicated by the negative ΔG values. The positive values of ΔS reflect that the randomness of the solid–solution interface is increased during the sorption of phenol on MSE-resin (Zeng et al., 2011).
Conclusions
In this work, the hydrophilic MSE-resin has been successfully prepared through suspension polymerization and used as a new adsorbent for the adsorption of phenol from the aqueous solution. The maximum adsorption capacity was achieved when pH was 5, the contact time 180 min, the adsorbent dose 0.2 g, the initial concentration 2,000 mg/L, and the temperature 313 K. The adsorption kinetics followed the pseudosecond-order model. The intraparticle diffusion was a rate-limiting step, but not the only one. Adsorption isotherm was well represented by the Freundlich model. Thermodynamic research indicated that the adsorption was an endothermic and spontaneous process. The adsorption results showed that the obtained polymeric resin was a potential adsorbent for the phenol removal from the aqueous solution.
Footnotes
Acknowledgments
The authors gratefully acknowledge the financial support from the Specialized Research Fund for the Doctoral Program of Higher Education of China (20115121120005) and the Innovative Research Team of Sichuan Provincial Education Department.
Author Disclosure Statement
No competing financial interests exist.