Amicarbazone (AMZ) is an extensively used, broad-spectrum triazolinone herbicide. The literature is scarce regarding experimental data on AMZ photodegradation, whose fate in natural waters has not yet been investigated in detail. By combining laboratory experiments using isolated natural organic matter, literature data, and mathematical simulations, we investigated the sunlight-driven direct and indirect degradation of AMZ. We show that the reaction with hydroxyl radicals (\documentclass{aastex}\usepackage{amsbsy}\usepackage{amsfonts}\usepackage{amssymb}\usepackage{bm}\usepackage{mathrsfs}\usepackage{pifont}\usepackage{stmaryrd}\usepackage{textcomp}\usepackage{portland, xspace}\usepackage{amsmath, amsxtra}\pagestyle{empty}\DeclareMathSizes{10}{9}{7}{6}\begin{document}
$$^\bullet{\rm OH}$$
\end{document}) is the main pathway leading to AMZ degradation, with measured second-order reaction rate constant (kAMZ, OH) equal to 2.05×10¹⁰ L/mol·s. Simulations suggest that amicarbazone degradation is favored in shallow water bodies containing low dissolved organic carbon (DOC) and bicarbonate/carbonate concentrations, with herbicide half-life varying from about less than 1 day to more than 2 months. These values of t1/2 are upper limits since the reaction with 3CDOM* was not considered. Finally, the cross-effects of water depth/[DOC] are slightly influenced by nitrate/nitrite and bicarbonate/carbonate concentrations, depending on the pH range.
Introduction
One of the main areas of interest in environmental engineering is devoted to understand processes that impact the fate and transport of organic contaminants in the environment. Particular emphasis has been placed on the occurrence of persistent organic pollutants (POPs), which include pharmaceuticals, personal care products, and especially pesticides (Orlando, 2013; Richardson and Ternes, 2014). These compounds have received significant attention due their demonstrated ecological (Vajda et al., 2008) and perceived human health effects (Stanford et al., 2010).
The triazolinone herbicide amicarbazone (AMZ) (Fig. 1), introduced in Brazil in 2004, is used extensively to control a broad spectrum of weeds that compete with sugar cane and corn cultivation (Possamai et al., 2013), usually at an application rate up to 1,500 g/ha (Kramer et al., 2012). AMZ has high solubility in water (4.6 g/L at pH 4–9), low vapor pressure (9.7×10⁻⁹ mm Hg at 30°C), and may impact aqueous systems (Possamai et al., 2013; Peixoto and Teixeira, 2014).
Molecular structure of amicarbazone.
The persistence of POPs in surface waters depends on abiotic and biological processes. Abiotic transformations, such as photoinduced processes, can represent major removal pathways, especially for pollutants refractory to biological degradation (Vione et al., 2010a). The mechanisms of photoinduced degradation processes involve direct photolysis and indirect photodegradation, the latter referring to the degradation of a compound with the aid of photochemically generated transients (Laurentiis et al., 2012). Important indirect photochemical pathways involve reactive oxygen species (ROS) such as singlet oxygen (1O2) and hydroxyl radicals (\documentclass{aastex}\usepackage{amsbsy}\usepackage{amsfonts}\usepackage{amssymb}\usepackage{bm}\usepackage{mathrsfs}\usepackage{pifont}\usepackage{stmaryrd}\usepackage{textcomp}\usepackage{portland, xspace}\usepackage{amsmath, amsxtra}\pagestyle{empty}\DeclareMathSizes{10}{9}{7}{6}\begin{document}
$$^\bullet{\rm OH}$$
\end{document}). Singlet oxygen can be generated by energy transfer between ground-state molecular oxygen (3O2) and the triplet states of chromophoric dissolved organic matter (3CDOM*) (Passananti et al., 2014). The main \documentclass{aastex}\usepackage{amsbsy}\usepackage{amsfonts}\usepackage{amssymb}\usepackage{bm}\usepackage{mathrsfs}\usepackage{pifont}\usepackage{stmaryrd}\usepackage{textcomp}\usepackage{portland, xspace}\usepackage{amsmath, amsxtra}\pagestyle{empty}\DeclareMathSizes{10}{9}{7}{6}\begin{document}
$$^\bullet{\rm OH}$$
\end{document} radical sources in surface waters upon irradiation are compounds such as nitrite, nitrate, and CDOM, although scavenging by dissolved organic matter limits \documentclass{aastex}\usepackage{amsbsy}\usepackage{amsfonts}\usepackage{amssymb}\usepackage{bm}\usepackage{mathrsfs}\usepackage{pifont}\usepackage{stmaryrd}\usepackage{textcomp}\usepackage{portland, xspace}\usepackage{amsmath, amsxtra}\pagestyle{empty}\DeclareMathSizes{10}{9}{7}{6}\begin{document}
$$^\bullet{\rm OH}$$
\end{document} steady-state concentrations to around 10−17 to 10−15 mol/L (Larson and Zepp, 1988; Vione et al., 2006; Passananti et al., 2014). At least two general pathways to \documentclass{aastex}\usepackage{amsbsy}\usepackage{amsfonts}\usepackage{amssymb}\usepackage{bm}\usepackage{mathrsfs}\usepackage{pifont}\usepackage{stmaryrd}\usepackage{textcomp}\usepackage{portland, xspace}\usepackage{amsmath, amsxtra}\pagestyle{empty}\DeclareMathSizes{10}{9}{7}{6}\begin{document}
$$^\bullet{\rm OH}$$
\end{document} radical have been suggested: an H2O2-dependent and H2O2-independent pathway (Page et al., 2011; Vione et al., 2014). In addition, there is evidence that both free \documentclass{aastex}\usepackage{amsbsy}\usepackage{amsfonts}\usepackage{amssymb}\usepackage{bm}\usepackage{mathrsfs}\usepackage{pifont}\usepackage{stmaryrd}\usepackage{textcomp}\usepackage{portland, xspace}\usepackage{amsmath, amsxtra}\pagestyle{empty}\DeclareMathSizes{10}{9}{7}{6}\begin{document}
$$^\bullet{\rm OH}$$
\end{document} as well as a so-called lower-energy hydroxylating species are produced. Also, the H2O2-independent pathway is often portrayed as a 3CDOM* or a low-energy hydroxylating species abstracting hydrogen from water (Page et al., 2011). 3CDOM* steady-state concentrations are estimated to be on the order of 10−16 mol/L and have been shown to degrade certain classes of contaminants, including pesticides (Zeng and Arnold, 2013).
Experimental data on amicarbazone photodegradation are scarce in the literature and virtually no published information exists regarding the fate of the herbicide in natural waters. In the present study, kinetic rate constants of AMZ degradation by ROS (\documentclass{aastex}\usepackage{amsbsy}\usepackage{amsfonts}\usepackage{amssymb}\usepackage{bm}\usepackage{mathrsfs}\usepackage{pifont}\usepackage{stmaryrd}\usepackage{textcomp}\usepackage{portland, xspace}\usepackage{amsmath, amsxtra}\pagestyle{empty}\DeclareMathSizes{10}{9}{7}{6}\begin{document}
$$^\bullet{\rm OH}$$
\end{document} and 1O2) are reported for the first time. Additionally, the sunlight-driven direct and indirect AMZ degradation in the presence of isolated natural organic matter (NOM) was investigated, with the purpose of understanding the photochemical behavior of AMZ in aqueous systems. Finally, we discussed the conditions that favor or hamper AMZ photodegradation in natural water bodies based on these results and simulations using a mathematical model.
Experimental Protocols
Chemicals
All solutions were prepared using ultrapure water (Milli-Q). Technical-grade amicarbazone (AMZ) (4-amino-N-tert-butyl-4, 5-dihydro-3-isopropyl-5-oxo-1H-1, 2, 4-triazol-1-carboxamide, C10H19N5O2, CAS 129909-90-6) of minimum purity 95.4% was supplied by Arysta LifeScience Corp. and used as a standard in liquid chromatography (HPLC) analysis and in photochemical experiments. Suwannee River Natural Organic Matter (SRNOM) was obtained from the International Humic Substances Society (Catalog No. 1R101N); after dissolving SRNOM in water, the stock solution was diluted to a final concentration of 10 mg/L in a phosphate buffer solution (10 mmol/L, pH 7.2). Hydrogen peroxide, methylene blue, and bovine catalase (Sigma Aldrich); benzene (Sigma Aldrich); phenol (Sigma Aldrich); furfuryl alcohol (FFA) (TCI America); para-chlorobenzoic acid (pCBA) (ICN Biomedicals, Inc.); and sodium nitrate and sodium phosphate (Fisher Scientific) were all of reagent-grade purity. For HPLC analysis, acetonitrile (HPLC quality), methanol (HPLC quality), and phosphoric acid (100%) were purchased from Honeywell.
Solar simulator system
All experiments were performed using a Model 94041 Oriel solar simulator equipped with a 1,000 W lamp and air mass 1.5 global filter (Newport Corp.; Oriel Instruments), providing 68 W/m2 in the wavelength range 290–400 nm. During the experiments, samples were contained in 2-mL Pyrex vials with no headspace and exposed to light while in a water bath maintained at 20°C.
Experimental methods
Molar absorption coefficients
The molar absorption coefficient spectrum (ɛλ) of AMZ was measured using a Varian Cary 100 Bio Spectrophotometer (Agilent) according to a well-known procedure (Harris, 2003).
Quantification of \documentclass{aastex}\usepackage{amsbsy}\usepackage{amsfonts}\usepackage{amssymb}\usepackage{bm}\usepackage{mathrsfs}\usepackage{pifont}\usepackage{stmaryrd}\usepackage{textcomp}\usepackage{portland, xspace}\usepackage{amsmath, amsxtra}\pagestyle{empty}\DeclareMathSizes{10}{9}{7}{6}\begin{document}
$$^\bullet OH$$
\end{document} generation rate
The formation rate of \documentclass{aastex}\usepackage{amsbsy}\usepackage{amsfonts}\usepackage{amssymb}\usepackage{bm}\usepackage{mathrsfs}\usepackage{pifont}\usepackage{stmaryrd}\usepackage{textcomp}\usepackage{portland, xspace}\usepackage{amsmath, amsxtra}\pagestyle{empty}\DeclareMathSizes{10}{9}{7}{6}\begin{document}
$$^\bullet{\rm OH}$$
\end{document} radicals (Rf\documentclass{aastex}\usepackage{amsbsy}\usepackage{amsfonts}\usepackage{amssymb}\usepackage{bm}\usepackage{mathrsfs}\usepackage{pifont}\usepackage{stmaryrd}\usepackage{textcomp}\usepackage{portland, xspace}\usepackage{amsmath, amsxtra}\pagestyle{empty}\DeclareMathSizes{10}{9}{7}{6}\begin{document}
$$^\bullet{\rm OH}$$
\end{document}) from the irradiation of SRNOM by simulated solar light was determined using benzene to trap formed \documentclass{aastex}\usepackage{amsbsy}\usepackage{amsfonts}\usepackage{amssymb}\usepackage{bm}\usepackage{mathrsfs}\usepackage{pifont}\usepackage{stmaryrd}\usepackage{textcomp}\usepackage{portland, xspace}\usepackage{amsmath, amsxtra}\pagestyle{empty}\DeclareMathSizes{10}{9}{7}{6}\begin{document}
$$^\bullet{\rm OH}$$
\end{document} radicals through the formation of phenol through the Dorfman's reaction (Dorfman et al., 1962). Briefly, a 10-mg/L SRNOM solution was spiked with 3 mmol/L benzene and irradiated for 4 hours under the solar simulator, with samples collected every hour. To minimize the contribution of the undesired Fenton reaction to the formation of \documentclass{aastex}\usepackage{amsbsy}\usepackage{amsfonts}\usepackage{amssymb}\usepackage{bm}\usepackage{mathrsfs}\usepackage{pifont}\usepackage{stmaryrd}\usepackage{textcomp}\usepackage{portland, xspace}\usepackage{amsmath, amsxtra}\pagestyle{empty}\DeclareMathSizes{10}{9}{7}{6}\begin{document}
$$^\bullet{\rm OH}$$
\end{document}, catalase (20 units/mL) was added to each sample 30 minutes before irradiation to quench the H2O2 produced during the irradiation either through the photolysis of SRNOM or as a byproduct of the hydroxylation of benzene (Larson and Zepp, 1988). Rf•OH was calculated based on the rate of phenol production divided by the known reaction yield (0.63)—that is, \documentclass{aastex}\usepackage{amsbsy}\usepackage{amsfonts}\usepackage{amssymb}\usepackage{bm}\usepackage{mathrsfs}\usepackage{pifont}\usepackage{stmaryrd}\usepackage{textcomp}\usepackage{portland, xspace}\usepackage{amsmath, amsxtra}\pagestyle{empty}\DeclareMathSizes{10}{9}{7}{6}\begin{document}
$$R_ { OH } ^f = 0.63 \frac { d [ OH ] } { dt } $$
\end{document} (McKay and Rosario-Ortiz, 2015).
Quantification of singlet oxygen generation rate
FFA was used as a probe to measure the rate of singlet oxygen generation (Rf1O2), following a previously established procedure, detailed by Mostafa and Rosario-Ortiz (2013). FFA was added to a 10 mg/L SRNOM solution at an initial concentration of 22.5 μmol/L, and its concentration with time was monitored by HPLC after exposure to solar-simulated light for 4 hours with samples collected every hour. Methanol was also added (0.1 mol/L) to quench \documentclass{aastex}\usepackage{amsbsy}\usepackage{amsfonts}\usepackage{amssymb}\usepackage{bm}\usepackage{mathrsfs}\usepackage{pifont}\usepackage{stmaryrd}\usepackage{textcomp}\usepackage{portland, xspace}\usepackage{amsmath, amsxtra}\pagestyle{empty}\DeclareMathSizes{10}{9}{7}{6}\begin{document}
$$^\bullet{\rm OH}$$
\end{document} radicals. The calculation of Rf1O2 from a plot of ln[FFA]/[FFA]0 versus time is detailed elsewhere (Mostafa and Rosario-Ortiz, 2013).
Kinetic study: hydroxyl radical and singlet oxygen
The second-order reaction rate constants between (1) AMZ and hydroxyl radicals (kAMZ, OH) and (2) AMZ and singlet oxygen (kAMZ,1O2) were determined using the competition method described by Shemer et al. (2006). According to this method, a pollutant competes for ROS in a mixture, with a reference compound, whose reactivity toward the ROS is known. To determine the value of kAMZ,OH, hydrogen peroxide was used as a source of \documentclass{aastex}\usepackage{amsbsy}\usepackage{amsfonts}\usepackage{amssymb}\usepackage{bm}\usepackage{mathrsfs}\usepackage{pifont}\usepackage{stmaryrd}\usepackage{textcomp}\usepackage{portland, xspace}\usepackage{amsmath, amsxtra}\pagestyle{empty}\DeclareMathSizes{10}{9}{7}{6}\begin{document}
$$^\bullet{\rm OH}$$
\end{document} radical and the concentrations of AMZ and the reference compound (pCBA) were measured by HPLC. Similarly, kAMZ,1O2 was measured using methylene blue as a source of 1O2 and the concentrations of AMZ and the reference compound (FFA) were monitored through HPLC. The concentrations used were 20.7 μmol/L (AMZ); 22.3 μmol/L (pCBA) or 22.4 μmol/L (FFA); and 0.88 mmol/L (H2O2) or 31.3 μmol/L (methylene blue). Samples were quenched with bovine catalase to decompose residual H2O2 when needed.
AMZ photodegradation in the presence of SRNOM
A series of solar light-driven photodegradation experiments were conducted to determine the contribution of direct and indirect photolysis (through \documentclass{aastex}\usepackage{amsbsy}\usepackage{amsfonts}\usepackage{amssymb}\usepackage{bm}\usepackage{mathrsfs}\usepackage{pifont}\usepackage{stmaryrd}\usepackage{textcomp}\usepackage{portland, xspace}\usepackage{amsmath, amsxtra}\pagestyle{empty}\DeclareMathSizes{10}{9}{7}{6}\begin{document}
$$^\bullet{\rm OH}$$
\end{document} and 1O2) on AMZ (20.7 μmol/L) degradation in the presence of SRNOM (10 mg/L). In these experiments, pH was 7.2 and exposure to simulated solar light lasted 28 hours.
Analytical methods
Dissolved organic carbon (DOC) was measured using a TOC-VSCH (Shimadzu Corp.) analyzer. The method detection level was 0.2 mg C/L. An HPLC–UV (Agilent 1200) system equipped with an Agilent Eclipse XDB-C18 column (250×4.6 mm inner diameter, 5 μm) was used for monitoring AMZ, pCBA, FFA, and phenol. AMZ was determined at 224 nm by gradient elution with phosphate buffer (pH 2.8)/acetonitrile solution. The following gradient elution was used: 0–3 minutes (15% acetonitrile); 3–20 minutes (15–40% acetonitrile); 20–22 minutes (40% acetonitrile); 22–23 minutes (40–15% acetonitrile); and 23–25 minutes (15% acetonitrile).
The mobile phase used to determine pCBA was 45% phosphate buffer (pH 2.8)/55% methanol, with a detection wavelength of 234 nm. An isocratic elution with 70% phosphate buffer (pH 2.8)/30% methanol was used to monitor FFA at 219 nm. Finally, phenol was monitored at 210 nm, using 60% phosphate buffer (pH 2.8)/40% methanol as the mobile phase.
Photochemical modeling
The model used in this study to describe the environmental fate of AMZ has been previously described and validated for different pollutants (Vione et al., 2011; Marchetti et al., 2013). The software APEX (Aqueous Photochemistry of Environmentally occurring Xenobiotics) was derived from this model at the Department of Chemistry of the University of Torino and can be freely downloaded (Laurentiis et al., 2013; Bodrato and Vione, 2014). Briefly, it is used to calculate pseudo first-order kinetic constant of pollutant degradation in surface water and its half-life based on the chemical composition of water, irradiation depth, and on the spectral photon flux density of sunlight. Required input data are the photolysis quantum yield of the pollutant under sunlight and the second-order rate constants of its reaction with ROS, which we measured experimentally and are reported for the first time in the present study. The model uses the energy reaching the ground in a summer sunny day corresponding to 10 h of continuous irradiation at 22 W/m2 irradiance to define the time unit. Further details, including model equations, are given at http://chimica.campusnet.unito.it/do/didattica.pl/Show?_id=4pyh.
Results and Discussion
Light absorption properties of AMZ solutions
The overlap between the absorption spectrum of AMZ in aqueous solution and the spectrum of light emitted by the solar simulator is a necessary condition for the direct photolysis of the pollutant. AMZ exhibits low values of the molar absorption coefficient above 300 nm (ɛ<10 L/mol·cm) (Supplementary Fig. S1), whereas the solar irradiance on the earth surface ranges from 290 nm to higher wavelengths. Our experiments showed that no AMZ degradation occurred when the herbicide was spiked into ultrapure water and irradiated for 8 hours in the solar simulator. This suggests low quantum yields for direct photolysis associated with the low values of ɛ above 300 nm. As a result, AMZ degradation in natural surface waters is expected to be due to indirect photodegradation associated with NOM and inorganic nitrogen species, and to a lesser extent possibly to any biotic action.
Generation and action of ROS toward AMZ degradation
The rate of formation of ROS (1O2, \documentclass{aastex}\usepackage{amsbsy}\usepackage{amsfonts}\usepackage{amssymb}\usepackage{bm}\usepackage{mathrsfs}\usepackage{pifont}\usepackage{stmaryrd}\usepackage{textcomp}\usepackage{portland, xspace}\usepackage{amsmath, amsxtra}\pagestyle{empty}\DeclareMathSizes{10}{9}{7}{6}\begin{document}
$$^\bullet{\rm OH}$$
\end{document}) is controlled by the amount of photons absorbed by NOM and the associated quantum yields (Φ1O2 and ΦOH, respectively), defined as the number of molecules of 1O2 or \documentclass{aastex}\usepackage{amsbsy}\usepackage{amsfonts}\usepackage{amssymb}\usepackage{bm}\usepackage{mathrsfs}\usepackage{pifont}\usepackage{stmaryrd}\usepackage{textcomp}\usepackage{portland, xspace}\usepackage{amsmath, amsxtra}\pagestyle{empty}\DeclareMathSizes{10}{9}{7}{6}\begin{document}
$$^\bullet{\rm OH}$$
\end{document} formed per photon absorbed. The rate of formation divided by the sum of physical quenching and reactions with other species is equal to the steady-state concentration of the ROS, according to Equations (1) and (2) (Mostafa and Rosario-Ortiz, 2013).
\documentclass{aastex}\usepackage{amsbsy}\usepackage{amsfonts}\usepackage{amssymb}\usepackage{bm}\usepackage{mathrsfs}\usepackage{pifont}\usepackage{stmaryrd}\usepackage{textcomp}\usepackage{portland, xspace}\usepackage{amsmath, amsxtra}\pagestyle{empty}\DeclareMathSizes{10}{9}{7}{6}\begin{document}
\begin{align*}[ ^1O_2 ] _ { ss } = \frac { k_a \Phi_ { 102 } [ {
\rm S } ] } { \Sigma k_x [ X ] + k_d } \tag { 1 } \end{align*}
\end{document}\documentclass{aastex}\usepackage{amsbsy}\usepackage{amsfonts}\usepackage{amssymb}\usepackage{bm}\usepackage{mathrsfs}\usepackage{pifont}\usepackage{stmaryrd}\usepackage{textcomp}\usepackage{portland, xspace}\usepackage{amsmath, amsxtra}\pagestyle{empty}\DeclareMathSizes{10}{9}{7}{6}\begin{document}
\begin{align*}[ \bullet OH ]_{ ss } = \frac { k_a \Phi_ { 0 } [ {
\rm S } ] } { \Sigma k_x [ X ] } , \tag { 2 }
\end{align*}
\end{document}
where ka is the specific light absorbance of the water matrix (assumed to be dominated by NOM); S represents a photosensitizing molecule; Φ1O2 and ΦOH are the quantum yields; kX represents the reaction rate between the ROS and any species of X present in the water matrix (including but not limited to NOM); kd is the rate of decay of ROS to its ground state due to physical quenching without undergoing a reaction. One should observe that only 1O2 has a significant kd value (Mostafa and Rosario-Ortiz, 2013) and \documentclass{aastex}\usepackage{amsbsy}\usepackage{amsfonts}\usepackage{amssymb}\usepackage{bm}\usepackage{mathrsfs}\usepackage{pifont}\usepackage{stmaryrd}\usepackage{textcomp}\usepackage{portland, xspace}\usepackage{amsmath, amsxtra}\pagestyle{empty}\DeclareMathSizes{10}{9}{7}{6}\begin{document}
$$^\bullet{\rm OH}$$
\end{document} radicals are scavenged quickly by constituents of the water matrix. Table 1 shows the steady-state concentrations, the formation rates, and the quantum yields of formation of singlet oxygen and \documentclass{aastex}\usepackage{amsbsy}\usepackage{amsfonts}\usepackage{amssymb}\usepackage{bm}\usepackage{mathrsfs}\usepackage{pifont}\usepackage{stmaryrd}\usepackage{textcomp}\usepackage{portland, xspace}\usepackage{amsmath, amsxtra}\pagestyle{empty}\DeclareMathSizes{10}{9}{7}{6}\begin{document}
$$^\bullet{\rm OH}$$
\end{document} radicals in a solution containing 10 mg/L of SRNOM under simulated sunlight.
Reactive Oxygen Species Generation Characteristics for SRNOM at 10 mg/L: Steady-State Concentrations, Formation Rates, and Quantum Yields
The steady-state concentrations shown in Table 1 are in close agreement with those found in surface water bodies, which have been reported to be in the order of 10−17 to 10−16 and 10−15 to 10−14 mol/L, for \documentclass{aastex}\usepackage{amsbsy}\usepackage{amsfonts}\usepackage{amssymb}\usepackage{bm}\usepackage{mathrsfs}\usepackage{pifont}\usepackage{stmaryrd}\usepackage{textcomp}\usepackage{portland, xspace}\usepackage{amsmath, amsxtra}\pagestyle{empty}\DeclareMathSizes{10}{9}{7}{6}\begin{document}
$$^\bullet{\rm OH}$$
\end{document} radicals and 1O2, respectively (Vione et al., 2010b).
The second-order kinetic rate constants of AMZ with 1O2 and \documentclass{aastex}\usepackage{amsbsy}\usepackage{amsfonts}\usepackage{amssymb}\usepackage{bm}\usepackage{mathrsfs}\usepackage{pifont}\usepackage{stmaryrd}\usepackage{textcomp}\usepackage{portland, xspace}\usepackage{amsmath, amsxtra}\pagestyle{empty}\DeclareMathSizes{10}{9}{7}{6}\begin{document}
$$^\bullet{\rm OH}$$
\end{document} were determined by using methylene blue and H2O2 as the ROS sources, respectively. Competition kinetics was exploited between AMZ and pCBA in the case of hydroxyl radicals (Reactions [R1] and [R2], respectively) and between AMZ and FFA for 1O2 (Reactions [R3] and [R4], respectively):
\documentclass{aastex}\usepackage{amsbsy}\usepackage{amsfonts}\usepackage{amssymb}\usepackage{bm}\usepackage{mathrsfs}\usepackage{pifont}\usepackage{stmaryrd}\usepackage{textcomp}\usepackage{portland, xspace}\usepackage{amsmath, amsxtra}\pagestyle{empty}\DeclareMathSizes{10}{9}{7}{6}\begin{document}
\begin{align*}{\rm AMZ} + ^ \bullet { \rm OH} \rightarrow { \rm P}1 \ k_{{ \rm AMZ , OH} \bullet}\ ( { \rm R}1 )\end{align*}
\end{document}\documentclass{aastex}\usepackage{amsbsy}\usepackage{amsfonts}\usepackage{amssymb}\usepackage{bm}\usepackage{mathrsfs}\usepackage{pifont}\usepackage{stmaryrd}\usepackage{textcomp}\usepackage{portland, xspace}\usepackage{amsmath, amsxtra}\pagestyle{empty}\DeclareMathSizes{10}{9}{7}{6}\begin{document}
\begin{align*}{\rm pCBA} + ^ \bullet { \rm OH} \rightarrow { \rm P}2 \ k_{{ \rm pCBA , OH} \bullet}\ ( { \rm R}2 )\end{align*}
\end{document}\documentclass{aastex}\usepackage{amsbsy}\usepackage{amsfonts}\usepackage{amssymb}\usepackage{bm}\usepackage{mathrsfs}\usepackage{pifont}\usepackage{stmaryrd}\usepackage{textcomp}\usepackage{portland, xspace}\usepackage{amsmath, amsxtra}\pagestyle{empty}\DeclareMathSizes{10}{9}{7}{6}\begin{document}
\begin{align*}{\rm AMZ} + ^1 { \rm O}_2 \rightarrow { \rm P}3 \ k_{{ \rm AMZ} , 1 { \rm O}2}\ ( { \rm R}3 )\end{align*}
\end{document}\documentclass{aastex}\usepackage{amsbsy}\usepackage{amsfonts}\usepackage{amssymb}\usepackage{bm}\usepackage{mathrsfs}\usepackage{pifont}\usepackage{stmaryrd}\usepackage{textcomp}\usepackage{portland, xspace}\usepackage{amsmath, amsxtra}\pagestyle{empty}\DeclareMathSizes{10}{9}{7}{6}\begin{document}
\begin{align*}{\rm FFA} + ^1 { \rm O}_2 \rightarrow { \rm P}4 \ k_{{ \rm FFA} , 1 { \rm O}2 \bullet}\ ( { \rm R}4 )\end{align*}
\end{document}
where \documentclass{aastex}\usepackage{amsbsy}\usepackage{amsfonts}\usepackage{amssymb}\usepackage{bm}\usepackage{mathrsfs}\usepackage{pifont}\usepackage{stmaryrd}\usepackage{textcomp}\usepackage{portland, xspace}\usepackage{amsmath, amsxtra}\pagestyle{empty}\DeclareMathSizes{10}{9}{7}{6}\begin{document}
$$k_{{ \rm AMZ , ROS}}$$
\end{document} is the rate constant of the reaction between AMZ and the ROS, 1O2, or \documentclass{aastex}\usepackage{amsbsy}\usepackage{amsfonts}\usepackage{amssymb}\usepackage{bm}\usepackage{mathrsfs}\usepackage{pifont}\usepackage{stmaryrd}\usepackage{textcomp}\usepackage{portland, xspace}\usepackage{amsmath, amsxtra}\pagestyle{empty}\DeclareMathSizes{10}{9}{7}{6}\begin{document}
$$^\bullet{\rm OH}$$
\end{document}; kAMZ(obs) is the measured degradation rate constant for amicarbazone; kref(obs) is the measured degradation rate constant for the reference compound (FFA or pCBA); kref,ROS is the rate constant of the reaction between the reference compound and ROS, kFFA,1O2=1.2×10⁸ L/mol·s (Mostafa and Rosario-Ortiz, 2013), and kpCBA, OH•=5×10⁹ L/mol·s (Elovitz and von Guten, 1999). The measured value of kAMZ, OH• was 2.05×10¹⁰ L/mol·s; in contrast, kAMZ,1O2 was found to be much lower (∼5×10⁶ L/mol·s), which indicates that singlet oxygen plays a less important role in AMZ degradation. Conversely, the effective diffusion controlled value of kAMZ, OH• compared with the value of the rate constant for the reaction between NOM and \documentclass{aastex}\usepackage{amsbsy}\usepackage{amsfonts}\usepackage{amssymb}\usepackage{bm}\usepackage{mathrsfs}\usepackage{pifont}\usepackage{stmaryrd}\usepackage{textcomp}\usepackage{portland, xspace}\usepackage{amsmath, amsxtra}\pagestyle{empty}\DeclareMathSizes{10}{9}{7}{6}\begin{document}
$$^\bullet{\rm OH}$$
\end{document} radical (about 108–109 mol/L·s) suggests that this pathway may be more important (Buxton et al., 1988; Westerhoff et al., 2007; McKay et al., 2013).
AMZ photochemical degradation
The experiments performed with [AMZ]0=20.7 μmol/L in the water matrix containing 10 mg/L of SRNOM indicated that AMZ removal achieved only 7.0% (±0.6) after 28 hours of exposure to simulated solar light. Therefore, in the absence of any other species (CO3−2, HCO3−, NO2−, NO3−, etc.) the half-life time of AMZ in surface waters is expected to be about 10 days, which suggest that the herbicide, once leached from soils may remain in surface water bodies for long periods. Possamai et al. (2013) identified the inhibitory effects of AMZ on the growth of the bioindicator Cucumis sativus in soils with clayey and sandy textures, after 100 and 51 days after application, respectively, which indicates the persistence of AMZ in soils. Besides, the authors showed that herbicide leaching was favored in sandy soils, owing to the high AMZ solubility in water.
Photochemical modeling
The APEX model considers direct and indirect photolysis. In our case, since the herbicide degradation in DI water was not observed after 8 hours of exposure to simulated solar light, AMZ direct photolysis could be neglected, owing to the very low values of the molar absorption involved. Considering that the reaction between AMZ and 1O2 is also unlikely, as shown by the low value of kAMZ,1O2 we obtained, the main pathway of AMZ photodegradation was assumed to be the reaction with hydroxyl radicals, since here the effect of 3CDOM* was not considered. It is worth observing that photodegradation would be faster if additional processes were involved. Based on this experimental information and on the second-order rate constant of the reaction between AMZ and hydroxyl radicals, the half-life time and pseudo first-order rate constant (ktot) of AMZ degradation was modeled as a function of environmental variables, such as the concentration of particular chemical species and water column depth, by using the software APEX.
To achieve the relative importance of the model variables on AMZ half-life time (t1/2, in days), a factorial design at two levels of each variable (25) (Box et al., 1978) was used to perform the simulations using APEX (Supplementary Table S1). The ranges of values of the model variables (nitrate, nitrite, bicarbonate, and dissolved organic matter concentrations) were selected based on an extensive review of published data on Brazilian rivers (Table 2); the water depth was varied between 0.5 and 5 m. It is worth remembering that bicarbonate and carbonate concentrations do not vary independently because of the acid–base equilibrium involved. As a consequence, the composition of the HCO3−/CO32− system in water is strongly dependent on the pH (Oppenländer, 2003). The APEX model was, therefore, adapted to account for this fact and simulations were performed at four different pH values (6.5, 7.5, 8.5, and 9.5) for a range of bicarbonate concentrations found in the literature (Table 2). The pKa at 25°C for the HCO3−/CO32− system was calculated according to Clark and Fritz (1997). The corresponding carbonate concentrations were calculated by Equation (4):
\documentclass{aastex}\usepackage{amsbsy}\usepackage{amsfonts}\usepackage{amssymb}\usepackage{bm}\usepackage{mathrsfs}\usepackage{pifont}\usepackage{stmaryrd}\usepackage{textcomp}\usepackage{portland, xspace}\usepackage{amsmath, amsxtra}\pagestyle{empty}\DeclareMathSizes{10}{9}{7}{6}\begin{document}
\begin{align*}[ { CO_3 } ^ { 2 - } ] = \frac { 10^ { pka } [ { HCO_3 } ^ { - } ] } { 10^ { pH } } . \tag { 4 } \end{align*}
\end{document}
Range of Values of Variables Used in the Model, Based on Data Reported for Brazilian Rivers
According to the simulations, the variables that showed greater importance on amicarbazone degradation for pH 6.5 and 7.5 were DOC concentration (50.3%), water depth (43.4%), and nitrite concentration (2.8%); the numbers in parentheses correspond to the relative impact of each variable upon AMZ half-life time. In fact, for the values of bicarbonate concentrations shown in Table 2, in this pH range [CO32−] is ∼0.1–1 μmol/L; also, the second-order rate constants for reactions of hydroxyl radicals with bicarbonate and carbonate are \documentclass{aastex}\usepackage{amsbsy}\usepackage{amsfonts}\usepackage{amssymb}\usepackage{bm}\usepackage{mathrsfs}\usepackage{pifont}\usepackage{stmaryrd}\usepackage{textcomp}\usepackage{portland, xspace}\usepackage{amsmath, amsxtra}\pagestyle{empty}\DeclareMathSizes{10}{9}{7}{6}\begin{document}
$$k_{{\rm HCO}3 - ,\ {\rm OH}_{\bullet}}$$
\end{document}=8.5×10⁶ L/mol·s and \documentclass{aastex}\usepackage{amsbsy}\usepackage{amsfonts}\usepackage{amssymb}\usepackage{bm}\usepackage{mathrsfs}\usepackage{pifont}\usepackage{stmaryrd}\usepackage{textcomp}\usepackage{portland, xspace}\usepackage{amsmath, amsxtra}\pagestyle{empty}\DeclareMathSizes{10}{9}{7}{6}\begin{document}
$$k_{{\rm CO}32 - ,\, {\rm OH}_{\bullet}}$$
\end{document}=3.9×10⁸ L/mol·s (Oppenländer, 2003), respectively. As a consequence, scavenging of \documentclass{aastex}\usepackage{amsbsy}\usepackage{amsfonts}\usepackage{amssymb}\usepackage{bm}\usepackage{mathrsfs}\usepackage{pifont}\usepackage{stmaryrd}\usepackage{textcomp}\usepackage{portland, xspace}\usepackage{amsmath, amsxtra}\pagestyle{empty}\DeclareMathSizes{10}{9}{7}{6}\begin{document}
$$^\bullet{\rm OH}$$
\end{document} species by CO32− and HCO3− is small. On the other hand, for pH 8.5 and 9.5 carbonate anions gain importance in such a way that simulations indicated DOC concentration (50.0%), water depth (43.8%), and bicarbonate/carbonate concentration (2.7%) as the most influential variables in AMZ half-life time for pH 8.5; for pH 9.5, the higher effects on AMZ half-life are due to DOC concentration (43.8%), water depth (43.8%), and bicarbonate/carbonate concentration (10.5%); again, the number in parentheses correspond to the relative impact of each variable on t1/2. Figures 2–7 summarize the main trends observed.
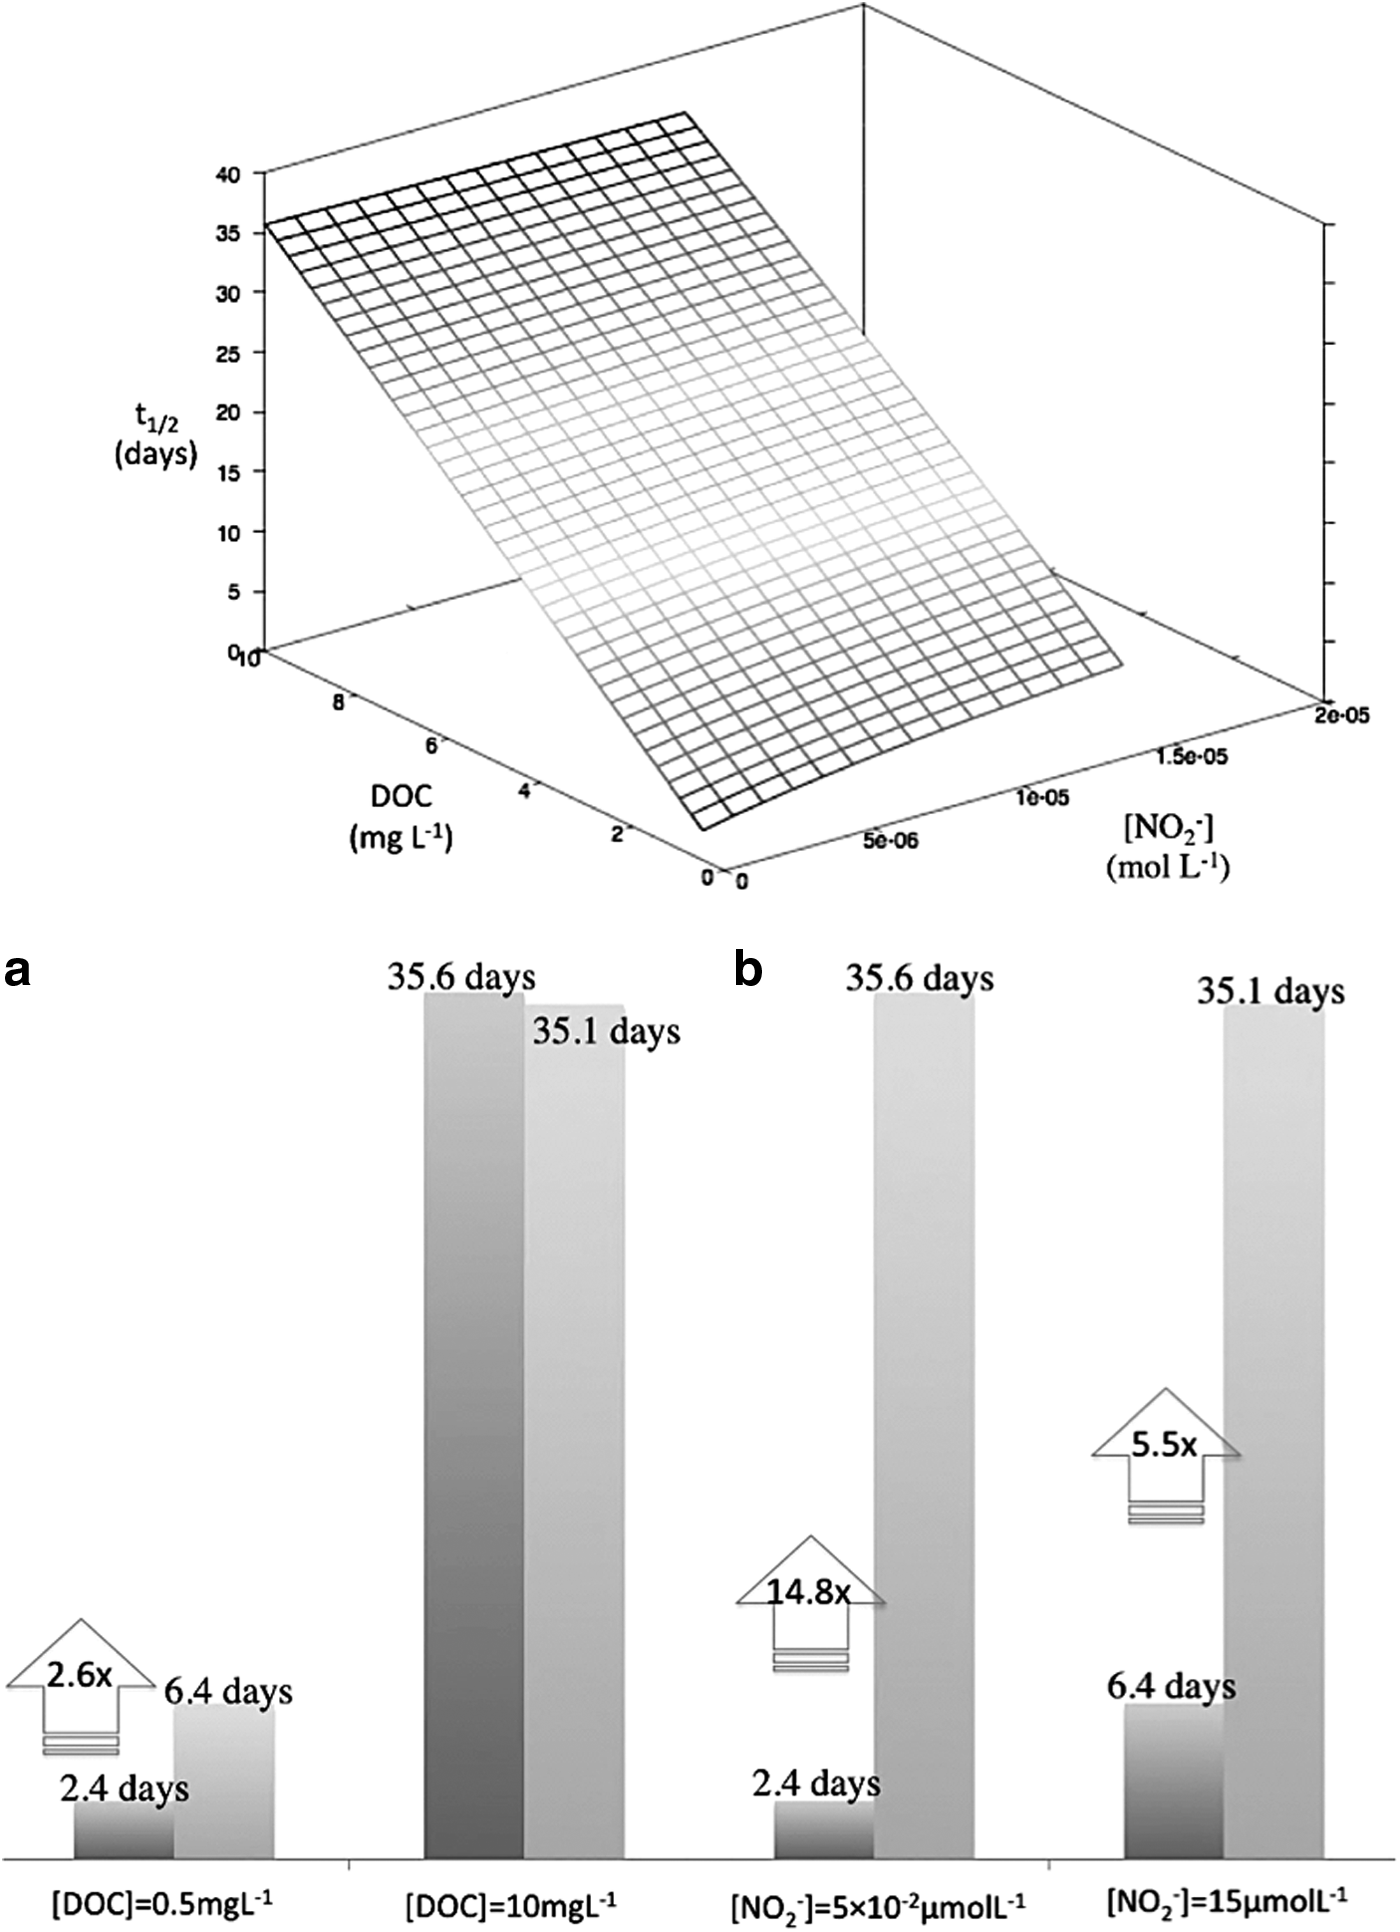
Effect of nitrite and dissolved organic carbon (DOC) concentrations on technical-grade amicarbazone (AMZ) half-life as predicted by the Aqueous Photochemistry of Environmentally occurring Xenobiotics (APEX) model for the pH range 6.5–7.5. All other variables fixed at their average values: [NO3−]=50.5 μmol/L, [HCO3−]=1.1×10³ μmol/L, and 2.75 m water depth. (a) 300-fold increase in nitrite for minimum and maximum DOC levels and (b) 20-fold increase in DOC concentration for minimum and maximum nitrite levels.
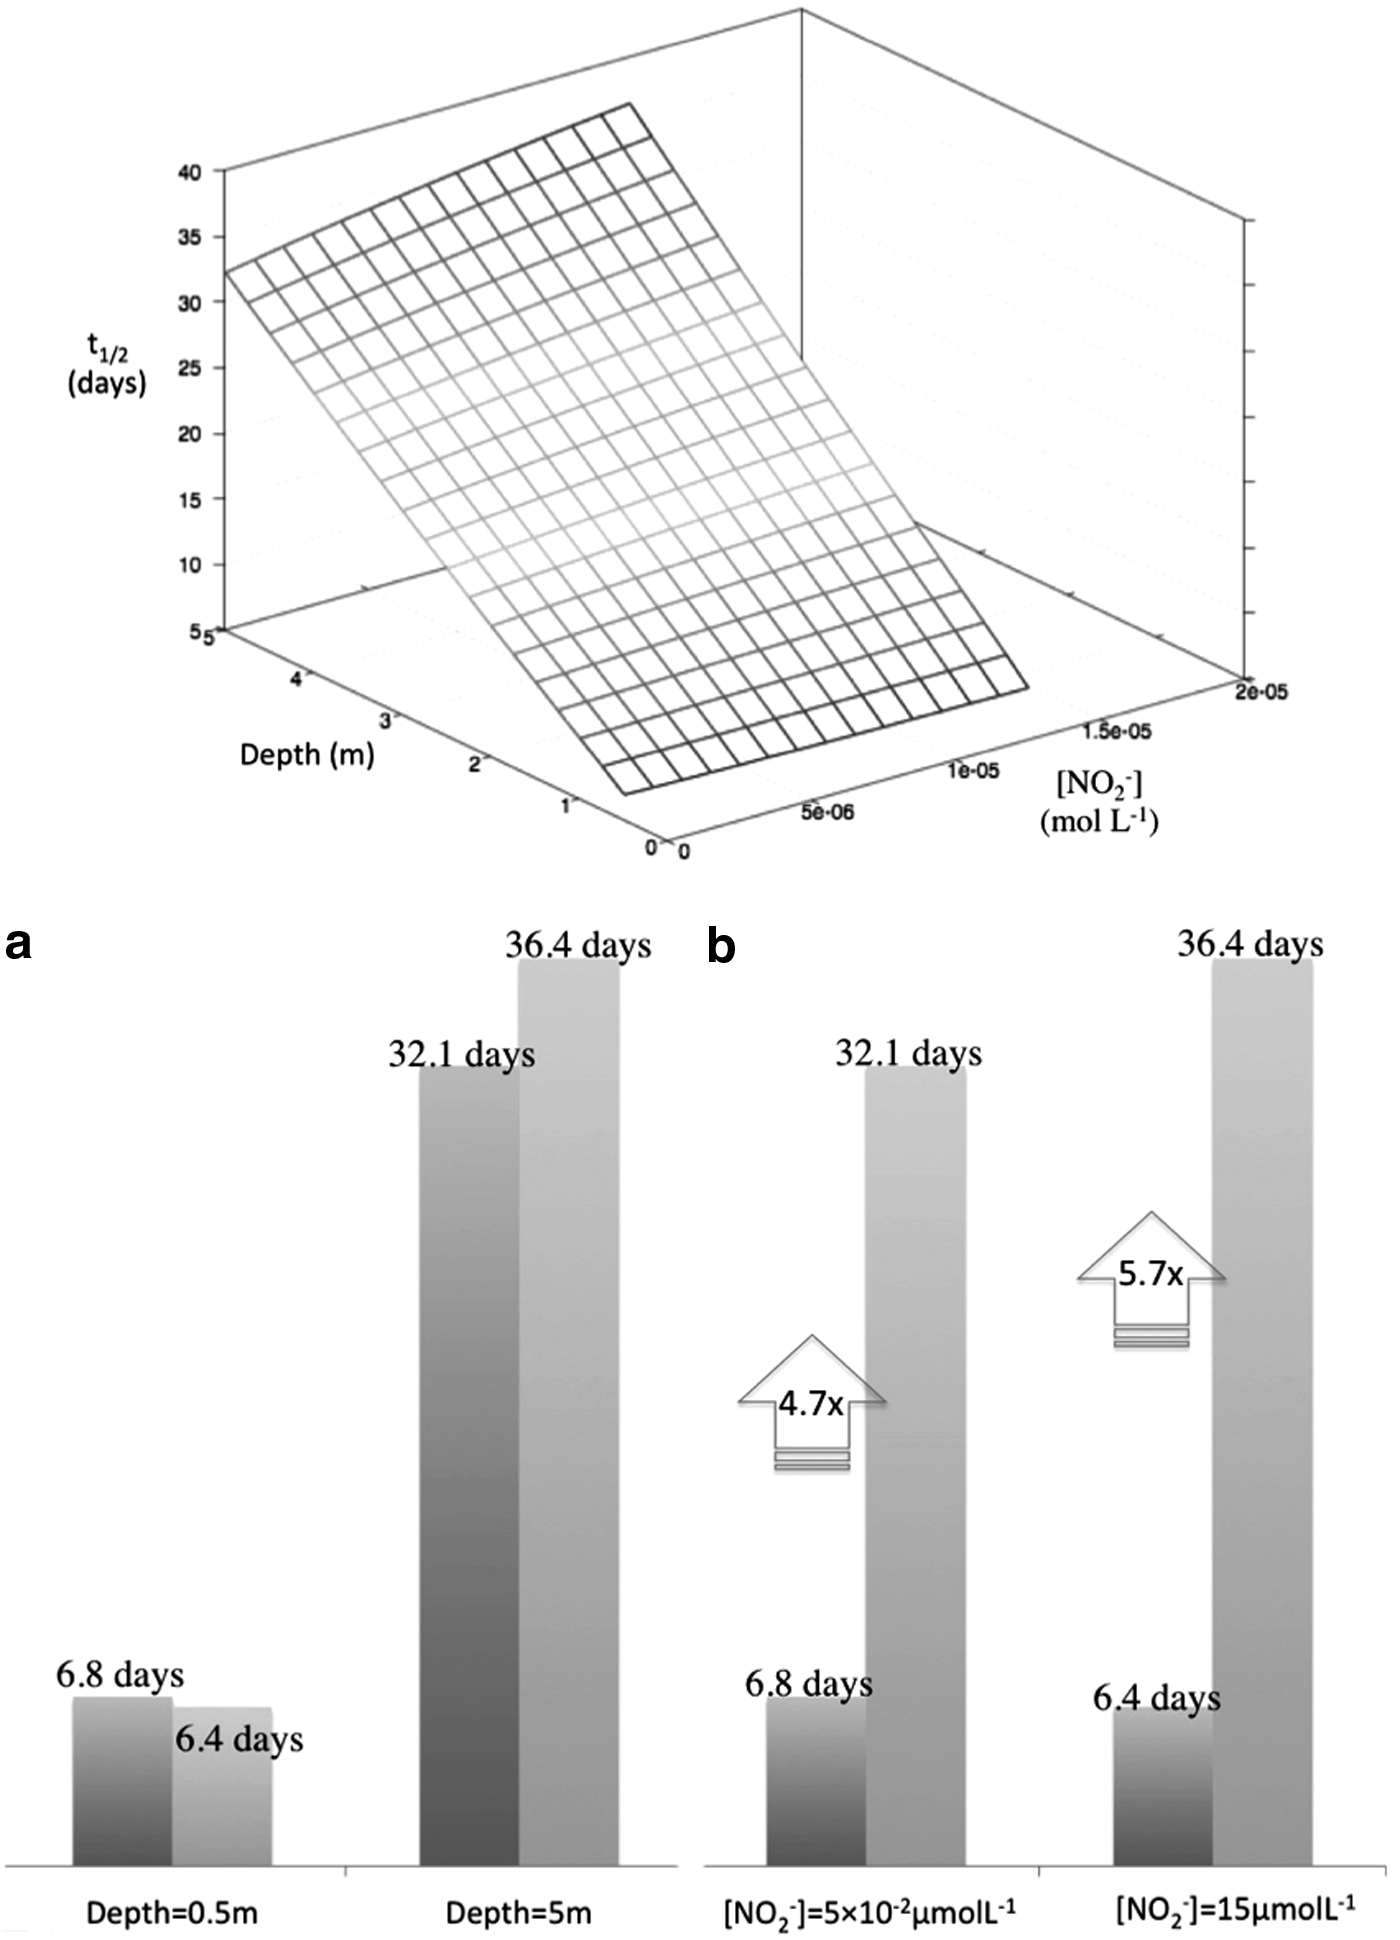
Effect of water depth and nitrite concentration on AMZ half-life as predicted by the APEX model for the pH range 6.5–7.5. All other variables fixed at their average values: [NO3−]=50.5 μmol/L, [HCO3−]=1.1×10³ μmol/L, and [DOC]=5.25 mg/L. (a) 300-fold increase in nitrite for minimum and maximum water depth and (b) 10-fold increase in water depth for minimum and maximum nitrite levels.
Effect of water depth and DOC concentration on AMZ half-life as predicted by the APEX model for the pH range 6.5–7.5. All other variables fixed at their average values: [NO3−]=50.5 μmol/L, [HCO3−]=1.1×10³ μmol/L, and [NO2−]=7.5 μmol/L. (a) Ten-fold increase in water depth for minimum and maximum DOC levels. (b) Ten-fold increase in DOC concentration for minimum and maximum water depth.
Effect of bicarbonate and DOC concentrations on AMZ half-life as predicted by the APEX model for the pH range 8.5–9.5. All other variables fixed at their average values: [NO3−]=50.5 μmol/L, [NO2−]=7.5 μmol/L, and 2.75 m water depth. (a) Ten-fold increase in bicarbonate concentration for minimum and maximum DOC levels. (b) Ten-fold increase in DOC concentration for minimum and maximum bicarbonate levels.
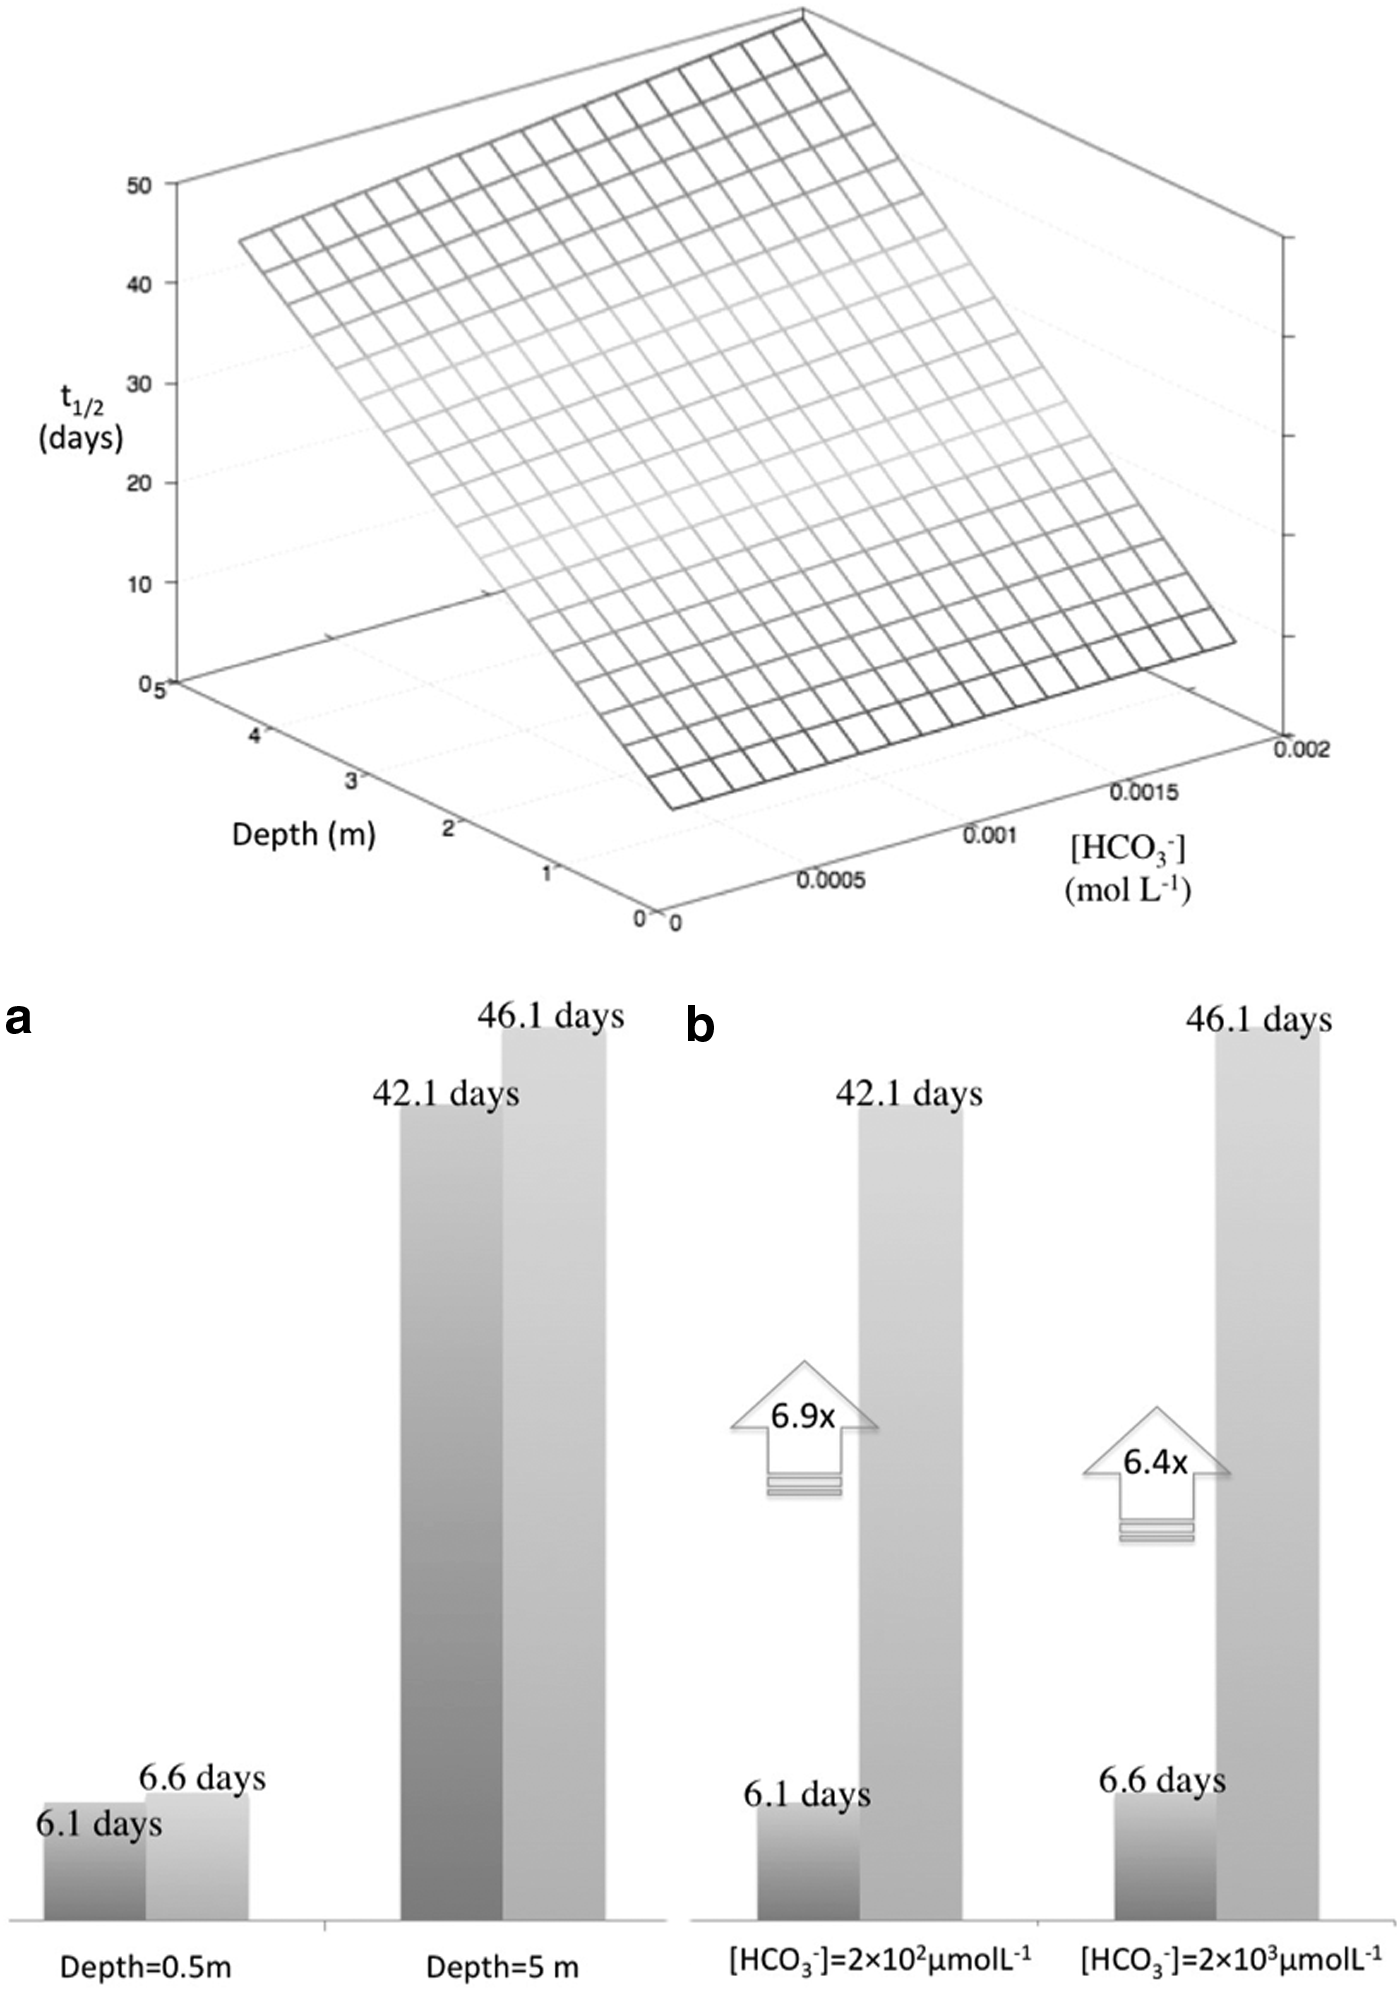
Effect of water depth and bicarbonate concentration on AMZ half-life as predicted by the APEX model for the pH range 8.5–9.5. All other variables fixed at their average values: [NO3−]=50.5 μmol/L, [NO2−]=7.5 μmol/L, and [DOC]=5.25 mg/L. (a) Ten-fold increase in bicarbonate concentration for minimum and maximum water depth. (b) Ten-fold increase in water depth for minimum and maximum bicarbonate levels.
Effect of water depth and DOC concentration on AMZ half-life as predicted by the APEX model for the pH range 8.5–9.5. All other variables fixed at their average values: [NO3−]=50.5 μmol/L, [NO2−]=7.5 μmol/L, and [HCO3−]=1.1×10³ μmol/L. (a) Ten-fold increase in water depth for minimum and maximum DOC levels. (b) Twenty-fold increase in DOC concentration for minimum and maximum water depth.
For the pH range 6.5–7.5, the predicted behavior of AMZ half-life time (t1/2) as a function of nitrite and DOC concentrations is shown in Fig. 2, the water depth set at its average value (2.75 m) in the range 0.5–5.0 m. As expected, AMZ degradation becomes slower with increasing DOC concentration, which means higher DOM and CDOM contents. While CDOM is a photochemical source of hydroxyl radicals, DOM often acts as an important \documentclass{aastex}\usepackage{amsbsy}\usepackage{amsfonts}\usepackage{amssymb}\usepackage{bm}\usepackage{mathrsfs}\usepackage{pifont}\usepackage{stmaryrd}\usepackage{textcomp}\usepackage{portland, xspace}\usepackage{amsmath, amsxtra}\pagestyle{empty}\DeclareMathSizes{10}{9}{7}{6}\begin{document}
$$^\bullet{\rm OH}$$
\end{document} scavenger (Passananti et al., 2014). Figure 2 also shows that a 300-fold increase in nitrite concentration at low DOC levels contributes to a 3-fold increase in t1/2. In contrast, for the same increase in [NO2−], a slight decrease in AMZ half-life is expected at higher DOC concentrations. These tendencies show that the impact of nitrite anions on AMZ degradation, as an additional source of hydroxyl radicals is limited, depending strongly on the composition of the key-role species (DOC, HCO3−, and CO32−) in natural aqueous systems (see also Supplementary Figs. S2 and S3).
In comparison with the effect of nitrite, Fig. 3 shows that the model predicts a much more pronounced influence of water depth on AMZ persistence in natural systems. Actually, the model predicts an average increase in half-life of about 6 days to more than 1 month for a 10-fold increase in water depth. It is worth noticing that the joint effect of nitrite and water depth on t1/2 does not depend on nitrate and bicarbonate levels (Supplementary Figs. S4 and S5), with average increments on t1/2 following the same patterns as those shown in Fig. 3.
The predicted effects of water depth and DOC on AMZ half-life time, according to the APEX model calculations, are shown in Fig. 4. As expected, AMZ photodegradation will be faster in shallow and DOC-poor water bodies. The increase in t1/2 with path length is accounted for by the fact that deeper water bodies are less thoroughly illuminated by sunlight, with lower \documentclass{aastex}\usepackage{amsbsy}\usepackage{amsfonts}\usepackage{amssymb}\usepackage{bm}\usepackage{mathrsfs}\usepackage{pifont}\usepackage{stmaryrd}\usepackage{textcomp}\usepackage{portland, xspace}\usepackage{amsmath, amsxtra}\pagestyle{empty}\DeclareMathSizes{10}{9}{7}{6}\begin{document}
$$^\bullet{\rm OH}$$
\end{document} formation rate as a consequence. Figure 4 shows that the effect of increasing DOC on t1/2 would be lower than the effect of increasing water depth. Instead, the APEX model predicts average four- and seven-fold increases in half-life with depth for the minimum and maximum DOC levels, respectively. Supplementary Figs S6 and S7 reveal that the effects of water depth and DOC on AMZ persistence, when jointly examined, are not influenced by nitrate and bicarbonate. In fact, considering all levels of these variables, the average predicted increases in t1/2 with water depth and DOC are equal to 5.7±1.5 and 3.1±0.8 times, respectively.
For the pH range 8.5–9.5, Fig. 5 shows the calculated values of AMZ half-life time as a function of bicarbonate and DOC concentrations. For a 10-fold increase in HCO3− concentration, t1/2 increases only 14% and 7% for the minimum and maximum DOC levels, respectively. In contrast, average 3.5- and 3-fold increases in t1/2 are expected for a 20-fold increase in DOC concentration. These tendencies show a much more pronounced scavenging of hydroxyl radicals by dissolved organic matter in comparison with bicarbonate/carbonate anions in natural aqueous systems (see also Supplementary Figs. S8 and S9). In addition, for bicarbonate/carbonate levels usually found in surface waters at higher pH values, the effect of water depth on AMZ persistence is evident (Fig. 6 and Supplementary Figs. S10 and S11).
Finally, Fig. 7 shows that the predicted effect of water depth and DOC concentration on AMZ persistence in the pH range 8.5–9.5 are very similar to that already shown in Fig. 4 (pH 6.5–7.5): the model predicts an average increase in AMZ half-life from 4 to 9 days (0.5 m) and from 17 to more than 2 months (5 m) when DOC increases from 0.5 to 10 mg/L. Considering all possible levels of the model input variables, the average predicted increases in t1/2 with water depth and carbonate concentration are equal to 5.4±1.4 and 3.6±1.4 times, respectively (Supplementary Figs. S12 and S13), following the same trend presented in Fig. 7. This indicates that the predicted joint effects of water depth and DOC concentration on AMZ persistence in surface waters exposed to sunlight dominate and depend only slightly on nitrate/nitrite and bicarbonate/carbonate concentrations.
Conclusions
This study confirms that the direct photolysis of AMZ by sunlight is unlikely as well as its reaction with singlet oxygen. The attack of AMZ molecules by \documentclass{aastex}\usepackage{amsbsy}\usepackage{amsfonts}\usepackage{amssymb}\usepackage{bm}\usepackage{mathrsfs}\usepackage{pifont}\usepackage{stmaryrd}\usepackage{textcomp}\usepackage{portland, xspace}\usepackage{amsmath, amsxtra}\pagestyle{empty}\DeclareMathSizes{10}{9}{7}{6}\begin{document}
$$^\bullet{\rm OH}$$
\end{document} radicals was shown to be the dominant mechanism involved in AMZ degradation in surface waters exposed to sunlight, with a second-order rate constant of 2.05×10¹⁰ L/mol·s, a value reported for the first time for this widely used herbicide. These experimental findings were combined with literature data regarding typical ranges of dissolved chemical species concentrations (dissolved organic matter, carbonate, bicarbonate, nitrate, and nitrite), and used with the APEX mathematical model to simulate the fate of amicarbazone in environmental water bodies.
The simulation results indicate that DOM and water depth are expected to have the highest influence on AMZ half-life time, which can vary from less than 1 day to about 75 days depending on the range of environmental conditions studied. Actually, these values of t1/2 are upper limits since the reaction with 3CDOM* was not considered. The inner filter effect of DOM and its action as a radical scavenger contribute to a longer persistence of AMZ. The model simulations suggest that the pesticide is degraded faster in shallow water bodies, containing low DOC and bicarbonate/carbonate concentrations. Moreover, the cross-effects of water depth and [DOC] are slightly influenced by nitrate, nitrite, and bicarbonate/carbonate concentrations. In the pH range 6.5–7.5, a small positive effect of nitrite concentration is expected for low depth and high DOC concentration, since scavenging of hydroxyl radicals by bicarbonate and carbonate is unimportant. For increasing pH, carbonate concentration increases, and scavenging of \documentclass{aastex}\usepackage{amsbsy}\usepackage{amsfonts}\usepackage{amssymb}\usepackage{bm}\usepackage{mathrsfs}\usepackage{pifont}\usepackage{stmaryrd}\usepackage{textcomp}\usepackage{portland, xspace}\usepackage{amsmath, amsxtra}\pagestyle{empty}\DeclareMathSizes{10}{9}{7}{6}\begin{document}
$$^\bullet{\rm OH}$$
\end{document} radicals is expected to overcome the effect of nitrite concentration.
These results suggest that suitable treatment methods are recommended for remediation of AMZ-containing wastewaters to prevent contamination of natural aqueous systems and/or to treat water impacted by AMZ for drinking water supply purposes. Based on the large value of kAMZ,HO•, advanced oxidation processes (e.g., UV/H2O2) may be a viable treatment option.
Footnotes
Acknowledgments
The authors thank the Coordination for the Improvement of Higher Level Personnel (CAPES) for the financial support and also the Science Without Borders Program (Process No. 12354/13-9) for the financial support during the internship at the University of Colorado at Boulder, United States.
Author Disclosure Statement
No competing financial interests exist.
References
1.
BodratoM., and VioneD. (2014). APEX (Aqueous Photochemistry of Environmentally occurring Xenobiotics): A free software tool to predict the kinetics of photochemical processes in surface waters. Environ. Sci. Process. Impacts, 16, 732.
2.
BoxG.E.P., HunterW.G., and HunterJ.S. (1978). Statistics for Experimenters: An Introduction to Design, Data Analysis and Model Building.New York: Wiley.
3.
BuxtonG.V., GreenstockC.L., HelmanW.P., and RossA.B. (1988). Critical review of rate constants for reactions of hydrated electrons, hydorgen atoms, and hydroxyl radicals in aqueous solution. J. Phys. Chem. Ref. Data, 17, 513.
4.
ClarkI.D., and FritzP. (1997). Environmental Isotopes in Hydrology, 1st ed. Boca Raton, FL: Lewis Publishers.
DorfmanL.M., TaubI.A., and BuhlerR.E. (1962). Pulse radiolysis studies I: Trasient spectra and reaction-rate constants in irradiated aqueous solutions of benzene. J. Chem. Phys., 36, 3051.
7.
ElovitzM.S., and von GuntenU. (1999) Hydroxyl radical ozone ratios during ozonation processes. I-The R-ct concept. Ozone Sci. Eng., 21, 239.
8.
HarrisD.C. (2003). Quantitative Chemical Analysis. 6th Edition. New York: W.H. Freeman and Co.
9.
KramerW., and SchirmerU., JeschkeP., and WitschelM. (2012). Modern Crop Protection Compounds, 2nd ed. Weinheim, Germany: Wiley-VCH.
10.
LarsonR.A., and ZeppR.G. (1988). Reactivity of the carbonate radical with aniline derivatives. Environ. Toxicol. Chem., 7, 265.
11.
LaurentiisE.D., ChironS., Kouras-HadefS., RichardC., MinellaM., MaurinoV., MineroC., and VioneD. (2012). Photochemical fate of carbamazepine in surface freshwaters: Laboratory measures and modeling. Environ. Sci. Technol., 46, 8164.
12.
LaurentiisE.D., MinellaM., BrodatoM., MaurinoV., MineroC., and VioneD. (2013). Modeling the photochemical generation kinetics of 2-methyl-4-chlorophenol, an intermediate of the herbicide MCPA (2 methyl-4-chlorophenoxyacetic acid) in surface waters. Aquat. Ecosystem Health Manage., 16, 216.
13.
LucioM.Z.T.P.Q.L., SantosS.S., and SilvaD.M.L. (2012). Hydrochemistry of Cachoeira River (Bahia State, Brazil). Acta Limnologica Brasiliensia, 24, 181.
14.
MarchettiG., MinellaM., MaurinoV., MineroC., and VioneD. (2013). Photochemical transformation of atrazine and formation of photointermediates under conditions relevant to sunlit surface waters: Laboratory measures and modelling. Water Res., 47, 6211.
15.
McKayG., KleinmanJ.L., JohnstonK.M., DongM.M., Rosario-OrtizF.L., and MezykS.P. (2013). Kinetics of the reaction between the hydroxyl radical and organic matter standards from the International Humic Substance Society. J. Soils Sediments, 14, 298.
16.
McKayG.J., and Rosario-OrtizF.L. (2015). Temperature dependence of the photochemical formation of hydroxyl radical from dissolved organic matter. Environ. Sci. Technol., 49, 4147.
17.
MostafaS., and Rosario-OrtizF.L. (2013). Singlet oxygen formation from wastewater organic matter. Environ. Sci. Technol., 47, 8179.
18.
MulhollandD.S., BoaventuraG.R., and AraújoD.F. (2012). Geological and anthropogenic influences on sediment metal composition in the upper Paracatu River Basin, Brazil. Environ. Earth Sci. J., 67, 1307.
19.
OppenländerT. (2003). Photochemical Purification of Water and Air: Advanced Oxidation Processes (AOPs): Principles, Reaction Mechanisms, Reactor Concepts, 1st ed. Weinheim, Germany: Wiley-VCH.
20.
OrlandoJ.L. (2013). A compilation of U.S. Geological Survey pesticide concentration for water and sediment in the Sacramento-São Joaquim Delta region: 1990–2010. U.S. Geological Data Series, 756, 1.
21.
OvalleA.R.C., SilvaC.F., RezendeC.E., GattsC.E.N., SuzukiM.S., and FigueiredoR.O. (2013). Long-term trends in hydrochemistry in the Paraíba do Sul River, southeastern Brazil. J. Hydrol., 481, 191.
22.
PageS.E., ArnoldW.A., and McNeillK. (2011). Assessing the contribution of free hydroxyl radical in organic matter-sensitized photohydroxylation reactions. Environ. Sci. Technol., 45, 2818.
23.
PassanantiM., TemussiF., IesceM.R., PreviteraL., MailhotG., VioneD., and BriganteM. (2014). Photoenhanced transformation of nicotine in aquatic environments: Involvement of naturally occurring radical sources. Water Res., 55, 106.
24.
PeixotoA.L.C., and TeixeiraA.C.S.C. (2014). Degradation of amicarbazone herbicide by photochemical processes. J. Photochem. Photobiol. A Chem., 275, 54.
25.
PimentaA.M., FurlanettoL.M., AlbertoniE.F., and Palma-SilvaC. (2012). Water quality in the lotic area of the Antas River before and after the construction of the Monte Claro hydroelectric plant, south Brazil. Acta Limnologica Brasiliensia, 24, 314.
26.
PossamaiA.C.S., InoueM.H., MendesK.F., SantanaD.C., BenR., and SantosE.G. (2013). Leaching potential and residual effect of amicarbazone in soils of contrasting texture. Semina: Ciências Agrárias, 34, 2203.
27.
RibeiroK.H., FavarettoN., DieckowJ., SouzaL.C.P., MinellaJ.P.G., AlmeidaL., and RamosM.R. (2014). Quality of surface water related to land use: A case study in a catchment with small farms and intensive vegetable crop production in southern Brazil. Revista Brasileira de Ciências do Solo, 38, 656.
28.
RichardsonS.D., and TernesT.A. (2014). Water analysis: Emerging contaminants and current issues. Anal. Chem., 86, 2813.
29.
ShemerH., SharplessC.M., ElovitzM.S., and LindenK.G. (2006). Relative rate constants of contaminant with hydroxyl radicals. Environ. Sci. Technol., 40, 4460.
30.
SousaE.S., SalimonC.I., FigueiredoR.O., and KruscheA.V. (2011) Dissolved carbon in an urban area of a river in the Brazilian Amazon. Biogeochemistry, 105, 159.
31.
StanfordB.D., SnyderS.A., TrenholmR.A., HoladyJ.C., and VanderfordB.J. (2010). Estrogenic activity of US drinking waters: A relative exposure comparison. J. Am. Water Works Assoc., 102, 55.
32.
VajdaA.M., BarberL.B., GrayJ.L., LopezE.M., WoodlingJ.D., and NorrisD.O. (2008). Reproductive disruption in fish downstream from an Estrogenic wastewater effluent. Environ. Sci. Technol., 42, 3407.
33.
VioneD., BagnusD., MaurinoV., and MineroC. (2010b). Quantification of singlet oxygen and hydroxyl radicals upon UV irradiation of surface water. Environ. Chem. Lett., 8, 193.
34.
VioneD., DasR., RubertelliF., MaurinoV., MineroC., BarbatiS., and ChironS. (2010a). Modelling the occurrence and reactivity of hydroxyl radicals in surface waters: Implications for the fate of selected pesticides. Int. J. Environ. Anal. Chem., 90, 260.
35.
VioneD., FallettiG., MaurinoV., MineroC., PelizzettiE., MalandrinoM., AjassaR., OlariuR., and ArseneC. (2006). Sources and sinks of hydroxyl radicals upon irradiation of natural water samples. Environ. Sci. Technol., 40, 3775.
36.
VioneD., MaddigapuP.R., LaurentiisE.D., MinellaM., PazziM., MaurinoV., MineroC., KourasS., and RichardC. (2011). Modelling the photochemical fate of ibuprofen in surface waters. Water Res., 45, 6725.
37.
VioneD., MaurinoV., and MineroC. (2014). Photosensitised humic-like substances (HULIS) formation processes of atmospheric significance: A review. Environ. Sci. Pollut. Res., 21, 11614.
38.
WesterhoffP., MezykS.P., CooperW.J., and MinakataD. (2007). Electron pulse radiolysis determination of hydroxyl radical rate constants with Suwannee River fulvic acid and other dissolved organic matter solates. Environ. Sci. Technol., 41, 4640.
39.
ZengT., and ArnoldW.A. (2013). Pesticide photolysis in Prairie potholes: Probing photosensitized processes. Environ. Sci. Technol., 47, 6735.
Supplementary Material
Please find the following supplemental material available below.
For Open Access articles published under a Creative Commons License, all supplemental material carries the same license as the article it is associated with.
For non-Open Access articles published, all supplemental material carries a non-exclusive license, and permission requests for re-use of supplemental material or any part of supplemental material shall be sent directly to the copyright owner as specified in the copyright notice associated with the article.