
Abstract
Abstract
Air emissions from animal feeding operations may cause elevated concentrations of bioaerosols in surrounding areas, posing adverse health effects to the people working on or living near the farm. Concentrations of nonselective airborne bacteria and fungi in various size ranges were measured by the Andersen six-stage viable samplers in an egg production house and at four ambient stations surrounding the farm in winter, spring, and summer. It was discovered that in-house bacterial particle size distributions (PSDs) were different among seasons. Under higher temperature and lower relative humidity conditions, more bacteria were associated with the small size ranges. Seasonal variations of in-house fungal PSDs were not significant. On average, 60–80% of in-house bacteria were in respirable size range (≤4.7 μm), whereas 60–70% of in-house fungi were in respirable size range. Bacterial PSDs at ambient locations were different among stations in winter but not in spring and summer. There were significant differences in fungal PSDs among ambient stations in three seasons. On average, 50–80% of ambient bacteria were in respirable size range, and 60–90% of ambient fungi were in respirable range.
Introduction
B
The sources of bioaerosols include humans, animals, plants, soil, and water. As important contributors to ambient bioaerosols, animal feeding operations (AFOs) may emit significant amounts of bioaerosols (Thedell et al., 1980; Clark et al., 1983; Scarpino and Quinn, 1998; Bilic and Habrun, 2000; Chang and Chung, 2001; Predicala et al., 2001; Allen and Hinton, 2003; Richardson and Mitchell, 2003; Green et al., 2006; Simmons et al., 2006; Hu, 2012; Wang-Li et al., 2013c; Hu et al., 2014, 2015). It is anticipated that concentrations of bioaerosols are higher than background level in the surrounding areas of AFO facilities (Scarpino and Quinn, 1998; Bilic and Habrun, 2000; Chang and Chung, 2001; Predicala et al., 2001; Allen and Hinton, 2003; Richardson and Mitchell, 2003; Green et al., 2006; Simmons et al., 2006; Hu, 2012; Wang-Li et al., 2013c; Hu et al., 2014, 2015). Consequently, emissions of bioaerosols may bring health risks to the people living in surrounding areas.
Understanding of health effects, fate, and transport of bioaerosols requires knowledge of physical and biological characteristics. Particle size distribution (PSD) is the most important physical parameter governing the behavior of bioaerosol particles. In general, the sizes of bioaerosols range from sub-micrometers to over hundred-micrometers (Hinds, 1998). Bacteria are usually in the size range of 0.3–10 μm, fungal spore may be in the range of 0.5–30 μm, and viruses represent the smaller size group of below 0.5 μm (Hinds, 1998).
Although PSDs of aerosols in animal environments have been extensively studied for years (Heber et al., 1998, 1991; Yoder and van Wicklen, 1988; Chen et al., 1995; Maghirang et al., 1997; Sweeten et al., 1998; Takai et al., 1998; Capareda et al., 2005; Cao, 2009; Lee, 2009; McClure, 2009; Jerez et al., 2011; Wang-Li et al., 2013a, 2013b), only few findings about size distributions of bioaerosols associated with animal production facilities have been reported in the literature (Thedell et al., 1980; Clark et al., 1983; Scarpino and Quinn, 1998; Bilic and Habrun, 2000; Green et al., 2006; Hu, 2012).
For assessment of health effect, most researchers divided bioaerosols into two categories according to their sizes: respirable and nonrespirable (Clark et al., 1983; Crook et al., 1991; Green et al., 2006). According to the American Conference of Governmental Industrial Hygienists (ACGIH), the respirable fraction of the particles has been defined as the fraction collected by a sampler with penetration curve having a cut point of 4 μm (ACGIH, 1985; Hinds, 1998), therefore some researchers have defined particles deposited on the first two stages as nonrespirable aerosols (>4.7 μm) and particles collected at the lower four stages as respirable (≤4.7 μm) when six-stage Anderson sampler was used to take aerosol samples (Clark et al., 1983; Crook et al., 1991; Green et al., 2006). In Green et al.'s study (2006), 62% of the airborne bacteria upwind of the swine house and 47% of the bacteria inside the house were respirable. Clark et al. (1983) reported that the percentages of respirable bacteria were 26% in swine house and 40% in poultry house. Crook et al. (1991) reported that most of the airborne bacteria and fungi collected in swine houses were nonrespirable.
Study of bioaerosols involves in taking bioaerosol samples and conducting biological analysis on the samples. Among various types of samplers for bioaerosol measurements, the Andersen six-stage viable sampler is the most commonly used type for bioaerosol sampling in animal facilities and often served as a reference sampler by some researchers in evaluating other sampling devices (Henningson and Ahlberg, 1994; Cox and Wathes, 1995; Mehta et al., 1996; Predicala et al., 2001). The Andersen six-stage sampler allows simultaneous sizing and counting of viable microorganisms without dilution or plating (Griffiths and DeCosemo, 1994) and it has been reported to have high levels of sensitivity, repeatability, and collection efficiency (Zimmerman et al., 1987; Jensen et al., 1992; Buttner and Stetzenbach, 1993; Predicala et al., 2001; Tseng and Li, 2005).
In this reported study, Anderson six-stage viable samplers were used to take simultaneous measurements of bioaerosol number concentrations in six different size ranges. The goal of this research was to fill the knowledge gaps in bioaerosol size distributions at the AFO emission sources and in the vicinity of the sources. The newly gained knowledge will provide fundamental information for studies of fate and transport of bioaerosols emitted from AFOs and for assessment of potential health effect of AFO bioaerosol emissions to the people living near the AFOs facilities.
Materials and Methods
Bioaerosol field sampling was conducted at five locations on a commercial egg production farm (ST1–ST5 in Fig. 1) in North Carolina. This farm had a capability of housing one million laying hens with six mechanically ventilated production houses (houses 1–6), three naturally ventilated houses (houses 93, 102, and 103), one egg packing plant, two wastewater treatment lagoons, and one wastewater spray field.

Locations of bioaerosol sampling stations (ST1–ST5) on the farm (Wang-Li et al., 2013d).
In-house sampling station 1 (ST1) was located immediately upstream of the primary representative exhaust fan (PREF) inside house 4. Since the PREF was the minimum ventilation fan that operated in all seasons, good representative exhaust samples were warranted under most circumstances at this selected location. This house was a tunnel-ventilated high-rise barn holding ∼95,000 hens on the upper floor of the house. Manure fell down into the first floor and was stored there for up to 1 year (Wang-Li et al., 2013d). To qualify the impact of the bioaerosol emissions from this AFO facility on ambient concentration in the vicinity, four ambient sampling stations (ST2–ST5) were set close to the property to represent a reasonable or plausible exposure scenario. Other criteria for site selection included accessibility, security, safety, power availability, and sufficient operation space. A 10 m weather tower was located between house 2 and houses 3 at the east end, sensors were mounted on the tower above the building ridgelines to continuously measure ambient temperature, relative humidity (RH) (Vaisala HMT100; Vaisala, Inc.), wind speed and direction (Model 05103L; R.M. Yong Company), and solar radiation (Model LI-200SL; LiCOR).
Bioaerosol sampling was conducted for 14 days from December 2010 (winter) to July 2011 (summer). Among the 14 sampling days, 5 days were in winter and summer, and 4 days were in spring. On each sampling day, 3 bacteria samples and 3 fungi samples were collected at a 30-minute interval in the morning (i.e., from 10:00 AM through 11:30 AM) and afternoon (i.e., from 1:00 PM through 2:30 PM), respectively. Samples at upwind, downwind, and in-house locations were simultaneously taken. In total, 2064 nonselective airborne bacterial samples and 2058 nonselective airborne fungal samples were collected and analyzed through 3 seasons (winter, spring, and summer) at all five stations to examine temporal and spatial variations of the bioaerosols under different meteorological conditions (Hu, 2012; Hu et al., 2014, 2015).
Andersen six-stage viable samplers (Tisch 1 ACFM Six-stage Viable Particle Sampler; Tisch Environmental, Inc.) were used to take bacterial and fungal samples. The capture size ranges of individual stages are listed in Table 1. To ensure the performance of the viable samplers, the samplers' flow rates were calibrated to the design flow rate at 28.3 L/min before each sampling event, and were checked after sampling using a digital flow meter, Bios DryCal Defender 510-H (0.3–30 LPM) (Bios International Corporation).
Bioaerosols deposited on the four lower stages (stages 3–6) were considered to be respirable while those on the first two stages were nonrespirable.
Collection media for total bacteria was Reasoner's 2A (R2A) agar, which is a non-selective agar that has been found to allow the culturing of many species of bacteria. The collection media for total fungi was Malt Extract Agar (MEA), which is commonly used for the isolation of fungi. To prevent bacterial growth on MEA agar, 1 mL 1000× streptomycin sulfate was added to each 1 L MEA agar after cooling and before dispensing. The prepared agar plates were labeled and stored at 4°C until use to avoid background contamination.
After each sampling event, the bacterial and fungal samples collected at the farm were transported back to the lab on the same day in coolers with ice packs. The samples were then incubated immediately after arrived in the lab under consistent temperatures to allow the colonies to grow. Bacterial samples were incubated for 48 h at 30°C, and fungal samples were incubated for 72 h at room temperature, which was 25°C. After incubation, colony counting was conducted under magnification and with the aid of a colony counter (Quebec Darkfield Manual Colony Counter, Reichert, Inc.). Whenever possible, the numbers of colonies on the whole plate was counted. However, for crowded colonies (any overloaded plate), a special procedure was taken to obtain relatively accurate counts (Andersen, 1958). After the plate reading, bioaerosol number concentration (CFU/m3) was calculated using the following equation:
where, CFU is the colony forming unit, which indicates the numbers of total bacterial or fungal counts on the sampled plate; t is sampling duration; and Qs is sampler flowrate, the average value of presampling flow rate and postsampling flow rate.
Mean number concentrations of bacteria and fungi on each stage of the sampler were calculated by season at five sampling stations to test temporal effects on variations of bioaerosol size distributions. Mean number concentrations of bacteria and fungi on each stage of the sampler at different sampling locations (upwind vs. Downwind) were calculated to test spatial effects on variations of bioaerosol size distributions. Percentages of bioaerosols in each size range were calculated by season at different locations to show portions of bioaerosols in each size ranges. ANOVA tests were conducted to investigate the seasonal, time of day, and spatial variations of PSDs of bioaerosols at source and ambient locations. Stepwise selections were applied to investigate the significant influencing factors (e.g., T/RH, wind, solar radiation, emission rate) affecting downwind bioaerosol concentrations. The statistical analyses were conducted using SAS9.2 software.
Results and Discussion
Bioaerosol size distributions at emission source
To investigate the PSDs of bioaerosols in the poultry house, mean number concentrations of bacteria and fungi on each stage of the samplers were calculated by season and by different time of day (i.e., AM vs. PM) (Supplementary Tables S1 and S2). It was observed that stage 6 (0.65–1.1 μm) had the lowest bacterial concentrations at all time, which indicated that only a small portion of bacteria in the animal house were in this size range. Stage 4 (2.1–3.3 μm) had the highest level of bacterial concentrations in summer, and stage 3 (3.3–4.7 μm) had the highest level of bacterial concentrations in winter and spring but a lower level in summer. Stages 1 (>7 μm) and 2 (4.7–7 μm) had intermediate levels of bacterial concentration in winter and spring but lower levels in summer. Stage 5 (1.1–2.1 μm) had low levels of bacterial concentrations in winter and spring mornings but intermediate levels in spring afternoon and summer. The mean concentrations on different stages indicate that most in-house bacteria were in the size range from 2.1 to 4.7 μm (deposited on stages 3 and 4). The observed variations of in-house bacterial size distributions suggest that seasonal or temporal effects had impacts on bacterial size distributions. The results show that under higher temperature and lower RH levels, there were more bacteria in small size ranges.
Similar to bacteria, the lowest fungal concentrations were discovered on stage 6 most of the time. Stages 1, 3, and 4 had the high fungal concentrations in all seasons over different time periods of day, which indicated there were a great portion of fungi were in the intermediate to large size range. It was observed that sometimes, there was no significant difference among fungal concentrations on the six stages (e.g., spring morning). No significant seasonal or temporal variation of fungal size distribution was observed in the animal house.
Based upon mean concentrations on each stage, the percentages of bioaerosol concentrations in each size range in three seasons at different time of day were calculated to illustrate the portion of bioaerosols in each size range. Figure 2 shows percentages of in-house bacterial and fungal concentrations in each size range in three seasons over different time of day.
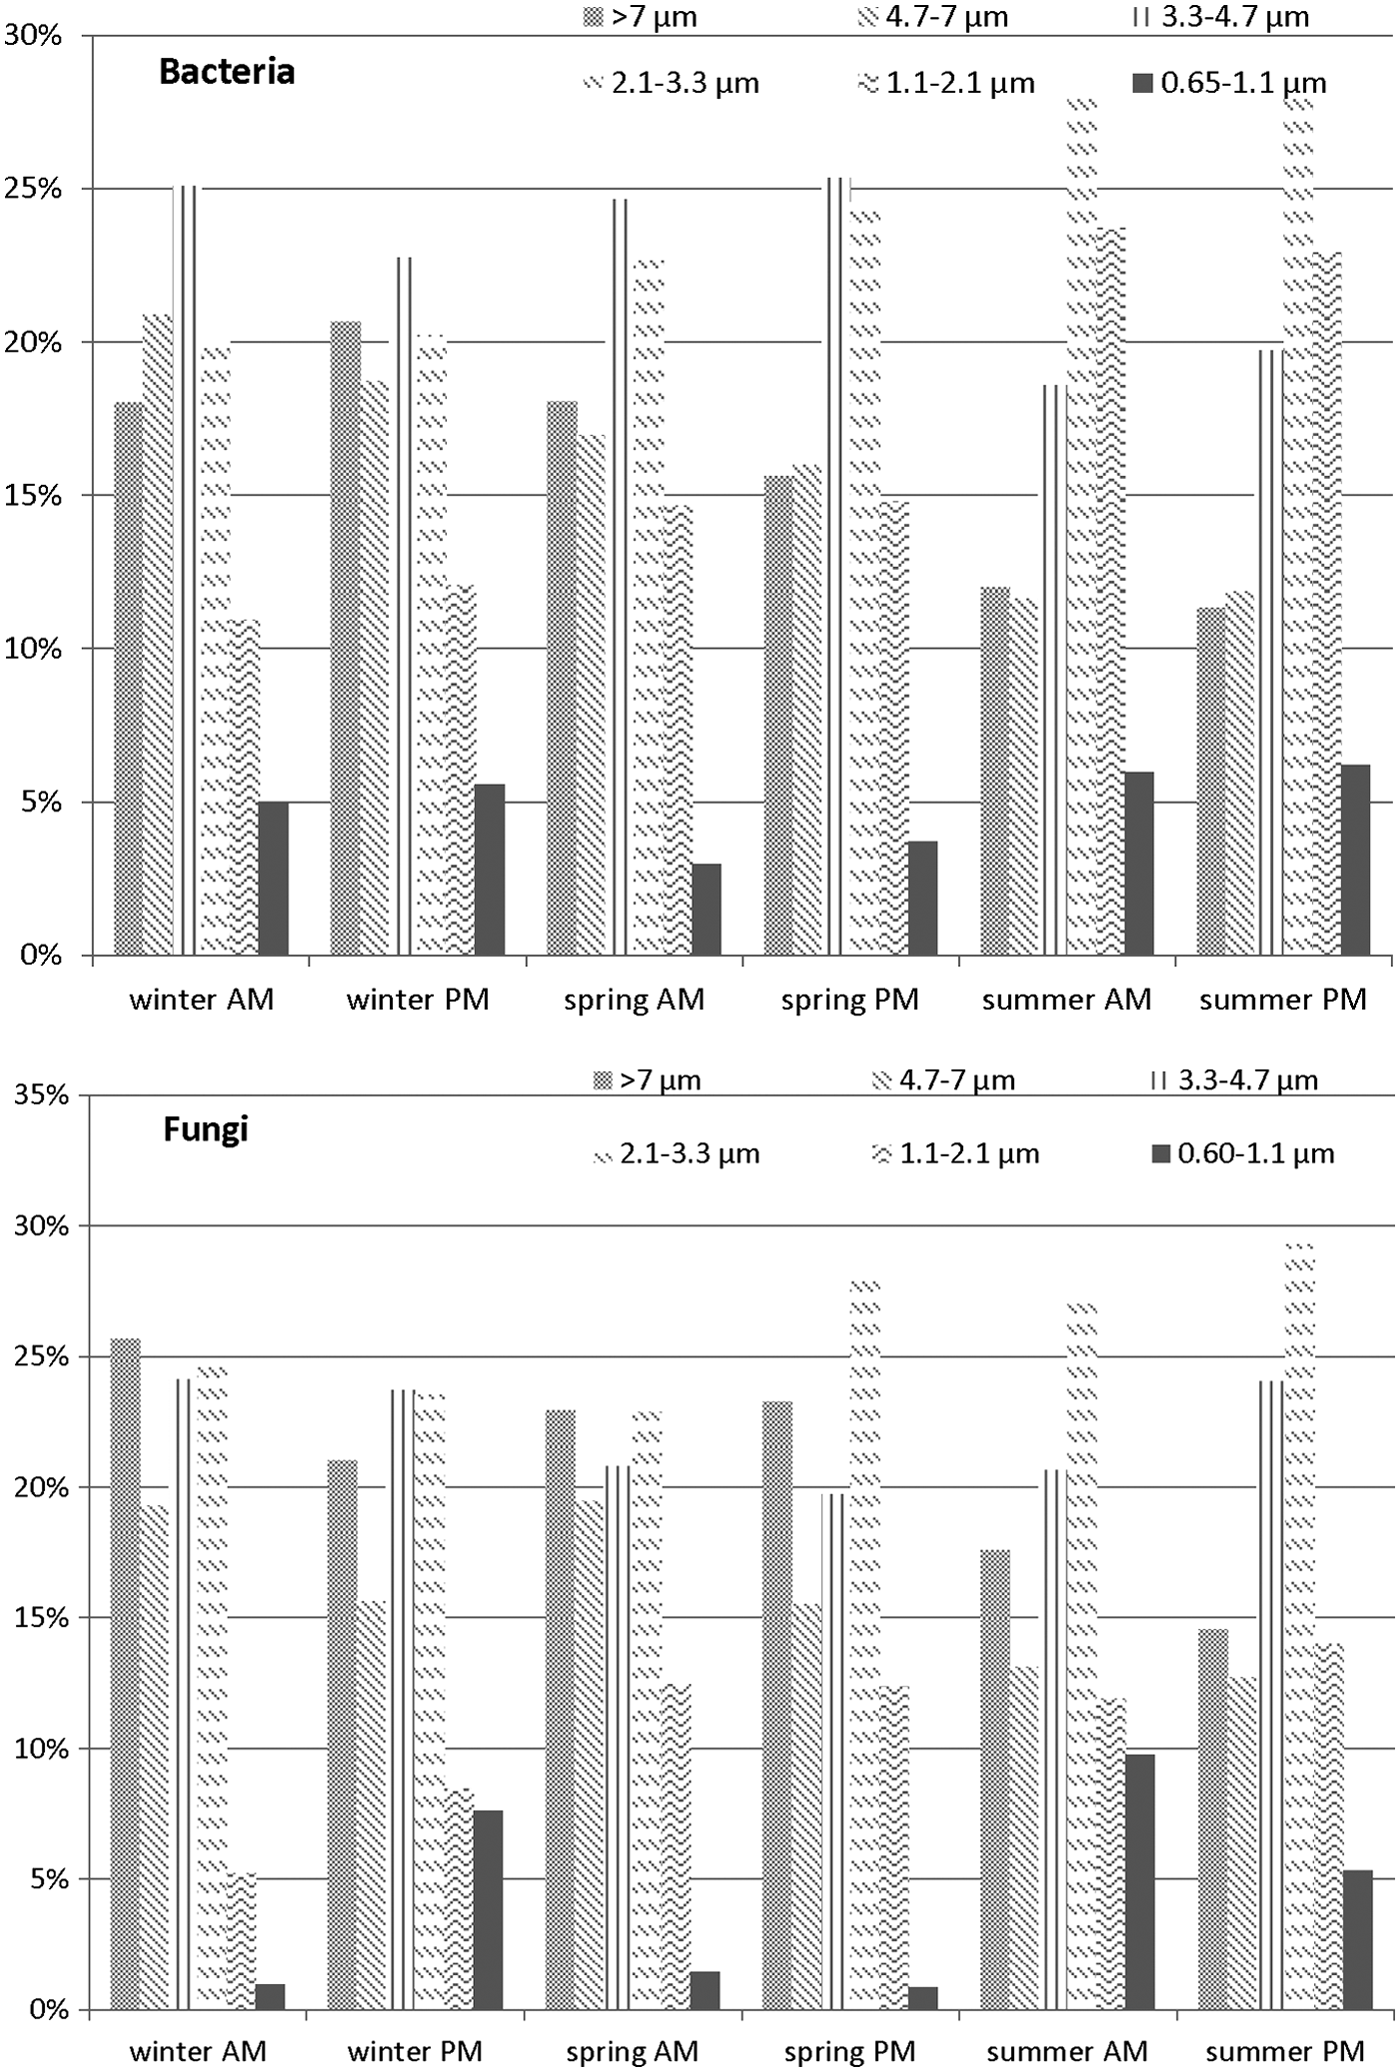
Percentages of in-house bioaerosol and fungi in each size range in difference seasons separated by time of day (i.e., morning = AM and afternoon = PM).
As shown in Fig. 2, in winter and spring, bacteria in 3.3–4.7 μm accounted for the greatest portion (∼25%) of bacteria at source. But in summer, bacteria in 2.1–3.3 μm accounted for the greatest portion (∼28%) to the total bacteria collected in six stages at source. Most bacteria detected in the animal house were respirable. The portion of respirable bacteria ranged from 60% (in winter) to 80% (in summer).
Fungal spores that were greater than 7 μm accounted for 20–25% of total measured fungi at source in winter and spring, but accounted less than 20% in summer. Fungi with intermediate sizes in 2.1–4.7 μm accounted for more than 40% of fungi at source. The portion of respirable fungi ranged from 60% (in winter and spring) to 70% (in summer). This observation indicated that exposure to bioaerosols in the animal house might bring risks to human beings and animals because most of the bioaerosols in respirable range can be inhaled and cause adverse health effects.
Based on the percentage of respirable bioaerosols in each test, mean percentages with standard deviations (SDs) of respirable bioaerosols at source were calculated by different seasons and time of day. Figure 3 shows the portions of respirable bacteria and fungi at source. Respirable percentages of bacteria at source were not significantly different in different time periods of day (p = 0.5063). But they were significantly higher in summer, and were not significantly different in spring and winter at a 0.05 level. Fungal respirable percentages showed a similar trend. The percentages of respirable fungi at source were not significantly different over different time of day (p = 0.5301), but were significantly higher in summer, and were not significantly different in spring and winter at a 0.05 level. The overall mean respirable percentage of bacteria was significantly higher than fungi (p < 0.0001).
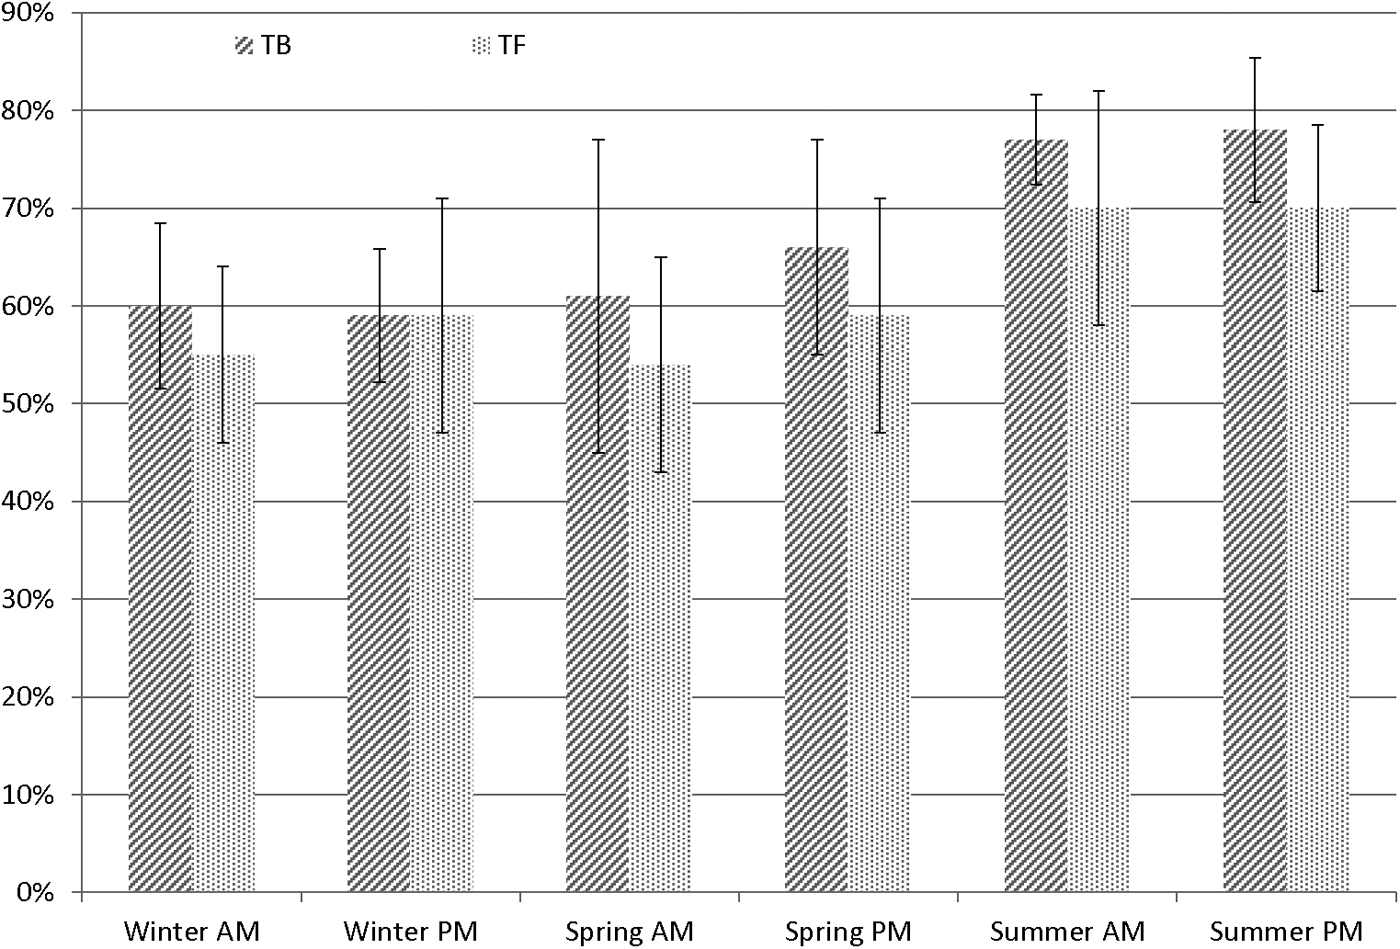
Percentages of in-house bacteria (TB) and fungi (TF) in respirable range in difference season separated by time of day (i.e., AM = morning and PM = afternoon).
Bioaerosol size distributions at ambient locations
To investigate seasonal effects on ambient bioaerosol PSDs, mean concentrations with SDs of ambient bacteria and fungi on each stage at each ambient station were calculated by season. (Supplementary Tables S3 and S4). It was observed that bacterial concentrations on each stage were significantly different in winter at ST2–5. But there were no significant differences among bacterial concentrations on each stage in spring and summer at ST2–5. This observation indicated that seasonal effects had impacts on bacterial size distributions in the ambient locations. There were significant differences among fungal concentrations on each stage in three seasons at ST2–5. In winter, stage 5 had the highest fungal concentrations; while in spring and summer, stage 4 had the highest fungal concentrations. The observed variations of fungal size distributions indicated that in warmer weathers, larger particles accounted for more of ambient fungi.
Percentages of bacterial and fungal concentrations on each stage in different seasons at ST2–5 were calculated and are shown in Tables 2 and 3.
SD, standard deviation.
In winter, bacterial concentrations were the highest on stages 4–5 at ST2–4. ST5 had the highest bacterial concentration on stage 1. Most of fungi deposited on stage 5 at all stations. At ST2–4, approximate 80% of bacteria were respirable, but only about 55% at ST5 were respirable. However, 70–90% of fungi at ambient stations were respirable.
In spring, bacteria were evenly distributed on the first five stages at ST2 and ST5 and were the highest on stage 1 at ST3 and ST4. Meanwhile, stages 4 and 5 had the highest fungal concentrations at all stations (ST2–5) in spring. Portions of respirable bacteria ranged from 50% to 80% at different ambient stations, and 80% to 87% of fungi at ambient stations were respirable in spring.
In summer, stages 3–5 had the highest bacterial concentrations at ST4 and ST5. Stages 4–5 had the highest bacterial concentrations at ST3. Bacteria (60–75%) at ambient stations were respirable in summer. It was observed that sometimes, stage 1 had the highest bacterial concentrations at some stations. This might be because these stations were at upwind for most time of the season, and the bacteria collected at this station were mainly from background or other sources. Stages 3 and 4 had high level of fungal concentrations at all stations in summer. Stage 2 also had high fungal concentration at ST5. Fungi (60–70%) at ambient stations were respirable in summer. As weather got warmer, the portions of larger fungal particles increased at ambient stations. Therefore, portions of respirable fungi decreased from winter to summer.
Based on the percentage of respirable bioaerosols in each test, mean percentages with SD of respirable bioaerosols at each ambient station were calculated by different seasons and time of day. As shown in Table 4, at ST2, bacterial respirable percentages were not significantly different over different time of day (p = 0.4494), nor different over three seasons (p = 0.9606). Contradictorily, fungal respirable percentages were greater in the morning than afternoon (p = 0.0067). Fungal respirable percentages were the smallest in summer, and were not significantly different from winter to spring at a 0.05 level.
At ST3, bacterial respirable percentages were not significantly different over different time of day (p = 0.8978). Bacterial respirable percentages were the greatest in winter and the lowest in spring (p = 0.0014). Fungal respirable percentages were not significantly different over different time of day either (p = 0.2529), and were the greatest in spring and the smallest in summer (p = 0.0019).
At ST4, bacterial respirable percentages were not significantly different over different time of day (p = 0.54), and were the smallest in spring (p < 0.0001). There was no significant difference between bacterial respirable percentages in winter and summer at a level of 0.05. Fungal respirable percentages were higher in the morning than in the afternoon at ST4 (p = 0.001). There was no significant difference among fungal respirable percentages in winter, spring, and summer (p = 0.3067).
At ST5, bacterial respirable percentages were not significantly different over different time of day (p = 0.2496), or over different seasons (p = 0.0897). Fungal respirable percentages were not significantly different over different time of day, either (p = 0.5897). Fungal respirable percentages were the smallest in summer, and were not significantly different in winter and spring at a 0.05 level.
Overall mean bacterial respirable percentages were the greatest at ST4 and ST3, and were the smallest at ST5 at a 0.05 level. The overall mean fungal respirable percentages were not significantly different over the four ambient stations (p = 0.989).
To investigate upwind/downwind effects, mean concentrations with SDs of ambient bacteria and fungi on each stage were calculated by upwind and downwind locations (Supplementary Tables S5 and S6). Percentages of bacterial and fungal concentrations on each stage at upwind and downwind were calculated and are shown in Fig. 4 It was observed that downwind locations had a larger portion of smaller bacterial particles. Fungi did not show a spatial variation in size distributions. There was no significant difference among bacterial concentrations on each stage at upwind. It indicated that sizes of background bacteria distributed evenly from 0.65 to >7 μm. Stages 4–5 had the highest bacterial concentrations at downwind, which might be because more small particles transported to ambient stations with wind than larger particles. At upwind, fungal concentrations on the first five stages (stages 1–5) were not significantly different. At downwind, stages 3–4 had the highest fungal concentrations. This variation was similar to bacteria except that the majority of fungi were in a larger size range.
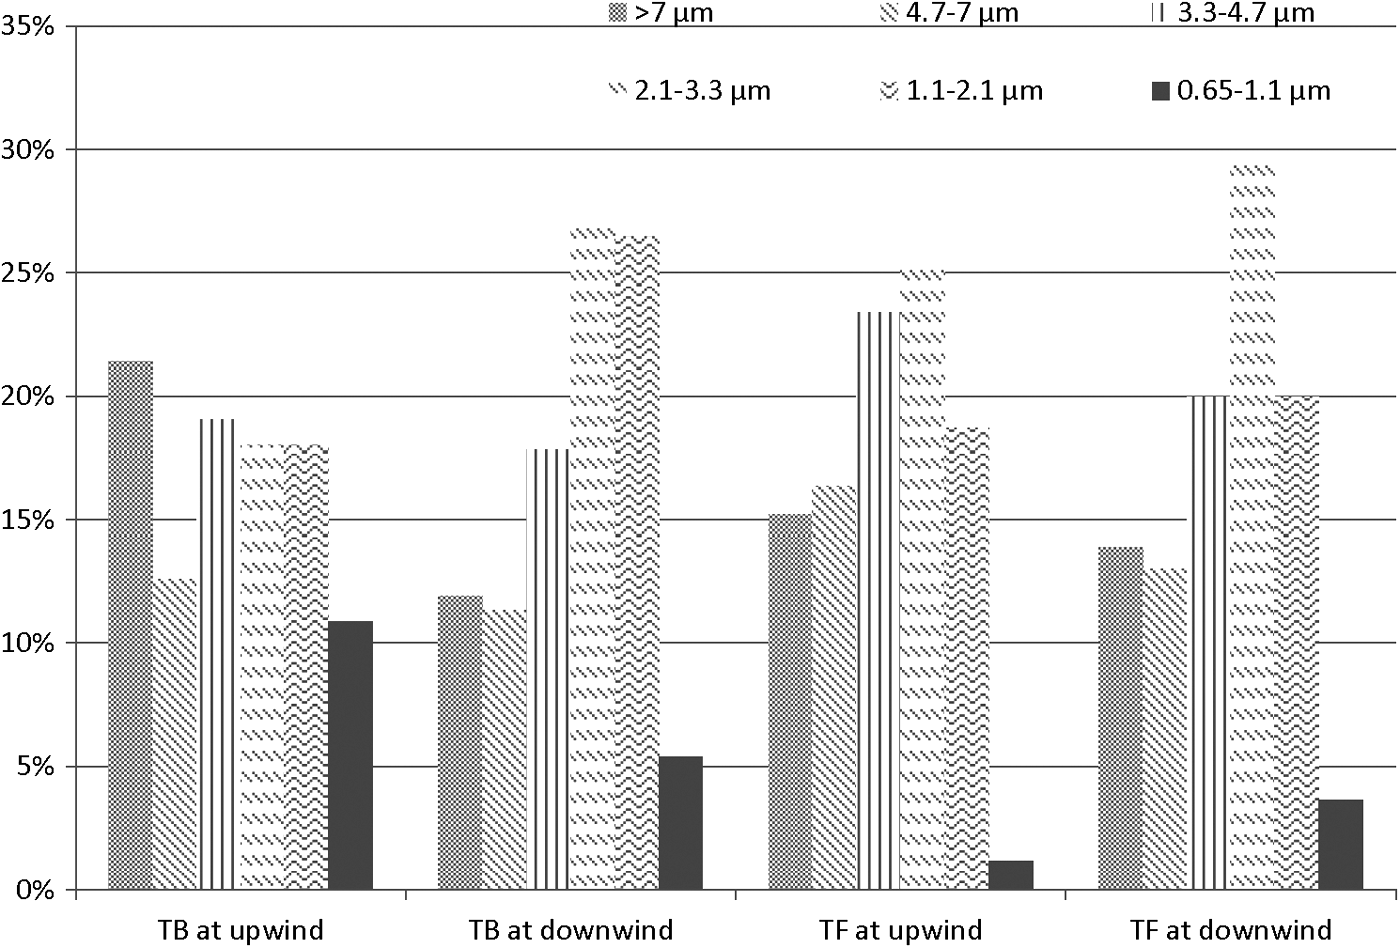
Percentages of bacterial (TB) and fungal (TF) concentrations in each size range at unwind and downwind.
Based on the percentage of respirable bioaerosols in each test, mean percentages with SDs of respirable bioaerosols upwind and downwind were calculated. Figure 5 shows the portions of respirable bacteria and fungi at downwind and upwind locations. As shown in this figure, bacterial respirable percentages were significantly greater upwind than downwind (p < 0.0001), whereas fungal respirable percentages were not significantly different upwind and downwind (p = 0.7444). The difference in respirable portions of bacteria and fungi indicate that bacteria and fungi may respond to the influencing factors differently.
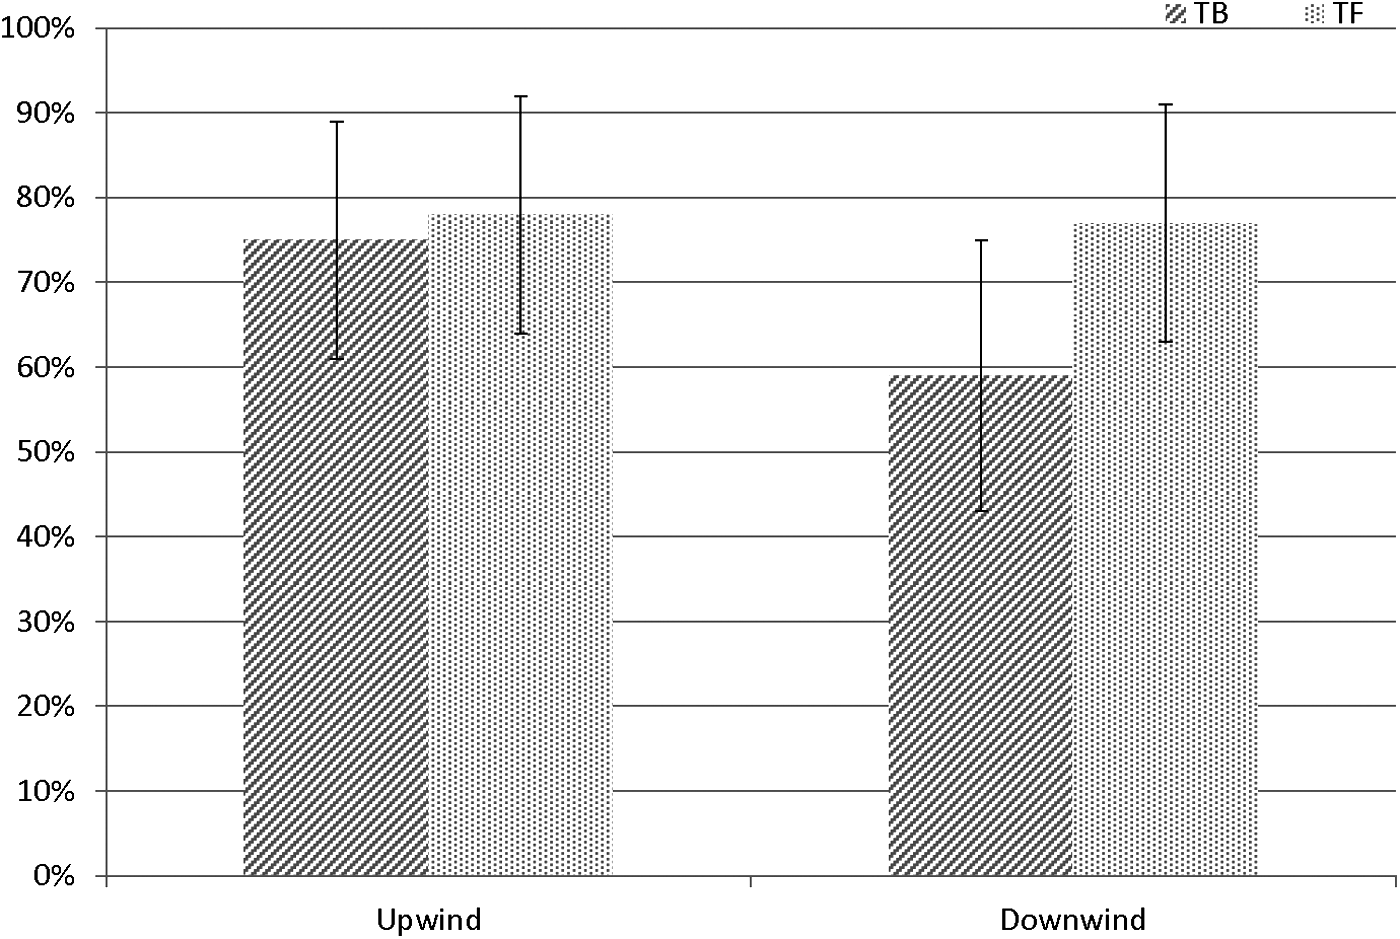
Percentages of bacteria (TR) and fungi (TF) in respirable range at upwind and downwind.
Summary and Conclusions
In this project, nonselective bacterial and fungal concentrations in various size ranges were measured using Andersen six-stage sampler at the emission source of an egg production farm and in the vicinities. It was discovered that bacterial PSDs at source were different among seasons. Under higher temperature and lower RH conditions, more bacterial fell into small size ranges. No significant seasonal or temporal variation of fungi size distribution was observed in the animal house. The portion of respirable (≤4.7 μm) bacteria ranged from 60% to 80%, and that of respirable fungi ranged from 60% to 70% in the poultry house in three seasons. Bioaerosol size distributions at ambient stations were different among stations in winter but were not in spring and summer. There were significant differences in fungal size distributions among ambient stations in three seasons. The percentages of respirable bacteria at ambient stations ranged from 50% to 80%, and that of fungi ranged from 60% to 90% in different seasons. These results indicated that there might be high exposures of bioaerosols for people working on or living near the animal farms.
Footnotes
Acknowledgements
This study was supported by NSF CAREER Award No. CBET-0954673. Help from Qianfeng Li and Manqing Ying for field sampling is also thankfully acknowledged. The authors would also like to thank the egg production farm for their generous support.
Author Disclosure Statement
No competing financial interests exist.
References
Supplementary Material
Please find the following supplemental material available below.
For Open Access articles published under a Creative Commons License, all supplemental material carries the same license as the article it is associated with.
For non-Open Access articles published, all supplemental material carries a non-exclusive license, and permission requests for re-use of supplemental material or any part of supplemental material shall be sent directly to the copyright owner as specified in the copyright notice associated with the article.