
Abstract
Abstract
Physical and chemical transformations and biological responses of silver nanoparticles (AgNPs) in wastewater treatment systems are of particular interest because of the extensive existing and continually growing uses of AgNPs in consumer products. In this study, we investigated the transformation of AgNPs and AgNO3 during thermophilic anaerobic digestion and effects on selection or transfer of antibiotic resistance genes (ARGs). Ag2S-NPs, sulfidation products of both AgNPs and AgNO3, were recovered from raw and digested sludges and were analyzed by analytical transmission electron microscopy (TEM) and X-ray absorption spectroscopy (XAS). TEM and XAS revealed rapid (≤20 min) Ag sulfidation for both Ag treatments. Once transformed, Ag2S-NPs (as individual NPs or an NP aggregate) persisted for the duration of the batch digestion. The digestion process produced Ag2S-NPs that were strongly associated with sludge organics and/or other inorganic precipitates. Ag treatments (up to 1,000 mg Ag/kg) did not have an impact on the performance of thermophilic anaerobic digesters or ARG response, as indicated by quantitative polymerase chain reaction measurements of sul1, tet(W), and tet(O) and also intI1, an indicator of horizontal gene transfer of ARGs. Thus, rapid Ag sulfidation and stabilization with organics effectively sequester Ag and prevent biological interactions with the digester microbial community that could induce horizontal gene transfer or adversely impact digester performance through antimicrobial activity. This finding suggests that sulfide-rich anaerobic environments, such as digesters, likely have a high buffer capacity to mitigate the biological effects of AgNPs.
Introduction
U
First discovered and characterized chemically and structurally at the nanoscale by Kim et al. (2010), Ag in final sewage sludge products was previously noted to be predominantly in the form of highly insoluble Ag2S (Lytle, 1984; Kim et al., 2010; Kaegi et al., 2011). In fact, sulfidation processes are the most likely environmentally relevant detoxification process for engineered AgNPs (Levard et al., 2013). Sulfidation of AgNPs has been observed to decrease Ag toxicity toward nitrifying (Choi et al., 2009), Gram-negative (Escherichia coli and Shewanella oneidensis) (Suresh et al., 2011; Reinsch et al., 2012), and Gram-positive (Bacillus subtilis) bacteria (Suresh et al., 2011). Furthermore, increased sulfide concentrations result in a significant decrease in the dissolution rate of AgNPs (as a source of Ag+ ions) (Levard et al., 2011; Kent et al., 2014).
Laboratory-scale studies have indicated that AgNPs did not have an effect on anaerobic digestion process performance or levels of antibiotic resistance genes (ARGs) [intI1, sul1, sul2, tet(O), and tet(W)] in digested sludge (Yang et al., 2012; Miller et al., 2013). However, the relationship between environmental transformation processes and products of AgNPs and biological measures, including anaerobic digestion performance and the potential selection or transfer of ARGs among bacteria in the digester microbial community, is not fully understood. In particular, the following questions still remain unanswered: (1) the differences in sulfidation reactions of different types of Ag, (2) the differences in the physical and/or chemical properties of Ag2S-NPs in raw and digested sludges and their interactions with sludge matrices during anaerobic digestion, and finally (3) the effects of AgNPs relative to ionic Ag (dosed as AgNO3) on ARGs and their propagation.
The primary objective of the present study was therefore to investigate the sulfidation of AgNPs and AgNO3 during thermophilic anaerobic digestion while also measuring biological responses of the digester microbial community with respect to process performance and fate of select ARGs and the Class 1 integron integrase gene, intI1. Ag2S nanocrystals, defined as sulfidation products of AgNPs and AgNO3 that were recovered from AgNP- and AgNO3-amended digesters, were extensively characterized by analytical transmission electron microscopy (TEM) for their sizes, compositions, aggregation states, morphologies, and crystallinity. We also used extended X-ray absorption fine structure (EXAFS) spectroscopy to obtain the average Ag speciation in raw and digested sludges.
The biological response to AgNP and AgNO3 amendments was assessed by evaluation of digester performance parameters and sul1, tet(O), tet(W), and intI1 measurements by quantitative polymerase chain reaction (qPCR) in raw sludge and both AgNP- and AgNO3-amended digesters. Although intI1 does not encode resistance, Gillings et al. (2014) proposed using intI1 as a relative indicator of adverse environmental impacts, including resistance to metals, disinfectants, and antibiotics, because it is located in the conserved region of Class 1 integrons.
Class 1 integrons are the largest, most prevalent integron class, contain most integron-associated ARGs, and are typically associated with mobile genetic elements subject to horizontal gene transfer. sul1 is also located in the conserved region of Class 1 integrons and encodes resistance to sulfonamides, including sulfamethoxazole (Mazel, 2006). ARGs tet(O) and tet(W), which enable resistance to tetracyclines by protecting the ribosomes, were targeted because they have been shown to be associated with wastewater sources (Storteboom et al., 2010). In addition, these genes have been used as indicators in other digestion studies (Diehl and LaPara, 2010; Ma et al., 2011; Miller et al., 2013) and thus serve as useful points of reference between studies.
Materials and Methods
Preparation and characterization of AgNP suspension and AgNO3 stock solution
AgNPs were prepared as described by Solomon et al. (2007). Briefly, 10 mL of 1.0 mM AgNO3 (Sigma-Aldrich, St. Louis, MO) was added dropwise to 30 mL of ice-cold 2.0 mM NaBH4 solution and stirred vigorously. After 3 min, the suspension turned a bright yellow color and stirring was stopped. Trisodium citrate was added to improve colloidal stability with a final solution concentration of 2 mM. The suspension was bath sonicated for 15 min, then filtered through a 0.1-μm polytetrafluoroethylene filter (EMD Millipore, Billerica, MA), sealed, and stored in the dark at 4°C until use.
The citrate-AgNPs were expected to have a mean primary particle diameter of 12 ± 3.4 nm with a spherical shape (Solomon et al., 2007). Dynamic light scattering (Malvern Zetasizer Nano ZS; Malvern, United Kingdom) results showed the hydrodynamic diameter (Zave) of the AgNPs to be 44.6 ± 3.88 nm, with the polydispersity indices ranging from 0.524 to 0.885. The zeta potentials of the citrate-AgNPs were measured to be −50.8 ±1.35 mV.
Total Ag concentration of the AgNP suspension was measured using a Thermo Electron X-Series inductively coupled plasma-mass spectrometer (ICP-MS), preceded by nitric acid digestion. Final Ag concentration of the AgNP suspension was adjusted by measured recovery in an Ag standard that underwent nitric acid digestion, followed by ICP-MS quantification. Samples and calibration standards were prepared in a matrix of 2% nitric acid to minimize adsorption to sample tubing or internal instrument surfaces. For the ionic Ag stock solution, AgNO3 was dissolved in distilled water to achieve a target concentration of 10.4 mg Ag/L.
Wastewater treatment plant sludge characteristics
Raw sludge was sourced from a local wastewater treatment plant (WWTP) that receives predominantly residential wastewater with minimal industrial contribution and no hospital contributions. The solids processing consisted of two mesophilic digesters, a gravity belt thickener, and sludge storage in concrete basins before Class B land application. The total S in the raw and digested sludges for the present study was measured to be 6.45 ± 1.88 g/kg by the ICP atomic emission spectroscopy analysis after using the USEPA-approved, microwave-assisted nitric acid digestion technique in the MARS system (SW 846-3051-Mars; CEM Corporation, Matthews, NC). The municipality was required to collect annual biosolid samples for routine analysis of microbiological, inorganic, and organic constituents, including Cl, Ca, and Ag. The annual sample was reported with Cl 5.72 g/kg, Ca 25.2 g/kg, and Ag <14.9 mg/kg.
Experimental design
Batch thermophilic anaerobic digesters were constructed using 125-mL glass anaerobic media bottles with a target concentration of 1,000 mg Ag/kg of total solids (TS) for both AgNP and AgNO3 amendments, with samples collected before (raw) and after (digested) the 22-day incubation period. A total of four Ag conditions (AgNP-amended raw and digested sludges and AgNO3-amended raw and digested sludges) were prepared for this batch experiment. For simplicity in notation, we use RS for raw sludge and DS for digested sludge from now on. Both RS and DS were subject to quantification of ARGs and intI1 via qPCR as well as analytical TEM and X-ray absorption spectroscopy (XAS) analyses.
The target Ag concentration (1,000 mg Ag/kg) was much higher than the baseline Ag concentration in the background WWTP biosolids to ensure its recovery after addition (i.e., RS) as well as after the 22-day incubation (i.e., DS). It facilitated detection of Ag spiked into the complex and heterogeneous sewage sludge matrices when using analytical TEM-based techniques described below. Furthermore, this target Ag concentration was comparable to the highest Ag concentration in final sludge products reported by the USEPA (2009), where the agency analyzed 84 final sludge products (including replicated samples) collected from 74 WWTPs in 35 states.
RS sample preparation
RS samples were prepared with a raw sludge mixture of 70% primary sludge and 30% thickened waste-activated sludge. Digester seed and NaHCO3 were not added to the raw sludge mixture. The raw sludge mixture was then amended with either AgNP or AgNO3 stock, with vigorous stirring in a 1-L glass beaker, to target 1,000 mg Ag/kg of sludge material. Samples for total and volatile solids, pH, alkalinity, and qPCR were collected from the beaker. The final mixture was not centrifuged or filtered, so both solid- and liquid-phase Ag remained in the mixture. This mixture was apportioned in ∼20-mL increments into 50-mL centrifuge tubes (to accommodate the canister sizes of a freeze-drier) and immediately frozen at −80°C. The sample preparation required <20 min. Frozen samples were then freeze-dried.
DS sample preparation
Thermophilic anaerobic digestion was simulated in the laboratory using 125-mL glass anaerobic media bottles filled with the raw sludge mixture, digested sludge seed, and Ag amendments. Specifically, the raw sludge mixture of 70% primary sludge and 30% thickened waste-activated sludge was amended with 4 g/L NaHCO3 to provide excess buffering capacity against acid production during digestion. Digested sludge seed was obtained from a laboratory-scale thermophilic anaerobic digester (53°C, 12-day solids retention time) that had been operating for ∼8 months with daily feeding of raw sludge, also sourced from the same WWTP. Digested sludge was added to seed microbial populations that are responsible for digestion.
The raw sludge mixture and digested sludge were combined in a 6:3 ratio in a 9.5-L plastic bucket. The mixture was then amended with either AgNP or AgNO3 stock, with vigorous stirring, to target 1,000 mg Ag/kg of sludge material. The final mixture was apportioned in 100-mL increments into 10 anaerobic media bottles. Each bottle was purged with nitrogen and then sealed with a butyl rubber stopper and aluminum crimp seal. Bottles were placed in a 53°C water bath (Thermo Haake Circulator DC10, Newington, NH) and incubated for 22 days until gas production leveled off. Bottles were hand mixed, and evolved gas volumes were released and measured every 8 h to 2 days using Standard Method 2720 (A.P.H.A./A.W.W.A./W.E.F., 1995).
After digestion, anaerobic media bottles were opened, and the contents were poured into a 9.5-L bucket and mixed thoroughly, with attention given to minimizing aeration. Samples for total and volatile solids, pH, alkalinity, and qPCR were collected from the combined bottle contents. Initial and final total and volatile solids (Method 2540-G), total alkalinity (Method 2320-G), and pH (Method 4500) were analyzed as specified in Standard Methods for the Examination of Water and Wastewater (A.P.H.A./A.W.W.A./W.E.F., 1995). Remaining amended digested sludge was apportioned in ∼20-mL increments into 50-mL centrifuge tubes and then immediately frozen (−80°C), before later freeze-drying.
ARG quantification
DNA was extracted in triplicate from 250 μL of raw or digested sludge using FastDNA Soil Kit (MP Biomedicals, Solon, OH) according to the manufacturer's protocol. To address PCR inhibition, a subset of DNA extracts was subject to dilution series to identify the lowest dilution that yielded a consistent qPCR signal (in this case, 50×), as described by Ma et al. (2011). Diluted DNA extracts were stored at −20°C until analysis by qPCR for bacterial 16S rRNA genes, sul1, tet(O), tet(W), and intI1. A 10 μL of reaction mixture comprised 5.0 μL of SsoFast EvaGreen Supermix (Bio-Rad, Hercules, CA), 0.8 μL of each 5 μM primer (Supplementary Table S1), 2.4 μL of molecular biology grade water, and 1 μL of DNA template. All samples were quantified in triplicate. Standards prepared from serial dilutions of cloned genes ranged from 102 to 108 gene copies/μL. Standards and a reagent blank were included in each run. Melt curve peaks were evaluated and compared to the standards for each plate to ensure that there were no primer dimers or nontarget sequence amplification.
Microsoft Excel 2007 was used to calculate means and standard error for all data. R-2.8.1 was used to perform Student's t-tests on log ARG gene copy numbers and ARG ratios between (1) test digesters and the control digester and (2) all digesters and the raw sludge feed. A p-value <0.05 was considered to indicate a significant difference between means.
Electron microscopy sample preparation and analyses
First, Ag-amended (AgNO3 and AgNPs) raw and digested sludge samples were digested using the microwave digestion technique (with nitric acid). The recovery of added Ag (regardless of the Ag source) was estimated to be 75% ± 8.2%, ensuring the spiking processes were within the targeted concentration range. Then, the TEM samples of raw and thermophilically digested AgNP- or AgNO3-amended sludges were made by closely following the sample preparation protocols used in our previous studies with sludge and biosolid materials.
In brief, several subsamples of the frozen sewage sludge material were taken from the glass jar and were freeze-dried. This collection method, along with the procedure described below, assures that we are collecting and mounting a representative sample for TEM analysis that is as close to the average sludge material as possible. This method has been shown to be effective in our previous studies (Kim et al., 2010, 2012, 2014). After freeze-drying, sewage sludge powder samples were gently ground with mortar and pestle. A half gram of the sewage sludge powder was then added to a 30-mL glass centrifuge tube with 5 mL of deionized water. The sewage sludge slurry solution was mixed thoroughly and sonicated in a water bath (UltraSonic Bath model 2510, maximum frequency at 42 kHz; Branson Ultrasonics, Danbury, CT) for 1 h.
One milliliter of the slurry solution was then diluted 200-fold with methanol (acetone free; Fisher Scientific, Waltham, MA). Methanol was our choice of organic solvent because it mixes well with organic-rich sewage sludge materials and evaporates rapidly for the TEM sample preparations. A drop of the methanol suspension was placed onto a 200-mesh copper (Cu) TEM grid with lacey carbon support film (Electron Microscopy Sciences, Hatfield, PA) and then allowed to evaporate. This method used for this particular material provides the optimal amount of particle/aggregate deposition on the grid. It provides a large amount of material for TEM analysis on a single grid, yet without too much material that would prove difficult to analyze due to interference between and among overlapping particles and aggregates.
An FEI Quanta 600 FEG scanning electron microscope equipped with a Bruker QUANTAX 400 Energy Dispersive X-ray (EDX) Spectrometer was used for the initial examination of the condition of the TEM grids and for the preliminary characterization of particles containing Ag on the grid before the TEM analysis. Backscattered electron mode, at 20 kV, was used to discern higher atomic number (Z) elements, such as Ag, from the generally lighter, organic-rich sewage sludge matrix. This is a definitive and highly efficient screening technique that allowed us to direct our attention only to clusters in the complex matrix that contained at least some heavier elements (Kim et al., 2012, 2014).
Using this technique, we found several aggregates of Ag2S-NPs from each sludge sample (total numbers of Ag2S-NP aggregates identified and analyzed for the present study: 21). Based on our observations and EDX analyses, all aggregates seem to have a similar size, composition, and aggregation state. Among them, we chose one or two aggregate(s) for further high-resolution TEM (HRTEM) analyses per each treatment.
The TEM used in this study was an FEI Titan 80-300 FEG TEM, operated at 300 kV for the present work. This microscope is equipped with an EDX Spectrometer (EDAX r-TEM) for chemical analysis. In addition, a Fischione model 3000 high-angle annular dark-field (HAADF) detector was used to sample electrons scattered to relatively high angles (typically about 50–200 mrad) for Z-contrast imaging in the scanning TEM (STEM) mode. The chemical composition of individual particles of interest was examined with a lateral spatial resolution of ∼1 nm using the STEM mode.
XAS sample preparation and analyses
Silver K-edge EXAFS spectra were collected at the Stanford Synchrotron Radiation Lightsource (SSRL) on beam line 4-1. A N2-cooled Si(220) (Φ = 90) double crystal monochromator was used and detuned by 20% for harmonic rejection. Energy calibration was performed with an Ag metal foil placed after the I1 transmitted beam detector. The samples were run in fluorescence mode using a 13-element Ge detector in a N2-cooled cryostat to reduce noise due to thermal motion and possible beam reduction. EXAFS spectra of the following reference compounds were collected in transmission mode under liquid N2-cooled cryostat: AgCl, AgNO3, Ag2S, Ag2SO4, Ag-acetate, Ag2O, Ag3PO4, Ag2CO3, and Ag–glutathione (Ag–GSH) as a simple proxy for Ag bound to thiol-containing organics.
Detailed procedure for the preparation of Ag–GSH and its shell-by-shell fitting of EXAFS spectra is provided in Supplementary Table S2 and Supplementary Fig. S1. Model compounds were diluted with glucose powder to achieve an optimized absorption jump of 1. Linear combination fitting (LCF) of the EXAFS data was performed using the SIXPack interface (Webb, 2005) to the IFEFFIT XAFS analysis package (Newville, 2001). The LCF of all possible permutations of the selected reference list was calculated. The R-value, defined as the sum of the square of the residuals divided by the sum of the squares of the data set, was used to estimate the goodness of fit. During the LCF, new species should only be included when adding that species to the fit decreases the R-value by >20%.
Results and Discussion
Effect of AgNPs and AgNO3 on digestion performance
There were no observed effects of AgNP or AgNO3 addition up to a concentration of 1,000 mg Ag/kg TS (equivalent to ∼6 mg Ag/L) on digestion performance indicators. Total gas volume production was normalized to initial TS for the control (46.6 ± 2.2 mL gas/g TS), AgNO3 amended (47.2 ± 2.6 mL gas/g TS), and AgNP amended (48.2 ± 2.3 mL gas/g TS). Statistical analyses indicated no difference between the control and Ag-amended total gas volumes (0.33 < p < 0.75). Volatile solids reduction was essentially identical for the control (55.1%), AgNO3 amended (55.8%), and AgNP amended (55.9%). We, therefore, conclude that neither the AgNP nor the AgNO3 amendments affected the stability or biochemical processes of anaerobic digestion systems.
Effect of AgNPs and AgNO3 on ARG response
The results of qPCR are provided in Fig. 1 as gene copy number normalized to 16S bacterial rRNA gene copy number (ARG:16S ratios), as well as gene copy number per gram TS (ARG:solids ratios). Normalization accounts for minor variability in DNA extraction efficiencies and biomass between samples. ARG:16S ratios (Fig. 1) roughly represent an average gene count per bacterial cell and thus aid in normalizing changes in ARG copy numbers resulting from biomass growth or death.
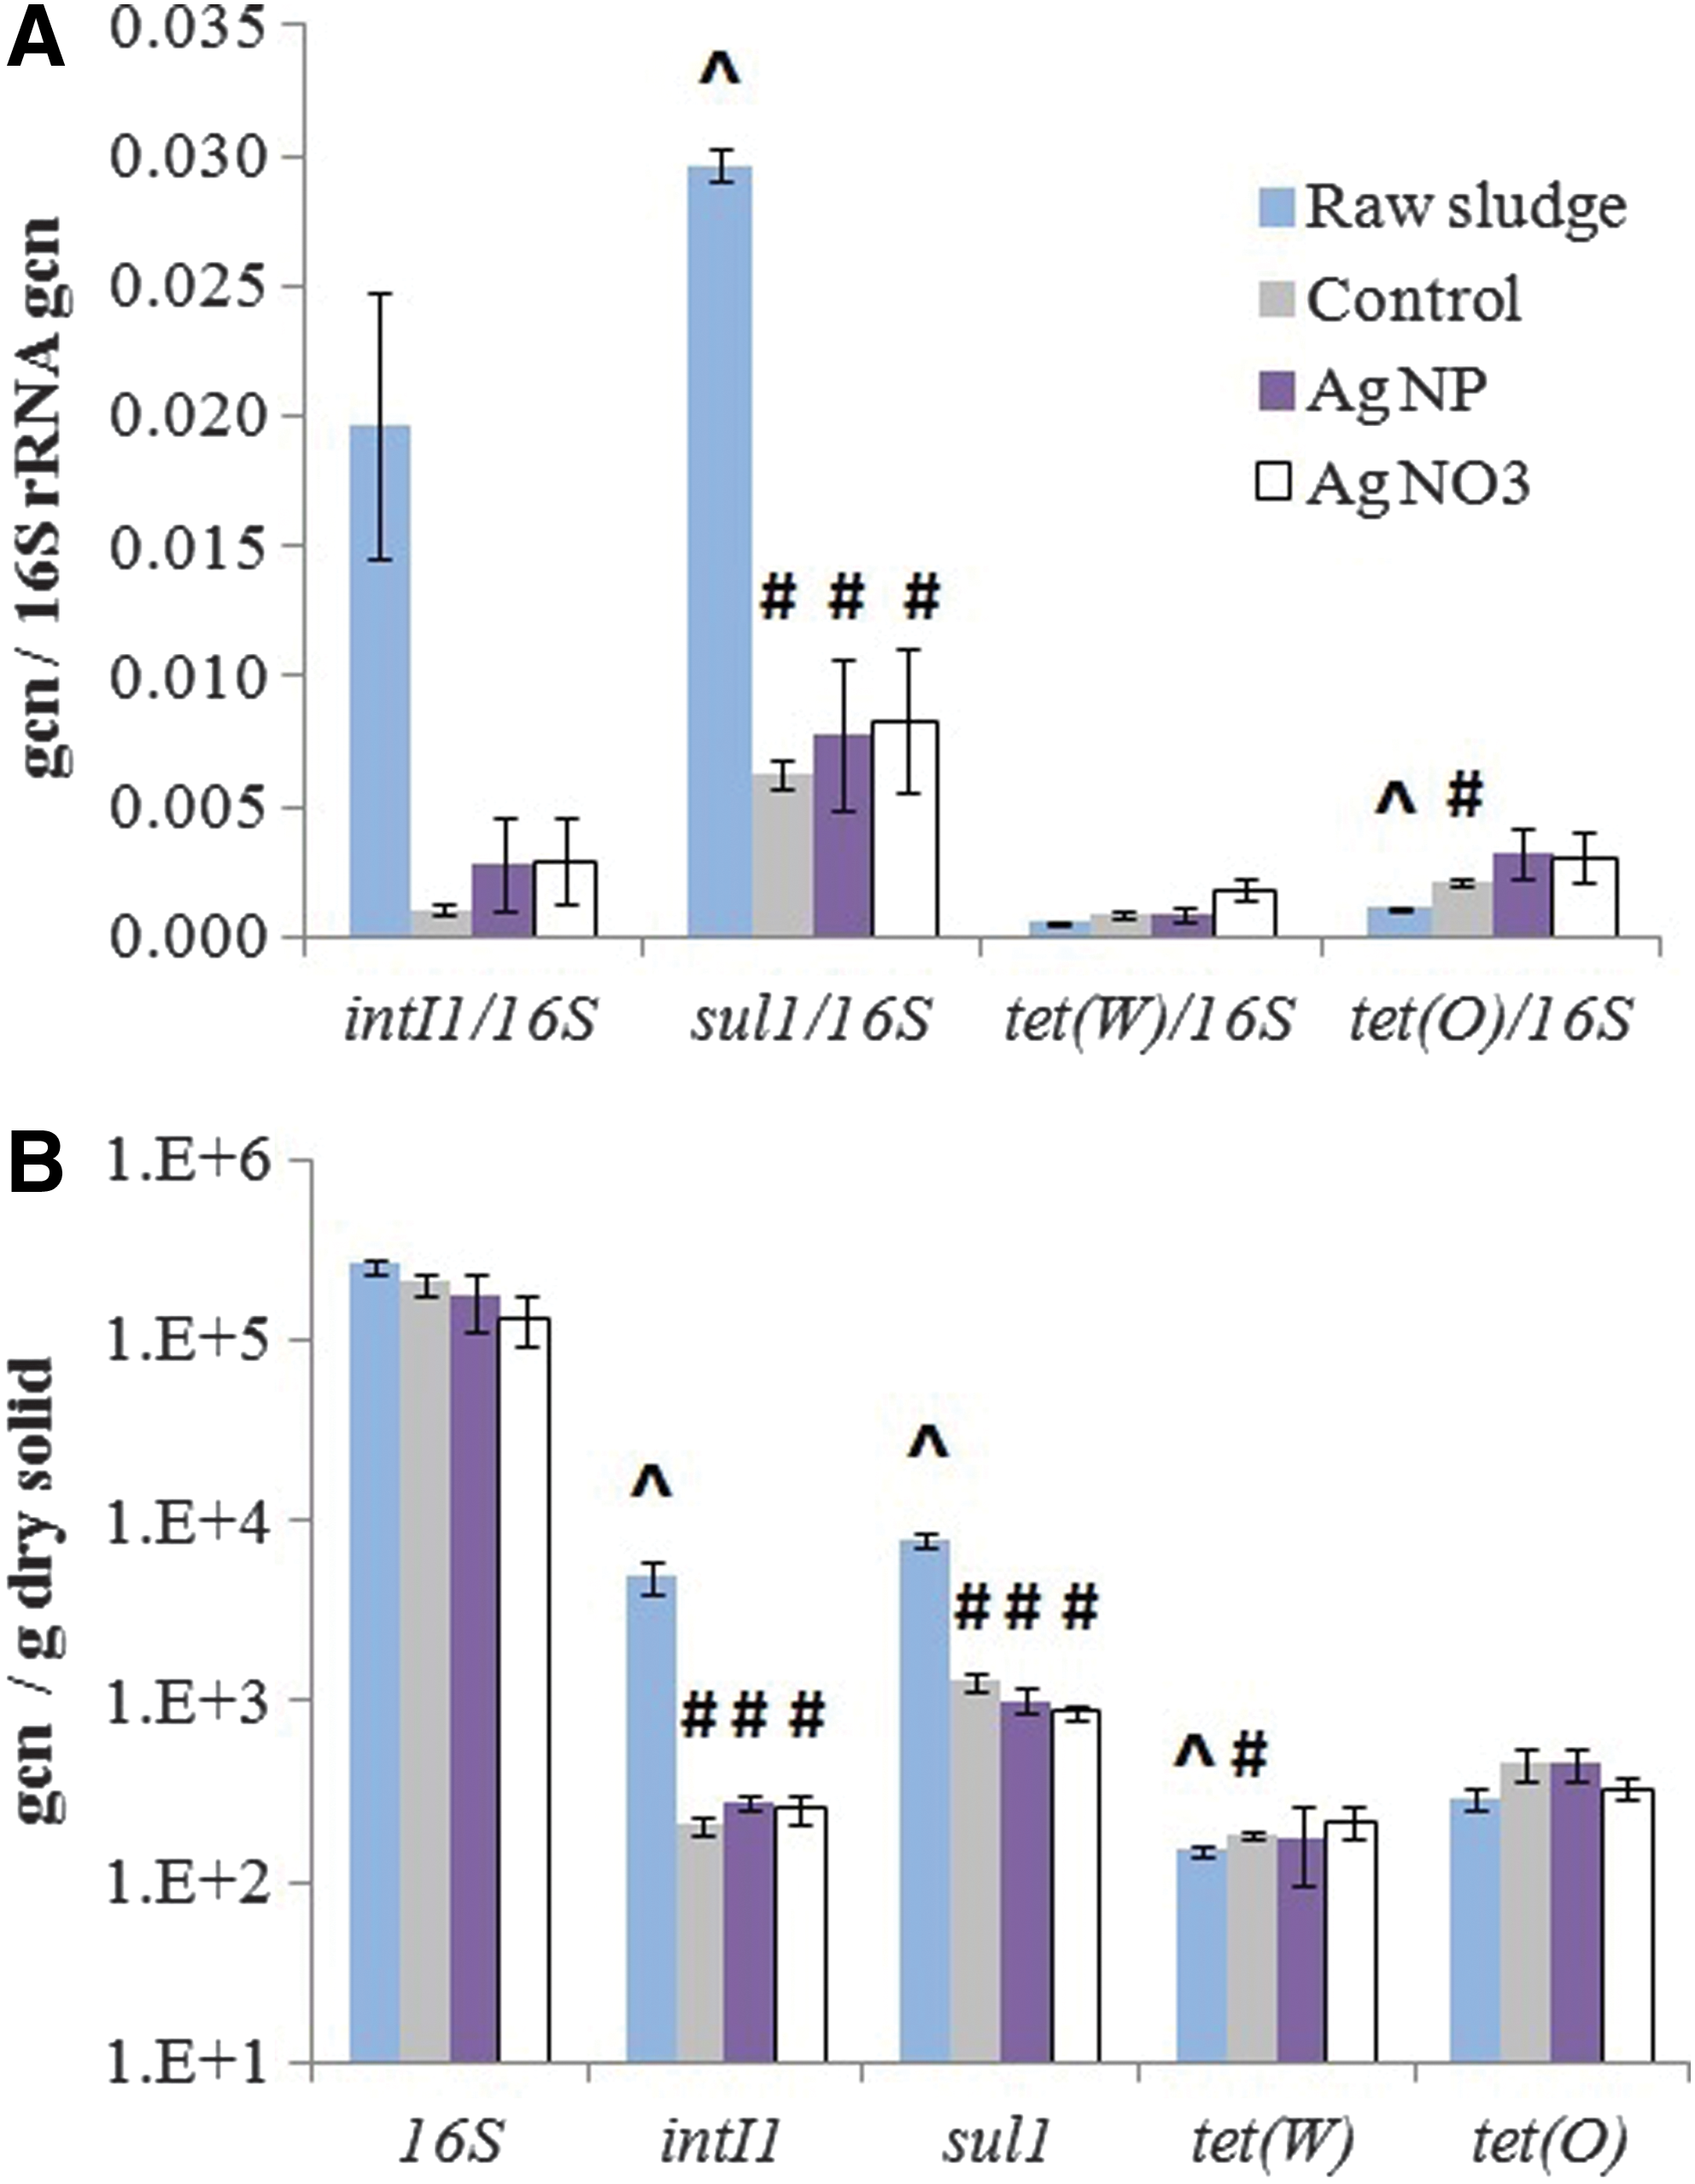
As shown, no difference in ARG:16S ratios or ARG:solids ratios between Ag-amended and control digested samples was observed for any of the genes described above (0.07 < p < 0.97) (Fig. 1A, B). Likewise, there was no difference in ARG:16S or ARG:solids ratios between AgNO3-amended and AgNP-amended digested samples (0.09 < p < 0.96). These findings indicate that there was no observed effect of AgNP and AgNO3 amendments on the cross section of ARGs and the integrase gene monitored in this study. Although the list of tested genes in the study is not exhaustive, the integrase gene, intI1, is a marker of a wide range of pollutants, including genes encoding resistance to antibiotics and metals (Gillings et al., 2014).
With respect to the effects of thermophilic anaerobic digestion on ARGs, the control and Ag-amended ARG ratios in the DS were significantly different from those of the RS. ARG:16S ratios were reduced relative to the RS for sul1 genes in all samples and tet(O) gene in the control. However, intI1 levels were statistically equivalent (i.e., no difference) in the DS relative to the RS (p = 0.07 for all samples), likely because of the difficulty of applying t-tests to data with large standard error (i.e., intI1 ARG:16S ratio, 0.0197 ± 0.0051).
Finally, ARG:16S and ARG:solids ratios for tet(W) and tet(O) ratios were the same or higher in RS relative to the control, AgNO3-amended, and AgNP-amended DS samples, with the exception of tet(O) ARG:16S ratio and tet(W) ARG:solids ratio in the control (p < 0.05). An increase in tet genes from RS to DS (without Ag amendments) has been observed in other studies as well (Diehl and LaPara, 2010; Ma et al., 2011; Miller et al., 2013) and is likely related to differences in the microbial community structure between RS and DS.
Although the ARGs examined in this study are widespread in anaerobic digesters, they nonetheless represent only a handful of known ARGs. Inclusion of intI1 serves as a marker of general resistance response, but integrons are not the only genetic location of ARGs. Therefore, it is possible that other ARGs could have elicited a response that was not captured by this study. While the doses applied in this study were above predicted environmentally relevant concentrations (1.29–5.86 mg Ag/kg TS) (Gottschalk et al., 2009), the dose may still have been too low to elicit a response or Ag2S is not bioavailable. That is, sulfidation processes of AgNPs and AgNO3 occur in the presence of sewage sludge mixtures, and Ag2S, the product of sulfidation, does not stimulate ARG transfer in thermophilic anaerobic digestion.
TEM analyses on Ag2S-NPs in the AgNP-amended RS and DS
Analytical TEM has shown its exceptional ability to characterize NPs present in various environmental matrices, including sewage sludge products, sewage sludge-amended soils, wastewater streams, and effluents (Kim et al., 2010, 2012; Kaegi et al., 2011; Westerhoff et al., 2011; Kim et al., 2014). In the present study, we used analytical TEM to study recovered AgNPs from each sludge treatment and their surrounding environments.
All the recovered Ag-containing NPs from the AgNP-amended RS and DS were Ag2S-NPs, either as aggregates or individual NPs—no pristine AgNPs were found. Given small values for the solubility product constant (Ksp) of Ag2S in the literature (on the order of 10−31–10−51) and sulfide concentrations on the order of 10−15 M (as calculated from gaseous H2S in laboratory-scale digesters), the energy balance is heavily toward scavenging of Ag by sulfide during digestion, leaving extremely low levels of Ag in the aqueous phase. Therefore, this suggests that observed Ag transformations are a result of reactions during digestion and not during sample preparation.
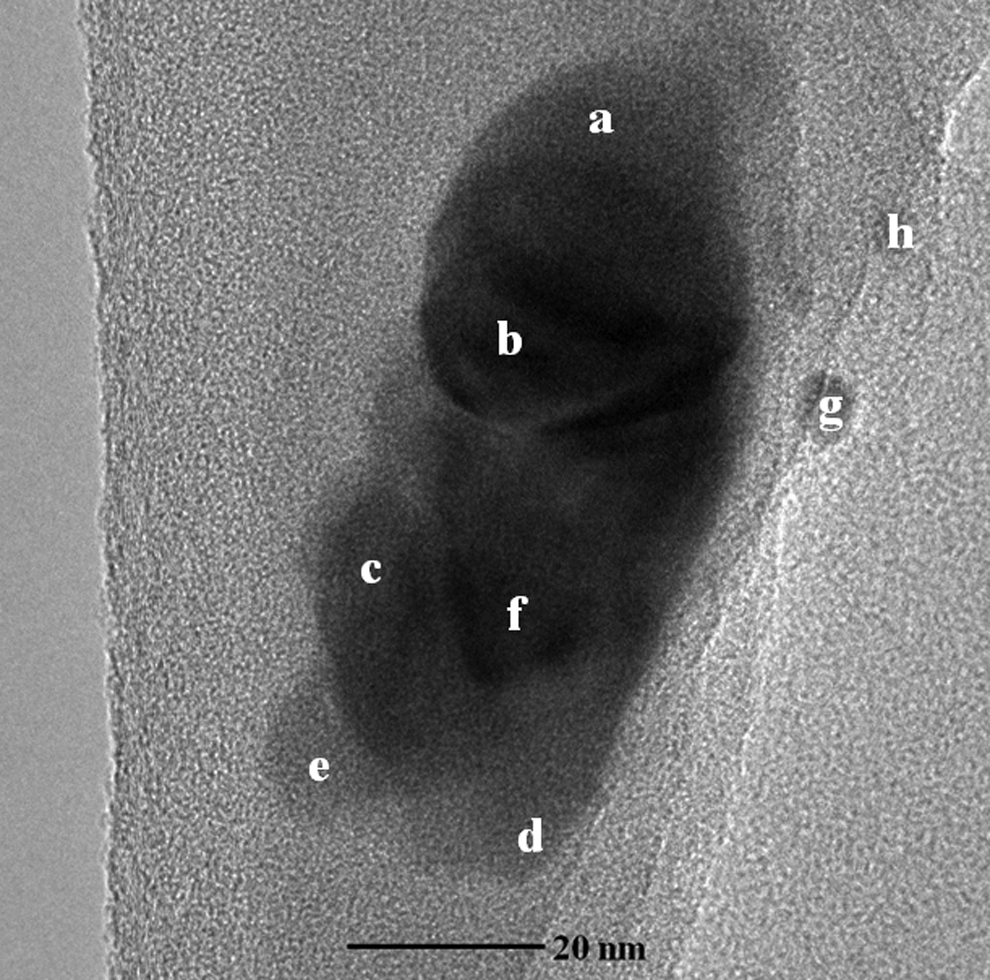
Figure 2 shows a bright-field (BF) TEM image of an Ag2S-NP aggregate found in the AgNP-amended RS. The observed Ag2S-NPs formed a small (∼190 nm in diameter) densely packed aggregate, with individual NPs with diameters ranging from 25 to 87.5 nm. The Ag2S-NPs were spherical or quasi spherical. The results of the EDX analysis on the selected areas (labeled “a–f” on the image), within the aggregate, are given in Supplementary Fig. S2. In addition to Ag and S, the elemental compositions in the EDX spectrum also show the presence of C, O, and Cu that are presumably from the lacey carbon film on the Cu TEM grid. Ca and P are identified only from the area of “e,” where poor contrast is evident on the BF TEM image. This may imply the presence of residual sludge organics containing lighter elements, such as Ca and P, that reside underneath and/or on the top of the Ag2S-NPs.
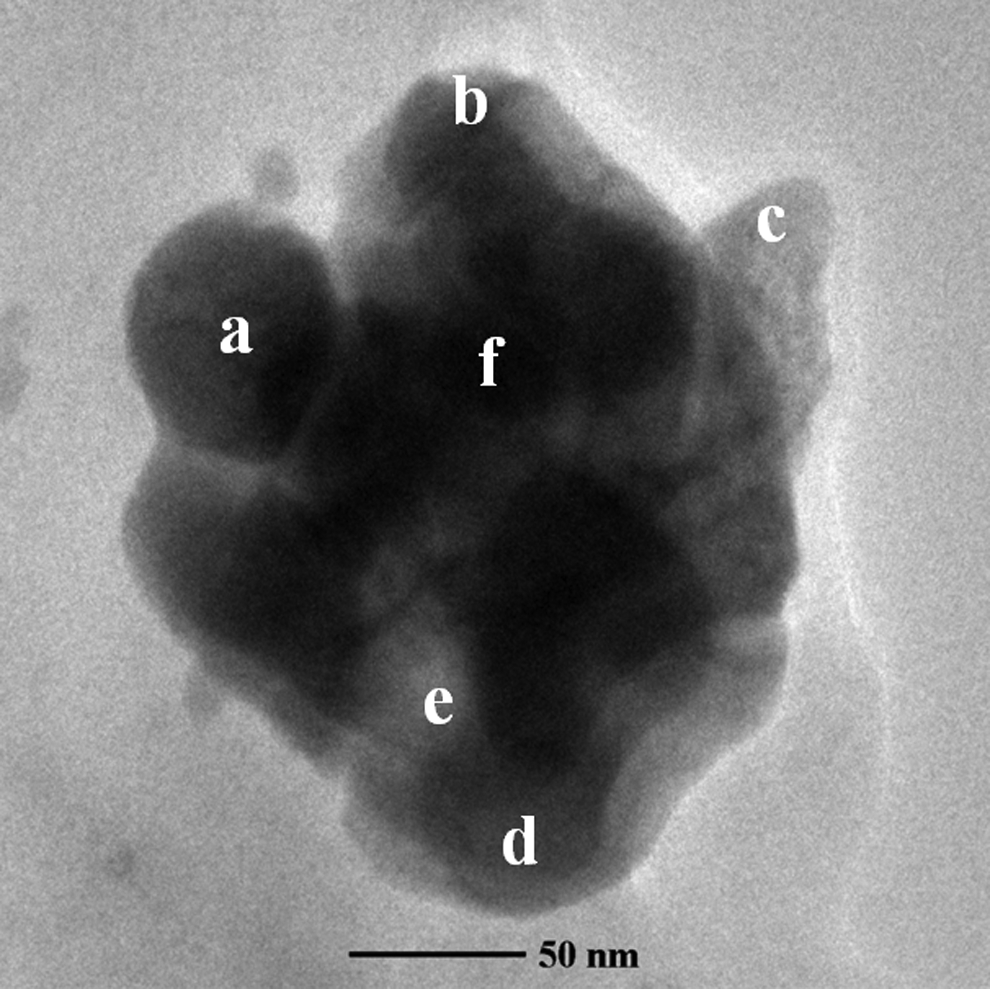
Bright-field (BF) transmission electron microscopy (TEM) image of an aggregate of Ag2S-NPs in the AgNP-amended RS samples.
In addition to Ag2S-NP aggregates, individually dispersed Ag2S-NPs were also found in the same AgNP-amended RS. HRTEM images of two Ag2S-NPs (one in Fig. 3 and the other in Supplementary Fig. S3) show that both Ag2S-NPs have ellipsoidal shapes with diameters of approximately 10–15 nm and were crystalline. The d spacings estimated from the most prominent lattice fringes of the NPs on the HRTEM images are 2.37 and 2.21 Å, values that are reasonably close to (or match with) those of the Ag2S acanthite (−1 0 3) and (0 3 1) planes (2.38 and 2.21 Å) (Frueh, 1958). EDX analyses were only briefly performed on both Ag2S-NPs, just enough to confirm the presence of Ag and S (Fig. 3). Reduced acquisition times for the EDX analysis often help reduce unfavorable electron beam-induced sample damage, especially when the sample is very thin (<10 nm).
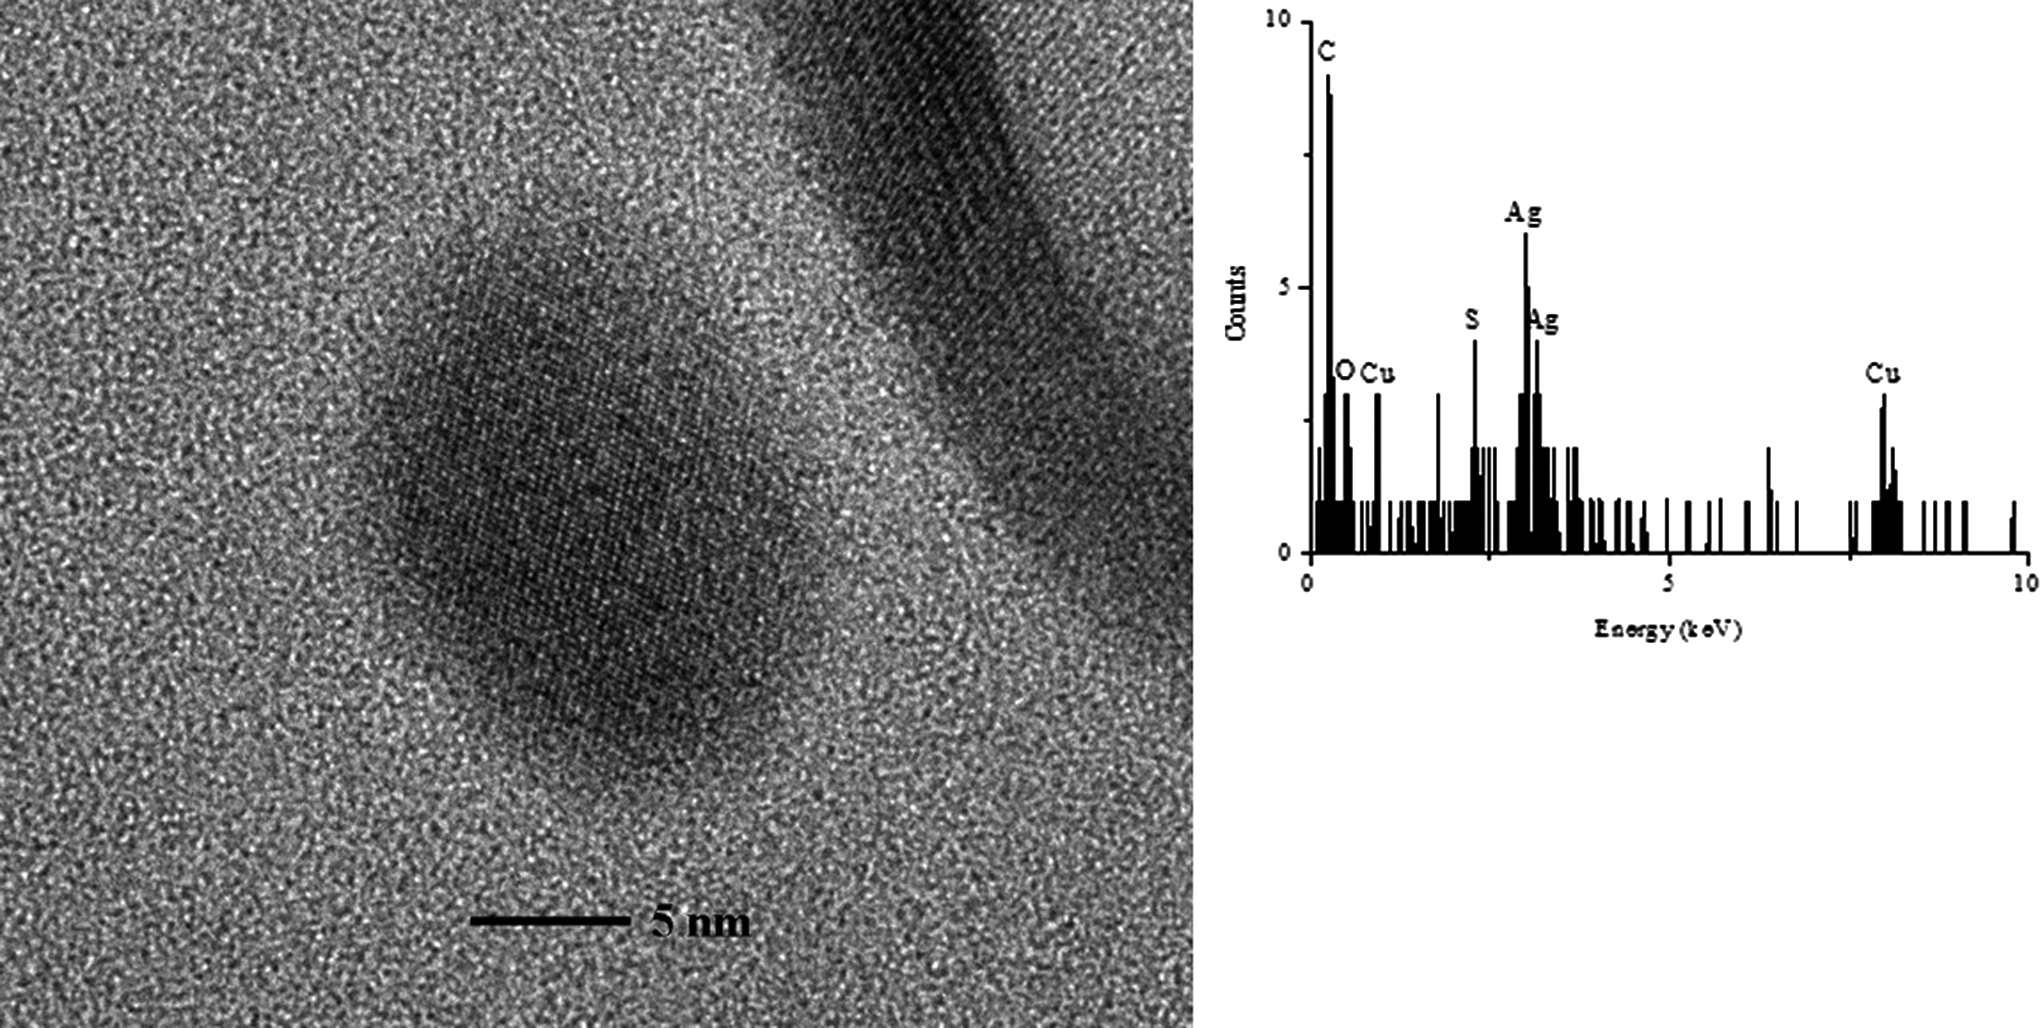
High-resolution (HR) TEM image of an Ag2S-NP in the AgNP-amended RS samples, with its corresponding Energy Dispersive X-ray (EDX) spectrum.
An AgNP-amended DS sample was also analyzed. Figure 4 shows a high-angle annular dark-field scanning TEM (HAADF-STEM) image of an Ag2S-NP aggregate found in the AgNP-amended DS. Its corresponding BF TEM image is inserted on the top left. The observed Ag2S-NPs have formed a small (∼91 nm in diameter) packed aggregate. As shown in both HAADF-STEM and BF TEM images, the Ag2S-NP aggregate appears to have been embedded in several layers of background materials, which limits our ability to examine the exact size ranges or morphologies of individual Ag2S-NPs within the aggregate.

High-angle annular dark-field scanning TEM (HAADF-STEM) image of an aggregate of Ag2S-NPs in the AgNP-amended digested sludge (DS) samples. The inset displays an enlarged BF TEM image of the entire aggregate in the area marked “a.”
The results of the EDX analysis on the entire aggregate (the area marked by “a”) show the presence of Ag, S, Si, Al, O, and Cu (Cu is from a Cu TEM grid) (Supplementary Fig. S4). The EDX analysis was also performed on the background materials (the area marked by “b”), presenting the elements of Si, Al, O, P, Ca, and Cu (Supplementary Fig. S4). This result indicates that the multilayers of background materials, where Ag2S-NPs are embedded, consist of Si, Al, O, P, and Ca. Lighter elements, such as Si, Al, O, P, and Ca, present poor contrast in the HAADF-STEM Z-contrast imaging mode compared to heavier elements, such as Ag.
Figure 5 shows an HAADF-STEM image of three individual Ag2S-NPs found in the AgNP-amended digested sludge sample. The Ag2S-NPs have spherical or quasi-spherical shape in the size range of 17–37 nm. Similar to the HAADF-STEM image in Fig. 4, those Ag2S-NPs appear to be located within layers of background materials (presented lower contrast on the image). The results of EDX analyses on the NPs in Supplementary Fig. S5 indicate the presence of Ag, S, C, O, and Cu. The background materials shown in Fig. 5, therefore, consist of C, presumably derived from the residual sewage sludge organics.
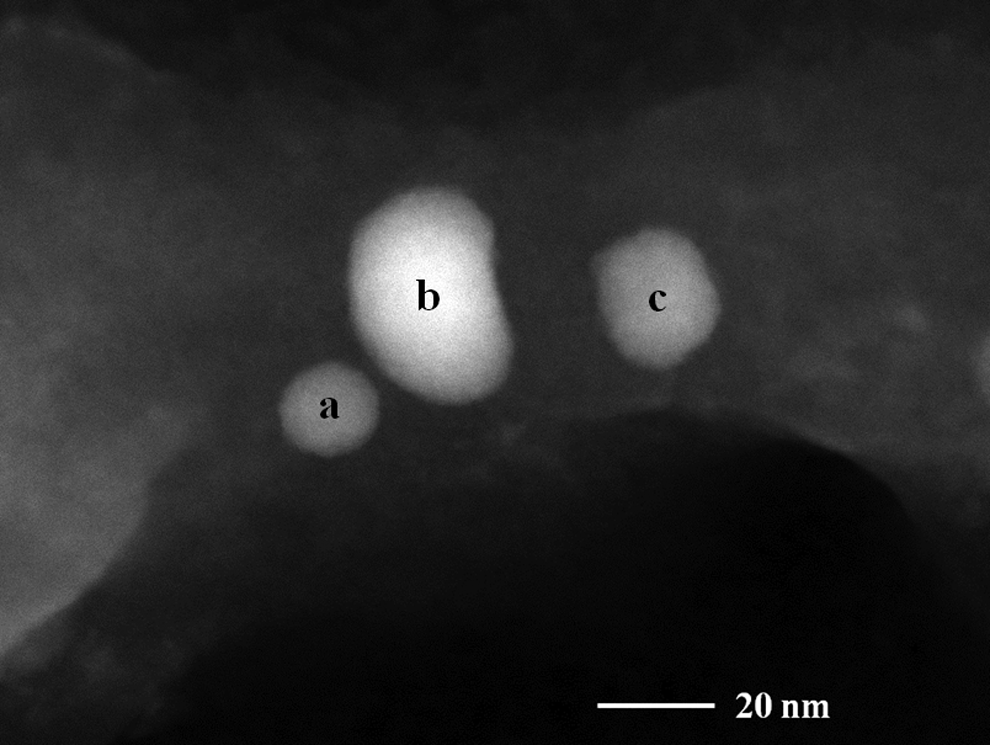
HAADF-STEM image of individual Ag2S-NPs in the AgNP-amended DS samples.
Based on the TEM observations in RS and DS samples, sulfidation reactions of AgNP occur very quickly after addition to sludge slurry solutions (i.e., <20 min). Rapid AgNP sulfidation has been noted previously (Levard et al., 2013; Thalmann et al., 2014). Once AgNPs undergo sulfidation, Ag2S nanocrystals, either in the form of individual particles or as aggregates, persist through the 22-day digestion process. Fast (on the order of minutes) sulfidation processes of chalcophilic element (such as Ag and Zn)-based NPs have been observed elsewhere (Donner et al., 2011; Ma et al., 2014). Although this particular sludge material contained 5.72 g/kg of Cl, we did not observe Ag association with Cl for both AgNP-amended RS and DS samples.
Compared to RS samples, Ag2S-NPs recovered from DS samples are strongly associated with sludge background materials, such as Si/Al mineral phases, sludge organics, and/or possibly biogenic extracellular substances. The biological fermentation reactions at work in anaerobic digestion break down complex raw sludge organics into small-chain bioavailable organic acids. Moreau et al. (2007) also noted the strong binding capability of extracellular amino acids, proteins, and polypeptides derived from lysed cells or possibly excreted by live cells.
Therefore, Ag2S-NPs can interact with products of digestion, that is, organic acids and/or extracellular proteins, resulting in the production of complex organic layers on the Ag2S-NP surface. Association of silicates or aluminosilicate materials with aggregates of Ag2S-NPs was also noted in field-collected sewage sludge materials (Kim et al., 2010). Thus, both Ag sulfidation and its incorporation into sludge organic and/or mineral phases apparently occur simultaneously during anaerobic digestion, further stabilizing Ag2S-NPs in such environments.
TEM analyses on Ag2S-NPs in the AgNO3-amended RS and DS
We recovered only Ag2S-NPs from the AgNO3-amended RS and DS samples. Figure 6 shows a BF TEM image of an Ag2S-NP aggregate found in the AgNO3-amended RS. The Ag2S-NP aggregate was small (∼86 nm in diameter) but appeared densely packed. Ag2S-NPs produced under these conditions exhibit spherical or quasi-spherical shapes. The results of EDX analyses, on the individual particles, are provided in Supplementary Fig. S6, showing the presence of Ag, S, Cl, C, O, Si, P, Ca, and Cu. The peaks of C, O, and Cu, appearing in the EDX spectrum, are presumably from a lacey carbon film and/or the residual sewage sludge organics on a Cu TEM grid, whereas the Si, P, Cl, and Ca peaks are presumably from the sludge itself.
BF TEM image of an aggregate of Ag2S-NPs in the AgNO3-amended RS samples.
Samples after the 22-day batch digestion were also analyzed. Figure 7a presents a BF TEM image of an Ag2S-NP aggregate found in the AgNO3-amended DS samples, with enlarged image of the boxed area (marked in “a”). HRTEM image of particle “a,” with much higher magnification, is provided in Fig. 7b, displaying the crystalline nature of the Ag2S-NP. The result of the EDX analysis on particle “a” is also provided in Fig. 7b, showing the presence of Ag, S, Cl, C, O, Si, Mg, Al, P, Ca, Fe, and Cu. Furthermore, the HRTEM image of background materials is provided in Supplementary Fig. S7, showing the presence of other crystalline mineral phases. The result of the EDX analysis on those NPs presents elements of C, O, Mg, Al, Si, P, S, Cl, Ca, Fe, and Cu, indicating a mixture of inorganic mineral precipitates (Supplementary Fig. S8).
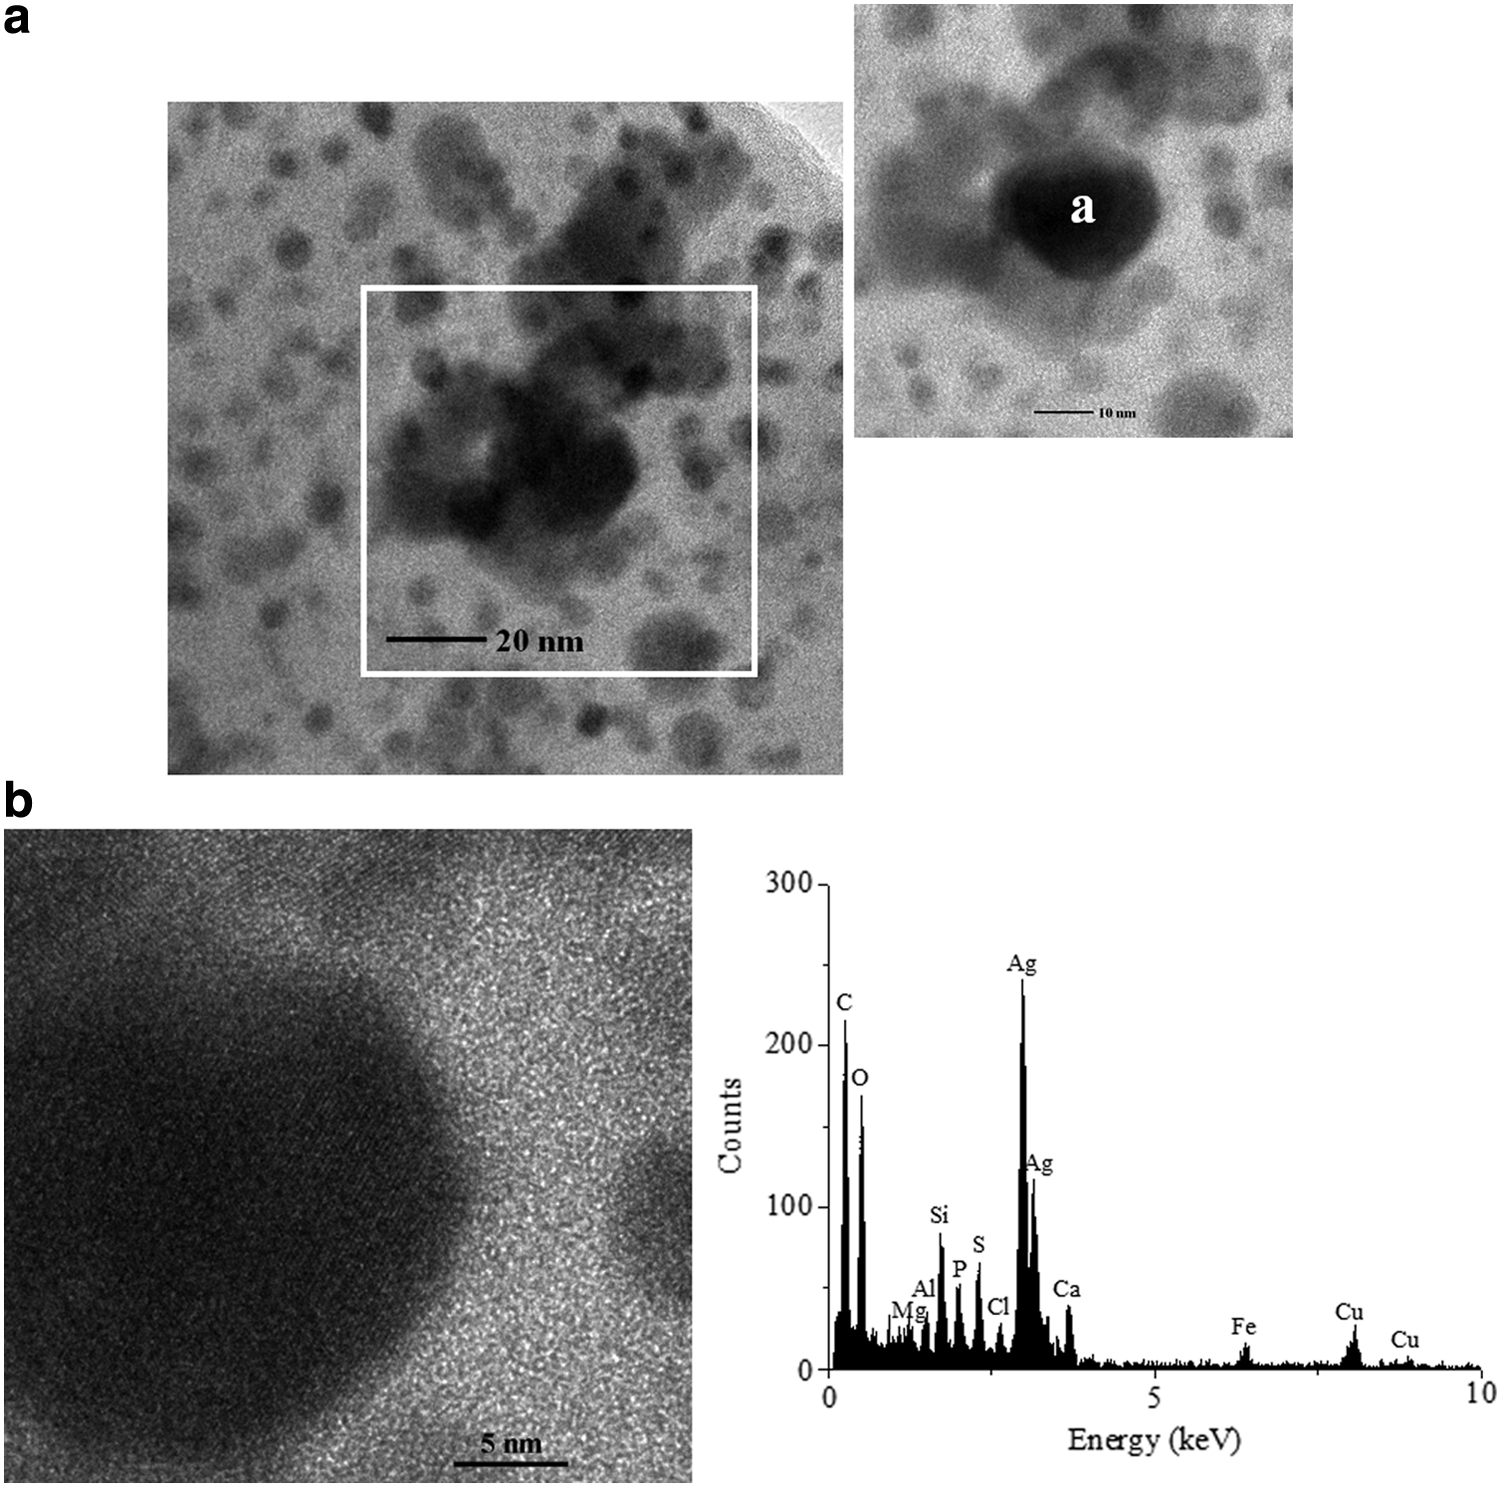
Interestingly, TEM images for the ionic Ag treatment present a greater heterogeneity and complexity in the surrounding chemical environment of Ag2S-NPs (or Ag2S-NP aggregate) in both RS and DS samples. This observation may suggest that the heterogeneous precipitation of both Ag2S-NPs and other crystalline mineral phases begins almost instantly and persists throughout the 22-day digestion. Heterogeneous precipitation with less selectivity may be responsible for creating more complexity and heterogeneity in the surrounding environment of Ag2S-NPs (or Ag2S-NP aggregate). Furthermore, as shown in the EDX results (Fig. 7b), we identified the presence of Cl together with Ag and S for both raw and digested AgNO3 amendments; however, Cl was not found as part of the crystal structure. Unlike the AgNP treatment, Ag2S-NPs were consistently recovered in the form of aggregates, not as individual Ag2S-NPs from the AgNO3-amended RS and DS samples.
EXAFS analyses on average Ag speciation in AgNO3- and AgNP-amended RS and DS
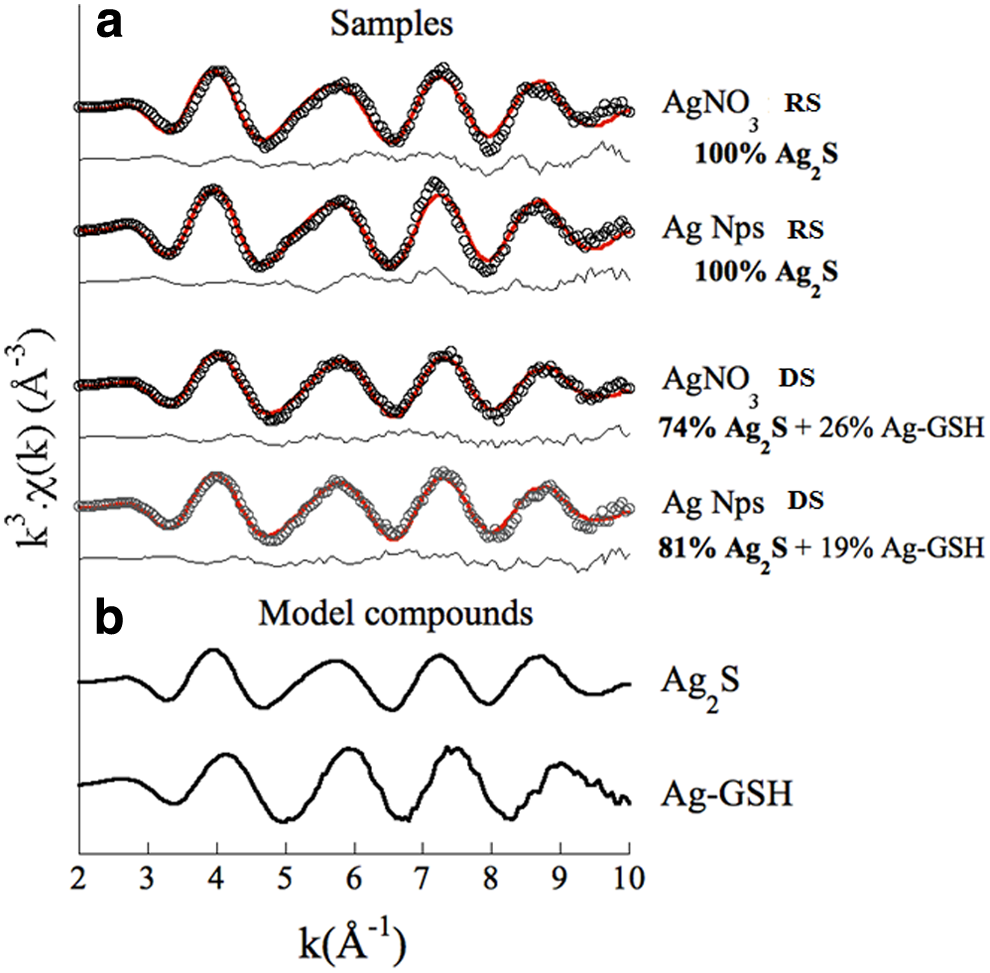
Ag speciation, for both the AgNO3- and AgNP-amended RS samples, obtained from LCF of the EXAFS spectra suggests that the precipitates are essentially Ag2S (Fig. 8). The average local Ag environment appears to be therefore similar to the local structure of the Ag2S-NP reference materials, regardless of the Ag source. However, for the DS, although the main phase still remained as Ag2S (74% and 81% for the AgNO3- and AgNP-amended DS samples, respectively), adding Ag–GSH as a second phase significantly improved the fit (26% and 19% for the AgNO3- and AgNP-amended DS samples, respectively). Adding a third component, including AgCl, did not improve the fit further. Thus, over the 22-day batch digestion, Ag speciation changes from 100% Ag2S to a mixture of Ag2S and Ag–GSH (with Ag2S still being dominant) for both AgNO3 and AgNP treatments.
This finding agrees with the TEM observations, that is, in DS samples, Ag2S-NPs or Ag2S-NP aggregates appear to have a strong association with layers of sludge organics. A similar observation was also made by Moreau et al. (2007), where naturally occurring ZnS NPs are strongly aggregated with biogenic extracellular amino acids, including cysteine, and proteins.
Both cysteine and GSH are representative standard materials for the thiol compounds in the LCF procedure. However, we chose GSH as a model compound for anaerobically digested sewage sludge organics in the LCF procedure for the following reasons: (1) Ag in the presence of cysteine tends to polymerize, as reported in a previous study (Gondikas et al., 2012) and (2) GSH is produced by some bacteria and therefore seems to be a better proxy for a naturally occurring thiol compound. In addition, a study by Park et al. (2014) shows that cysteine can effectively lower methane production of anaerobic digesters and therefore, can decrease the efficiency of anaerobic digestion.
Thus, once Ag sulfidation occurred, precipitation and sedimentation may have occurred simultaneously, and therefore, Ag2S-NPs quickly became a part of the sewage sludge matrix, settling down on the bottom of the anaerobic digester and accumulating over the course of the digestion process. This may have further affected Ag speciation and therefore its bioavailability and antimicrobial properties.
Conclusions
The following conclusions are drawn based on the results in the present study. First, both Ag2S-NPs and Ag2S-NP aggregates were recovered from the AgNP-amended sludge samples, whereas only Ag2S-NP aggregates were recovered from the AgNO3-amended sludge samples. Therefore, a portion of the AgNPs remain individually dispersed and stable (as a form of Ag2S), even after sulfidation and digestion processes.
Second, Ag2S-NPs recovered from the digested treatments consistently indicated a strong association with Si/Al mineral precipitates or sludge- or microbe-associated organic materials. Therefore, digestion processes play a significant role in the fate and behavior of Ag2S-NPs in the environment through the increased surface interactions with sludge-borne (alumino)silicates and organics.
Finally, the presence of Ag does not affect digester performance and does not select ARGs or stimulate horizontal gene transfer in the anaerobic digesters. This is most likely because both sulfidation and association with Si/Al mineral precipitates and/or sludge organic materials greatly alter Ag speciation in the digestion environments and hence, its bioavailability and potential toxicity.
Footnotes
Acknowledgments
A grant from the National Science Foundation (NSF) and the Environmental Protection Agency (USEPA) under NSF Cooperative Agreement EF-0830093, entitled Center for the Environmental Implications of Nanotechnology (CEINT), and USEPA STAR Grant No. 834856 provided major financial support for this study. Any opinions, findings, conclusions, or recommendations expressed in this material are those of the author(s) and do not necessarily reflect the views of the NSF or the USEPA. This work has not been subjected to USEPA review, and no official endorsement should be inferred. This work was also supported by the National Science Foundation CBET CAREER Award No. 0852942 and the Virginia Tech Institute for Critical Technology and Applied Science (ICTAS).
B.K. is appreciative of financial support from the Temple University as a part of her start-up to complete this work. J.H.M. was supported by the Charles E. Via, Jr. Department of Civil and Environmental Engineering Via Scholarship and the Virginia Tech Graduate School Cunningham Fellowship. The authors are also appreciative of important assistance from Stephen McCartney in the Nanoscale Characterization and Fabrication Laboratory, ICTAS, at the Virginia Tech, Dr. John T. Novak in the Department of Civil Engineering at the Virginia Tech, and the Town of Christiansburg WWTP staff.
Portions of this research were carried out at the Stanford Synchrotron Radiation Lightsource (SSRL), a national user facility operated by the Stanford University on behalf of the U.S. Department of Energy, Office of Basic Energy Sciences. We also thank John Bargar and Erik Nelson for their help in collecting XAS data and Dr. Andreas Gondikas for providing the Ag–GSH model compound. Use of the Advanced Photon Source, an Office of Science User Facility operated for the U.S. Department of Energy (DOE) Office of Science by Argonne National Laboratory, was supported by the U.S. DOE under Contract No. DE-AC02-06CH11357.
Author Disclosure Statement
No competing financial interests exist.
References
Supplementary Material
Please find the following supplemental material available below.
For Open Access articles published under a Creative Commons License, all supplemental material carries the same license as the article it is associated with.
For non-Open Access articles published, all supplemental material carries a non-exclusive license, and permission requests for re-use of supplemental material or any part of supplemental material shall be sent directly to the copyright owner as specified in the copyright notice associated with the article.