
Abstract
Abstract
Although banned by industrialized countries in the early 1980s, experimental bioremediation data on 1,1,1-trichloro-2,2-bis(p-chlorophenyl) ethane (4,4′-DDT) is scarce. This study investigated the biodegradation potential of DDT in a spiked sandy-loam soil using aerobic bacterium Alcaligenes eutrophus A5 over a year; tracking both the aqueous and soil phase. Specific research objectives of different initial DDT concentrations, soil contact times (soil age), and sorption/desorption on bioremediation were evaluated while fixing factors that may impact assessment (i.e., soil particle size, temperature, inoculation periods, and nutrient composition). Two separate ∼25 mg/kg concentration soil samples were aged for 60 and 200 days while 136 and 630 mg/kg were aged only for 60 days. Biodegradation experiments and controls were sampled at 7 days, 14 days, 28 days, 3 months, 6 months, 9 months, and 1 year. DDT degradation was found to be 13%, 11%, 7%, and 2.5% for 24 mg/kg (60 day aged), 33 mg/kg (200 day aged), 136 mg/kg (60 day aged), and 630 mg/kg (60 day aged), respectively. This corresponds to 0.25–1.34 mg/year partial DDT degradation with the main metabolites observed being DDE [1,1-dichloro-2,2-bis(p-chlorophenyl)ethylene] and DDD [1,1-dichloro-2,2-bis(p-chlorophenyl) ethane]. However, metabolite formation was only 0.25–0.45 mg/year for DDE and 0.04–0.421 mg/year for DDD. DDT was seen to mostly remain in the soil while the metabolites were mainly measured in the aqueous phase. This work generated a transient dissipation data set for the aerobic metabolism of DDT and formation of DDE and DDD from which kinetic pathways can be explored and rate constants quantified.
Introduction
D
Studies on avian and mammal species have shown negative reproductive side effects caused by organochlorine pesticides (Fry, 1995; Tiemann, 2008). They have also been associated with causing estrogenic, androgenic effects, and reproductive hazards in human beings (Jones and De Voogt, 1999; Turusov et al., 2002; Lemaire et al., 2004). DDT is still found in significant amounts due to its extensive historical usage and resistance to degradation. As of May 2011, the U.S. Environmental Protection Agency (EPA) had a total of 1,290 sites on the National Priority List containing over 86 different contaminants. Of 249 soil-contaminated sites evaluated, ∼15% contained DDT (U.S. EPA, 2011). The extent of DDT contamination is confounded by 23 countries still using DDT for disease control. Although DDT is given credit for preventing millions of malaria cases each year, the World Health Organization estimates a worldwide 200,000 deaths/year attributed to pesticides (Turusov et al., 2002; Odukkathil and Vasudevan, 2013).
Several physical (i.e., soil vapor extraction and incineration) and chemical (i.e., soil flushing and solidification) treatment methods exist for anthropogenic compounds (Gavrilescu, 2005). However, bioremediation is receiving more interest due to being an ecofriendly and cost-efficient technique. The global demand for bio and phytoremediation is estimated to be U.S. $1.5 billion/year (Megharaj et al., 2011). Biodegradation is a natural process where a plant or microorganism utilizes a xenobiotic compound for its own survival, whereas bioremediation is the implementation of this phenomenon as a technology for detoxifying various media (Singh, 2008; Odukkathil and Vasudevan, 2013). Bioremediation efficiency is dependent on contaminant availability. The bioavailable fraction of historic DDT-contaminated sites is typically a very small amount due to the stability of pesticides (Odukkathil and Vasudevan, 2013). Numerous species have been identified as partial degraders of DDT; facultative fungi Phanerochaete chrysosporium (Corona-Cruz et al., 1999), aerobic bacterium Pseudoxanthomonas sp.wax DT-1P (Wang et al., 2010), and aerobic mushroom Pleurotus ostreatus (Purnomo et al., 2010). Although degradation of DDT has been cited as more effective under anaerobic conditions (Gavrilescu, 2005), in this study an aerobic bacterium was used due to the difficulty in maintaining anaerobic conditions in a field environment.
The overall aim of this study was to assess the bioremediation potential of 4,4′-DDT in soil using the aerobic bacterium Alcaligenes eutrophus A5. The specific research objectives included (1) comparison of impact of initial concentration and (2) contact time (soil age) on biodegradation. Experiments were conducted with varying initial DDT concentrations of soil aged 60 or 200 days. The study covers a full year biodegradation of a DDT-spiked soil, with collected data from both the aqueous and soil phase.
Materials and Methods
Soil and reagents source
An uncontaminated soil collected in 2001 from Northeast Ohio was used in this experiment. The soil had been collected at a depth of 3–5 ft (1–1.5 m). For prevention of photo-oxidation, the soil was stored in a sealed container in a dark dry area at room temperature. The soil used in this study was characterized in previous studies (Hwang and Cutright, 2002) and has been tabulated as in Table 1. The Ohio soil was mixed, aired, and sieved to a uniform 0.425 mm diameter to minimize any possible discrepancies associated with particle size distribution.
DDT was purchased at 98% (2% impurity mixture of 2–4 DDT and chloral hydrate) purity from Aldrich Chemical Company Inc. Stock solutions were prepared with hexane purchased from Fisher Scientific. Calcium chloride (CaCl2) and sodium azide (NaN3) were obtained from Fisher Scientific to prepare the background solution (BG), which was used to prevent any microbial activity in control reactors. The control reactors were uninoculated. The BG contained 200 mg/L NaN3 as a biocide and 55.5 mg/L CaCl2 to poise the ionic strength of the solution. All nutrients for reviving and maintaining bacteria were purchased from Fisher Scientific and Sigma Chemical Co. at reagent grade or better.
Soil spiking
Approximately 450 g of soil was necessary for the biodegradation experiments at each contamination level. To achieve 25 mg DDT/kg soil, DDT was first fully dissolved in 15 mL of acetone (Thangavadivel et al., 2011). Many organic solvents have been found to be lethal to microorganisms yet are frequently used when spiking soil with compounds of low water solubility (Brinch et al., 2002). Afterward, 100 mL of distilled water was added to the solution to provide full contact wetting of the soil. Since the soil was aged a minimum of 60 days acetone would have evaporated before adding bacteria. Plate counts (data not shown) were used to verify that no viable microbial population existed in the soil collected in 2001.
After mixing, the soil was placed in amber bottles to prevent photo-oxidation reactions and aged 60 or 200 days in a dark cabinet with concentrations prepared for bioremediation experiments of 25, 136, and 630 mg DDT per kg soil, respectively. These values are the actual spiked values. Recovery experiments on clean, spiked soils determined the DDT recovery rate to be 90–95%. Previous studies also reported 70–90% recovery for organochlorine pesticides in sediments (Turgut et al., 2010). Two ∼25 mg/kg concentration soil samples were aged 60 and 200 days while the remaining 136 and 630 mg/kg concentrations were aged 60 days only. As most of the DDT found in the environment is from historic use from 30 to 40 years ago, two different contact times were used to assess the impact of ageing on biodegradation. Soil ageing leads to a reduction in bioavailability and bioremediation of DDT (Fang et al., 2010).
Maintenance, growth, and harvesting of microorganisms
A. eutrophus A5, a bacterium known to partially degrade DDT (Nadeau et al., 1994) was used for the initial experiments. It was obtained as pure culture from Prof. Dr. Gary Sayler of the University of Tennessee. It was revived with a solution containing 0.2 g/L yeast, 2 g/L peptone, 0.2 g/L NH4NO3, and 1 g/L glucose (Nadeau et al., 1994).
The revived bacterium was maintained in Erlenmeyer flasks on a weekly basis that consisted of the following nutrients (g/L): 4 NaNO3, 1.5 KH2PO4, 0.005 FeCl3, 0.2 MgSO4, 0.01 CaCl2, 0.5 Na2HPO4, 1 glucose, and 0.005 yeast (Nadeau et al., 1994). The bacteria was acclimated to DDT by decreasing the glucose amount while adding DDT in 0.1 g/L increments until the concentration of 0.4 g/L DDT and 0.6 g/L glucose was reached. Two 125 mL flasks, with no DDT, were prepared for the A. eutrophus A5 as a long-term bacteria source. The bacteria were harvested with an IEC Centra-4B Centrifuge at 1,100 rpm for 10 min to inoculate the test reactors. Bacterial populations were assessed via plate counts and found that the 10 mL harvested during centrifugation yielded a viable population of 8.70 ± 0.70 × 10⁸ CFU/mL (Erdem et al., 2015).
Biodegradation experiments
Biodegradation experiments and controls were conducted for a period of 1 year with destructive duplicates, each separately assessed at time periods of 7 days, 14 days, 28 days, 3 months, 6 months, 9 months, and 1 year for ∼25 (60 and 200 day aged), 136, and 630 (60 day aged) mg/kg initial DDT concentrations. The initial concentrations were measured by soil extraction of soil samples when the experiments were initiated with recovery rates between 90% and 94%. Experiments and controls were initiated by placing 12 g of the DDT-spiked soil in reactors. For the biodegradation experiments, 10 mL of the concentrated, acclimated bacteria and 14 mL of fresh nutrient solution were added. The nutrient solution was the same mineral salt medium (MSM) used for bacteria culture without the addition of glucose. A soil:aqueous phase ratio of 1:2 was chosen since previous bioremediation studies have shown slurry phase experiments to be more effective for aerobic species conducted for extended durations (i.e., 3 or more months). The control reactors were uninoculated, with 24 mL of BG added to prevent microbial growth. Thus, the controls were used to track abiotic desorption and degradation. Experiments were used to track the impact of bacteria on contaminant desorption and degradation.
The aqueous phase of both experiments and controls was decanted and refreshed on a biweekly basis. The nutrients of the experiments were refreshed to ensure a viable bacterial population. It was expected that the aqueous phase of the experiments would exhibit higher desorption and degradation rates than the aqueous phase of controls. Therefore, the aqueous phase samples were analyzed and a cumulative total calculated for the defined experiment time steps. The remaining metabolites in soil were also extracted at the end of the time step and added to the total mass balance (Tables 2–5). The bacteria were concentrated by centrifugation. The supernatant was analyzed for DDX (DDT and metabolites) via gas chromatograph (GC) and values were found to be below detection limit (DL) (0.15 μg/L). This harvesting method and subsequent analyses was carried out to ensure no DDT was being added to experiment reactors during biweekly nutrient amendments. The reactors were then placed into a constant temperature (30°C ± 2°C) Environmental Shaker and agitated at 125 rpm for the desired contact time. The disappearance of DDT and appearance of its metabolites was tracked via GC.
BDL, below detection limit of 0.15 μg/L and 2.67 mg/kg; DDD, [1,1-dichloro-2,2-bis(p-chlorophenyl) ethane]; DDE, [1,1-dichloro-2,2-bis(p-chlorophenyl)ethylene].
Analytical methods
At completion of the degradation time steps, the DDT concentrations in both the aqueous and soil phases were analyzed. The aqueous phase samples were subjected to a liquid:liquid extraction of hexane:solution 6:4 (Hwang and Cutright, 2002). One microliter of the organic phase was used for the GC analysis via a Shimadzu-gas chromatograph (model GC-14A) equipped with a Rxi-5 ms capillary column (30 m × 0.32 mm, 1 μm, crossbond 5% diphenyl-95% dimethyl polysiloxane) and a flame ionization detector. The method used an initial column temperature of 75°C for the first minute, a 10°C/min ramp to 280°C, which was then held for 8 min. The temperature of the injector and detector were 230°C and 300°C, respectively and helium was used as the carrier gas (Zhao et al., 2010). For soil phase extraction, 50 mL of hexane:acetone (1:1, v/v) was added to 2 g of soil and refluxed for 8 h (Doong and Liao, 2001; Sporring et al., 2005). As 2 g of the total 12 g of soil per sampling period was used for extraction, a potential area for uncertainty would be if the soil mixture were not homogeneous. The solution was then analyzed by GC.
Statistical analysis
The design of this experiment was developed as a two-factor completely randomized design. The initial concentration and contact time are the factors and the treatment was the bacterial strain. The response variable was the mass (mg) of DDT degraded or metabolite formed. The data were statistically analyzed by one-way ANOVA at 5% level of significance with software Minitab 16.
Results and Discussion
Biodegradation data were collected at time steps of 7 days, 14 days, 28 days, 3 months, 6 months, 9 months, and 1 year for 24 ± 3 mg/kg (60 days aged), 33 ± 6 mg/kg (200 days aged), 136 ± 11 mg/kg (60 days aged), and 630 ± 25 mg/kg (60 days aged) experiments. The total DDT degradation results for the 24 ± 3 mg/kg (60 days aged), 33 ± 6 mg/kg (200 days aged), 136 ± 11 mg/kg (60 days aged), and 630 ± 25 mg/kg (60 days aged) concentrations were 13%, 11%, 7%, and 2.5%, respectively. As expected, the general trend showed an inverse relationship between contact time and degradation. These findings match literature on sorption/desorption and bioremediation, which state that soil ageing over long time periods leads to reduced availability of the compound because of stronger sorption (Fang et al., 2010; Sudharshan et al., 2012). They also corroborate the findings of Liu et al. (2008) who noted increased sorption and decreased bioavailability with higher initial concentrations and are in accordance with a previous sorption/desorption study using the same Ohio (OH) soil and contaminant (Erdem and Cutright, 2015). Of the metabolites measured, more DDE [1,1-dichloro-2,2-bis(p-chlorophenyl)ethylene] was observed than DDD [1,1-dichloro-2,2-bis(p-chlorophenyl) ethane]. This was an expected outcome as the main metabolite seen under anaerobic conditions is DDD and is DDE under aerobic conditions (Ricking and Schwarzbauer, 2012; Wetterauer et al., 2012). The increase in DDE over time was corroborated by previous studies (Hitch and Day, 1992; Turgut et al., 2010) where the DDE/DDT ratio was assessed to gauge the age of contamination. In general, the higher the DDE/DDT ratio, the older the age of the site.
Bioremediation results for 24 mg/kg, 60 days aged soil
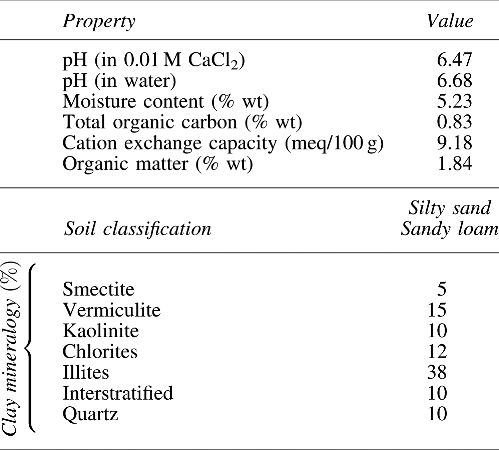
The measured initial DDT mass for the 24 ± 3 mg/kg, 60 days aged bioremediation experiments was 0.288 ± 0.035 mg per 12 g soil. The initial concentration was found via soil extraction and GC analysis. Assuming the DDT to be homogeneously distributed within the soil samples, over 1 full year if no metabolism had occurred the total mass of DDT would be 0.288 × 7 (seven time steps), which equals to 2.016 mg (Table 2). The total mass of the aqueous phase was calculated by adding the value measured at the predetermined time step to the cumulative biweekly decant and refresh measured amounts. This procedure was repeated until the specified sampling date. Others reason for the fluctuations seen in Fig. 1a and b are the nonhomogenous nature of soil and GC detection capabilities (i.e., DL for aqueous phase was 0.15 μg/L and 2.67 mg/kg for soil phase). The cumulative mass measured by the end of 1 year was the total from aqueous and soil phase (Table 2). Although desorption from soil was observed in small amounts, the total amount of DDT transformed was very low in both phases. This was expected as DDT is recalcitrant and there was only one bacterial species present for degradation. The desorbed amounts of DDT were not considered degradation but a part of the cumulative DDT mass balance. Mass balance tables for all four sets of experiments and controls were calculated using the same approach (Tables 2–5).

Aqueous phase:
Low desorption amounts were corroborated by a previous sorption/desorption study on DDT by Erdem and Cutright (2015). After a conventional 24 h sorption step, 88.9%, 82.1%, 98.6%, and 99.6% of the initial 53, 91, 246, and 405 mg/L DDT was sorbed to the soil. At the end of six consecutive 24 h desorption steps, the percentage still sorbed to the soil were 33.2%, 45.2%, 93.8%, and 96.6% translating into only 1.14, 1.63, 0.50, and 0.45 mg of DDT being desorbed, respectively.
Total degradation of DDT for 1 year (i.e., decrease in DDT) was observed as 13% for experiments and 16% for controls, which corresponds to a total mass degraded of 0.265 ± 0.047 and 0.328 ± 0.023 mg DDT, respectively (p > 0.05). However, the metabolites DDE and DDD were observed in both test and control reactors of 24 ± 3 mg/kg, 60 day aged DDT. DDE and DDD were noted both in the aqueous phase of controls and experiments. Since the soil was initially spiked with DDT only, the presence of metabolites DDE and DDD can only be attributed to degradation. Baxter (1990) and Boul et al. (1994) also reported limited quantities of abiotic DDT degradation.
A total of 0.298 ± 0.033 and 0.323 ± 0.026 mg of DDE was seen to appear by the end of 1 year for experiments and for controls, respectively (p > 0.05). Similarly, 0.197 ± 0.014 and 0.327 ± 0.003 mg of DDD was detected for experiments and for controls, respectively. The statistical analysis showed a significant difference between control and experiment DDD formation (p < 0.05). The variation of the metabolites in test reactors may be due to nonhomogeneous soil, measurement inaccuracy, and the disappearance and formation of metabolites.
The fact that the majority of DDT was retained in the soil phase was attributed to DDT's hydrophobicity, low water solubility, and rapid and strong binding to soil. Persistence of organic pollutants in soil has been attributed to the hydrophobicity of the compounds. The fate of these pollutants is interconnected to compound properties, soil characteristics, and environmental factors (Sudharshan et al., 2012). Other researchers have reported partial DDT degraders such as Alcaligenes denitrificans ITRC-4 (Ahuja and Kumar, 2003), Serratia marcescens DT-1P (Bidlan and Manonmani, 2002), and Enterobacter cloacae (Beunink and Rehm, 1988) with varying partial degradation rates between 25% and 95% in aqueous phase. It must be noted that the respiration mode, initial concentration, and experiment phase was different, but the general trend of low degradation rates was similar to our experiments.
Degradation is believed to occur in two major steps: DDT bound to the soil will first desorb, than undergo degradation. Desorption and biodegradation occurs by bacterial production of surfactants, desorption of contaminant from the soil and subsequent degradation in the aqueous phase. With time, metabolites will degrade, facilitating thermodynamically favorable conditions for more DDT to be desorbed thereby continuing the cycle. Degradation also occurs within the soil phase at lower rates (Megharaj et al., 1998).
DDE amounts were higher than DDD in the experiment reactors (Fig. 1b and Table 2). This was expected as DDE is considered the main metabolite formed during aerobic degradation (Wetterauer et al., 2012). DDE and DDD were found predominantly in the aqueous phase of experiment reactors is an expected outcome as microbial activity occurs more readily in the aqueous phase (Fig. 1b, d and Table 2).
Sorption controls the persistence and irreversible bonding of pesticides within soil (Boivin et al., 2005). Microorganisms produce biosurfactants making the contaminant more available for degradation but in this experiment it was seen that controls underwent more desorption. However, control reactors were seen to desorb greater amounts of DDT than experiments (Fig. 1a, b). This could simply be due to the non-homogeneity of soil and the difference caused by biweekly decant/refreshes. This was not the expected outcome, but the numerous interconnected factors affecting sorption/desorption cannot be explained by only two parameters, initial concentration and contact time. There was no significant difference between controls and experiments, as degraded amounts were minimal, 0.328 ± 0.023 and 0.265 ± 0.047 mg DDT, respectively.
Bioremediation results for 33 mg/kg, 200 days aged soil
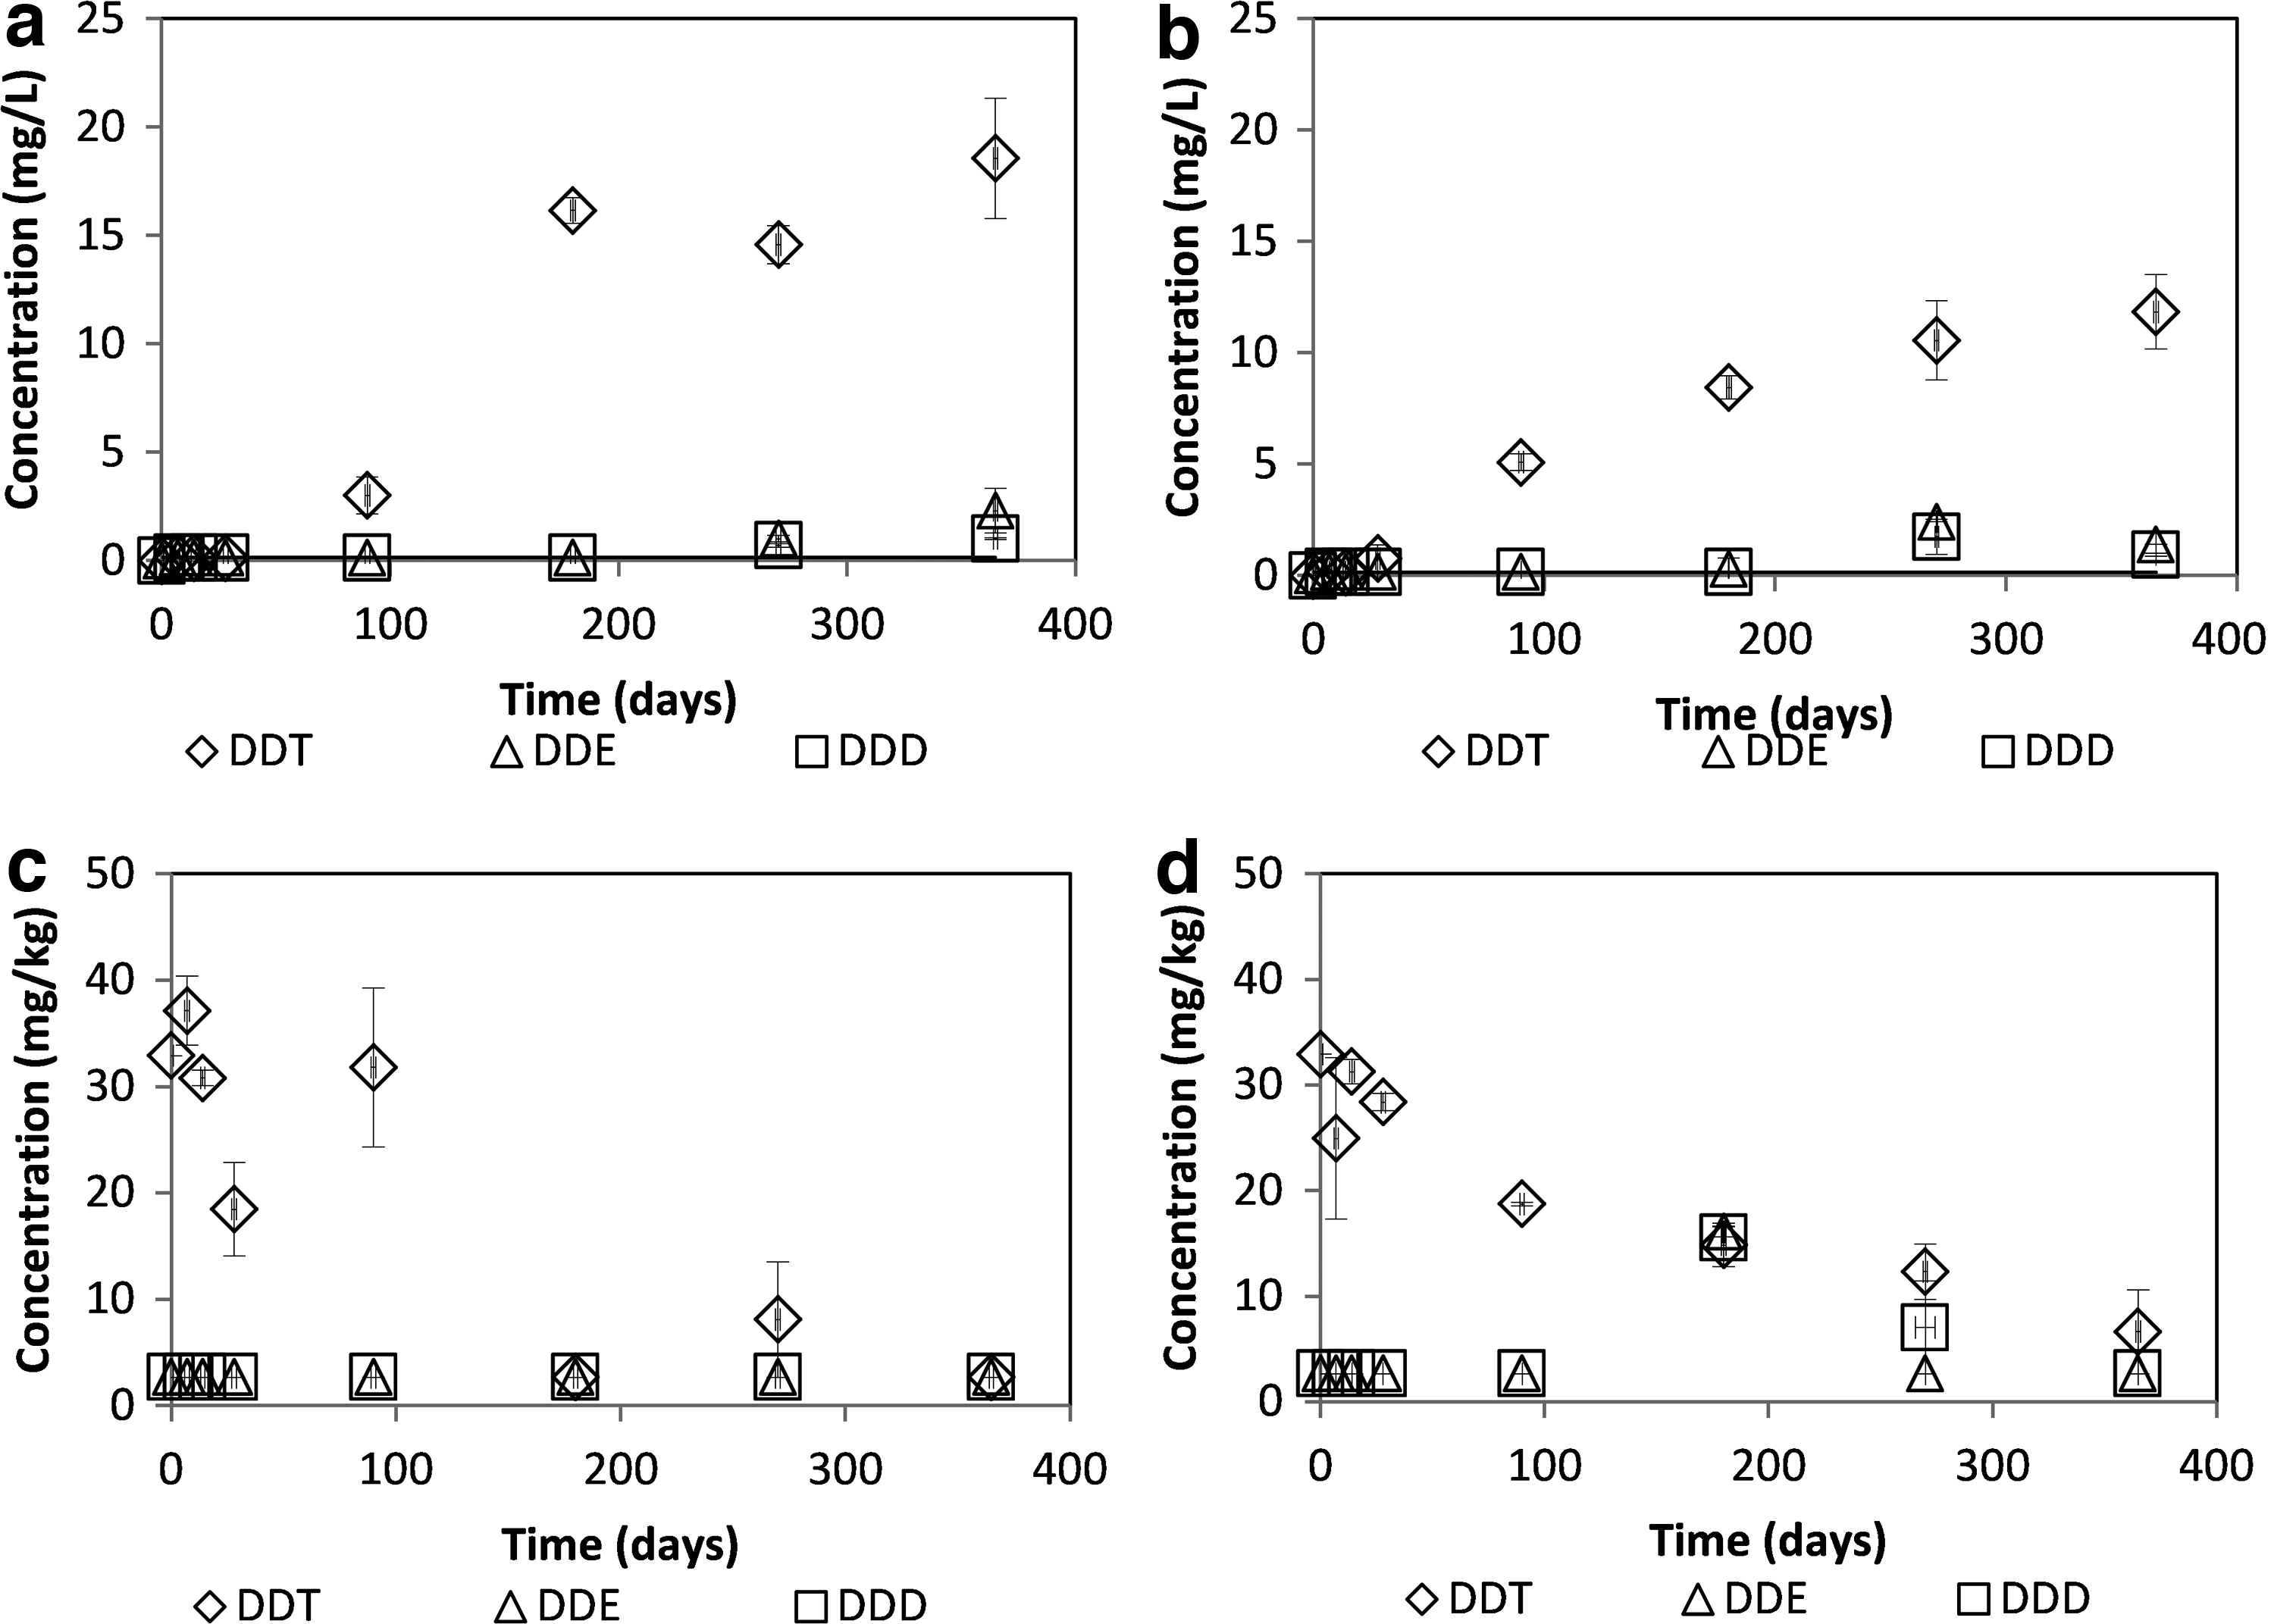
The total degradation rate for 1 year was observed as 11% for experiments and 3% for controls when the soil was aged for 200 days. This corresponds to 0.309 ± 0.096 and 0.087 ± 0.027 mg of DDT degradation, respectively (p > 0.05). Neither DDE nor DDD was observed during the first 6 months.
When compared to the 60 day aged soil, the lower metabolic activity during the first months of the experiment can be attributed to stronger sorption and lower bioavailability due to longer contact time (Fang et al., 2010). A large percentage of DDT (50%) observed in the soil phase soil was attributed to strong sorption due to longer ageing, and the hydrophobicity of DDT (Sudharshan et al., 2012). This corroborates the findings of the sorption/desorption experiments and Mamy and Barriuso (2007), showing that contact time had a greater effect on sorption than initial concentration.
Natural DDT losses in soil have been attributed to leaching, volatilization, photo-oxidation, irreversible sorption, chemical degradation, and indigenous aerobic/anaerobic microbial activity (Kamanavalli and Ninnekar, 2004; Fang et al., 2010; Sun et al., 2010; Gao et al., 2011). The losses in the control reactors were abiotic as BG containing NaN3 was used to prevent microbial activity. DDT, due to its complex structure and large molecular weight is a persistent organic pollutant with relatively low abiotic or biotic degradation reported. Previous research has shown that the degradation of organochlorine pesticides in the environment may occur photochemically, by aerobic or anaerobic bacterial activity or by abiotic dehydrochlorination (Megharaj et al., 1998). The metabolites seen in the aqueous phase of control reactors is thought to be a product of abiotic degradation within the soil and desorption of DDX into the aqueous phase during the biweekly decant/refreshes.
A total of 0.283 ± 0.007 and 0.074 ± 0.027 mg of DDE was seen to appear at the end of 1 year for experiments and controls (Fig. 2), respectively (p < 0.05). A total of 0.315 ± 0.101 and 0.038 ± 0.003 mg of DDD was seen to appear at the end of 1 year for experiments and for controls, respectively (p > 0.05). The average 0.038 mg DDD measured in the control was found completely in the aqueous phase.
Aqueous phase:
Contrary to the 24 mg/kg, 60 day aged soil, there was slightly DDD than DDE in the 33 mg/kg, 200 day aged soil experiments (Fig. 2). The metabolites were dominantly found in the soil phase, a direct contrast with the 24 mg/kg, 60 day aged soil. Direct evidence of DDX transformation in soil is scarce (Foght et al., 2001). DDD was reported to be more readily degraded under anaerobic conditions (Kantachote et al., 2004).
Bioremediation results for 136 mg/kg, 60 days aged soil
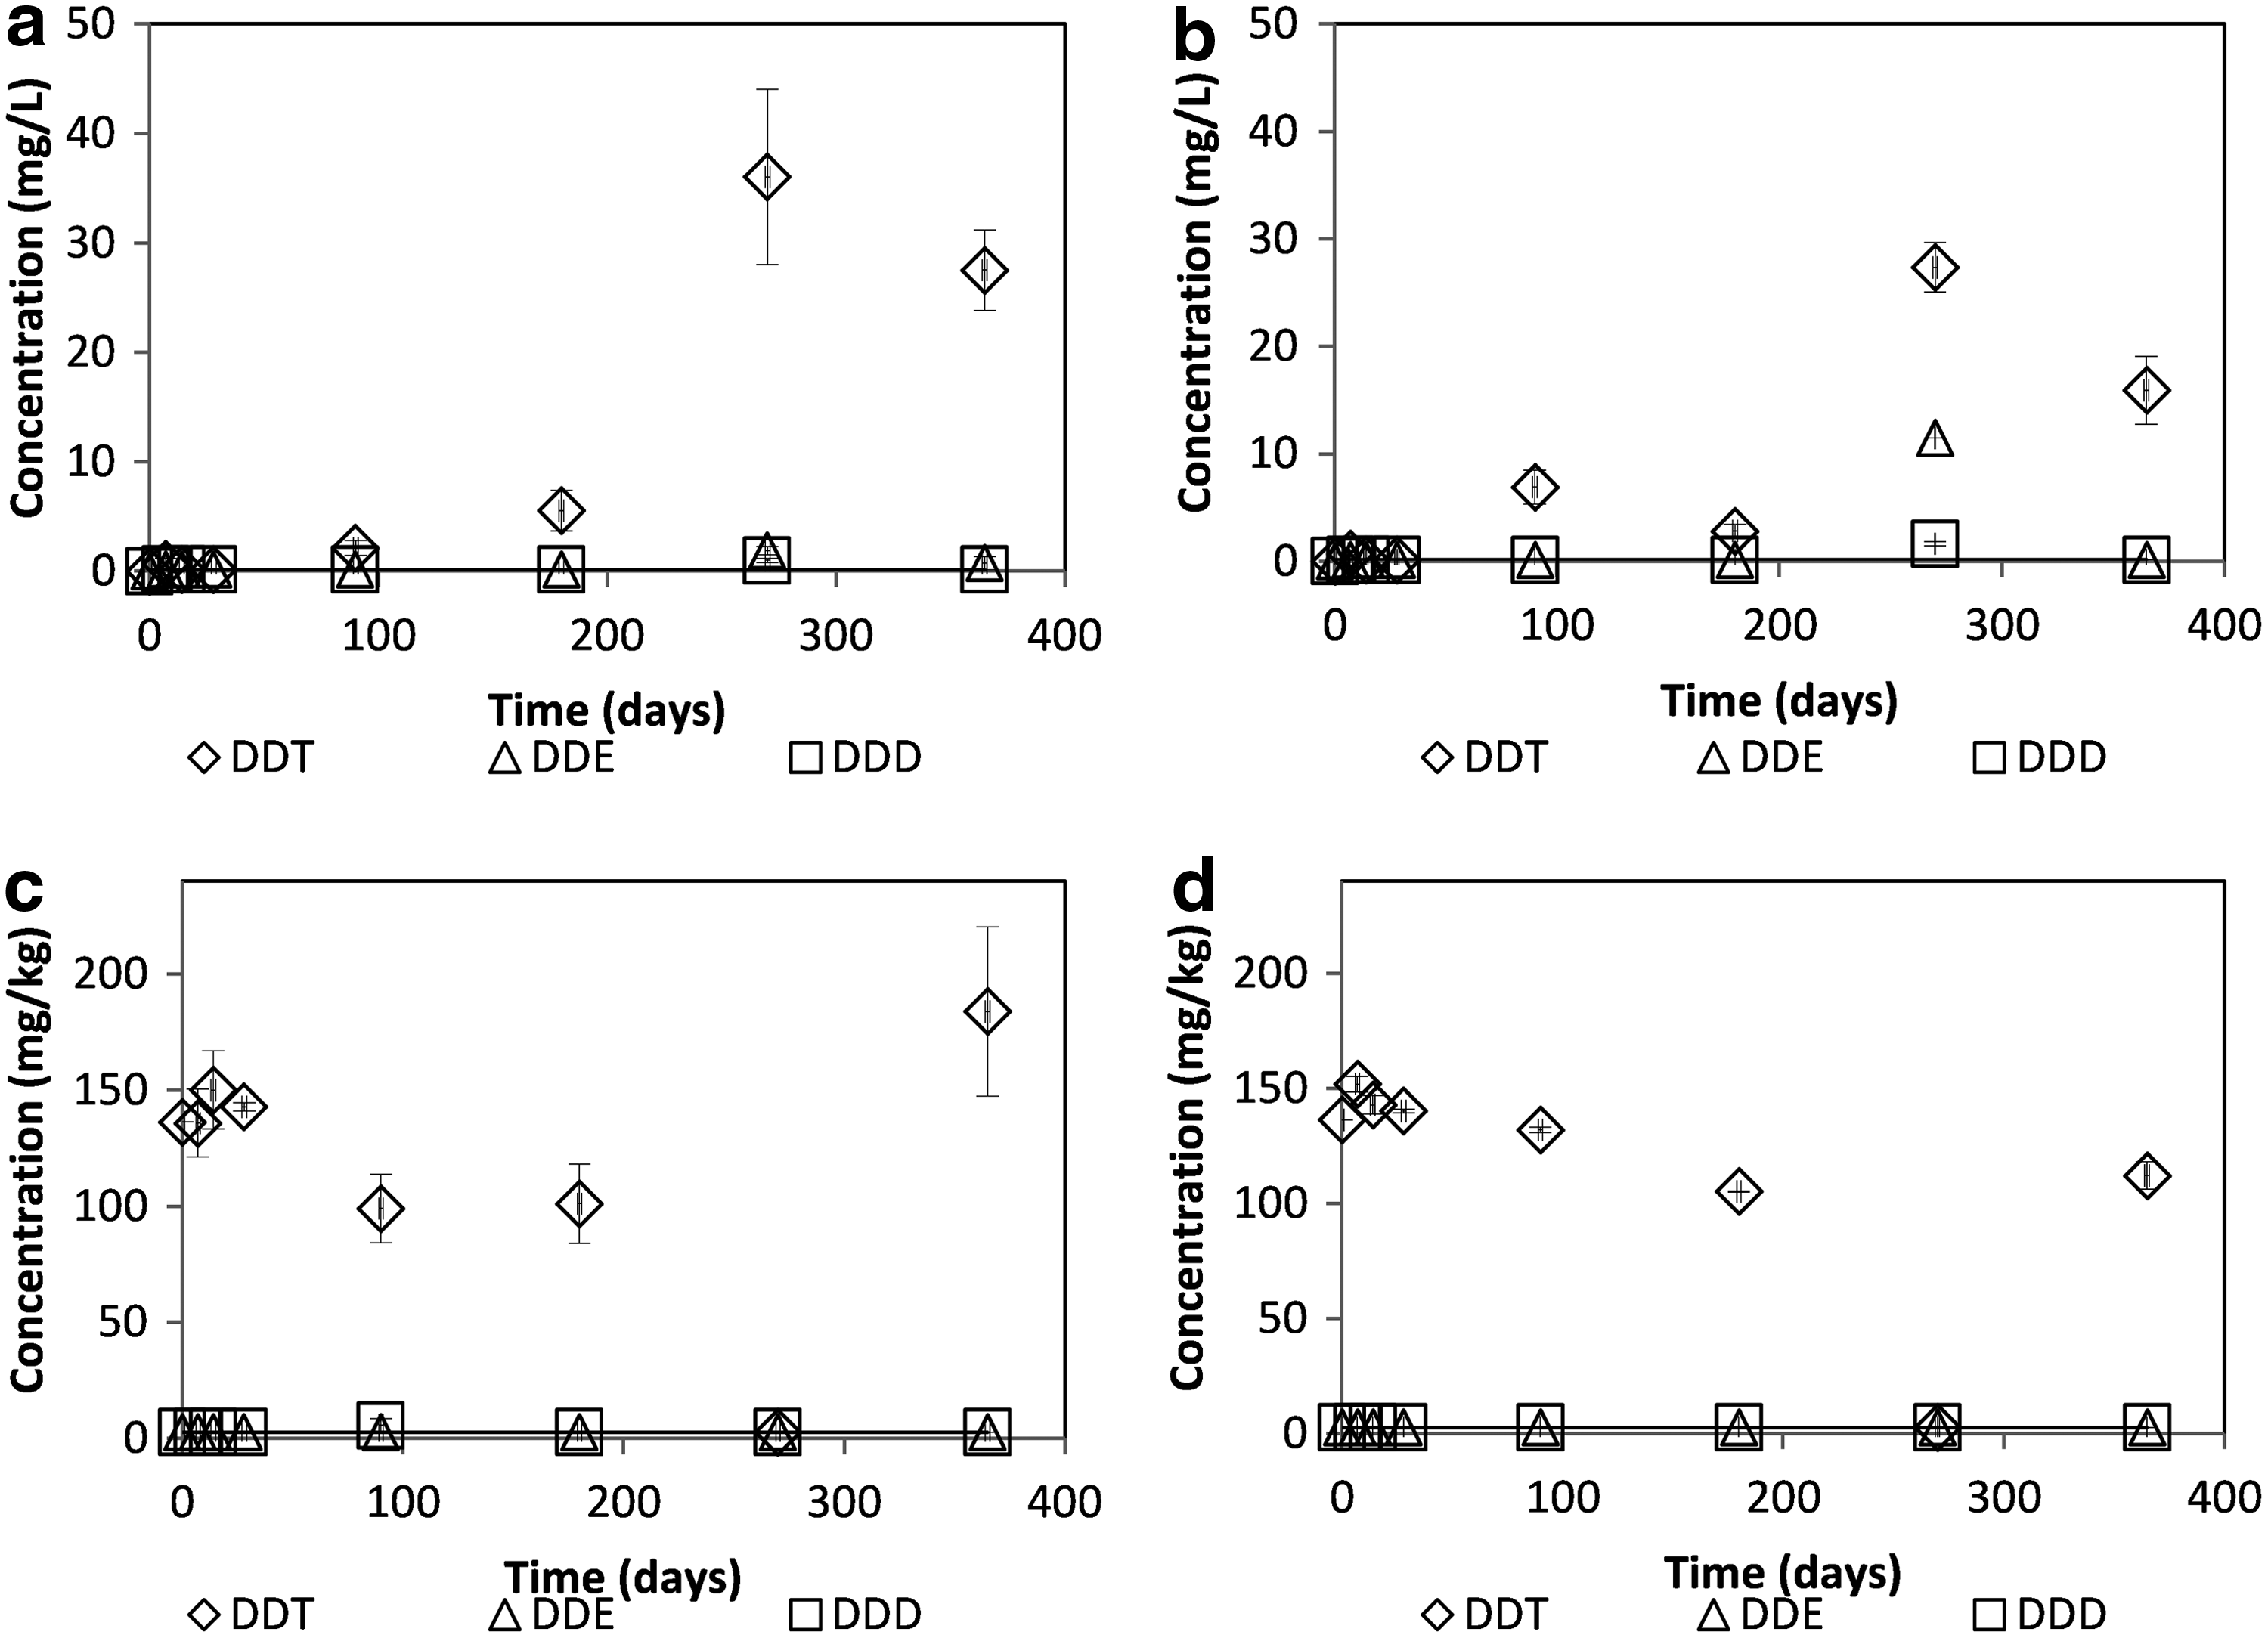
The total degradation rate for the 136 mg/kg, 60 day aged soil after 1 year was observed as 7% for experiments and <1% for controls, which corresponds to 0.832 ± 0.061 and 0.082 ± 0.029 mg DDT degradation, respectively (p < 0.05). There was no metabolite measured during the first 9 months of experiments. The slow dissipation activity during the first months of the experiment can be attributed to stronger sorption and lower bioavailability due to higher initial concentration (Liu et al., 2008).
More DDT was detected in the soil phase (90%) when compared to the 24 mg/kg, 60 day aged soil (50%) and 33 mg/kg, 200 day aged soil (50%) was attributed to stronger sorption due to higher initial concentration, hydrophobicity, and low water solubility of DDT. A total of 0.258 ± 0.003 and 0.057 ± 0.006 mg of DDE was seen to appear at the end of 1 year for experiments and controls, respectively (p < 0.05). The DDE measured in the control reactors was detected only in the aqueous phase (Fig. 3).
Aqueous phase:
A total of 0.036 ± 0.004 and 0.074 ± 0.056 mg of DDD was seen to appear at the end of 1 year for experiments and for controls, respectively (p > 0.05). The 0.036 mg DDD measured in experiments was found only in the aqueous phase (Fig. 3). This was expected as biodegradation is generally believed to occur after desorption to the aqueous phase.
Similar to the 24 mg/kg, 60 day aged experiments, DDE concentrations were more pronounced than DDD in the experiments. The appearance of metabolites in the aqueous phase rather than the soils phase is a sign of degradation occurring more readily in the aqueous phase. This is thought to be due to higher bioavailability and lower mass transfer limitations making metabolic activity more likely (Stark and Firestone, 1995).
Of the total DDX measured, degradation byproducts were found in small amounts and mainly in the aqueous phase but 90% of total metabolites measured were found in the soil phase (Fig. 3). These higher soil phase ratios are in accordance with sorption/desorption results (Erdem and Cutright, 2015) and result from strong sorption caused by high initial concentration. Low water solubility, 1.2–260 ppb at 25°C (Montgomery, 1996) is another reason a limited amount of desorption to the aqueous phase occurs.
Bioremediation results for 630 mg/kg, 60 days aged soil
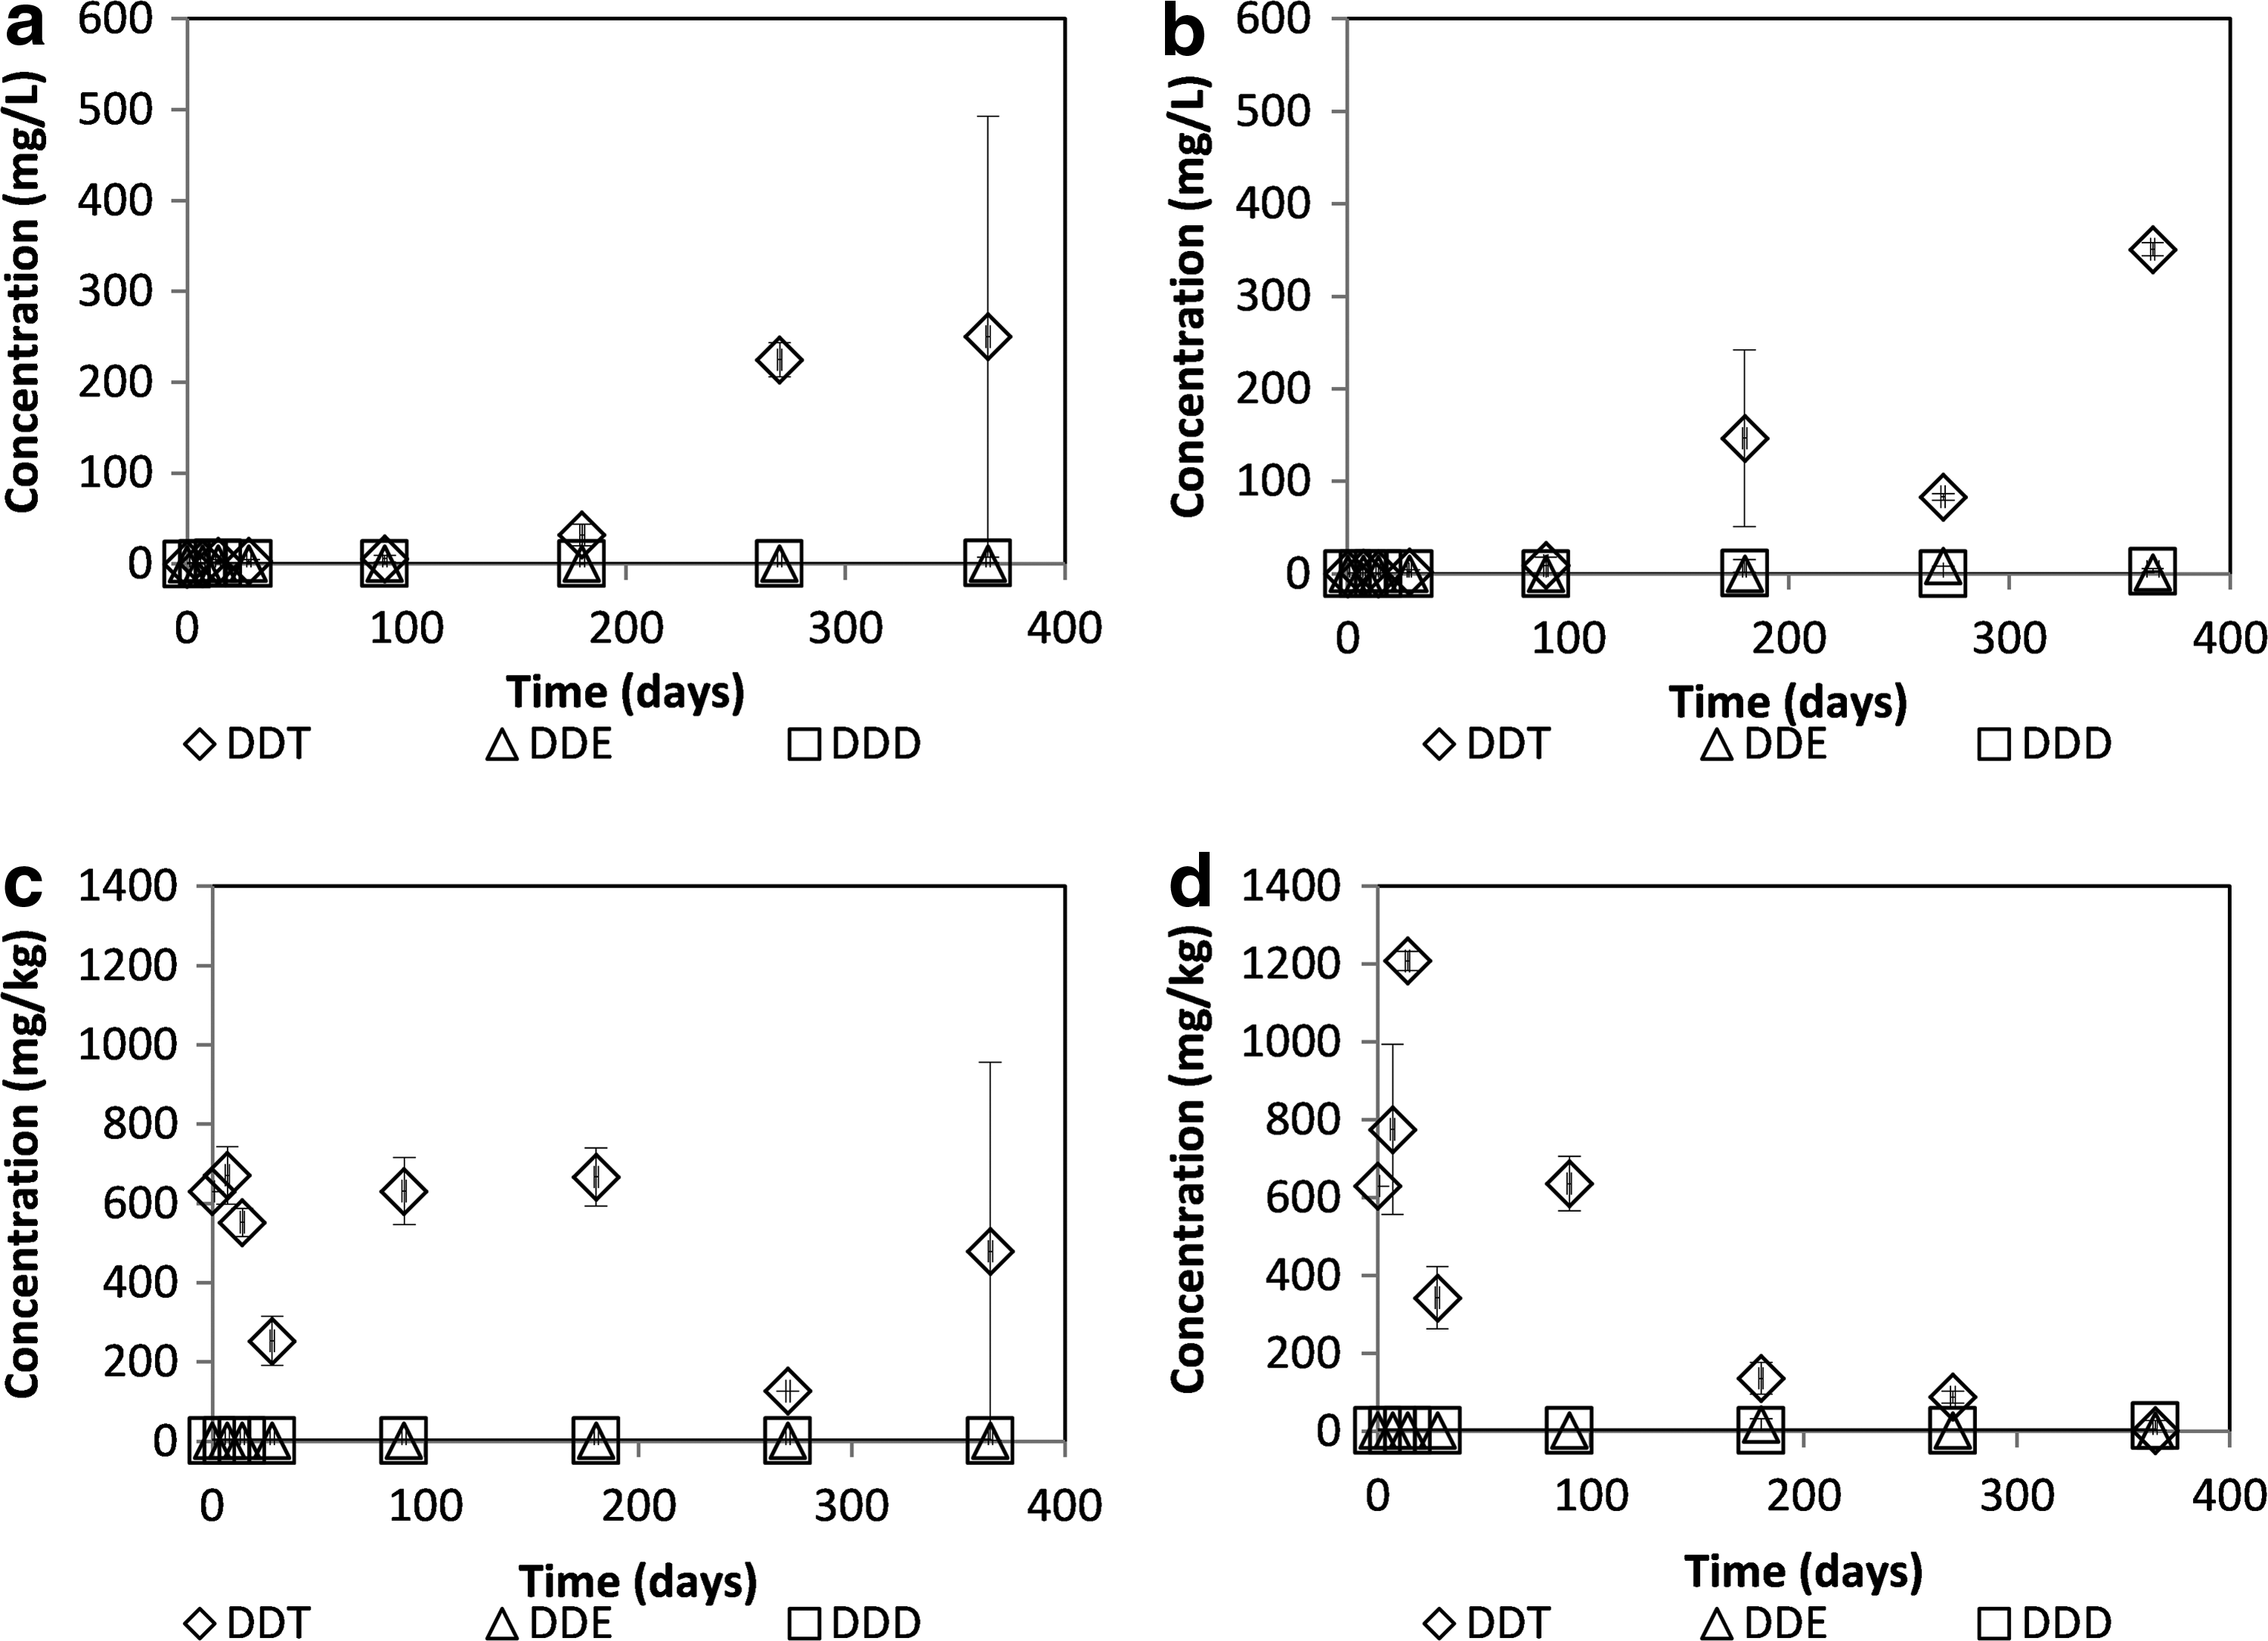
The total degradation rate for 1 year was observed as 2.5% for experiments and 1.3% for controls. This corresponds to 1.341 ± 0.109 and 0.711 ± 0.598 mg of DDT degradation, respectively (p > 0.05). DDE was more pronounced than DDD in the experiments, which is in accordance with previous A. eutrophus A5 results. Metabolites DDE and DDD were observed only after the first 6 months of experiments, which is a sign of slow desorption and degradation. A small amount of DDD was measured in the controls after 2 weeks and DDE observed after 9 months. The large error bars and inconsistencies of metabolite appearance (Fig. 4) are due to each reactor being a destructive independent sample and the samples consisting of nonhomogeneous soil. A total of 0.431 ± 0.019 and 0.016 ± 0.008 mg of DDE was seen to appear at the end of 1 year for experiments and controls, respectively (p < 0.05). DDE was measured in both control (Fig. 4) and experiment reactors. A total of 0.249 ± 0.088 and 0.043 ± 0.010 mg of DDD was seen to appear at the end of 1 year for experiments and for controls, respectively (p > 0.05). The 0.249 mg DDD measured in experiments was found only in the aqueous phase (Fig. 4).
Aqueous phase:
In this study, both increased contact time and higher initial DDT concentrations were seen to reduce the biodegradation potential of A. eutrophus A5. Low biodegradation rates have been attributed to the toxicity of DDT toward microorganisms (Fang et al., 2010). The bacterium used for bioremediation experiments was acclimated to of DDT. When bacterial populations were assessed via plate counts, the results yielded 8.23 ± 0.96 × 10⁸ CFU/mL. Groundwater has an average bacterial count ranging from 103 to 108 CFU/mL and soils generally have a count in the interval of 103–107 CFU/g (Cookson, 1995); therefore, this value is accepted as viable. The decrease in biodegradation may be attributed to lower bioavailability due to higher initial concentration, ageing and sorption, and the general resistance to degradation shown by organochlorine pesticides.
In all four data sets, it was seen that independent of initial concentration or ageing time, the total mass of DDT degraded partially did not exceed 1.34 mg/year (2.5%). When compared across all conditions, there was a statistically significant difference between DDT degradation of all data sets except two pairs. The 24 mg/kg (60 day aged) soil versus 33 mg/kg (200 day aged) soil and 136 mg/kg (60 day aged) versus 630 mg/kg (60 day aged) soil showed no significant difference in total DDT degradation (p > 0.05). Greater amounts of DDT degradation was observed for higher initial concentrations. Metabolites DDE and DDD were found in the soil phase in small amounts (Fig. 4d).
Most scientists agree that a single microorganism that facilitates all steps necessary for complete mineralization of DDT has not been found yet (Foght et al., 2001; Gautam and Suresh, 2009). These findings all indicate that, to completely degrade DDT and its metabolites, a better understanding of the probable pathways is needed and the characteristics and capabilities of microorganisms must be better assessed (i.e., catabolic activities, microorganism community composition, and degradation rates) (Stenuit et al., 2008).
Conclusions
Soil and contaminant characteristics greatly influence the fate of organic pollutants in the environment and bioremediation has been investigated for some time. A small amount of partial degradation was observed, mainly in the aqueous phase and the main metabolites were DDE and DDD. The study has again demonstrated that 4,4-DDT, a hydrophobic organochlorine pesticide, is highly resistant to biodegradation.
The key findings of this study can be summarized as follows:
• Partial degradation of DDT was observed, mainly in the aqueous phase, in the range of 0.25–1.34 mg/year (2.5–13%). The main metabolites were observed in the range of 0.25–0.45 mg/year DDE and 0.04–0.421 mg/year DDD respectively. • DDE was more dominant than DDD, a result most likely due to the metabolic pathway of A. eutrophus A5. • Metabolites DDE and DDD were mainly measured in the aqueous phase an expected outcome due to the hydrophobicity and recalcitrance of DDT. • Small 4,4-DDT degradation, even in a controlled environment, corroborates the difficulty in detoxification of xenobiotics. • This work generated a transient dissipation data set for the aerobic metabolism of DDT and formation of two primary metabolites (DDE and DDD) from which kinetic pathways can be explored and rate constants quantified.
The data show that concentration and soil age impact the fate of pesticides within soil but further studies must be carried out, comparing the effect of soil parameters (pH, organic matter content, clay content, and particle size), different bacterial species, and nutrient compositions. We strongly recommend spiking each soil reactor individually when conducting soil bioremediation experiments with hydrophobic compounds. This will ensure better measurement consistency when compared to spiking the bulk soil and dividing in to test tubes later. Species naturally acclimated to DDT should be used for further experiments. In field studies naturally attenuated microorganism consortia are reported to be more effective.
Footnotes
Author Disclosure Statement
No competing financial interests exist.