The objective of this study was to evaluate nitrous oxide (N2O) emissions on nitritation in activated sludge sequencing batch reactor (ASSBR) and sequencing batch biofilm reactor (SBBR) treating ammonium-rich wastewater at two different influent ammonium concentrations. During stable operation, there was no significant difference of \documentclass{aastex}\usepackage{amsbsy}\usepackage{amsfonts}\usepackage{amssymb}\usepackage{bm}\usepackage{mathrsfs}\usepackage{pifont}\usepackage{stmaryrd}\usepackage{textcomp}\usepackage{portland, xspace}\usepackage{amsmath, amsxtra}\pagestyle{empty}\DeclareMathSizes{10}{9}{7}{6}\begin{document}
$${ \rm NH}_4^ + { {\hbox {-}} { \rm N}}$$
\end{document} removal efficiencies between the two reactors. At the end of nitrification, both nitrite accumulation rates were above 85%. However, SBBR had a better total nitrogen (TN) removal efficiency (81.7% ± 1.5%) than that of ASSBR (66.5% ± 5.7%). According to typical cycles, when influent \documentclass{aastex}\usepackage{amsbsy}\usepackage{amsfonts}\usepackage{amssymb}\usepackage{bm}\usepackage{mathrsfs}\usepackage{pifont}\usepackage{stmaryrd}\usepackage{textcomp}\usepackage{portland, xspace}\usepackage{amsmath, amsxtra}\pagestyle{empty}\DeclareMathSizes{10}{9}{7}{6}\begin{document}
$${ \rm NH}_4^ + { {\hbox {-}} { \rm N}}$$
\end{document} concentrations were 120 mg/L and 240 mg/L, N2O emissions during nitritation in SBBR accounted for 2.3% ± 0.4% and 6.5% ± 0.9% of the TN removed, respectively, which were 1/3-1/2 of that in ASSBR (6.6% ± 0.6%, 14.1% ± 1.6%). In addition, N2O production increased with increase of feed ammonia concentration in both reactors. These results contribute to further understanding of N2O emission in partial nitrifying system.
Introduction
Nitrogen removal via nitrite process is regarded as one of the cost-effective and sustainable biological nitrogen removal processes. The energy and carbon savings of partial nitrifying system are by virtue of restricting ammonia oxidation to nitrite rather than to nitrate (Wei et al., 2014). Therefore, it has great potential especially for ammonium-rich waste water treatment, in which organic matter is a limiting substrate to anoxic denitrification (Wei et al., 2013).
So far, most of the influencing factors including dissolved oxygen (DO), solid retention time, temperature, free ammonia (FA), and free nitrous acid (FNA) were investigated to achieve the reduction of the activity of nitrite oxidizing bacteria (NOB), without affecting ammonia oxidizing bacteria (AOB) (Guo et al., 2010). It is believed that DO is one of the critical parameters among those factors for achieving and maintaining nitritation, since oxygen affinity constant of AOB (0.3 mg/L) is lower than that of NOB (1.1 mg/L) (Ciudad et al., 2005).
Simultaneous nitrification denitrification (SND) via nitrite process is also a promising process, due to its high nutrient removal efficiency and low energy consumption (Zeng et al., 2004). The sequencing batch biofilm reactor (SBBR) can create a beneficial anoxic micro environment under aerobic conditions and has better performance of simultaneous nitrification and denitrification (Rong et al., 2008).
However, nitrite accumulation in either suspended activated sludge or biofilm reactor is commonly considered as an important factor causing nitrous oxide (N2O) production (Kong et al., 2013). N2O, a potent greenhouse gas and a major sink of stratospheric ozone (IPCC, 2007), can be produced by AOB via two main pathways: (1) the reduction of \documentclass{aastex}\usepackage{amsbsy}\usepackage{amsfonts}\usepackage{amssymb}\usepackage{bm}\usepackage{mathrsfs}\usepackage{pifont}\usepackage{stmaryrd}\usepackage{textcomp}\usepackage{portland, xspace}\usepackage{amsmath, amsxtra}\pagestyle{empty}\DeclareMathSizes{10}{9}{7}{6}\begin{document}
$${ \rm NO}_{2}^ -$$
\end{document} as terminal electron acceptor to N2O via nitric oxide (NO), known as AOB denitrification (Kim et al., 2010) and (2) N2O as a side product during incomplete oxidation of hydroxylamine (NH2OH) to \documentclass{aastex}\usepackage{amsbsy}\usepackage{amsfonts}\usepackage{amssymb}\usepackage{bm}\usepackage{mathrsfs}\usepackage{pifont}\usepackage{stmaryrd}\usepackage{textcomp}\usepackage{portland, xspace}\usepackage{amsmath, amsxtra}\pagestyle{empty}\DeclareMathSizes{10}{9}{7}{6}\begin{document}
$${ \rm NO}_{2}^ -$$
\end{document}, which is one of the key steps involved in ammonia oxidation (Law et al., 2012). It also would produce more N2O in the denitrification using intracellular storage compounds as carbon source when treating low C/N ratio wastewater (Jia et al., 2012).
In recent years, many studies focused on the investigation of N2O production usually associated with nitritation process. It has been found that N2O production during nitrogen removal via nitrite was 1.5 times as much as that during nitrogen removal via nitrate (Yang et al., 2009). Zhang et al. (2009) compared the N2O emission during nitritation in activated sludge system and SND in SBBR filled with carbon fiber by pulse feeding (ethanol was added as a carbon source every 2 h), and implied that the N2O production during SND accounted for 1/3 of that under nitritation in activated sludge system.
However, compared to SBBR with pulse feeding, N2O production and nutrient removal are quite different in SBBR performed with no addition of external carbon source. Sufficient carbon source inside the reactor led to low \documentclass{aastex}\usepackage{amsbsy}\usepackage{amsfonts}\usepackage{amssymb}\usepackage{bm}\usepackage{mathrsfs}\usepackage{pifont}\usepackage{stmaryrd}\usepackage{textcomp}\usepackage{portland, xspace}\usepackage{amsmath, amsxtra}\pagestyle{empty}\DeclareMathSizes{10}{9}{7}{6}\begin{document}
$${ \rm NO}_2^ - { {\hbox {-}}} { \rm N}$$
\end{document} accumulation (an important factor affecting the N2O production) in SBBR with pulse feeding. Thus, the N2O production in SBBR with pulse feeding was relatively low. It is desirable to explore the difference of N2O emissions associated with activated sludge system and SBBR operated under nitritation mode without external carbon source. But little information is available regarding this.
Based on the above-mentioned discussion, the objective of this study was to evaluate the characteristics of nitrogen removal and N2O emissions using activated sludge sequencing batch reactor (ASSBR) and SBBR. It is expected that the obtained results could contribute to further understanding of N2O emission in partial nitrifying system.
Materials and Methods
Reactor setup and operation
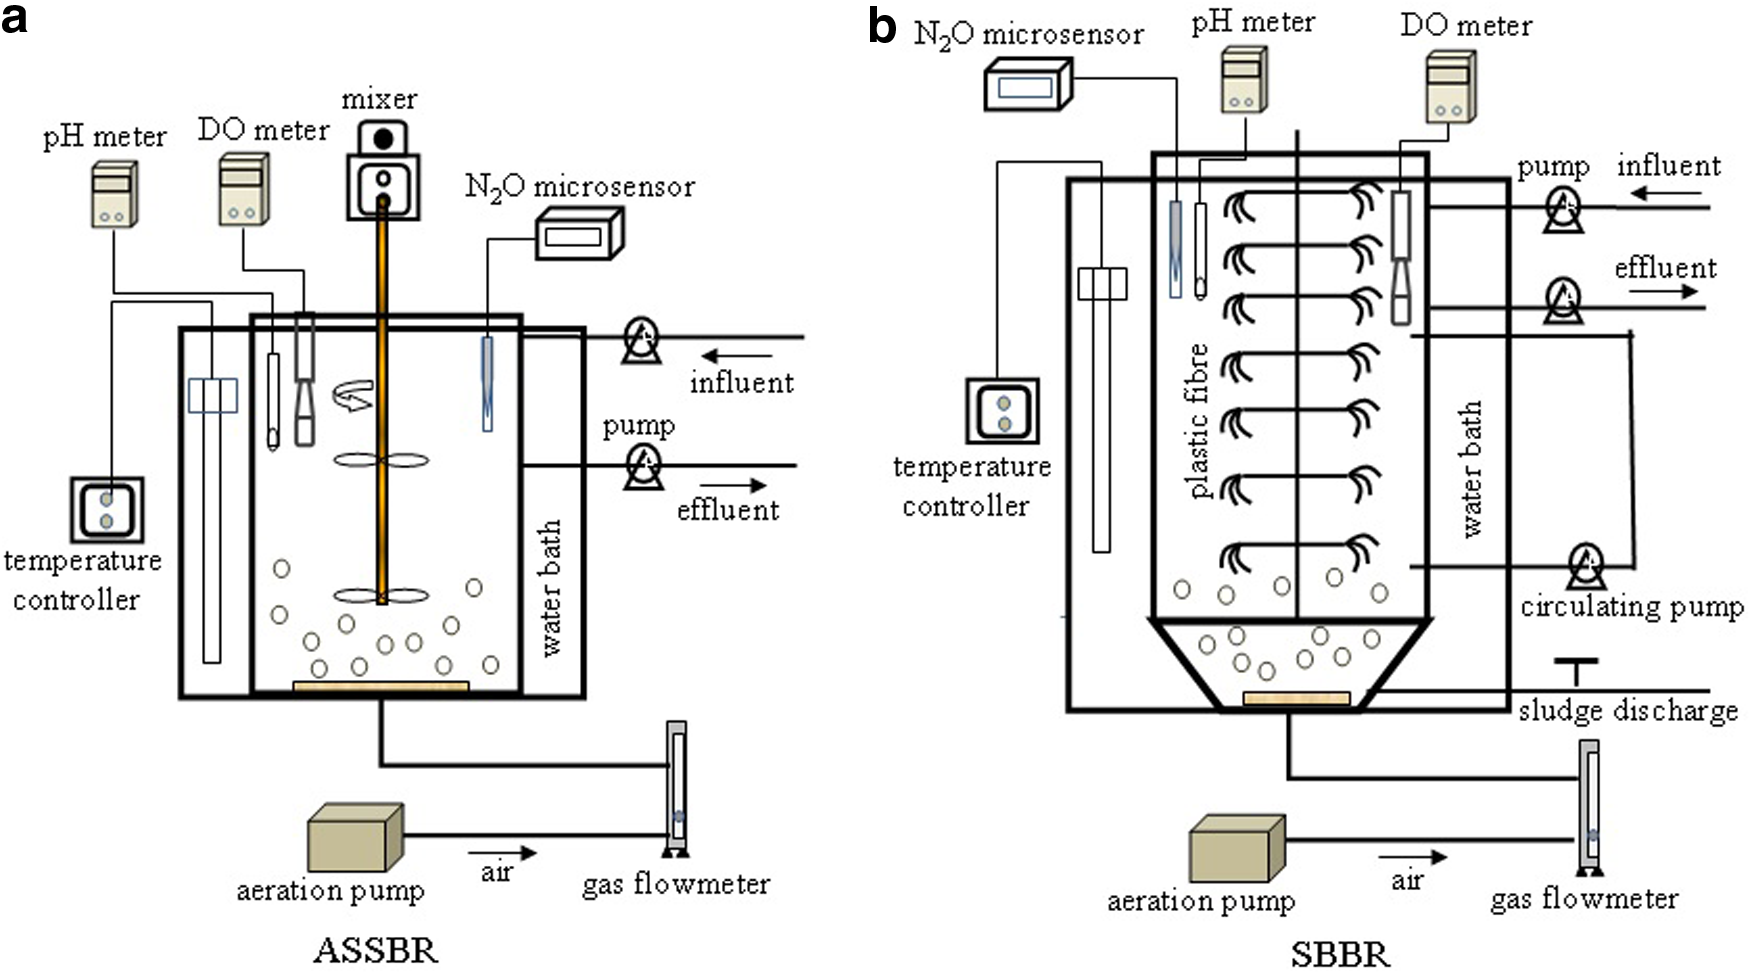
Two SBRs (ASSBR and SBBR) each with a working volume of 5 L and 13 L were used to conduct this study (Fig. 1). The biomass in ASSBR and SBBR originated from the Wastewater Treatment Plant of Chang'an District of Xi'an, China. The initial concentration of the mixed liquor suspended solids (MLSS) in both reactors was 3000 mg/L. The percentage of VSS in TSS for ASSBR was 80% ± 2%. SBBR was a fixed bed sequencing batch reactor filled with plastic fiber. The fill ratio was 12%. The volumetric exchange ratios of both reactors were 36% with a cycle of 12 h. A constant airflow for aeration was introduced through a fine air diffuser at the bottom of the reactor and the aeration rate was kept at 20 L/h for all of the tests (DO concentrations were 0.10–0.25 mg/L in ASSBR and 1.50–2.00 mg/L in SBBR). A time controller was used to achieve the two SBRs running automatically. The temperature of the two SBRs was maintained at 30°C ± 2°C using a thermostatic heater in water bath. The solids retention time was kept at 15 days by discharging excess sludge.
Schematic descriptions of experimental systems: (a) is ASSBR and (b) is SBBR. ASSBR, activated sludge sequencing batch reactor; SBBR, sequencing batch biofilm reactor.
Both reactors were operated sequentially in 12 h-cycle under alternating anaerobic/aerobic/anoxic conditions. Each cycle of ASSBR and SBBR consisted of feeding (10 min), anaerobic reaction (50 min), aerobic and anoxic reaction (the length of the aerobic phase was determined by the change of DO and pH: air was still provided for another 0.5 h after the appearance of the “ammonia valley” point on the DO and pH curve (Fig. 2), then the anoxic reaction phase began), settling (40 min), and decanting (10 min).
Typical variations of nitrogen compounds and control parameters with low ammonia nitrogen (120 mg/L) in two SBR cycles: (a1, b1, c1) are COD, N-compounds, pH, DO and N2O in ASSBR; (a2, b2, c2) are COD, N-compounds, pH, DO and N2O in SBBR. DO, dissolved oxygen; FA, free ammonia.
In a preanoxic system, the anoxic phase is placed before the aerobic phase and mixed liquor containing nitrite is recirculated from the aerobic stage to the anoxic stage and in this kind of process complete removal of total nitrogen (TN) is almost unattainable. On the contrary, in a postanoxic process the anoxic phase is placed after the aerobic phase and mixed liquor recirculation is not necessary. Under anoxic condition, the internal carbon sources stored during the former reaction could be used for denitrification. In addition, the anaerobic/aerobic/anoxic process adopted here was a new process for recovery of nitrous oxide, which was reported by Zhao et al. (2015). In this article, the anaerobic/aerobic phases of two anaerobic/aerobic/anoxic processes were investigated, one was in a sequencing batch activated sludge reactor and the other was in a sequencing batch biofilm reactor, to compare the characteristics of N2O emissions during nitritation of the two reactors.
After running for over 3 months, nitritation in the aeration process in two reactors were successfully achieved. The N2O production during nitrification was measured more than three times. At the same time, liquid samples were also taken to measure the water quality (\documentclass{aastex}\usepackage{amsbsy}\usepackage{amsfonts}\usepackage{amssymb}\usepackage{bm}\usepackage{mathrsfs}\usepackage{pifont}\usepackage{stmaryrd}\usepackage{textcomp}\usepackage{portland, xspace}\usepackage{amsmath, amsxtra}\pagestyle{empty}\DeclareMathSizes{10}{9}{7}{6}\begin{document}
$${ \rm NH}_4^ + { {\hbox {-}} { \rm N} , { \rm NO}_2^ - { {\hbox {-}}} { \rm N} , { \rm NO}_3^ - { {\hbox {-}}} { \rm N}}$$
\end{document}, and COD).
The \documentclass{aastex}\usepackage{amsbsy}\usepackage{amsfonts}\usepackage{amssymb}\usepackage{bm}\usepackage{mathrsfs}\usepackage{pifont}\usepackage{stmaryrd}\usepackage{textcomp}\usepackage{portland, xspace}\usepackage{amsmath, amsxtra}\pagestyle{empty}\DeclareMathSizes{10}{9}{7}{6}\begin{document}
$${ \rm NO}_2^ -$$
\end{document} concentration (<5 mg/L) was low at the end of a cycle (anaerobic/aerobic/anoxic) in SBBR; consequently, less \documentclass{aastex}\usepackage{amsbsy}\usepackage{amsfonts}\usepackage{amssymb}\usepackage{bm}\usepackage{mathrsfs}\usepackage{pifont}\usepackage{stmaryrd}\usepackage{textcomp}\usepackage{portland, xspace}\usepackage{amsmath, amsxtra}\pagestyle{empty}\DeclareMathSizes{10}{9}{7}{6}\begin{document}
$${ \rm NO}_2^ -$$
\end{document} participated in the next reaction phase. However, \documentclass{aastex}\usepackage{amsbsy}\usepackage{amsfonts}\usepackage{amssymb}\usepackage{bm}\usepackage{mathrsfs}\usepackage{pifont}\usepackage{stmaryrd}\usepackage{textcomp}\usepackage{portland, xspace}\usepackage{amsmath, amsxtra}\pagestyle{empty}\DeclareMathSizes{10}{9}{7}{6}\begin{document}
$${ \rm NO}_2^ -$$
\end{document} concentration (>20 mg/L) at the end of a complete cycle in ASSBR was significantly higher than that in SBBR. Before the typical cycle (comparison test), the higher \documentclass{aastex}\usepackage{amsbsy}\usepackage{amsfonts}\usepackage{amssymb}\usepackage{bm}\usepackage{mathrsfs}\usepackage{pifont}\usepackage{stmaryrd}\usepackage{textcomp}\usepackage{portland, xspace}\usepackage{amsmath, amsxtra}\pagestyle{empty}\DeclareMathSizes{10}{9}{7}{6}\begin{document}
$${ \rm NO}_2^ -$$
\end{document} that remained in the ASSBR at the end of a cycle was washed out using distilled water to avoid the influence of remaining high \documentclass{aastex}\usepackage{amsbsy}\usepackage{amsfonts}\usepackage{amssymb}\usepackage{bm}\usepackage{mathrsfs}\usepackage{pifont}\usepackage{stmaryrd}\usepackage{textcomp}\usepackage{portland, xspace}\usepackage{amsmath, amsxtra}\pagestyle{empty}\DeclareMathSizes{10}{9}{7}{6}\begin{document}
$${ \rm NO}_2^ -$$
\end{document} on next cycle's N2O production, so that the two reactors could be compared under the similar initial conditions.
Ammonium-rich wastewater
Composition of synthetic ammonium-rich waste water was as follows (mg/L): COD (as glucose), 500 mg/L; \documentclass{aastex}\usepackage{amsbsy}\usepackage{amsfonts}\usepackage{amssymb}\usepackage{bm}\usepackage{mathrsfs}\usepackage{pifont}\usepackage{stmaryrd}\usepackage{textcomp}\usepackage{portland, xspace}\usepackage{amsmath, amsxtra}\pagestyle{empty}\DeclareMathSizes{10}{9}{7}{6}\begin{document}
$${ \rm NH}_4^ + { {\hbox {-}} { \rm N}}$$
\end{document} (as ammonium bicarbonate), 120 and 240 mg/L; KH2PO4, 330 mg/L; CaCl2, 16 mg/L; NaHCO3, 1500 mg/L; MgSO4.7H2O, 50 mg/L, and trace element solution 1 mL/L (Lovley and Phillips, 1988).
Analytical methods
\documentclass{aastex}\usepackage{amsbsy}\usepackage{amsfonts}\usepackage{amssymb}\usepackage{bm}\usepackage{mathrsfs}\usepackage{pifont}\usepackage{stmaryrd}\usepackage{textcomp}\usepackage{portland, xspace}\usepackage{amsmath, amsxtra}\pagestyle{empty}\DeclareMathSizes{10}{9}{7}{6}\begin{document}
$${ \rm NH}_4^ + { {\hbox {-}} { \rm N}} , { \rm NO}_2^ - { {\hbox {-}} { \rm N} , { \rm NO}_3^ - { {\hbox {-}} { \rm N}}}$$
\end{document}, COD, VSS, TSS, and MLSS were measured according to the Chinese State Environmental Protection Agency (SEPA) Standard Methods (Chinese SEPA, 2002). TN was based on the sum of \documentclass{aastex}\usepackage{amsbsy}\usepackage{amsfonts}\usepackage{amssymb}\usepackage{bm}\usepackage{mathrsfs}\usepackage{pifont}\usepackage{stmaryrd}\usepackage{textcomp}\usepackage{portland, xspace}\usepackage{amsmath, amsxtra}\pagestyle{empty}\DeclareMathSizes{10}{9}{7}{6}\begin{document}
$${ \rm NH}_4^ + { {\hbox {-}} { \rm N}} , { \rm NO}_2^ - { {\hbox {-}} { \rm N} , { \rm NO}_3^ - { {\hbox {-}} { \rm N}}}$$
\end{document} rather than an independent TN test. On-line data were collected by probes for pH value, DO concentration, and temperature.
FA concentration was calculated according to Anthonisen et al. (1976). Dissolved N2O concentration was measured using N2O microsensor (Unisense, Denmark). Nitrite accumulation ratio (NAR) was calculated according to Zeng et al. (2014).
N2O production and emission
N2O generation [rg; mg N/(L·s); Eq. (1)], accumulation [ra; mg N/(L·s); Eq. (2)], and emission [re; mg N/(L·s); Eq. (3)] rates were calculated using balances based on on-line N2O liquid concentration measurements (J. Gabarró et al., 2014).
\documentclass{aastex}\usepackage{amsbsy}\usepackage{amsfonts}\usepackage{amssymb}\usepackage{bm}\usepackage{mathrsfs}\usepackage{pifont}\usepackage{stmaryrd}\usepackage{textcomp}\usepackage{portland, xspace}\usepackage{amsmath, amsxtra}\pagestyle{empty}\DeclareMathSizes{10}{9}{7}{6}\begin{document}
\begin{align*}r_g = r_e + r_a \tag{1}\end{align*}
\end{document}\documentclass{aastex}\usepackage{amsbsy}\usepackage{amsfonts}\usepackage{amssymb}\usepackage{bm}\usepackage{mathrsfs}\usepackage{pifont}\usepackage{stmaryrd}\usepackage{textcomp}\usepackage{portland, xspace}\usepackage{amsmath, amsxtra}\pagestyle{empty}\DeclareMathSizes{10}{9}{7}{6}\begin{document}
\begin{align*}r_a = dc_{N_{2}O} / dt \tag{2}\end{align*}
\end{document}
When N2O diffused from water to air, the N2O emission rate can be calculated by Equation (3) (Hu et al., 2014).
\documentclass{aastex}\usepackage{amsbsy}\usepackage{amsfonts}\usepackage{amssymb}\usepackage{bm}\usepackage{mathrsfs}\usepackage{pifont}\usepackage{stmaryrd}\usepackage{textcomp}\usepackage{portland, xspace}\usepackage{amsmath, amsxtra}\pagestyle{empty}\DeclareMathSizes{10}{9}{7}{6}\begin{document}
\begin{align*}r_e = dc_{N_{2}O} / dt = - K_{LaN_{2}O} * (
C_{N_{2}O} -C_{S}) \tag{3}\end{align*}
\end{document}
where \documentclass{aastex}\usepackage{amsbsy}\usepackage{amsfonts}\usepackage{amssymb}\usepackage{bm}\usepackage{mathrsfs}\usepackage{pifont}\usepackage{stmaryrd}\usepackage{textcomp}\usepackage{portland, xspace}\usepackage{amsmath, amsxtra}\pagestyle{empty}\DeclareMathSizes{10}{9}{7}{6}\begin{document}
$$K_{LaN_{2}O}$$
\end{document} is the volumetric mass transfer coefficient of N2O from water to air (s−1); \documentclass{aastex}\usepackage{amsbsy}\usepackage{amsfonts}\usepackage{amssymb}\usepackage{bm}\usepackage{mathrsfs}\usepackage{pifont}\usepackage{stmaryrd}\usepackage{textcomp}\usepackage{portland, xspace}\usepackage{amsmath, amsxtra}\pagestyle{empty}\DeclareMathSizes{10}{9}{7}{6}\begin{document}
$$C_{N_{2}O}$$
\end{document} is the N2O concentration in liquid (mg N/L); CS is N2O saturation concentration in the liquid in equilibrium with air (mg N/L; assumed as 0); t is time (sec). Equation (3) was rewritten as
\documentclass{aastex}\usepackage{amsbsy}\usepackage{amsfonts}\usepackage{amssymb}\usepackage{bm}\usepackage{mathrsfs}\usepackage{pifont}\usepackage{stmaryrd}\usepackage{textcomp}\usepackage{portland, xspace}\usepackage{amsmath, amsxtra}\pagestyle{empty}\DeclareMathSizes{10}{9}{7}{6}\begin{document}
\begin{align*}r_e = dc_{N_{2}O} / dt = - K_{LaN_{2}O} *
C_{N_{2}O} \tag{4}\end{align*}
\end{document}
\documentclass{aastex}\usepackage{amsbsy}\usepackage{amsfonts}\usepackage{amssymb}\usepackage{bm}\usepackage{mathrsfs}\usepackage{pifont}\usepackage{stmaryrd}\usepackage{textcomp}\usepackage{portland, xspace}\usepackage{amsmath, amsxtra}\pagestyle{empty}\DeclareMathSizes{10}{9}{7}{6}\begin{document}
$$K_{LaN_{2}O}$$
\end{document} was determined by the following experiment: first, reactor that was at the end of settling phase was diluted using distilled water several times to remove the background components; then, moderate N2O gas was ingested into the liquid of the reactor and the decrease of N2O concentrations were measured. The re under certain aeration conditions was found by calculation of the N2O reduction per second; finally, \documentclass{aastex}\usepackage{amsbsy}\usepackage{amsfonts}\usepackage{amssymb}\usepackage{bm}\usepackage{mathrsfs}\usepackage{pifont}\usepackage{stmaryrd}\usepackage{textcomp}\usepackage{portland, xspace}\usepackage{amsmath, amsxtra}\pagestyle{empty}\DeclareMathSizes{10}{9}{7}{6}\begin{document}
$$K_{LaN_{2}O}$$
\end{document} was obtained by a linear fitting of re and \documentclass{aastex}\usepackage{amsbsy}\usepackage{amsfonts}\usepackage{amssymb}\usepackage{bm}\usepackage{mathrsfs}\usepackage{pifont}\usepackage{stmaryrd}\usepackage{textcomp}\usepackage{portland, xspace}\usepackage{amsmath, amsxtra}\pagestyle{empty}\DeclareMathSizes{10}{9}{7}{6}\begin{document}
$$C_{N_{2}O}$$
\end{document}. The total N2O production was obtained by the integral calculation of producing rate during reaction time.
Results and Discussion
Pollutant removal performance
Table 1 showed the contaminant removal performance of the two SBRs. The COD removal rates in ASSBR and SBBR were above 91%. In both reactors nearly all the \documentclass{aastex}\usepackage{amsbsy}\usepackage{amsfonts}\usepackage{amssymb}\usepackage{bm}\usepackage{mathrsfs}\usepackage{pifont}\usepackage{stmaryrd}\usepackage{textcomp}\usepackage{portland, xspace}\usepackage{amsmath, amsxtra}\pagestyle{empty}\DeclareMathSizes{10}{9}{7}{6}\begin{document}
$${ \rm NH}_4^ + { {\hbox {-}} { \rm N}}$$
\end{document} in the influent was removed completely with the removal rate of 98–99%. However, there was an obvious difference in TN removal efficiencies of the two reactors with TN removal efficiencies being 66.02–66.50% and 81.72–82.06% for ASSBR and SBBR, respectively. Obvious nitrite accumulations with above 85% of NAR were achieved at the end of the aerobic phases of the two reactors. The \documentclass{aastex}\usepackage{amsbsy}\usepackage{amsfonts}\usepackage{amssymb}\usepackage{bm}\usepackage{mathrsfs}\usepackage{pifont}\usepackage{stmaryrd}\usepackage{textcomp}\usepackage{portland, xspace}\usepackage{amsmath, amsxtra}\pagestyle{empty}\DeclareMathSizes{10}{9}{7}{6}\begin{document}
$${ \rm NO}_2^ - { {\hbox {-}} { \rm N}}$$
\end{document} concentrations in ASSBR were significantly higher than that in SBBR under the same influent load.
Mean Contaminant Concentrations with Standard Deviations (in Parentheses) and Removal Efficiencies (%) in Each System
Pollutant removal characteristics with low nitrogen load
Figure 2a1, a2, b1, and b2 showed the time profiles of COD, TN, \documentclass{aastex}\usepackage{amsbsy}\usepackage{amsfonts}\usepackage{amssymb}\usepackage{bm}\usepackage{mathrsfs}\usepackage{pifont}\usepackage{stmaryrd}\usepackage{textcomp}\usepackage{portland, xspace}\usepackage{amsmath, amsxtra}\pagestyle{empty}\DeclareMathSizes{10}{9}{7}{6}\begin{document}
$${ \rm NH}_4^ + { {\hbox {-}} { \rm N}} , { \rm NO}_3^ - { {\hbox {-}} { \rm N}} , { \rm NO}_2^ - { {\hbox {-}} { \rm N}}$$
\end{document}, FA, and DO concentrations and pH value in a typical cycle for both reactors with influent COD and \documentclass{aastex}\usepackage{amsbsy}\usepackage{amsfonts}\usepackage{amssymb}\usepackage{bm}\usepackage{mathrsfs}\usepackage{pifont}\usepackage{stmaryrd}\usepackage{textcomp}\usepackage{portland, xspace}\usepackage{amsmath, amsxtra}\pagestyle{empty}\DeclareMathSizes{10}{9}{7}{6}\begin{document}
$${ \rm NH}_4^ + { {\hbox {-}} { \rm N}}$$
\end{document} being 500 and 120 mg/L respectively. In the anaerobic period, the \documentclass{aastex}\usepackage{amsbsy}\usepackage{amsfonts}\usepackage{amssymb}\usepackage{bm}\usepackage{mathrsfs}\usepackage{pifont}\usepackage{stmaryrd}\usepackage{textcomp}\usepackage{portland, xspace}\usepackage{amsmath, amsxtra}\pagestyle{empty}\DeclareMathSizes{10}{9}{7}{6}\begin{document}
$${ \rm NH}_4^ + { {\hbox {-}} { \rm N}}$$
\end{document} concentrations in ASSBR remained invariant after injection. While at the 0–10 min after feeding in SBBR, TN decreased rapidly as the dilution and ammonia oxidation. COD in both reactors decreased rapidly and reached a minimum at the end of the anaerobic phase.
At the initial aerobic stage of ASSBR and SBBR, pH increased till 140 min and 90 min (Fig. 2b1, b2), respectively. It was one reason that CO2 accumulated in the anaerobic phase released out of liquid. In addition, the degradation of the organic acid by aerobic bacteria was another reason. Then, the pH in the ASSBR and SBBR reactions decreased with a higher \documentclass{aastex}\usepackage{amsbsy}\usepackage{amsfonts}\usepackage{amssymb}\usepackage{bm}\usepackage{mathrsfs}\usepackage{pifont}\usepackage{stmaryrd}\usepackage{textcomp}\usepackage{portland, xspace}\usepackage{amsmath, amsxtra}\pagestyle{empty}\DeclareMathSizes{10}{9}{7}{6}\begin{document}
$${ \rm NH}_4^ + { {\hbox {-}} { \rm N}}$$
\end{document} decrease and rapid \documentclass{aastex}\usepackage{amsbsy}\usepackage{amsfonts}\usepackage{amssymb}\usepackage{bm}\usepackage{mathrsfs}\usepackage{pifont}\usepackage{stmaryrd}\usepackage{textcomp}\usepackage{portland, xspace}\usepackage{amsmath, amsxtra}\pagestyle{empty}\DeclareMathSizes{10}{9}{7}{6}\begin{document}
$${ \rm NO}_2^ - { {\hbox {-}} { \rm N}}$$
\end{document} accumulation in nitritation. COD and \documentclass{aastex}\usepackage{amsbsy}\usepackage{amsfonts}\usepackage{amssymb}\usepackage{bm}\usepackage{mathrsfs}\usepackage{pifont}\usepackage{stmaryrd}\usepackage{textcomp}\usepackage{portland, xspace}\usepackage{amsmath, amsxtra}\pagestyle{empty}\DeclareMathSizes{10}{9}{7}{6}\begin{document}
$${ \rm NO}_3^ - { {\hbox {-}} { \rm N}}$$
\end{document} had been maintained at a low level. The DO concentrations were maintained at 0.12–0.23 mg/L in ASSBR and 1.69–1.94 mg/L in SBBR. The different phenomenon of two reactors was that the pH value in ASSBR decreased significantly but not in SBBR. The more effective SND in SBBR resulted in a relatively stable pH value in SBBR.
At 520 min in ASSBR and 200 min in SBBR of oxic phase, the typical bending point, ammonia valley occurred, which indicates the end of nitritation. Complete conversion of \documentclass{aastex}\usepackage{amsbsy}\usepackage{amsfonts}\usepackage{amssymb}\usepackage{bm}\usepackage{mathrsfs}\usepackage{pifont}\usepackage{stmaryrd}\usepackage{textcomp}\usepackage{portland, xspace}\usepackage{amsmath, amsxtra}\pagestyle{empty}\DeclareMathSizes{10}{9}{7}{6}\begin{document}
$${ \rm NH}_4^ + { {\hbox {-}} { \rm N}}$$
\end{document} into \documentclass{aastex}\usepackage{amsbsy}\usepackage{amsfonts}\usepackage{amssymb}\usepackage{bm}\usepackage{mathrsfs}\usepackage{pifont}\usepackage{stmaryrd}\usepackage{textcomp}\usepackage{portland, xspace}\usepackage{amsmath, amsxtra}\pagestyle{empty}\DeclareMathSizes{10}{9}{7}{6}\begin{document}
$${ \rm NO}_2^ - { {\hbox {-}} { \rm N}}$$
\end{document} occurred at the end of the oxic phase, along with the maximum concentration of nitrite (42.49 mg/L and 22.12 mg/L, respectively). The FA concentrations were above the threshold concentration of NOB inhibition (0.1–1.0 mg/L), but below the threshold concentration of AOB inhibition (10–150 mg/L), which explained the \documentclass{aastex}\usepackage{amsbsy}\usepackage{amsfonts}\usepackage{amssymb}\usepackage{bm}\usepackage{mathrsfs}\usepackage{pifont}\usepackage{stmaryrd}\usepackage{textcomp}\usepackage{portland, xspace}\usepackage{amsmath, amsxtra}\pagestyle{empty}\DeclareMathSizes{10}{9}{7}{6}\begin{document}
$${ \rm NO}_2^ - { {\hbox {-}} { \rm N}}$$
\end{document} accumulation from the initial stage of the oxic phase in both reactors (Anthonisen et al., 1976).
N2O emission characteristics with low nitrogen load
Figure 2c1 and c2 showed the track study of N2O production with low nitrogen load during the two SBR cycles. During the anaerobic phase and the former aerobic phase (180 min in ASSBR and 100 min in SBBR), both the reactors expressed relatively low N2O concentrations. N2O production obviously increased when nitrite concentration accumulated to 5–6 mg/L. Nitrite accumulated as soon as no more degradable organic matter was available. In this study, both the reactors were supplied with high \documentclass{aastex}\usepackage{amsbsy}\usepackage{amsfonts}\usepackage{amssymb}\usepackage{bm}\usepackage{mathrsfs}\usepackage{pifont}\usepackage{stmaryrd}\usepackage{textcomp}\usepackage{portland, xspace}\usepackage{amsmath, amsxtra}\pagestyle{empty}\DeclareMathSizes{10}{9}{7}{6}\begin{document}
$${ \rm NH}_4^ + { {\hbox {-}} { \rm N}}$$
\end{document} sewage under low COD/N ratio. Kampschreur et al. (2009) reported that COD limitation and high \documentclass{aastex}\usepackage{amsbsy}\usepackage{amsfonts}\usepackage{amssymb}\usepackage{bm}\usepackage{mathrsfs}\usepackage{pifont}\usepackage{stmaryrd}\usepackage{textcomp}\usepackage{portland, xspace}\usepackage{amsmath, amsxtra}\pagestyle{empty}\DeclareMathSizes{10}{9}{7}{6}\begin{document}
$${ \rm NH}_4^ + { {\hbox {-}} { \rm N}}$$
\end{document} concentration could lead to \documentclass{aastex}\usepackage{amsbsy}\usepackage{amsfonts}\usepackage{amssymb}\usepackage{bm}\usepackage{mathrsfs}\usepackage{pifont}\usepackage{stmaryrd}\usepackage{textcomp}\usepackage{portland, xspace}\usepackage{amsmath, amsxtra}\pagestyle{empty}\DeclareMathSizes{10}{9}{7}{6}\begin{document}
$${ \rm NO}_2^ - { {\hbox {-}} { \rm N}}$$
\end{document} accumulation during nitrification phase. It is generally accepted that \documentclass{aastex}\usepackage{amsbsy}\usepackage{amsfonts}\usepackage{amssymb}\usepackage{bm}\usepackage{mathrsfs}\usepackage{pifont}\usepackage{stmaryrd}\usepackage{textcomp}\usepackage{portland, xspace}\usepackage{amsmath, amsxtra}\pagestyle{empty}\DeclareMathSizes{10}{9}{7}{6}\begin{document}
$${ \rm NO}_2^ - { {\hbox {-}} { \rm N}}$$
\end{document} is a key factor that could be used as a terminal electron acceptor to produce N2O by AOB (Jia et al., 2013b). N2O emissions in both reactors were correlated with nitrite accumulation in this article, which may be the main reason for N2O emissions according to previous literature (Jia et al., 2013b).
Typical circles with higher nitrogen load
Pollutant removal characteristics with higher nitrogen load
Figure 3 (a1, a2, b1, b2) showed the time courses of parameters in a typical cycle with influent COD and \documentclass{aastex}\usepackage{amsbsy}\usepackage{amsfonts}\usepackage{amssymb}\usepackage{bm}\usepackage{mathrsfs}\usepackage{pifont}\usepackage{stmaryrd}\usepackage{textcomp}\usepackage{portland, xspace}\usepackage{amsmath, amsxtra}\pagestyle{empty}\DeclareMathSizes{10}{9}{7}{6}\begin{document}
$${ \rm NH}_4^ + { {\hbox {-}} { \rm N}}$$
\end{document} were 500 mg/L and 240 mg/L. The changed trend of COD, TN, \documentclass{aastex}\usepackage{amsbsy}\usepackage{amsfonts}\usepackage{amssymb}\usepackage{bm}\usepackage{mathrsfs}\usepackage{pifont}\usepackage{stmaryrd}\usepackage{textcomp}\usepackage{portland, xspace}\usepackage{amsmath, amsxtra}\pagestyle{empty}\DeclareMathSizes{10}{9}{7}{6}\begin{document}
$${ \rm NH}_4^ + { {\hbox {-}} { \rm N}} , { \rm NO}_3^ - { {\hbox {-}} { \rm N}} , { \rm NO}_2^ - { {\hbox {-}} { \rm N}}$$
\end{document}, FA, and DO concentrations and pH value were consistent with that in low nitrogen load. It illustrated that the changed rule of all parameters above had repeatability in different nitrogen loads.
Variations of nitrogen compounds and control parameters with higher ammonia nitrogen (240 mg/L) in two SBR cycles: (a1, b1 and c1) are COD, N-compounds, pH, DO and N2O in ASSBR; (a2, b2 and c2) are COD, N-compounds, pH, DO and N2O in SBBR. ASSBR, activated sludge sequencing batch reactor.
N2O emission characteristics with higher nitrogen load
Figure 3c1, c2 showed the track study of N2O production with higher nitrogen load during the two SBR cycles. Compared with Fig. 2c1 and c2, the biggest difference was that N2O in SBBR with high nitrogen load started to significantly rise at the beginning of the aeration as initial \documentclass{aastex}\usepackage{amsbsy}\usepackage{amsfonts}\usepackage{amssymb}\usepackage{bm}\usepackage{mathrsfs}\usepackage{pifont}\usepackage{stmaryrd}\usepackage{textcomp}\usepackage{portland, xspace}\usepackage{amsmath, amsxtra}\pagestyle{empty}\DeclareMathSizes{10}{9}{7}{6}\begin{document}
$${ \rm NO}_2^ - { {\hbox {-}} { \rm N}}$$
\end{document} concentration was 16.64 mg/L (from the previous cycle or carried by sludge). This result also was consistent with Li et al. (2012) and Rassamee et al. (2011) who found that the high nitrite concentration was the main cause for N2O generation. Meanwhile, the N2O production (21.37 mg/L during anaerobic/aerobic phase) in ASSBR with high \documentclass{aastex}\usepackage{amsbsy}\usepackage{amsfonts}\usepackage{amssymb}\usepackage{bm}\usepackage{mathrsfs}\usepackage{pifont}\usepackage{stmaryrd}\usepackage{textcomp}\usepackage{portland, xspace}\usepackage{amsmath, amsxtra}\pagestyle{empty}\DeclareMathSizes{10}{9}{7}{6}\begin{document}
$${ \rm NH}_4^ + { {\hbox {-}} { \rm N}}$$
\end{document} load were much higher than that with low \documentclass{aastex}\usepackage{amsbsy}\usepackage{amsfonts}\usepackage{amssymb}\usepackage{bm}\usepackage{mathrsfs}\usepackage{pifont}\usepackage{stmaryrd}\usepackage{textcomp}\usepackage{portland, xspace}\usepackage{amsmath, amsxtra}\pagestyle{empty}\DeclareMathSizes{10}{9}{7}{6}\begin{document}
$${ \rm NH}_4^ + { {\hbox {-}} { \rm N}}$$
\end{document} load (6.25 mg/L during anaerobic/aerobic phase). Similar phenomenon was also found in SBBR. N2O production increased with the increase of the feed ammonia load, which indicated that N2O production was directly related to the feed ammonia load. This result was consistent with Yang et al. (2009).
Comparison of N2O production in two reactors
Table 2 showed the TN removal efficiency and N2O conversion rates under different operating conditions treating wastewater in recent literatures. The N2O conversion rates in this study were 6.6% ± 0.6% in ASSBR and 2.3% ± 0.4% in SBBR when input \documentclass{aastex}\usepackage{amsbsy}\usepackage{amsfonts}\usepackage{amssymb}\usepackage{bm}\usepackage{mathrsfs}\usepackage{pifont}\usepackage{stmaryrd}\usepackage{textcomp}\usepackage{portland, xspace}\usepackage{amsmath, amsxtra}\pagestyle{empty}\DeclareMathSizes{10}{9}{7}{6}\begin{document}
$${ \rm NH}_4^ + { {\hbox {-}} { \rm N}}$$
\end{document} concentration was 120 mg/L. While influent \documentclass{aastex}\usepackage{amsbsy}\usepackage{amsfonts}\usepackage{amssymb}\usepackage{bm}\usepackage{mathrsfs}\usepackage{pifont}\usepackage{stmaryrd}\usepackage{textcomp}\usepackage{portland, xspace}\usepackage{amsmath, amsxtra}\pagestyle{empty}\DeclareMathSizes{10}{9}{7}{6}\begin{document}
$${ \rm NH}_4^ + { {\hbox {-}} { \rm N}}$$
\end{document} concentration was 240 mg/L, the N2O conversion rates were 14.1% ± 1.6% in ASSBR and 6.5% ± 0.9% in SBBR respectively. The obtained results showed that the N2O conversion rate in SBBR was 1/3-1/2 of that in ASSBR with the same ammonia load. It was mainly caused by the following reasons.
Summary of Operation Parameters and N2O Emission in Each Reactor
(1) The higher nitrite accumulation in ASSBR repressed the N2O reduction more obviously, which led to more N2O production in ASSBR. Park et al. (2000) also found that the production of N2O has a good correlation with the presence of nitrite. The diffusion limitations of DO concentration could bring an anoxic zone in SBBR and a part of nitrite and N2O in SBBR were reduced by the heterotrophic denitrification that occurred in the interior of biofilm during aerobic conditions.
(2) Although the aeration rates of two reactors were same, the DO concentrations were maintained 0.12–0.23 mg/L in ASSBR and 1.69–1.94 mg/L in SBBR. Most of researches reported that nitrifier denitrification was attributed as the dominant source of N2O production in nitrification (Jia et al., 2013a and Wunderlin et al., 2012). Denitrification of AOB would be more favorable at low-oxygen condition. Oxygen stress is important for nitrifier denitrification. Colliver and Stephenson (2000) found that the N2O yield under oxygen limiting conditions by Nitrosomonas europaea, which was probably the most representative nitrifier, was 3–5 times higher than that at high DO conditions. This is also a reason for the different N2O production in two systems.
(3) The cycle of nitritation in ASSBR was significantly longer than that in SBBR at the same influent \documentclass{aastex}\usepackage{amsbsy}\usepackage{amsfonts}\usepackage{amssymb}\usepackage{bm}\usepackage{mathrsfs}\usepackage{pifont}\usepackage{stmaryrd}\usepackage{textcomp}\usepackage{portland, xspace}\usepackage{amsmath, amsxtra}\pagestyle{empty}\DeclareMathSizes{10}{9}{7}{6}\begin{document}
$${ \rm NH}_4^ + { {\hbox {-}} { \rm N}}$$
\end{document} load, which means the ammonia oxidation rate of ASSBR was relatively lower than that of SBBR. More intermediate substance produced by incomplete ammonia oxidation process led to more N2O production in ASSBR. (4) Naoki et al. (2003) reported that some aerobic denitrifiers produce low levels of N2O under aerobic conditions. Such bacteria with low N2O production were likely to be enriched in biofilm system owing to the bacteria in biofilm system that were more complicated than those in activated sludge system.
TN removal efficiency during anaerobic-aerobic process in other literatures was 51.0–92.5%. In this study, the TN removal efficiency of ASSBR was 66.5% ± 5.7%, which was similar to Jia et al. (2012); Zhu and Chen (2011). Compared with the three researches above, it was found that N2O emissions (6.6–43.2%) under low DO were much higher than that (2.1%) under high DO, which implied the low-oxygen stimulated the N2O emission. The TN removal efficiencies were relatively high in SBBR (81.7% ± 1.5%) of this study, which was similar to Jia et al. (2013a) and Liu et al. (2008). Meanwhile the N2O emission rates (2.3–7.7%) in the process with high TN removal efficiency were relatively less than that in the process with lower TN removal efficiency, which proposed that improvement of TN removal efficiency might reduce the production of N2O.
Generally, the N2O emissions in this study were different from the average 1.9% of the TN load from a lab-scale nitritation system (De Graaff et al., 2010) and 1.7% of the nitrogen load from a full-scale nitritation system for reject water treatment (Kampschreur et al., 2008). The different emissions can be contributed to different experimental conditions, wastewaters, type of reactors, and measurement methods used to estimate N2O emission. For example, the N2O emission rate observed in both ASSBR and SBBR were much higher than that (1.5%) presented in the article by Kong et al. (2013).
The different method of calculation was one possible reason for that. N2O conversion rate in Kong's article was the ratio of N2O production and the incoming nitrogen load. Furthermore, different modes of operation of the reactor may be one of the reasons. An intermittently aerated SBBR was used in the research by Kong et al. (2013). The operational mode had a great influence on N2O production. Cycle configurations with intermittent aeration (aerated phases up to 20–30 min followed by short anoxic phases) were proven to effectively reduce N2O emissions (Rodriguez et al., 2015). Zhang et al. (2015) investigated the effects of operational modes (fully aerobic mode and anoxic–aerobic mode) on N2O production in SND process and found that the amount of N2O emitted per cycle in the fully aerobic SND was 21.9% ± 7.1% of the removed TN, which was three times higher than 7.0% ± 1.6% observed in the anoxic–aerobic SND. In this study, low DO (0.12–0.23 mg/L) and high nitrite accumulation in ASSBR stimulated high N2O production, even up to 14.1%.
Conclusions
An ASSBR and a SBBR were set up to evaluate the N2O emissions under input \documentclass{aastex}\usepackage{amsbsy}\usepackage{amsfonts}\usepackage{amssymb}\usepackage{bm}\usepackage{mathrsfs}\usepackage{pifont}\usepackage{stmaryrd}\usepackage{textcomp}\usepackage{portland, xspace}\usepackage{amsmath, amsxtra}\pagestyle{empty}\DeclareMathSizes{10}{9}{7}{6}\begin{document}
$${ \rm NH}_4^ + { {\hbox {-}} { \rm N}}$$
\end{document} being 120 mg/L and 240 mg/L. Results implied that both the two reactors achieved similar \documentclass{aastex}\usepackage{amsbsy}\usepackage{amsfonts}\usepackage{amssymb}\usepackage{bm}\usepackage{mathrsfs}\usepackage{pifont}\usepackage{stmaryrd}\usepackage{textcomp}\usepackage{portland, xspace}\usepackage{amsmath, amsxtra}\pagestyle{empty}\DeclareMathSizes{10}{9}{7}{6}\begin{document}
$${ \rm NH}_4^ + { {\hbox {-}} { \rm N}}$$
\end{document} removal efficiencies, but TN removal efficiencies of SBBR (81.7% ± 1.5%) was higher than that of ASSBR (66.5% ± 5.7%). According to typical cycles, the N2O production increased with the increase of the feed ammonia concentration in both reactors. Meanwhile, the N2O production amount during nitritation of SBBR was lower than that of ASSBR with the same nitrogen load input.
Footnotes
Acknowledgments
This work was supported by the Fundamental Research Funds for the Central Universities (Grant No. 2013G3292017) and the Shaanxi Province Science and Technology Development Program (Grant No. 2014K15-03-02).
Author Disclosure Statement
No competing financial interests exist.
References
1.
AnthonisenA.C., LoehrR.C., PrakasamT.B.S., and SrinathE.G. (1976). Inhibition of nitrification by ammonia and nitrous acid. J. Water Pollut. Control Fed., 48, 835.
2.
ChineseS.E.P.A. (2002). Water and Wastewater Monitoring Methods (4th ed.). Beijing, China: Chinese Environmental Science Publishing House.
3.
CiudadG., RubilarO., MunozP., RuizG., ChamyR., VergaraC., and JeisonD. (2005). Partial nitrification of high ammonia concentration wastewater as a part of a shortcut biological nitrogen removal process. Process Biochem. 40, 1715.
4.
ColliverB.B., and StephensonT. (2000). Production of nitrogen oxide and dinitrogen oxide by autotrophic nitrifiers. Biotechnol. Adv., 18, 219.
5.
De GraaffM.S., ZeemanG., TemminkH., van LoosdrechtM.C.M., and BuismanC.J.N. (2010). Long term partial nitritation of anaerobically treated black water and the emission of nitrous oxide. Water Res. 44, 2171.
6.
GabarróJ., González-CárcamoP., RuscalledaM., GaniguéaR., GichF., BalaguerM.D., and ColprimJ. (2014). Anoxic phases are the main N2O contributor in partial nitritation reactors treating high nitrogen loads with alternate aeration. Bioresour. Technol., 163, 92.
7.
GuoJ.H., PengY.Z., HuangH.J., WangS.Y., GeS.J., ZhangJ.R., and WangZ.W. (2010). Short- and long-term effects of temperature on partial nitrification in a sequencing batch reactor treating domestic wastewater. J. Hazard. Mater., 179, 471.
8.
HuB., HeS., ZhaoJ.Q., and ChenY. (2014). Experimental study of the impacts of the external disturbances on N2O emission from water to air. Water Sci. Technol., 70, 1037.
9.
IPCC. (2007). Changes in atmospheric constituents and in radiative forcing. In SolomonS., et al., Eds., Climate Change 2007: The Physical Science Basis. Contribution of Working Group I to the Fourth Assessment Report of the Intergovernmental Panel on Climate Change. Cambridge: Cambridge University Press, p. 114.
10.
JiaW., ZhangJ., XieH., YanY., WangJ., ZhaoY., and XuX. (2012). Effect of PHB and oxygen uptake rate on nitrous oxide emission during simultaneous nitrification denitrifycation process. Bioresour. Technol., 113, 232.
11.
JiaW., LiangS., ZhangJ., NgoH.H., GuoW., YanY., and ZouY. (2013a). Nitrous oxide emission in low-oxygen simultaneous nitrification and denitrification process: sources and mechanisms. Bioresour. Technol., 136, 444.
12.
JiaW.L., LiangS., NgoH.H., GuoW.S., ZhangJ., WangR., and ZouY.N. (2013b). Effect of phosphorus load on nutrients removal and N2O emission during low-oxygen simultaneous nitrification and denitrification process. Bioresour. Technol., 141, 123.
13.
KampschreurM.J., van der StarW.R., WieldersH.A., MulderJ.W., JettenM.S., and van LoosdrechtM.C. (2008). Dynamics of nitric oxide and nitrous oxide emission during full-scale reject water treatment. Water Res. 42, 812.
14.
KampschreurM.J., TemminkH., KleerebezemR., JettenM.S.M., and Van LoosdrechtM.C.M. (2009). Nitrous oxide emission during wastewater treatment. Water Res. 43, 4093.
15.
KimS.W., MiyaharaM., FushinobuS., WakagiT., and ShounH. (2010). Nitrous oxide emission from nitrifying activated sludge dependent on denitrification by ammonia-oxidizing bacteria. Bioresour. Technol., 101, 3958.
16.
KongQ., ZhangJ., MiaoM.S., TianL., GuoN., and LiangS. (2013). Partial nitrification and nitrous oxide emission in an intermittently aerated sequencing batch biofilm reactor. Chem. Eng. J., 217, 435.
17.
LawY., NiB.J., LantP., and YuanZ. (2012). N2O production rate of an enriched ammonia-oxidizing bacteria culture exponentially correlates to its ammonia oxidation rate. Water Res. 46, 3409.
18.
LiC., ZhangJ., LiangS., HuuH. N., GuoW., ZhangY., and ZouY. (2012). Nitrous oxide generation in denitrifying phosphorus removal process: main causes and control measures. Environ. Sci. Pollut. Res., 20, 5353.
19.
LiuX., PengY., WuC., AkioT., and PengY. (2008). Nitrous oxide production during nitrogen removal from domestic wastewater in lab-scale sequencing batch reactor. J. Environ. Sci., 20, 641.
20.
LovleyD.R., and PhillipsE.J.P. (1988). Novel mode of microbial energy metabolism: organic carbon coupled to dissimilartory reduction of iron or manganese. Appl. Environ. Microbiol., 54, 1472.
21.
NaokiT., MariaA.B., CatalanS., YasushiS., IsaoK., ZheminZ., and HirofumiS. (2003). Aerobic denitrifying bacteria that produce low levels of nitrous oxide. Appl. Environ. Microbiol., 69, 3152.
22.
ParkK.Y., InamoriY., MizuochiM., and AhnK.H. (2000). Emission and control of nitrous oxide from a biological wastewater treatment system with intermittent aeration. J. Biosci. Bioeng., 90, 247.
23.
RassameeV., SattayatewaC., PagillaK., and ChandranK. (2011). Effect of oxic and anoxic conditions on nitrous oxide emissions from nitrification and denitrification processes. Biotechnol. Bioeng., 108, 2036.
24.
RongH., PengY., ZhangC., and FangQ. (2008). Study on the nitrogen removal by simultaneous nitrification and denitrification in sequencing batch biofilm reactor. Ind. Water Treat., 28, 9. (in Chinese)
25.
Rodriguez -CaballeroA., AymerichI., MarquesR., PochM., and PijuanM. (2015). Minimizing N2O emissions and carbon footprint on a full-scale activated sludge sequencing batch reactor. Water Res. 71, 1.
26.
WeiD., DuB., XueX.D., DaiP., and ZhangJ. (2013). Analysis of factors affecting the performance of partial nitrification in a sequencing batch reactor. Appl. Microbiol. Biotechnol., 98, 1863.
27.
WeiD., XueX.D., YanL.G., SunM., ZhangG., ShiL., and DuB. (2014). Effect of influent ammonium concentration on the shift of full nitritation to partial nitrification in a sequencing batch reactor at ambient temperature. Chem. Eng. J., 235, 19.
28.
WunderlinP., MohnJ., JossA., EmmeneggerL., and SiegristH. (2012). Mechanisms of N2O production in biological wastewater treatment under nitrifying and denitrifying conditions. Water Res. 46, 1027.
29.
YangQ., LiuX., PengC., WangS., and PengY. (2009). N2O Production during nitrogen removal via nitrite from domestic wastewater: main sources and control method. Environ. Sci. Technol., 43, 9400.
30.
ZengR.J., LemaireR., YuanZ., and KellerJ. (2004). A novel wastewater treatment process: Simultaneous nitrification, denitrification and phosphorus removal. Water Sci. Technol., 50, 163.
31.
ZengW., LiB., WangX., BaiX., and PengY. (2014). Integration of denitrifying phosphorus removal via nitrite pathway, simultaneous nitritation-denitritation and anammox treating carbon-limited municipal sewage. Bioresour. Technol., 172, 356.
32.
ZhaoJ.Q., HuangN., HuB., JiaL.W., and GeG.H. (2015). Potential of nitrous oxide recovery from an aerobic/oxic/anoxic SBR process. Water Sci. Technol. [Epub ahead of print]; DOI: 10. 2166/wst. 2015. 524.
33.
ZhangJ., WangS., ShangH., and PengY. (2009). N2O emission and control in shortcut nitrification and denitrification and simultaneous nitrification and denitrification biological nitrogen removal systems. Environ. Sci., 30, 3625. (in Chinese)
34.
ZhangF., LiP., ChenM., WuJ., ZhuN., WuP., ChiangP., and HuZ. (2015). Effect of operational modes on nitrogen removal and nitrous oxide emission in the process of simultaneous nitrification and denitrification. Chem. Eng. J., 280, 549.
35.
ZhuX., and ChenY. (2011). Reduction of N2O and NO generation in anaerobic-aerobic (low dissolved oxygen) biological wastewater treatment process by using sludge alkaline fermentation liquid. Environ. Sci. Technol., 45, 2137.