
Abstract
Abstract
The greatest challenge when working with mathematical models describing biological processes is to choose appropriate values of kinetic parameters. This applies especially to the models of environmental biological processes, such as bioremediation. Parameter values are usually obtained from various sources and under specific experimental conditions and constitute sources of uncertainties. A useful tool for dealing with model parameter uncertainties is sensitivity analysis. It studies how a given model depends on its input factors. In this work, the nonstationary Extended Fourier Amplitude Sensitivity analysis was used to analyze the effect of 28 kinetic parameters on 18 metabolite concentrations and 16 reaction rates of the biological part of the integrated BTEX bioremediation model. First-order sensitivities and total effect indices were estimated for three time points of the process to identify the places of the metabolism control shift. Analyses revealed that the model is nonadditive and there are no strong interactions between the parameters. Results of this study indicate the importance of using the global sensitivity analysis before bioremediation process planning.
Introduction
B
According to Wiechert et al. (2002), mathematical models of biological systems have several aims as follows: (i) structural understanding (Geng et al., 2014), (ii) exploratory simulation (Essaid et al., 1995), (iii) interpretation and evaluation of measured data (Schirmer et al., 2000), (iv) systems analysis (Geng et al., 2013), (v) prediction and design (Schirmer et al., 1999), and (vi) optimization (Nicol et al., 1994). There are several phases in the development of a mathematical model of a biological process. First, the purpose of the model must be defined. Thereupon, the network structure and diagram of the model, kinetic rate expressions (mostly enzyme-catalyzed biochemical reactions), and model parameters should be established to describe the time-dependent change of model variables (Kent et al., 2013). The final step of model development includes model validation (Almquist et al., 2014).
Due to the enormous interest in environmental protection, mathematical models dealing with biological degradation of pollutants are being used more often. Activated sludge models are widely applied in describing wastewater treatments (Henze et al., 1987, 1995, 1999; Gujer et al., 1999). Bioremediation, a technology for degradation of harmful chemicals, has gained popularity lately due to its economic advantages, environmental friendliness, and ease of application. Some methodical models describing bioremediation processes are given in literature. Yaghmaei (2002) developed a model for the in situ bioremediation of contaminated soil; Li et al. (1994), and Surajudeen (2012) presented mathematical models describing the bioremediation of oil-contaminated soil. The most detailed bioremediation model available in literature was proposed by Maurer and Rittmann (2004).
Mathematical analysis of complex reactions and intraregulations of those processes allows easier process planning and optimization. It is important to mention that all these models are complex and overparameterized. Therefore, currently the greatest challenge in the mathematical modeling of a biological process is to choose the values of the kinetic parameters (Jia et al., 2012). Parameter values are usually obtained from various sources and are estimated under specific experimental conditions and consequently constitute sources of uncertainties (Kent et al., 2013; Vanlier et al., 2013).
Sensitivity analysis is a useful tool for dealing with these uncertainties. According to Saltelli et al. (2010), sensitivity analysis is the study of how uncertainty in the model output can be apportioned to different sources of uncertainty in the model input factor, such as model parameters. Sensitivity analysis methods can be categorized according to the outcome of the sensitivity measures: qualitative or quantitative methods, local or global methods, and methods that depend on or are independent of the model characteristics (Homma and Saltelli, 1996; Schwieger, 2004).
Global sensitivity analyses are especially useful in dealing with complex models with a large set of model parameters focusing on the output uncertainties over the entire range of values of the input parameters simultaneously (Cosenza et al., 2014). According to Iooss and Lemaître (2015), global sensitivity analysis methods can be divided into (i) screening methods (based on a discretization of the inputs in levels, allowing fast exploration of the code behavior), (ii) importance measure methods (methods based on the analysis of the linear models and method based on functional decomposition of variance), and (iii) deep exploration of the model. Both Sobol' and Fourier Amplitude Sensitivity Test (FAST) methods belong to a group of variance-based global sensitivity analysis methods (Chan et al., 1997).
In variance-based methods, the variability or uncertainty associated with an important input parameter is propagated throughout the model, resulting in a large contribution to the overall output variability (Chan et al., 1997). Comparing the Sobol' and FAST methods, the advantage of FAST is that the evaluation of sensitivity coefficients can be carried out independently for each parameter by only one simulation because all the terms in Fourier expansion are mutually orthogonal (Saltelli and Bolado, 1998), while Sobol' uses the Monte Carlo integration procedure. FAST is also computationally more efficient than Sobol' because of it robustness, especially at small sample size (Chan et al., 1997; Saltelli et al., 1999).
FAST was originally developed for a functional model whose input parameters were uniformly distributed, but over the years, the procedure to transform the nonuniform distributions into uniform was developed (Fang et al., 2003), allowing the application of the FAST methodology in a wide range of mathematical models (from engineering to physics to chemistry).
There are several studies in literature that apply sensitivity analysis methods to bioremediation process models. Benekos et al. (2007) applied a sampling-based sensitivity analysis method on a complex model that couples chemical degradation and transformation with movement of four chlorinated ethenes undergoing bioremediation. The sampling-based approach is based on Monte Carlo simulations and involves the generation and exploration of a mapping from uncertain analysis input to uncertain analysis results (Helton et al., 2006). Zhao et al. (2010) used the multiparametric sensitivity analysis (MPSA) to identify the most important parameters for the uranium concentration in the electron load and nonelectron load models of Geobacter-mediated bioremediation. According to the basic concept of the MPSA, for each parameter of the analyzed model, a comparison of the distributions of the parameter values associated with the acceptable and unacceptable is performed. If the two distributions are not statistically different, the parameter is classified as insensitive; otherwise, the parameter is classified as sensitive (Nassar, 2011). The extension of the model describing the Geobacter-mediated bioremediation, proposed by Zhao et al. (2011), integrated the model on the electron capacitance of Geobacter with a comprehensive simulator of coupled fluid flow, hydrologic transport, heat transfer, and biogeochemical reactions and analyzed it by applying the Extended FAST method combined with the Morris screening method. Based on available information on the use of the sensitivity analysis method in the bioremediation process, it can be concluded that although suitable, the Extended FAST is not widely used because of the lack of tools addressing the computational challenge (there is no commercially available software package performing the Extended FAST analysis).
In this work, the Extended FAST was used for analysis of the kinetic parameters of the biological part of the integrated BTEX bioremediation model. The motivation for this study was the lack of available information in literature on the use of the nonstationary Extended FAST method on mathematical models describing a bioremediation process. The aim of this study is to determine the first-order sensitivities and total effect indices of model metabolites and reactions at three time points to identify the possible shift in metabolism control.
Materials and Methods
Simulation of integrated BTEX bioremediation model
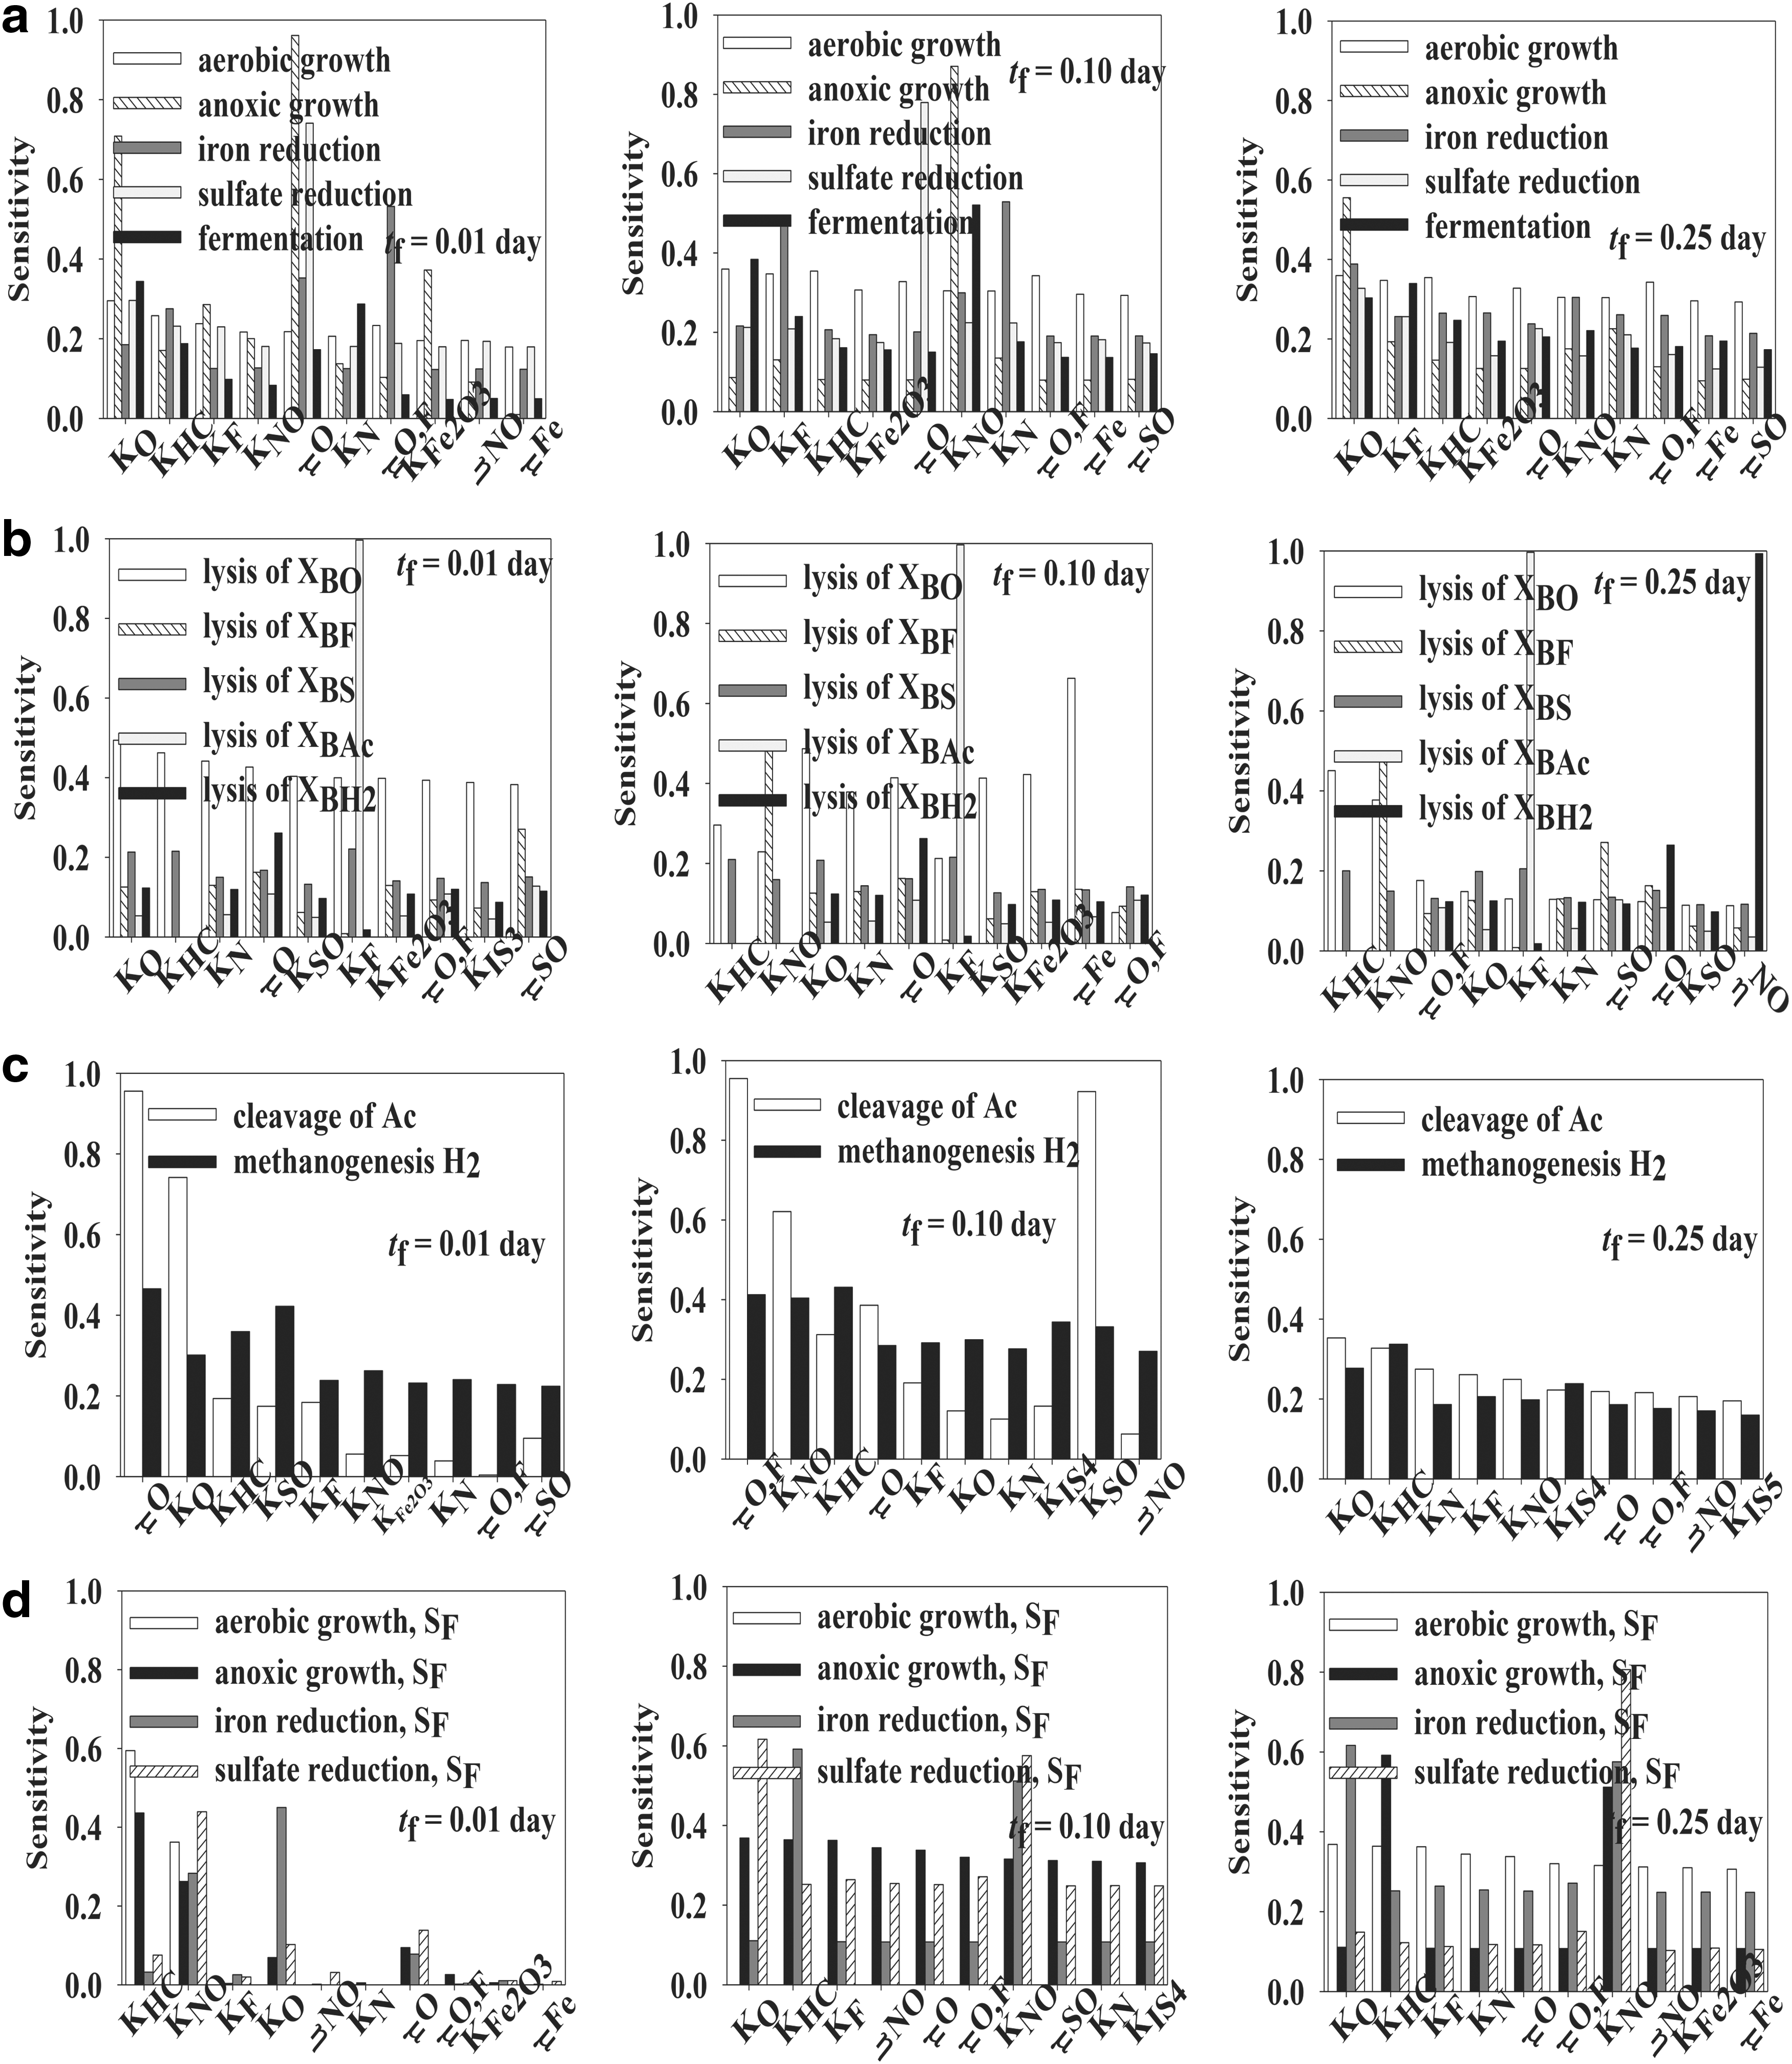
For analysis and simulation of the BTEX bioremediation processes, only the biological part of the Coupled Biological and Chemical (CBC) mathematical model, proposed by Maurer and Rittmann (2004), was used in this work. The proposed model describes the basic microbiological and chemical reactions that affect the presence and concentrations of BTEX intermediates. The biological part of the model is based on modified Monod kinetics and describes the BTEX degradation by bacteria, methanogenesis, fermentation, oxidation of fermentative products, and biomass decay. The specific reactions described with the model are (i) aerobic growth, (ii) denitrification, (iii) iron reduction, (iv) sulfate reduction, (v) fermentation, (vi) lysis of fast-growing heterotrophic bacteria that respire oxygen and nitrate, (vii) lysis of iron-reducing bacteria, (viii) lysis of sulfate-reducing bacteria, (ix) lysis of acetoclastic methanogens, (x) lysis of hydrogen-oxidizing methanogens, (xi) cleavage of acetate, (xii) methanogenesis, (xiii) aerobic growth on organic fermentation products, (xiv) anoxic growth on organic fermentation products, (xv) iron reduction on organic fermentation products, and (xvi) sulfate reduction on organic fermentation products. The rate terms of the microbiological reactions based on modified Monod kinetics describe the biomass synthesis and electron donor utilization, taking into account the effects of multiple substrates, nutrients, and inhibitors (Maurer and Rittmann, 2004). The chemical part of the model describes the dissolution and precipitation of calcium carbonate, conversion of iron(II) monosulfide into thermodynamically stable pyrite, and the reductive dissolution of solid iron(III) by oxidation of sulfide. The model includes 16 dissolved components (BTEX, acetate, oxygen, nitrate, ammonium, sulfate, methane, hydrogen, calcium, iron(II), inorganic carbon, and inorganic sulfide), distinguishes five biomass types (fast-growing heterotrophic bacteria, sulfate-reducing bacteria, iron-reducing bacteria, acetoclastic methanogens, and hydrogen-oxidizing methanogens), and has five inorganic solid phases (calcium carbonate, iron(III) oxide, iron(II) monosulfide, pyrite, and elementary sulfur). The biological part of the CBC model used for analysis includes 18 balances in the form of ordinary differential equations. The time change of each metabolite concentration is the difference between the rate of formation and the consumption of individual molecules. The list of model balances derived by multiplying the stoichiometric matrix with the reaction rate vector, proposed by Maurer and Rittmann (2004), is given in Table 1, whereas the numerical values and units of the analyzed kinetic parameters are shown in Table 2.
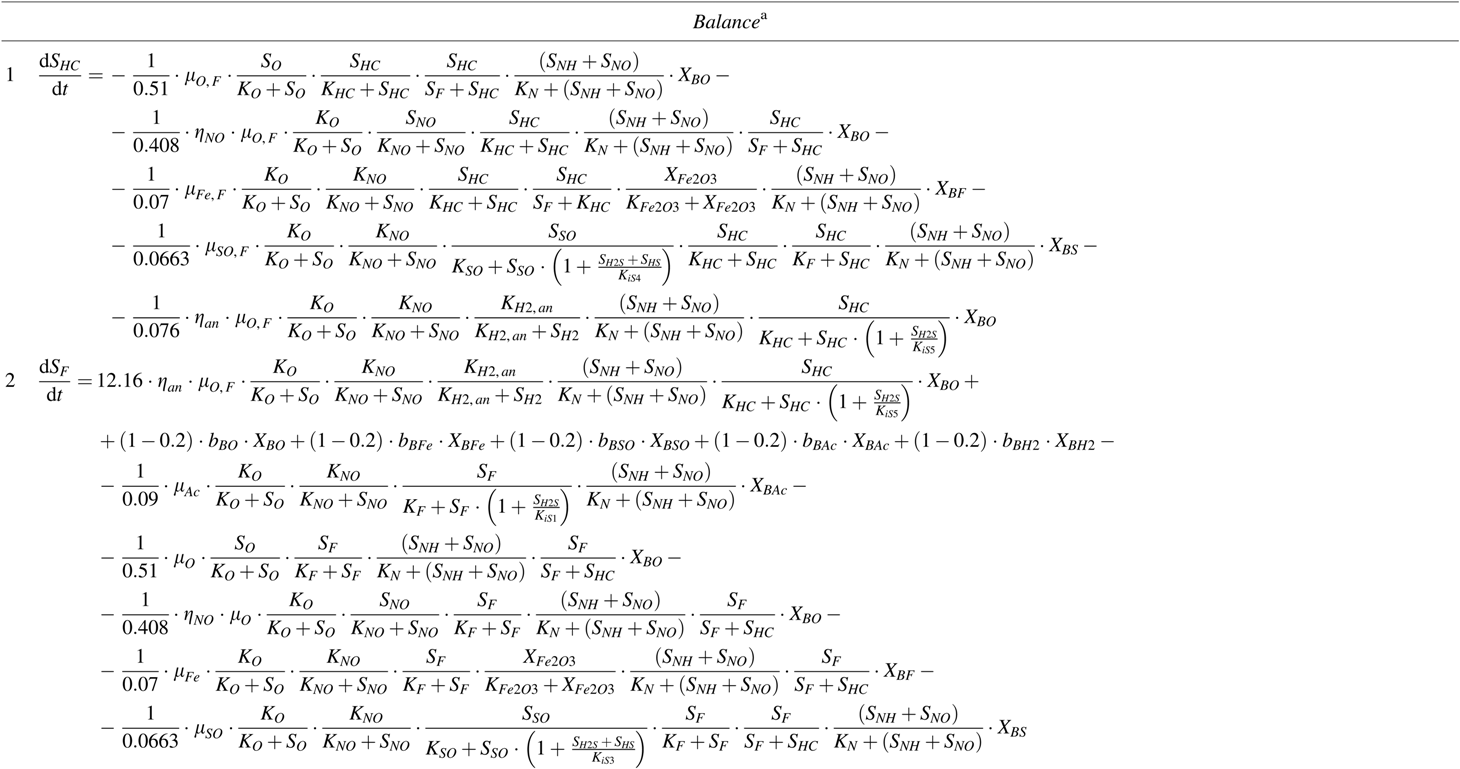
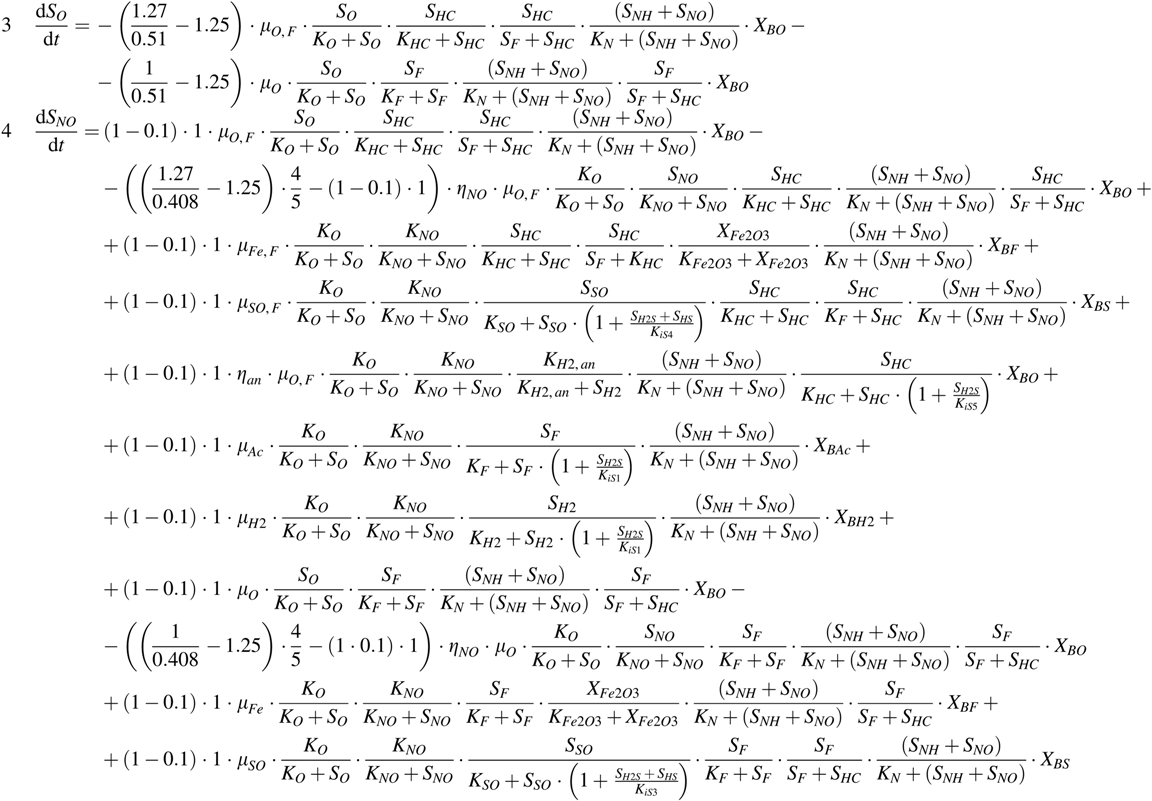


The list of balances is derived by multiplying the stoichiometric matrix with the reaction rate vector proposed by Maurer and Rittmann, 2004.
The information on origin of initial value of kinetic parameters is given by Maurer and Rittmann, 2004, in detail.
Simulations of the biological part of the CBC model were performed using W.R. Mathematica 9.0 software with initial concentrations presented by Kao and Wang (2000). They presented the results of intrinsic bioremediation at a gasoline spill in Dublin, Bladen County, North Carolina, in 1995. Due to the appearance of nonaqueous phase, the liquid hydrocarbons underneath the spill site were continuously leaching into the groundwater. Twenty-one monitoring wells were installed to observe the BTEX distribution. Each BTEX plume was divided into four zones (source zone, mid-plume area, denitrification area, and down-gradient oxidized area) for easier interpretation of the results. Based on the results presented by Kao and Wang (2000), it can be seen that other electron acceptors (e.g., nitrate and ferric ions) were used to oxidize dissolved contaminants after oxygen depletion. In addition, by reducing the reduction potential in the source zone and mid-plume zone, it reflects the change for oxidizing to reducing conditions. Groundwater samples were collected from four representative wells. To evaluate the trend of the BTEX degradation process, Kao and Wang (2000) analyzed the distribution of microorganisms within plume. Analysis revealed the high total anaerobe population, denitrifiers, iron reducers, sulfate reducers, methanogens, and small aerobe population (Kao and Wang, 2000). For CBC model simulations, the groundwater sample composition presented as MW1 was used.
Global sensitivity analysis Extended FAST
The importance of individual parameters of the biological part of the CBC model was analyzed numerically by the Extended FAST method (Saltelli et al., 1999, 2000, 2010) using W. R. Mathematica 9.0 software. The Extended FAST method allows calculation of two sensitivity indices (first-order effect index and total effect index). The system analysis is based on evaluation of the first moments (joint expected value E and variance σ2) from the multidimensional joint probability distribution p(y1, y2…. yn). The effect of each individual process variable, xi, on each of the system outputs, yk, is evaluated by the ratio of the ensemble variance of the conditional expected value relative to the total ensemble dispersion.
The Extended FAST method is based on the transformation of the multidimensional parameter space into one-dimensional space of a single parameter, s, by the nonlinear transformation of each parameter according to Equation (1). In the Extended FAST method, the sensitivity coefficients are evaluated by a search curve that scans the space of the input factors so that each factor is explored with a selected integer frequency (Saltelli et al., 2000):
where s is the sampling parameter in the range of s ∈[–1, 1], ωi are selected frequencies, and
Responses of the output variable are expanded into Fourier series by which the overall variance, D, of the output function is decomposed into summands of squares of Fourier coefficients, Aj and Bj [Eqs. (2)–(4)]:
Individual parameter contributions in the total dispersion are calculated by the corresponding harmonics [(Eq. (5)]. The summation is meant to include all the harmonics related to the frequency associated to the input variable considered (Saltelli and Bolado, 1998), from minimum frequency for transformation of the selected parameter to maximum frequency defined for the Fourier analysis.
The relative sensitivity coefficient or first-order effect index, Si, is a measure of the global influence of parameter xi on the output and is given as the ratio of partial dispersion and total dispersion [(Eq. (6)]:
On the other hand, the total effect index is defined as follows [(Eq. (7)]:
and describes the amount of the variance that stays undescribed when only variable xi is varied.
Results and Discussion
Nonstationary Extended FAST global sensitivity analysis was applied for identification of the most important kinetic parameters of the biological part of the integrated BTEX bioremediation model. The first-order indices and total effect indices were calculated for all 18 metabolites and 16 reactions included into the model at three time points. The first-order effect index measures the relative importance of an individual kinetic parameter in total uncertainty and can be seen as indicating where to direct efforts to reduce the uncertainty. On the other hand, the total effect index is linked to the amount of the output variance that would remain unexplained if an individual kinetic parameter was left free to vary over its uncertainty range while all other parameters have been learnt. In practice, total sensitivity indices are used in model building to identify unessential variables and reduce the number of uncertain model inputs. By definition, total sensitivity indices are usually larger than first-order indices for nonadditive models and equal for additive models (Chan et al., 1997; Sallteli et al., 2005). The biological part of BTEX bioremediation was simulated using the initial concentrations measured at the gasoline spill site presented by Kao and Wang (2000) to define the model steady state. Two time points, shorter than steady-state time (tf = 0.25 day), were chosen for the Extended FAST analysis to analyze the possible control shift. The first-order effect indices for the most important parameters at three time points (tf = 0.01 day, tf = 0.1 day, tf = 0.25 day) for metabolites included in the biological part of CBC model are given in Fig. 1, while corresponding total effect indices are given in Fig. 2. The subfigures in Figs. 1 and 2 are as follows: (a) presents carbon sources, (b) nitrogen source, (c) dissolved gases, (d) ions, and (e) particulate components.

First-order effect indices for metabolites included in the biological part of the CBC model:

Total effect indices for metabolites included in the biological part of the CBC model:
Model metabolites
Carbon sources
For better insight into the effect of parameters on the concentration of metabolites, the results are grouped into five clusters (carbon sources, nitrogen sources, dissolved gases, ions, and particulate components). The first group to be analyzed was the carbon sources group (hydrocarbons, SHC; dissolved methane, SCH4; organic fermentation products, SF). The first-order sensitivity indices are presented in Fig. 1a and total effect indices in Fig. 2a. By analyzing the first-order sensitivity indices, it can be observed that the most important parameters and their variance contribution change over time. In the case of hydrocarbons (SHC) at tf = 0.01 day and tf = 0.1 day, the three most important parameters are the half-saturation coefficient for oxygen (KO), half-saturation coefficient for BTEX (KHC), and the half-saturation coefficient for fermentation products (KF) included into the reaction rates of microbial BTEX degradation by sulfate reduction, cleavage of acetate in methanogenesis, and oxidation of the organic fermentation products. Based on the obtained results, it can be concluded that in case of oxygen depletion, sulfate reduction and methanogenesis are the most dominant mechanisms affecting the hydrocarbon concentration. At tf = 0.25 day (at steady state), a slight control shift can be observed; the reduction coefficient for the anoxic growth rate contribution (ηNO) in denitrification reactions becomes the most important kinetic parameter, followed by the heterotrophic growth rate constant growing on oxygen (μO). Thirty-two percent of variance in hydrocarbon output at tf = 0.25 day is explained by ηNO and μO. The sums of the first-order sensitivities for the three points were 0.890, 0.894, and 0.924, indicating the nonadditive model. No significant variation in terms of the total effect indices (Fig. 2a) for hydrocarbon molecules had been detected during the BTEX bioremediation process. At the tf = 0.01 day and tf = 0.1 day, there were no influential parameters (total effect index larger than 0.01). By prolonging the simulation until steady state, only ten (ηNO, μO, KO, KHC, KF, μO,F, KN, KNO, KIS5, and KFe2O3) of 29 parameters were influential.
In the case of dissolved methane, the same trend as for hydrocarbons was observed. At tf = 0.01 day and tf = 0.1 day, the three most important parameters were KO, KHC, and KF, explaining the 37% variance in the dissolved methane output. Interestingly, it was observed that all 28 parameters contributed to the variance of methane output. The smallest contribution to the variance was observed for the parameters included into the biomass decay reactions. At steady state, the dissolved methane concentration mostly depends (40%) on the aerobic heterotrophic growth rate constant with acetate (μO,F) and the half-saturation coefficient for nitrate (KNO), both included into reactions of acetate consumption (aerobic growth on acetate and methanogenesis reactions). By analyzing the total effect index factor, it was found that at tf = 0.01 day and tf = 0.1 day, 13 parameters (included into fermentation, methanogenesis, and biomass decay reactions) were noninfluential, while at tf = 0.25 day, 19 parameters were noninfluential. This result could be attributed to the fact that there is no high interaction among parameters.
Organic fermentation products (SF) were included into all reactions of BTEX bioremediation, except fermentation and biomass decay. Analysis of the first-order sensitivities showed that SF concentration depended mostly on KSO at tf = 0.01 day and on KH2 at tf = 0.1 day and tf = 0.25 day (not visible on the presented charts due to ranking according to the first-order effect indices of the first analyzed component). The half-saturation coefficient, KSO, was included into the kinetics of sulfate reduction on acetate, and by increasing KSO, the reactions had slowed down, whereas SF output concentration increased. On the other hand, the half-saturation coefficient for hydrogen utilization of methanogens (KH2) was part of the kinetics of the methanogenesis reaction and had the same effect on SF output concentration as KSO. At tf = 0.01 day, KSO explained 85% of SF output variability (24 parameters were noninfluential), and at tf = 0.1 day and tf = 0.25 day, KH2 explained 84% (25 parameters were noninfluential) and 74% (22 parameters were noninfluential), respectively. In terms of the total effect index, at tf = 0.01 day, all parameters except KSO were considered noninfluential. At tf = 0.1 day, 25 parameters were noninfluential, but on tf = 0.25 day, all parameters were influential, indicating the shift in metabolism control.
Nitrogen sources
The biological module of the CBC model of BTEX bioremediation proposes two nitrogen sources; nitrite and nitrate equivalents (SNO) and ammonium (SNH). The fast-growing bacteria utilizing oxygen and nitrogen metabolize the BTEX and acetate as a carbon source, but in conditions of oxygen and nitrogen limitation, they ferment BTEX to acetate (Maurer and Rittmann, 2004). By analyzing the results of the Extended FAST on nitrogen sources (Figs. 1b and 2b) in terms of the first-order sensitivities, it could be observed that ηNO (reduction coefficient for anoxic maximum growth rate) and KH2 (half-saturation coefficient for hydrogen utilization of methanogens) were the most important parameters for both SNO and SNH at all three analyzed time points. By increasing the numerical value of ηNO, the denitrification reactions were faster and larger amounts of the nitrogen source were consumed. In contrast, by increasing the numerical value of KH2, the reaction rate of the methanogenesis had reduced. In the case of SNH at tf = 0.01 day, KH2 contributed to 69% of the output variability, and there were 26 noninfluential parameters. The number of noninfluential parameters was the same at tf = 0.1 day and tf = 0.25 day. The sum of the first-order sensitivities for both metabolites at all three analyzed time points was less than one. By analyzing the total effect indices, it was observed that in the case of SNO, there was no significant variability and all parameters were influential at all three analyzed time points. In the case of SNH, KH2 contributed to approximately 60% of SNH output concentration variability and other parameters could be considered noninfluential (total effect index less than 0.01).
Dissolved gases
BTEX-metabolizing microorganisms can utilize only the components in dissolved form. The amount of available dissolved oxygen determines the metabolic processes; therefore, it is very interesting to define the effect of kinetic parameters on the oxygen concentration. The results of the first-order sensitivities and total effect indices are given in Figs. 1c and 2c. Regarding the first-order sensitivities, it can be noticed that the dissolved oxygen concentration depended mostly on μO (contributing to 98% of output variability) at all three analyzed time points. This result was expected because the higher value of μO means that the dissolved oxygen is consumed faster and vice versa. It was also observed that there were 26 noninfluential parameters with the possibility of model reductions. In the case of total effect indices, the μO was observed to be the most important at tf = 0.01 day (68%). By prolonging the simulation, at tf = 0.1 day and tf = 0.25 day, all other parameters, except KHC, KNO, and KF, became influential (data not shown) on dissolved oxygen concentration. The high value of the total effect index for μO at tf = 0.01 day, and μO and μFe at tf = 0.1 day and tf = 0.25 day, indicates their indirect influence.
The second dissolved gas included into the model was hydrogen. According to the first-order sensitivities, the dissolved hydrogen output concentration mostly depended on KO and KHC at tf = 0.01 day, on KHC and KSO (data not shown) at tf = 0.1 day, and on KHC and KiS4 at tf = 0.25 day. According to the model balances, dissolved hydrogen was a fermentation product included into microbial BTEX degradation and consumed in methanogenesis. The global sensitivity analysis revealed the effect of the parameters included into the sulfate reduction reaction (KSO and KiS3) on the hydrogen concentration at tv = 0.1 day and tf = 0.25 day. The first-order sensitivities were around 0.187 (data not shown). This interconnection is probably regulated through hydrogen sulfide, which is included into methanogenesis and the sulfate reduction reaction. Hydrogen sulfide is the inhibitor in both reactions. With regard to the total effect index, there were some changes over time. At tf = 0.01 day, there were only two influential parameters, KO and KHC; at tf = 0.1 day, all parameters were influential with the maximum influence of KHC; and at tf = 0.25 day, KHC was the most influential, and there were 22 noninfluential parameters.
Ions
Inorganic carbon (H2CO3, HCO3−), sulfate, sulfide (SO42−, HS−), and iron (Fe2+) were consumed by the microorganisms in ionic form. Sulfate (SO42−) and sulfide (HS−) concentrations change through aerobic and anaerobic sulfate reduction, iron (Fe2+) concentration through aerobic and anaerobic iron reduction, while inorganic carbon takes part in BTEX biodegradation, methanogenesis, and oxidation of the organic fermentation product. According to the Extended FAST analysis (first-order sensitivity), the sulfate and iron ions, as well as inorganic carbon concentrations, mostly depended on KO and KHC, while the sulfide concentration mostly depended on μO at tf = 0.01 day and tf = 0.1 day. These results can be explained by the fact that in aerobic conditions, microbial BTEX degradation is a dominating mechanism and the half-saturation constants for oxygen and BTEX affect how fast the oxygen is consumed. A slight change in control was noticed at tf = 0.25 day, where KHC and μO,F were observed to be the most influential parameters for sulfate, iron ions and sulfide, and KO and KHC for inorganic carbon. At steady state (tf = 0.25 day), the available oxygen is consumed and fermentative metabolism is dominated. Analogous results were obtained for the total effect indices with the largest variability for sulfide, indicating that sulfide concentration mostly varied during the bioremediation process. The results also indicate possible model reduction regarding iron ions due to the fact that at the steady state, there were 23 noninfluential parameters; KHC and μO,F contributed to 57% of variability.
Particulate components
The analyzed model of BTEX bioremediation distinguishes five biomass types: (i) XBO, fast-growing heterotrophic bacteria; (ii) XBS, sulfate-reducing bacteria; (iii) XBF, iron-reducing bacteria; (iv) XBAc, acetoclastic methanogens; and (v) XBH2, hydrogen-oxidizing methanogens. In the biological part of the CBC model, iron(III) oxide was also included as a particulate component (XFe). Regarding the first-order sensitivities, it could be observed that at tf = 0.01 day, all parameters were considered influential, but with the small contribution for all five particulate components. KO and KHC contributed to approximately 30% of output variability for all five particulate components. At tf = 0.1 day, there was a slight change in model control, μO,F and KiS3 were shown to be the most important parameters for XFe; μO,F and KF for XBO; and KHC and μO,F for XBF, XBS, XBAc, and XBH2. In the case of XFe, there were 22 noninfluential parameters, while in the case of XBO, there were 14. The model control, again, slightly changed with the prolongation of the simulation to tf = 0.25 day. At tf = 0.25 day, KHC and μO,F were shown to be the most influential on XFe; KHC and KNO on XBO; and KHC and KO on XBF, XBS, XBAc, and XBH2. The significant influence of KHC on almost all biomass types indicates the importance of the microbial BTEX degradation processes. Regarding the total effect indices, it could be observed that at tf = 0.01 day, there was no significant variability in the total effect indices. It was also observed that there were 23 noninfluential parameters for all five particulate components. The variations of the first-order indices and total effect indices at tf = 0.1 day and tf = 0.25 day indicate that particulate component concentrations are not homogeneous during the bioremediation process.
Comparison of groups
Results of the global sensitivity analysis revealed that carbon source concentrations over time mostly depended on the half-saturation coefficient for oxygen (KO), half-saturation coefficient for BTEX (KHC), the half-saturation coefficient for fermentation products (KF), and on the half-saturation coefficient for sulfate (KSO). In the case of nitrogen sources, ηNO (reduction coefficient for the anoxic maximum growth rate) and KH2 (the half-saturation coefficient for hydrogen utilization of methanogens) were the most important parameters, while in the case of dissolved gases, μO (growth rate constant growing on oxygen) was shown to be the most important.
By comparing the sums of the first-order sensitivities for all analyzed metabolite groups and for all analyzed time points, it could be concluded that the sum of the first-order sensitivities is always less than one. The results indicate that the model is nonadditive and that interactions among model factors do occur. The presence of interactions can have significant implications on the interpretation of the model. In practice, it makes it more difficult to predict the consequences of changing the value of a variable (kinetic parameter value), particularly if the variable interacts with those that are hard to measure or difficult to control. According to Cosenza et al. (2014), the high interactions between factors can be explained with a wide factor variation range. By broadening the variation range of each model factor, the interactions among factors and nonlinear behavior of the model become more apparent. This explanation can be applied to the result obtained in this work because 50% variation of kinetic parameter values around nominal values was tested. The sums of the total effect indices, in all cases, were greater than the corresponding sums of the first-order sensitivities. There is no significant variability between the mentioned sums for specific metabolite at analyzed time points. The sums of the first-order sensitivities were in the range 0.823–0.986, while sums of total effect indices varied in the range 1.896–14.181. The maximum total effect indices sum was obtained for dissolved oxygen, indicating the influence of dissolved oxygen on the process. In the work presented by Yaghmaei (2002), sensitivity analysis was applied on the model that consisted of three nonlinear differential equations describing in situ bioremediation of contaminated soil. The results of applied sensitivity analysis revealed the importance of initial contaminate concentration on the time and mechanism of remediation, which is in consistence with results obtained in this study where the importance of the oxygen concentration on remediation mechanism was demonstrated.
Model reaction
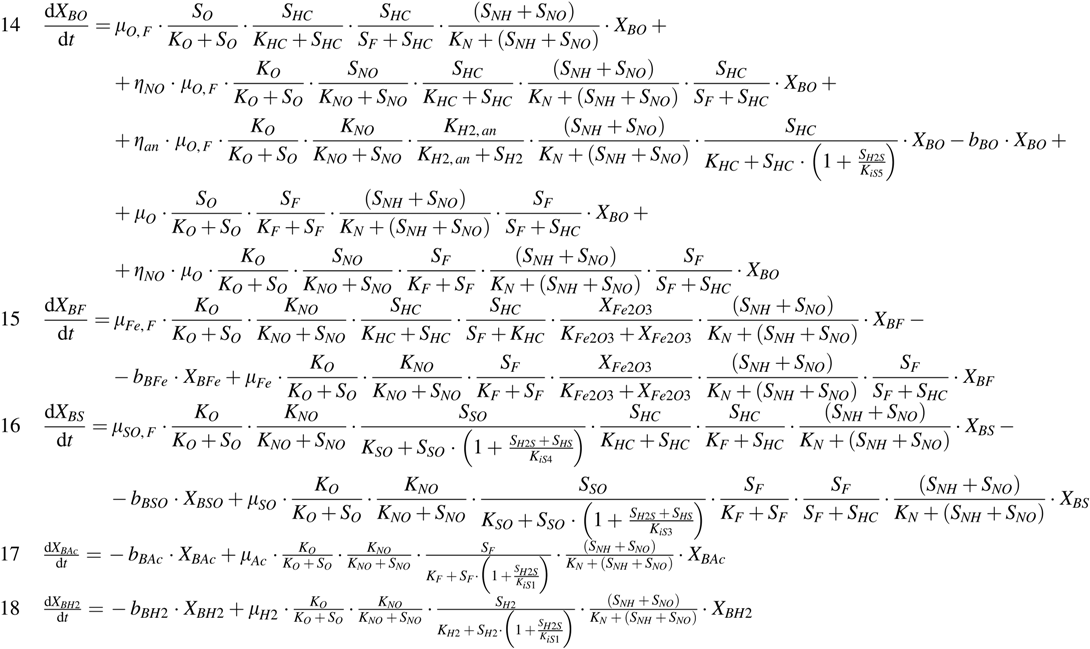
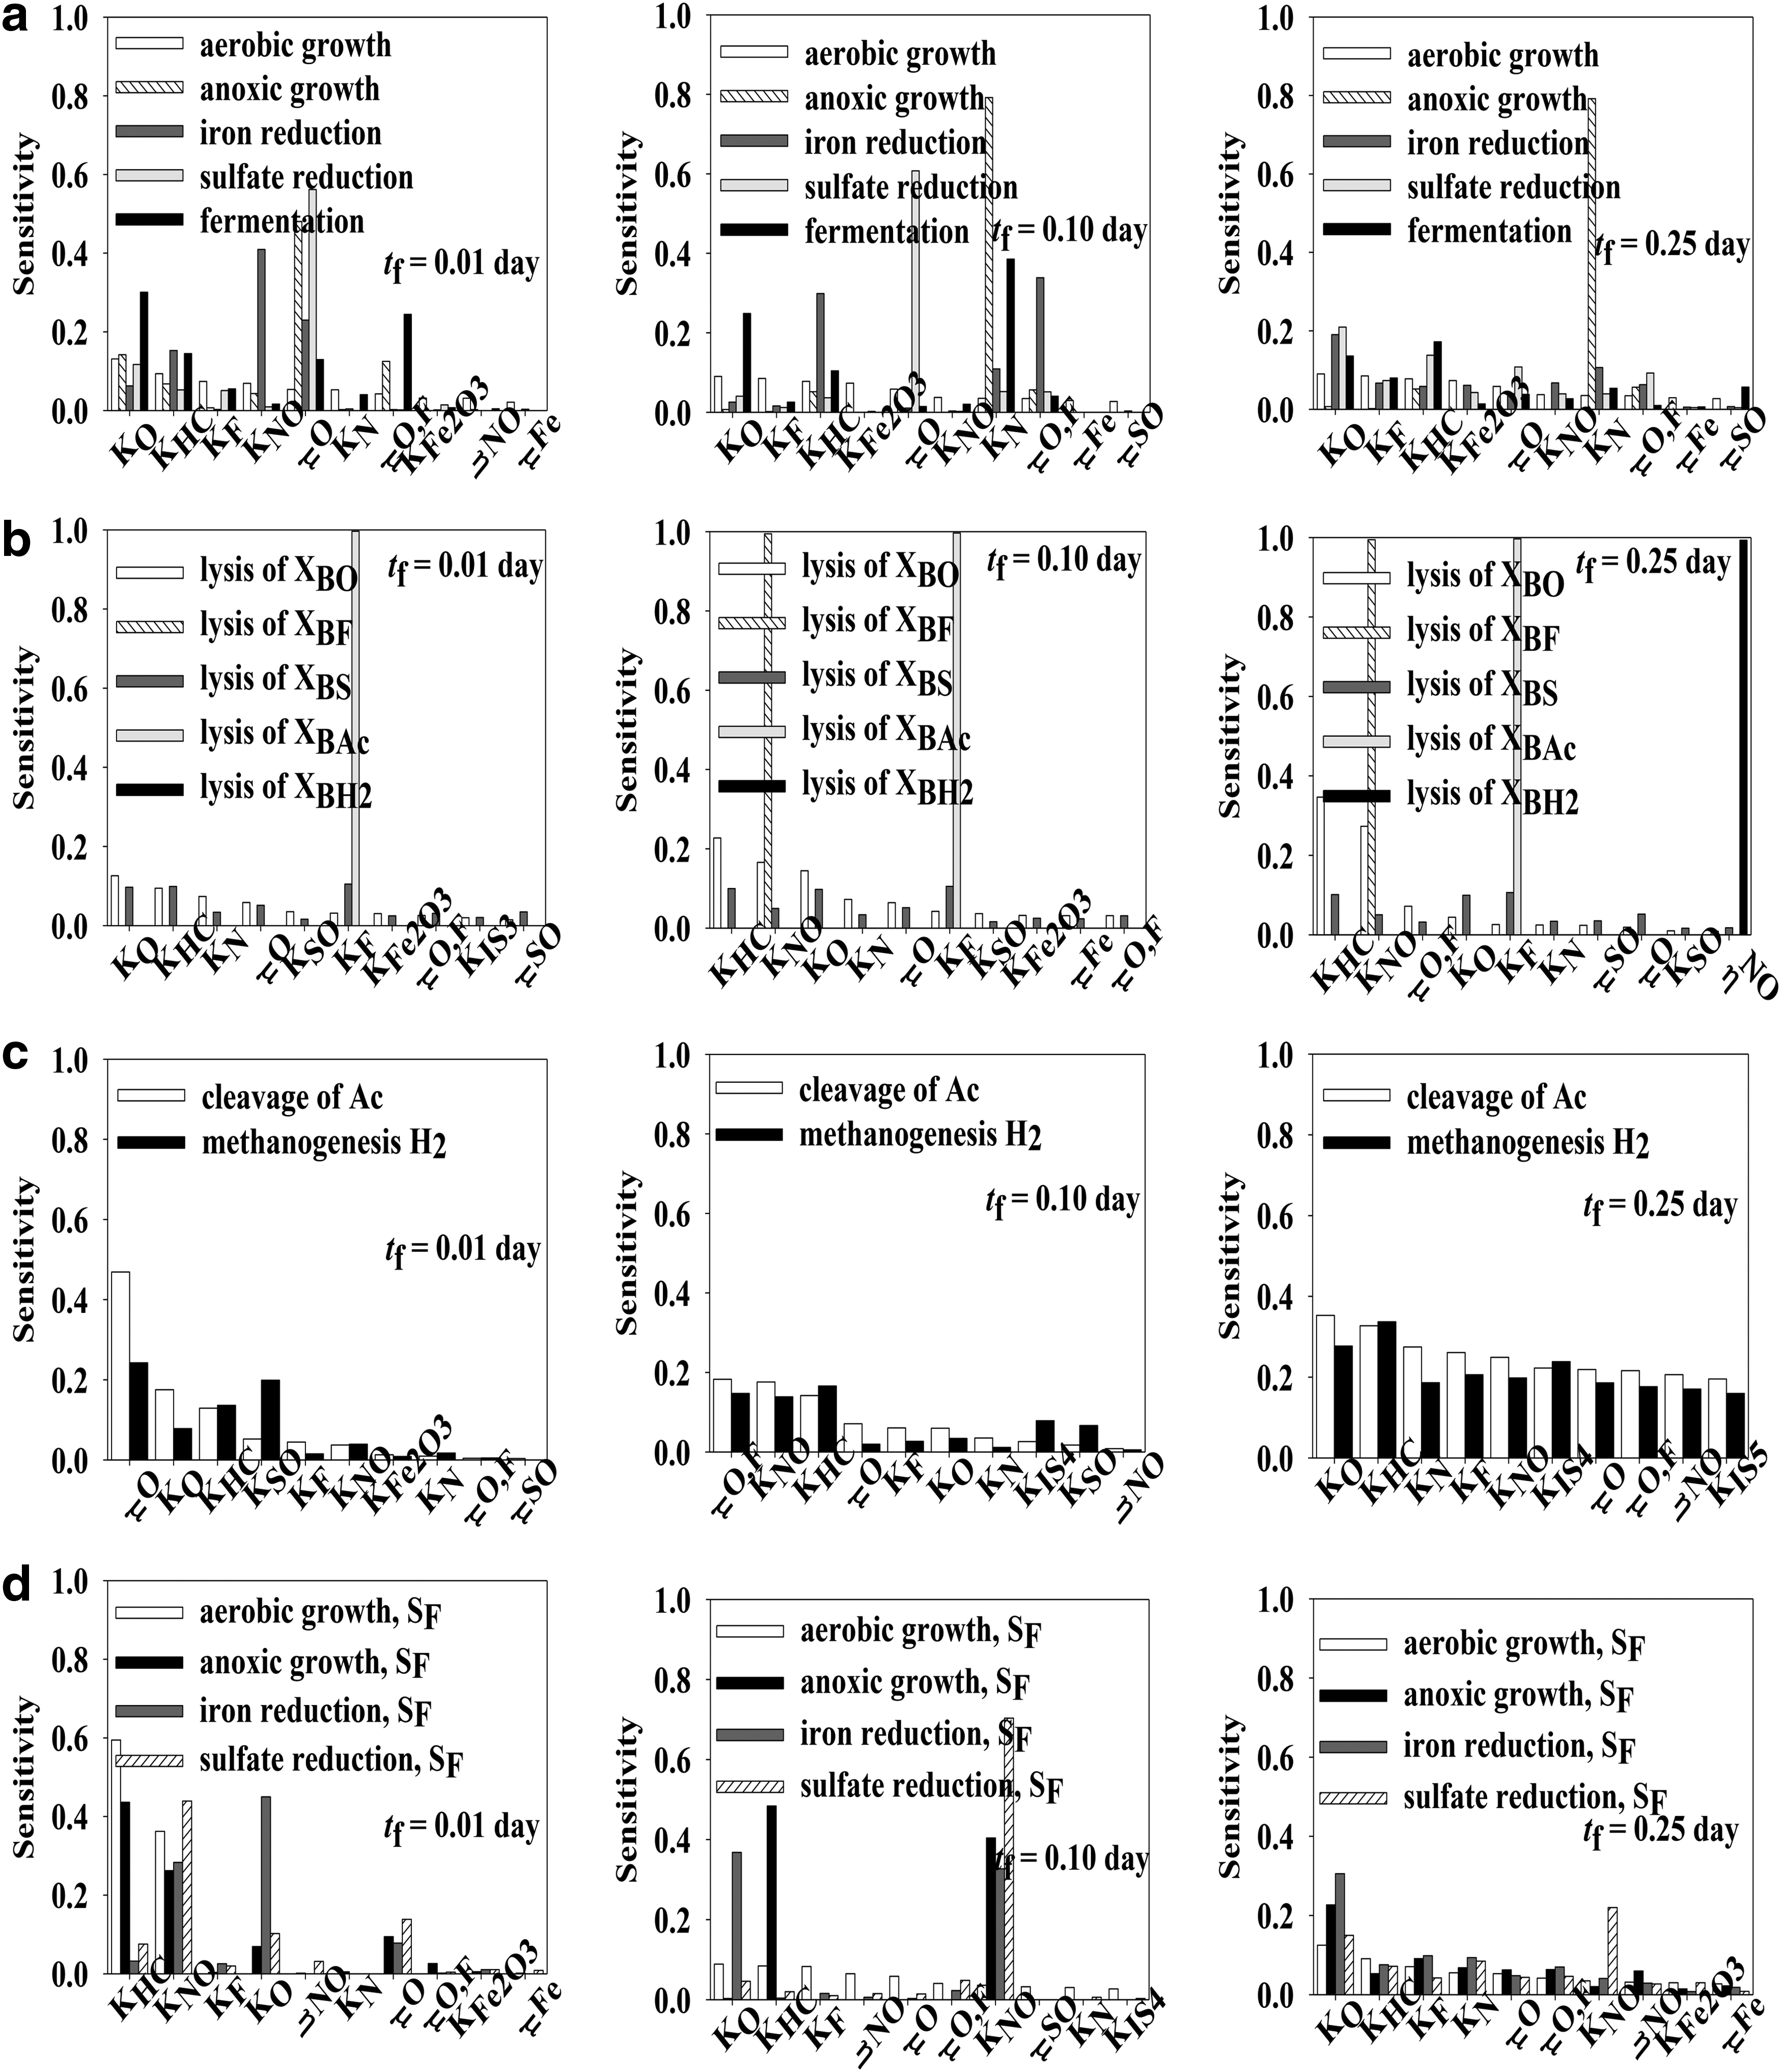
For better insight into the complex inter-regulation and cumulative effects of kinetic parameters on the bioremediation process, the Extended FAST analysis was applied on model reactions. The reactions of the biological module of the BTEX bioremediation model were divided into four groups (microbial BTEX degradation, biomass decay, methanogenesis, and oxidation of organic fermentation products), and the results are presented accordingly in Figs. 3 and 4.
First-order effect indices for reactions included in the biological part of the CBC model:
Total effect indices for reactions included in the biological part of the CBC model:
Microbial BTEX degradation
The microbial BTEX degradation group included aerobic growth, denitrification, iron reduction, sulfate reduction, and fermentation. In the case of first-order sensitivity, the aerobic growth reaction mostly depended on KO, KHC, and KF (half-saturation constants for oxygen, BTEX, and fermentation products) at all three analyzed time points. These three parameters contributed to approximately 35% of output variability. The mentioned constants were included into the kinetic expression describing the aerobic growth rate. All three parameters had the same effect; the aerobic growth rate decreased with the increase in the value of an individual parameter. An analogy in the total effect indices was observed. There was no significant variance in the total effect indices and all parameters were influential.
In conditions of oxygen absence, microorganisms use available electron acceptors and perform metabolic reactions. As a result, the anoxic growth reaction was mostly influenced by μO, μO,F, and KO at tf = 0.01 day. The faster the oxygen consumption (larger μO value), the sooner the anoxic metabolism is activated. By prolonging the simulation to tf = 0.1 day and tf = 0.25 day, the Extended FAST analysis revealed that denitrification depended mainly on KN, the half-saturation coefficient for nitrogen, and biomass growth (approximately 80% of output variability). Regarding the total effect indices, the highest variability was observed for the denitrification reaction over time.
Sulfate-reducing bacteria and iron-reducing bacteria are able to reduce sulfate and solid iron, respectively, and use them as an electron acceptor. These microorganisms use BTEX and acetate as electron donors and carbon sources. The results of the global sensitivity analysis suggested that the most important parameters for the iron reduction reaction rate change over time. At tf = 0.01 day, the most important parameter was KNO; at tf = 0.1 day, μO,F; and at tf = 0.25 day, KO. The aforementioned half-saturation constants were included into the kinetic expression describing iron reduction, both having an inhibitory effect. The importance of μO,F could be explained by the competition between aerobic growth on acetate and iron reduction. Perhaps aerobic growth on acetate is a preferable metabolism. On the other hand, μO was the most influential parameter for the sulfate reduction reaction rate at tf = 0.01 day and tf = 0.1 day (∼70% contribution), while at tf = 0.25 day, KO was the most influential. The sum of the first-order sensitivities for the mentioned three time points varies from 0.821 to 0.882, indicating a nonadditive model. No relevant variations of total effect indices had been detected during the simulation time for both iron reduction and sulfate reduction reaction rates.
In the fermentation reaction, BTEX is transformed to acetate and hydrogen. According to the first-order sensitivity, fermentation was mostly influenced by KO and μO,F at tf = 0.01 day, by KO and KN at tf = 0.1 day, and by KO and KHC at tf = 0.25 day. At tf = 0.01 day, KO and μO,F contributed to 57% of output variability, and there were 22 noninfluential parameters. By increasing the values of KN and KO, the fermentation reaction had slowed down. Total effect indices showed the same trend with no significant variability.
Biomass decay
The BTEX bioremediation model also describes microorganism decay through reactions of biomass decay. Each reaction describing five types of biomass decay was analyzed separately. Lysis of XBFe, XBAc, and XBH2 was influenced (∼99%) only with one kinetic parameter KNO, KF, and ηNO, respectively, at all three analyzed time points. All other 27 kinetic parameters were considered noninfluential on the mentioned reactions. The sum of the first-order sensitivity for the mentioned reactions at the analyzed time points was close to 1 (0.99), indicating the unimportant effect related to interactions. KNO is considered an inhibition constant in the iron reduction reaction performed by XBFe biomass. By increasing the KNO value, the mentioned reaction had slowed down and the biomass lysis activated. KF had the same effect on the reaction of acetate cleavage performed by XBAc and ηNO on the denitrification reaction. The reaction describing XBO and XBSO biomass decay was mostly sensitive to Ko and μFe. The total effect indices indicate the same trend as first-order sensitivity. Regarding the total effect indices, there was possible model reduction with respect to lysis of XBFe, XBAc, and XBH2.
Methanogenesis
Methanogenesis includes two reactions, cleavage of acetate and methanogenesis by oxidation of hydrogen and reduction of inorganic carbon. During the bioremediation process, there was a change in the most influential parameters that affected methanogenesis reactions. At the beginning of the process, both reaction rates were mostly influenced by μO (sensitivity coefficient = 0.469 and 0.242), and there were 20 noninfluential parameters. μO affects the oxygen consumption rate and indirectly acetate production. The faster the oxygen is consumed, the faster the fermentation is activated and, respectively, the faster is the acetate cleavage reaction. At tf = 0.1 day, μO,F, KNO, and KHC were shown to be the most influential, indicating the competition between methanogenesis and acetate oxidation. Interestingly, at the steady state, the FAST analysis revealed that all kinetic parameters had approximately the same influence on the analyzed reactions. The same effect was noticed for the total effect indices. At steady state, there were minimum variations in the total effect index values for both reactions. Some variations of the total effect indices were observed at tf = 0.1 day and tf = 0.25 day for reaction of acetate cleavage.
Oxidation of organic fermentation products
During BTEX bioremediation, the microorganisms oxidize acetate using the same electron acceptors as for the BTEX through four reactions: (i) aerobic growth on acetate, (ii) anoxic growth on acetate, (iii) iron reduction on acetate, and (iv) sulfate reduction on acetate. Global sensitivity analysis regarding the first-order sensitivities revealed that there was a slight change in process control. At tf = 0.01 day and tf = 0.1 day, KNO was shown to be the most important parameter for all four reactions, contributing to approximately 30% of output variability. As mentioned previously, it had an inhibitory effect on the mentioned reactions. At steady state (tf = 0.25 day), the individual parameter contributions to variance were low, and the most influential parameter was observed to be KO. The half-saturation coefficient for oxygen had an inhibitory effect on anoxic growth on acetate, iron reduction on acetate, and sulfate reduction on acetate. This indicates that aerobic growth on acetate is a preferable process.
In the case of total effect indices, significant availabilities could be observed at tf = 0.01 day. There were 26 noninfluential parameters for aerobic and anoxic growth on acetate, and 24 noninfluential parameters for iron and sulfate reduction on acetate. Interestingly, at tf = 0.1 day and tf = 0.25 day, all parameters were influential, with no significant variability.
Comparison of groups
By analyzing the results of the global sensitivity analysis for model reactions, it can be seen that aerobic growth reaction mostly depended on KO, KHC, and KF (the half-saturation constants for oxygen, BTEX, and fermentation products). It was also observed that reactions included into methanogenesis mostly depend on μO (growth rate constant growing on oxygen), while in the case of the oxidation of organic fermentation products, KO was the most influential parameter.
Like for the models of metabolites, the sums of the first-order sensitivities for all analyzed reactions at all analyzed time points were less than one. The sums of the first-order sensitivities ranged from 0.63 for the reaction of the lysis of XBO at tf = 0.01 day to 0.997 for the reaction of the lysis of XBAc at all three analyzed time points. Correspondingly, the sums of the total effect indices ranged from 2.162 for the reaction of fermentation at tf = 0.01 day to 11.124 for the reaction of acetate cleavage at tf = 0.01 day.
Conclusions
In this work, the Extended Fourier Amplitude Sensitivity Test was applied for analysis of the importance of kinetic parameters on 18 metabolites and 16 reaction rates of the biological part of the integrated BTEX bioremediation model on three time points. The Extended FAST results of two sensitivity indices (first-order effect and total effect indices) were analyzed. According to the sum of the first-order effect indices for both metabolites and reactions at three analyzed time points, it can be concluded that the model is nonadditive, but the relationships between model variables are not strong (sums of the first-order sensitivities for metabolites are in the range 0.823–0.986 and, for reactions, are in the range 0.63–0.997). Comparing all calculated first-order sensitivities, it can be observed that the most influential parameters on both metabolites and reactions are KHC and KO. The obtained results indicate that a BTEX bioremediation process described with the set of equations given in Table 1 is regulated depending on the dissolved oxygen concentration. Although a different set of equations describing the BTEX bioremediation process would demand a new global sensitivity analysis, the obtained results offer a good starting point for model analysis planning.
Footnotes
Author Disclosure Statement
No competing financial interests exist.