
Abstract
Abstract
Treatment of dye wastewater with a chemical oxygen demand (COD) of 1000–1600 mg/L was studied by the use of a continuous iron-carbon microelectrolysis process (MEP) and a continuous iron-carbon microelectrolysis–upflow anaerobic sludge blanket (UASB)–sequential batch reactor (SBR) process (MEUSP). Results indicated, first, that high-temperature processing to generate a microporous MEM can effectively prevent caking of MEM. MEP displayed good performance in treatment of the wastewater, with a color removal of 75% and COD removal of more than 60% when the hydraulic retention time (HRT) and flocculation pH were set at 6 and 11 h, respectively. Effluent reflux technology can effectively reduce the amount of alkali used in the process. MEP can be effectively combined with a UASB by optimization of the HRT (10 h), at which time the flocculation pH is 8, which matches the influent pH of the UASB. COD of the final effluent from the MEUSP was kept in the range of 70–98 mg/L.
Introduction
D
The use of a microelectrolysis material (MEM) incorporates redox, flocculation, adsorption, precipitation, and microelectrolysis effects (Ju and Hu, 2011). MEM technology has obvious advantages, such as a wide application range and ease of operation, and requires less area (Yang et al., 2009; Li et al., 2010). Furthermore, pretreatment by microelectrolysis is a low-cost and effective method because it does not require chemical coagulants and external power as in the cases of coagulation and conventional electrolysis (Zhou et al., 2011; Singh et al., 2013). Hazardous materials and pollutants with poor biodegradability can be eliminated by MEM technology and the ratio of biological oxygen demand to chemical oxygen demand (COD/BOD5) can be greatly improved (Zhao et al., 2010; Saidi et al., 2014). Therefore, this technology has been widely studied in the treatment of dye wastewater. For example, Yang (2009) treated polyester wastewater by an interior microelectrolysis unit and the COD removal rate reached 52%. Fu et al. (2010) treated simulated wastewater containing reactive red 195 by a single zero-valent iron/activated carbon process; the removal rates of color and COD were approximately 65% and 60%, respectively. Ruan et al. (2010) treated an aqueous solution of reactive red X-3B by a single internal microelectrolysis process (MEP); the removal rates of color and COD reached approximately 20% and 30%, respectively.
However, there are three major obstacles to the practical application of MEM technology. The first is how to avoid caking of iron-carbon MEMs. Currently, most researchers have merely mixed iron chips and activated carbon to give MEMs (Liu et al., 2007; Fu et al., 2010; Ruan et al., 2010; Sun et al., 2011), in which the iron chips and activated carbon were not sintered together. This kind of MEM will tend to cake in practical applications, which will further reduce the efficiency of treatment. The second obstacle is how to reduce the amount of alkali in the MEP because raw wastewater first needs the addition of acid to adjust the pH to 2–4 during the MEP, and then the addition of alkali to adjust the pH to 9–10 for flocculation (Lv et al., 2011; Sun et al., 2011). These steps will lead to a substantial increase in the amount of alkali. The third obstacle is how to effectively combine an MEP with an upflow anaerobic sludge blanket (UASB)–sequential batch reactor (SBR) process and deep treat dye wastewater, to meet increasingly stringent discharge standards for dye wastewater.
This study will carry out related experimental research to discuss the above problems of MEMs by a practical application.
Materials and Methods
Materials
Wastewater used in the experiment was taken from a textile dyeing factory in Xianyang City, Shaanxi Province, China. The characteristics of the dye wastewater were as follows: pH, 11–13; COD, 1000–1600 mg/L; color, 125–250 dilution times. Aerobic activated sludge was obtained from an aerobic tank in the factory and the sludge settling volume in 30 min (SV30) was kept in the range of 25–30%. Mixed liquor suspended solids were kept in the range of 3–4 g/L in the SBR. Anaerobic granular sludge was obtained from a pilot UASB reactor treating dye wastewater. The particle size distribution of the seed sludge was as follows: 2–3 mm, 60%; 0.9–2 mm, 20%; and 0.2–0.9 mm, 20%.
According to previous relevant research (Liu et al., 2012, 2015), a high-temperature process was applied to synthesize a microporous MEM in our laboratory. The main components of the MEM were iron and carbon in a 1:1 ratio, the adhesive was SiO2, and the catalysts were MnSO4 and MnO2. The mixed raw materials were compressed into globular models and then the globular models were sintered (900°C) in a vacuum muffle furnace for 6 h. A photograph and scanning electron microscopy (SEM) micrograph of the MEM used in this experiment are shown in Fig. 1.

As can be seen from Fig. 1a, the MEM is a spherical material with a diameter of 1.5–3.5 cm. From Fig. 1b, the MEM is a microcrystalline microporous iron-carbon material with many tiny holes and gas/liquid flow channels. Specific physical properties of the fabricated MEM are as follows: Brunauer–Emmett–Teller (BET) surface area, 38.27 m2/g; porosity, 65%; density, 1300 kg/m3; and average pore size, 3.77 nm.
Experiment method
A schematic diagram of the microelectrolysis-UASB-SBR process (MEUSP) is shown in Fig. 2.
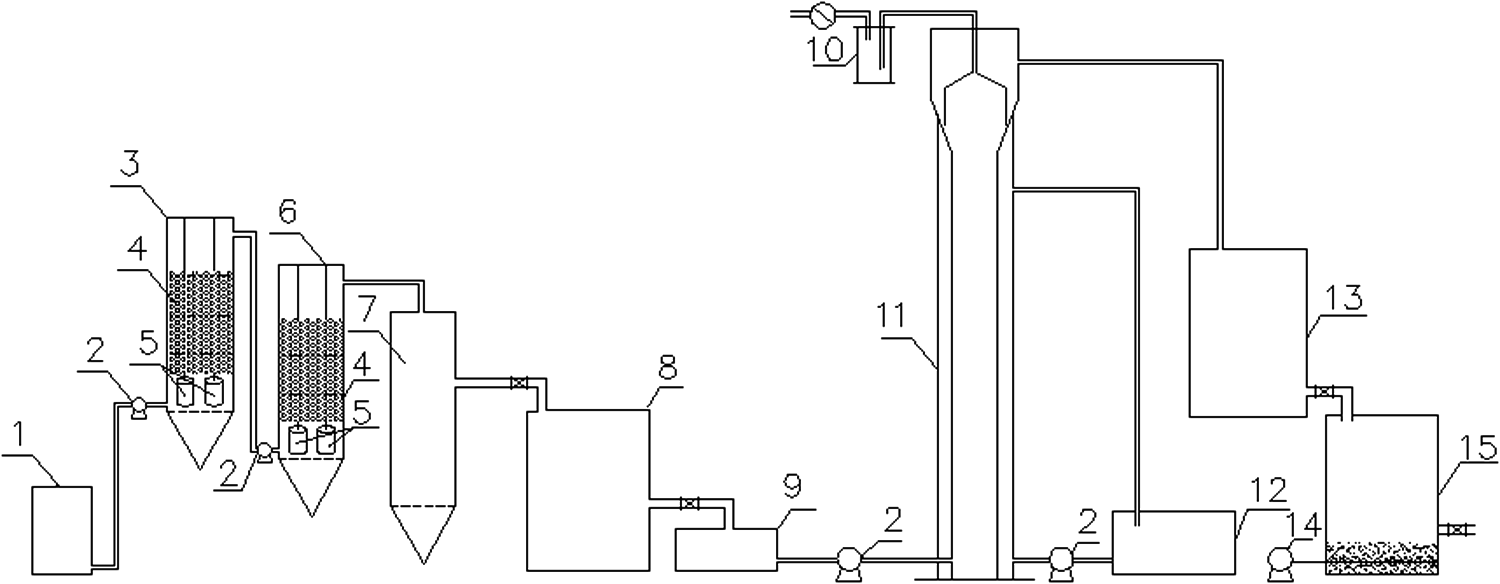
Schematic diagram of the MEUSP. 1. First distribution reservoir; 2. peristaltic pump; 3. aerating apparatus; 4. fabricated MEM; 5. first microelectrolysis reactor (5.2 L); 6. second microelectrolysis reactor (5.2 L); 7. sedimentation tank (5.2 L); 8. coagulation and sedimentation tank (30 L); 9. second distribution reservoir; 10. water seal; 11. UASB reactor (12.4 L); 12. constant-temperature water bath; 13. water-regulating tank; 14. air pump; 15. SBR (30 L). UASB, upflow anaerobic sludge blanket; SBR, sequential batch reactor; MEUSP, microelectrolysis-UASB-SBR process.
As shown in Fig. 2, this experiment was divided into two parts. The first part of the experiment (MEP) used a single microelectrolysis reactor for investigation. The MEP employed devices 1–8 (excluding device 6). The procedure of the experiment was as follows: the influent pH was controlled at around 3 (98% H2SO4 was used for adjustment of the pH) in device 1, according to previous studies of MEPs (Lv et al., 2011; Sun et al., 2011). NaOH was used to adjust the pH in device 8 for flocculation (this pH is defined as the flocculation pH), and the flocculation duration was set at 2 h (Wang et al., 2014a, 2014b; Liu et al., 2015).
The second part of the experiment applied the MEUSP for investigation. This part employed devices 1–14. The influent stream of the UASB reactor was the effluent from device 8; we added a nutrient solution in device 9 and the UASB reactor operated at temperatures ranging from 35.5°C to 37.5°C. The processes of the SBR included wastewater input, reaction, sedimentation, and output. The time periods in our experiment for each process were 1, 8, 2, and 1 h, respectively (Xu et al., 2013). The SBR operated at room temperature.
Analysis methods
COD was measured by the potassium dichromate method and color determined by the dilution times method (State Environmental Protection Administration of China, 2002). The BET surface area was quantified by a specific surface area analyzer (Quantachrome Flowsorb-III). SEM was performed on an FEI Quanta 200 microscope. UV-vis spectra of wastewater were recorded with a spectrophotometer (Shimadzu UV-1700).
Results and Discussion
Study of treatment of dye wastewater by continuous MEP
The treatment of the actual wastewater by a continuous MEP was studied to test the performance of the fabricated MEM and determine how to reduce the amount of alkali in the flocculation process.
Effect of hydraulic retention time on the treatment efficiency
The influence of the hydraulic retention time (HRT) on the treatment efficiency is shown in Table 1.
HRT, hydraulic retention time.
It can be seen from Table 1 that the COD removal rate increased with an increase in the HRT. When the HRT was set at 6 h, the COD removal rate reached 69% and an ideal color removal rate of 76% was achieved (the color was reduced to about 40 dilution times from 125 dilution times). The COD removal efficiency was more than 19% compared with that achieved by Yang (HRT = 6 h).
Based on considerations of efficiency and economy in the treatment process, in the following study, the HRT was set at 6 h.
Effect of flocculation pH on treatment efficiency
Microelectrolysis does not require chemical coagulants and external power. We only added alkali to the effluent of the microelectrolysis reactor and the flocculation reaction could be carried out. The influence of the flocculation pH on the treatment efficiency is shown in Table 2.
COD, chemical oxygen demand.
It can be seen from Table 2 that the removal rates of COD and color increased with an increase in the flocculation pH. It may be presumed that ferrous and ferric ions need a sufficient amount of OH- ions to coagulate. This assumption is consistent with that of Sun et al. (2011), who set the value of the flocculation pH at 10. Considering the treatment cost, the flocculation pH was set at 11 to maintain high efficiency of the MEP.
Treatment performance of continuous MEP
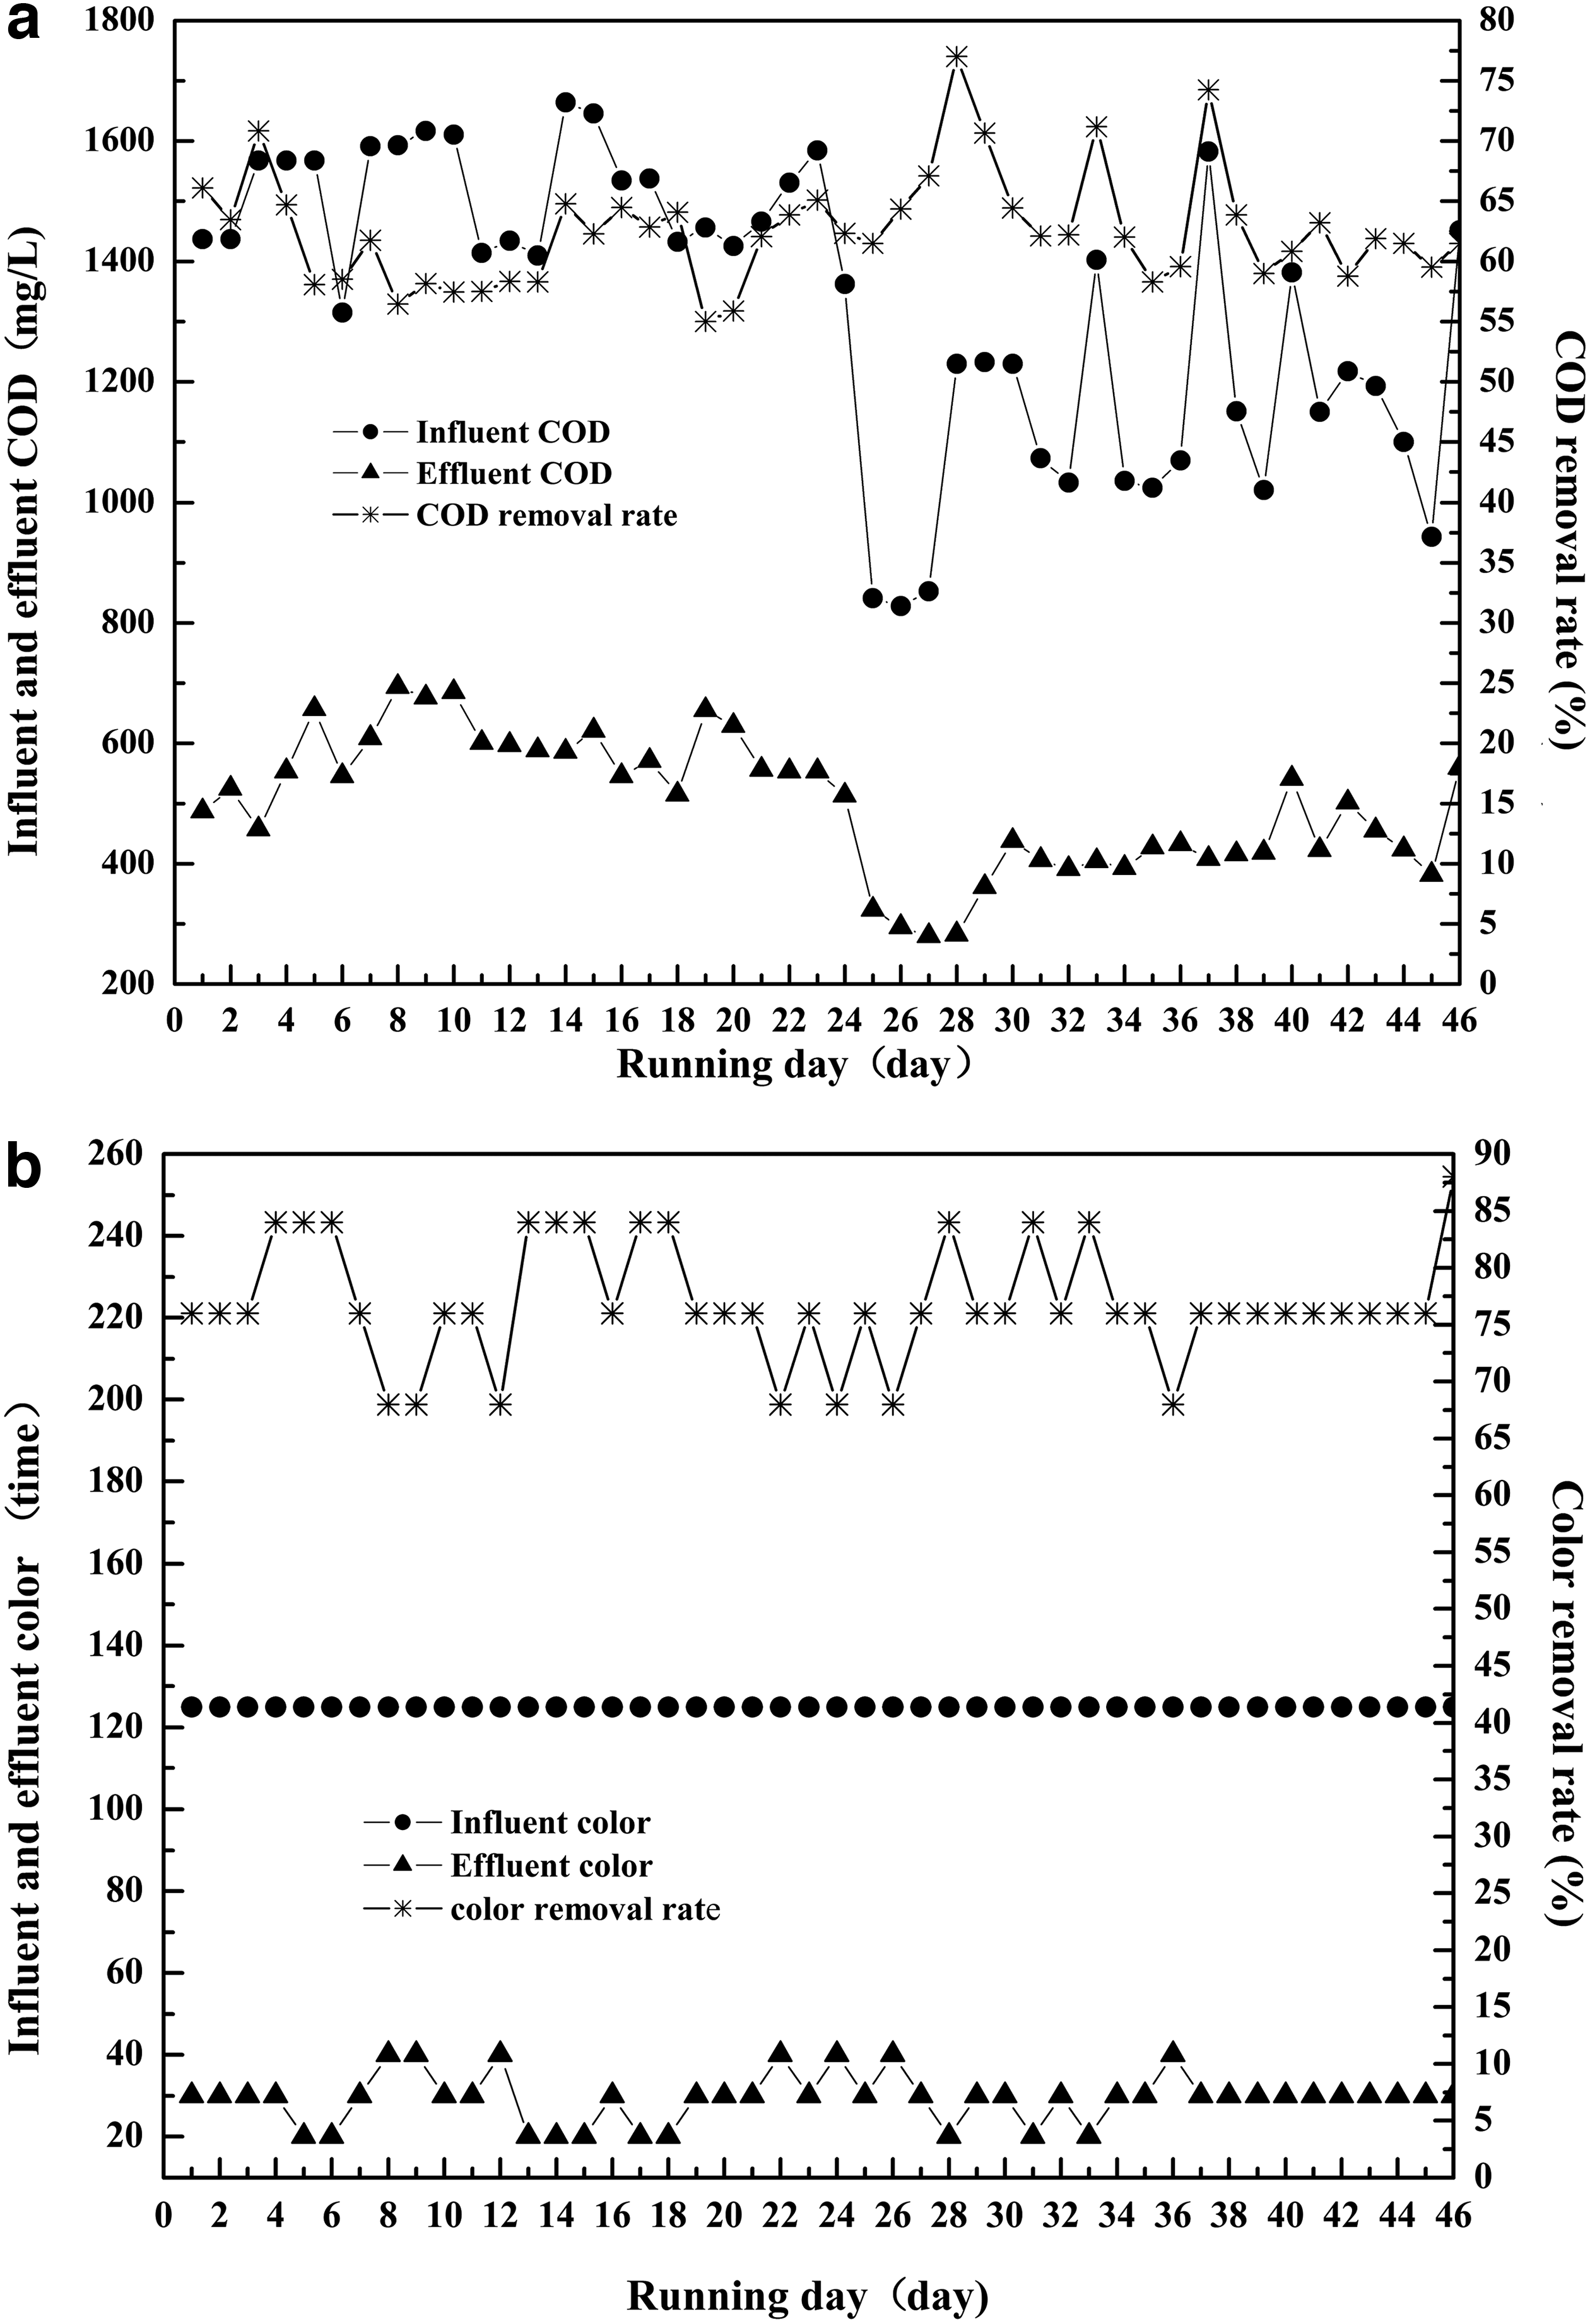
We performed an MEP by assembling the fabricated MEM and set the HRT and flocculation pH at 6 and 11 h, respectively. The removal rates of COD and color of the wastewater from the first day to the 46th day are shown in Fig. 3.
Performance of MEP (HRT = 6 h, flocculation pH = 11):
It can be seen from Fig. 3a that during 46 days of continuous operation, although the influent COD fluctuated significantly, the COD removal efficiency of the MEP was kept within the range of 55–77%. The effluent COD ranged from 300 to 690 mg/L. It can be seen from Fig. 3b that the color removal rate was kept in the range of 60–85% (the color was reduced to about 40 dilution times from 125 dilution times).
Compared with previous studies (Yang et al., 2009; Fu et al., 2010; Ruan et al., 2010), it was found that the fabricated MEM displayed good performance in continuous treatment of the wastewater. In the course of the experiment, on a cycle of every 14 days of the MEP a backwash was needed, which was aimed at preventing the blockage of surface holes of the MEM.
During the 46 days of the experiment, it can be seen from Fig. 4 that there was no caking problem with the MEM. The reason might be that the MEM was a microporous material with many tiny holes and gas/liquid flow channels.

Photograph of MEM after 46 days.
Simple analysis of the mechanism of the MEP
The microelectrolysis reactions can be represented as follows (Fan et al., 2009):
It is believed that organic contaminants can be reduced by Fe, Fe2+, and [H] during microelectrolysis. Furthermore, organic contaminants can also be removed by adsorption and coprecipitation by the ferrous and ferric hydroxides that are formed from the oxidation and precipitation of Fe2+ (Cheng et al., 2007).
Reactive red B and acid red G are widely used in the textile dyeing industry. Furthermore, they are both azo dyestuffs and the main contaminants of the actual dye wastewater were also azo dyestuffs. Therefore, we employed the MEP to treat simulated wastewater with reactive red 5B and acid red G dyes and actual dye wastewater to study the mechanism of the MEM through its UV/vis spectrum. The results are shown in Fig. 5.

UV/vis spectrum of:
As shown in Fig. 5a, when the simulated dye wastewater with reactive red 5B was treated by the MEP, the color was reduced from 150 dilution times to 10 dilution times and the absorbance peaks in the visible region at 524, 315, and 250 nm disappeared. As shown in Fig. 5b, the color of the simulated dye wastewater with acid red G was reduced from 200 dilution times to 10 dilution times and the absorbance peaks at 506 and 311 nm disappeared. It was implied that the molecular structures of the dyestuffs were destroyed during the MEP. These findings are similar to the previous report (Wang et al., 2013). As shown in Fig. 5c, the absorbance peaks of actual dye wastewater at 294 nm decreased significantly after the MEP treatment, which indicated that the concentration of pollutants in the actual dye wastewater was reduced.
Reducing amount of alkali
In the flocculation process (flocculation pH 11), 1.8–2.0 kg of alkali is needed for 1 tonne of wastewater, costing about $0.67–0.75, which will lead to a significant increase in the treatment cost. Therefore, how to reduce the dosage of alkali is a serious problem in practical applications. In addition, adding alkali will lead to the pH of the effluent increasing to about 11, which could not meet emissions standards (pH 6–9).
In this part of the experiment, effluent from device 8 (pH 11) and device 6 (pH 4.5–6.0) were mixed at different volume ratios (the ratios of effluent from device 8 to device 6 were 0.5, 1, 1.5, 2, and 2.5). The treatment efficiency is shown in Table 3.
As shown in Table 3, the treatment efficiency and pH of the mixed liquid increased with an increase in the reflux ratio. When the reflux ratio was set at 1.5, the removal rates of COD and color reached 62.84% and 76%, respectively. At the same time, the pH of the mixed liquid ranged from 7.15 to 8.92, so we set the reflux ratio at 1.5.
The amount of alkali can be effectively reduced and the pH of the mixed liquid could be controlled by the reflux method.
Study of treatment of dye wastewater by continuous MEUSP
In this part of the experiment, we discuss how to combine the MEP with UASB-SBR and how to deep treat the wastewater. The combination of microelectrolysis and biological technology has been given much attention by researchers, and they obtained ideal results (Fan et al., 2009; Wang et al., 2009; Zhu et al., 2014). However, they did not continuously test the performance of the combined process during long periods, so we employed a continuous MEUSP to deep treat the wastewater and continuously test the performance of the MEUSP over a long time.
Optimizing operating condition for MEP
We can see from the above-mentioned chemical Equations (2) and (3) that the amount of H+ ions is reduced in the process. The relationship between the effluent pH and the HRT of the microelectrolysis reactor is shown in Table 4.
As shown in Table 4, there is an increase in the effluent pH with an increase in the HRT. Because the effluent pH from device 8 must match the influent pH of the UASB, we set the HRT of the MEP at 10 h and the flocculation pH at 8, our purpose being to make the pH as close as possible to the influent pH (6.50–8.50) of the UASB. Therefore, we can effectively combine the MEP with UASB-SBR by optimizing the values of the HRT and flocculation pH.
COD removal efficiency of MEP
When we set the HRT and flocculation pH at 10 and 8 h, respectively, the removal efficiency for COD and color of the MEP are shown in Fig. 6.

Performance of MEP (HRT = 10 h, flocculation pH = 8):
As shown in Fig. 6a, the COD removal rate ranged from 45% to 66% and the COD of the effluent from the MEP declined to 400–800 mg/L. It can be seen from Fig. 6b that the color removal rate was kept in the range of 84–92%. The color of the wastewater could be reduced to about 40 dilution times from 250 dilution times.
Performance of the MEUSP
We combined the MEP and UASB-SBR on the 17th day. The influent pH of the UASB was 8.0, the effluent pH of the UASB was around 8.5, and the effluent pH of the SBR was 8.7. The performance of the MEUSP is shown in Fig. 7.
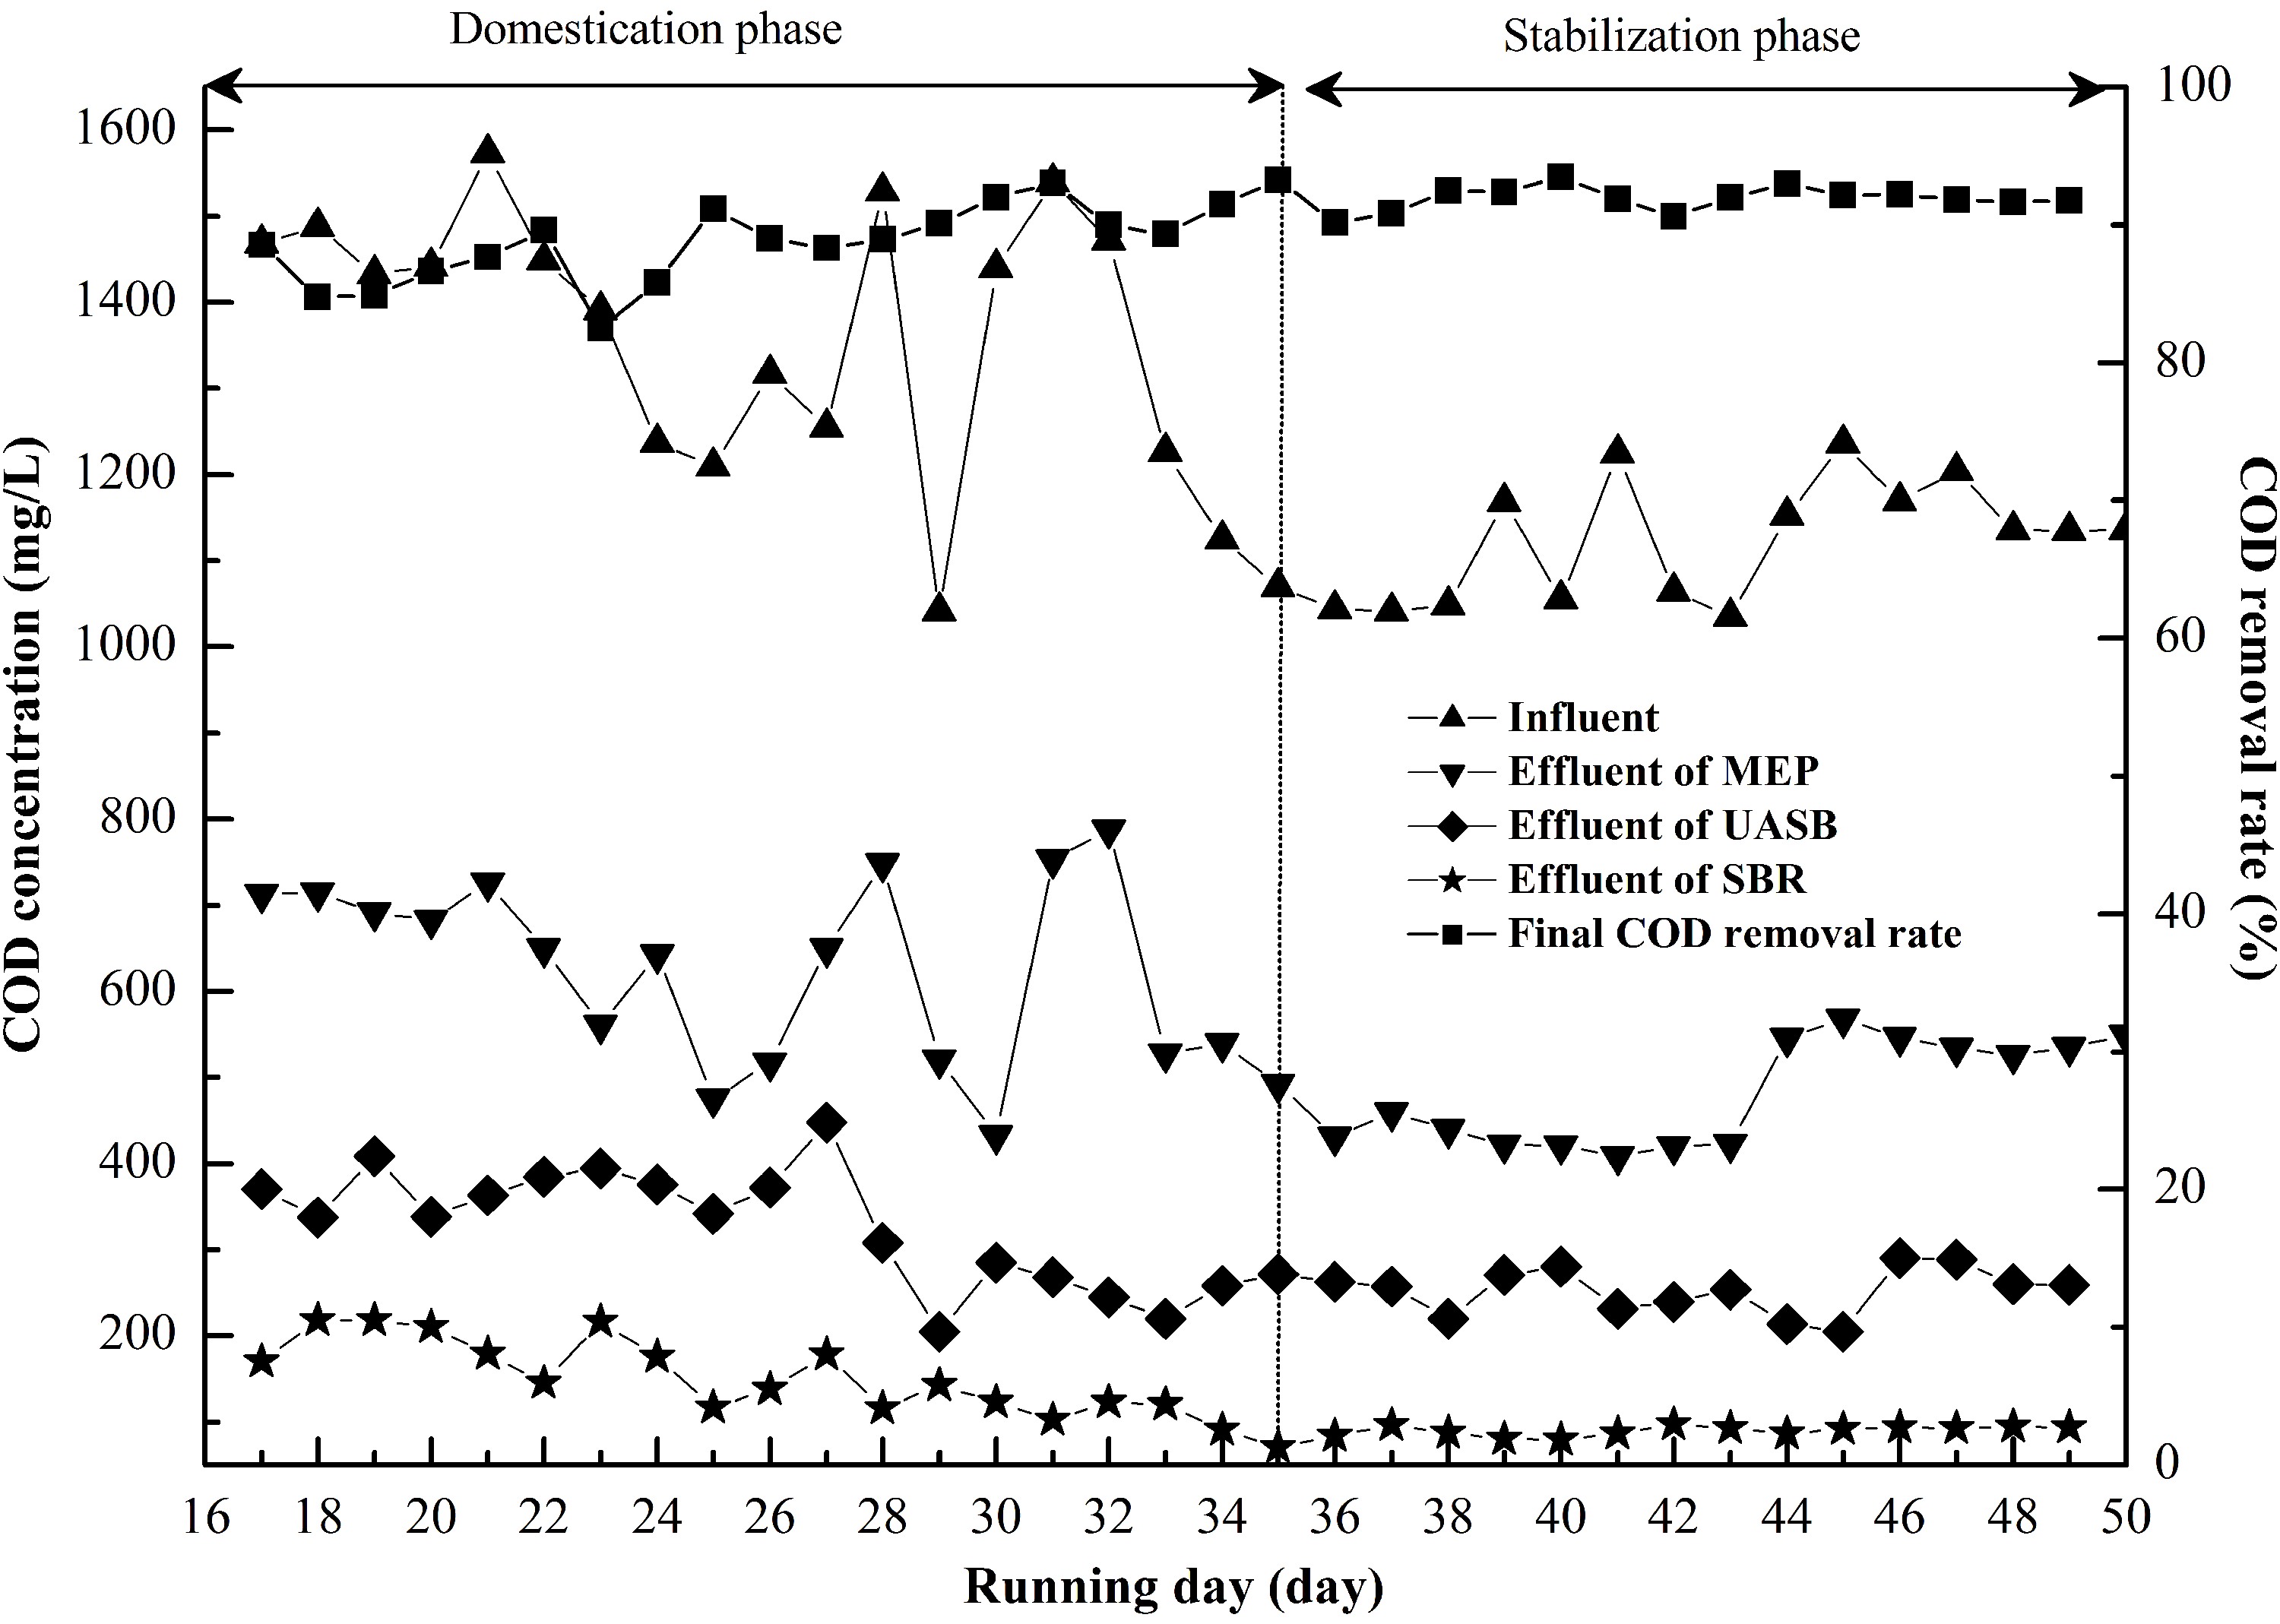
Performance of MEUSP.
As shown in Fig. 7, in the domestication phase the influent flow of the UASB was mixed liquid (simulated and actual dye wastewater), the organic loading rate was 2 kg COD/(m3·d), and the COD removal efficiency of the MEUSP ranged from 82% to 93%. During the stabilization phase, the fluid rate was 1.05 L/h. The influent flow of the UASB was 100% actual wastewater, the average organic loading rate of the UASB was 0.45 kg COD/(m3·d), and the COD of the effluent of the UASB declined 220–413 mg/L. The average organic loading rate of the SBR was 0.20 kg COD/(m3·d) and the COD of the effluent of the SBR declined 70–98 mg/L. Finally, the color of the effluent was much clearer compared with the raw wastewater.
During the stabilization phase (16 days), 57.58% of the total COD was removed by the MEP, 14.65% was removed by the UASB, and 19.88% was removed by the SBR. Therefore, the removal rates of total COD were ranked from high to low in the following order: MEP > SBR > UASB.
In conclusion, MEUSP can be used as an effective treatment process to deep treat dye wastewater.
Conclusions
The study clearly indicates that the MEP is an effective method for the treatment of dye wastewater. High-temperature processing to generate a microporous structure can prevent caking of the MEM. We can effectively reduce the cost of alkali by reflux technology. The MEUSP can be combined by optimization of the HRT. The COD removal efficiency of the MEUSP reached around 91%, the COD of the effluent declined 70–98 mg/L, and the MEUSP exhibited a high ability to resist loading shock.
The study provides a viable technology for the treatment of dye wastewater and lays a solid foundation for the practical application of the MEM.
Footnotes
Acknowledgments
Funding for this research was provided by the National Natural Science Foundation of China under Grant No. 21176197; the Specialized Research Fund for the Doctoral Program of Higher Education of China under Grant No. 20126118110015; the Science and Technology Innovation Project of Shaanxi Province in China under Grant No. 2011KTZB03-03-01; and the Science and Technology Development Program of Shaanxi Province in China under Grant No. 2008k07-14.
Author Disclosure Statement
No competing financial interests exist.