
Abstract
Abstract
Injected CO2 from geologic carbon storage is expected to impact the microbial communities of proposed storage sites, such as depleted oil reservoirs and deep saline aquifers, as well as overlying freshwater aquifers at risk of receiving leaking CO2. Microbial community change in these subsurface sites may affect injectivity of CO2, permanence of stored CO2, and shallow subsurface water quality. The effect of CO2 concentration on the microbial communities in fluid collected from a depleted oil reservoir and a freshwater aquifer was examined at subsurface pressures and temperatures. The community was exposed to 0%, 1%, 10%, and 100% pCO2 for 56 days. Bacterial community structure was analyzed through 16S rRNA gene clone libraries, and total bacterial abundance was estimated through quantitative polymerase chain reaction. Changes in the microbial community observed in the depleted oil reservoir samples and freshwater samples were compared to previous results from CO2-exposed deep saline aquifer fluids. Overall, results suggest that CO2 exposure to microbial communities will result in pH-dependent population change, and the CO2-selected microbial communities will vary among sites. This is the first study to compare the response of multiple subsurface microbial communities at conditions expected during geologic carbon storage, increasing the understanding of environmental drivers for microbial community changes in CO2-exposed environments.
Introduction
G
Introduction of CO2 is expected to alter the chemical and physical environment in the subsurface. Dissolution of CO2(g) into the interstitial pore fluid results in a decreased pH and affects dissolved phase constituents (Kharaka et al., 2009; Smyth et al., 2009; Little and Jackson, 2010; Trautz et al., 2013). The concentration of CO2(aq), and corresponding pH reduction, is expected to be highest closest to the source of incoming CO2(g) and to decrease to pre-CO2 exposure concentrations at a downgradient distance. The interstitial fluid that results will cover a range of CO2(aq) concentrations and pH, which are expected to affect the microbial communities within these subsurface sites.
A diverse microbial community is known to inhabit the subsurface (Magot et al., 2000; Amend and Teske, 2005). The microorganisms that thrive in the deep subsurface drive biogeochemical reactions may affect the reservoir capacity to store CO2 and the permanence of stored CO2. For example, the microbial community may lead to biomineralization of CO2 (Rivadeneyra et al., 2006; Sanchez-Roman et al., 2007), biofilm formation that alters flow and storage (Bin et al., 2008; Cunningham et al., 2009; Satpute et al., 2010), dissolution of carbonate minerals through acid production (Warscheid and Braams, 2000; Bin et al., 2008; Park et al., 2009), and dissolution of minerals through metal mobility (Gadd, 2004). In addition, microbial acid production and microbial metal dissolution may impact the water quality of produced fluids and CO2-impacted freshwater formations. Therefore, microbial populations that adapt to CO2 exposure may play a vital role in the long-term storage and safety of GCS.
Research suggests CO2 exposure is a driving factor in the microbial community changes within CO2 storage sites. A recent laboratory study with samples from a deep subsurface brine aquifer storage site revealed that increasing CO2 concentration decreased the population numbers and diversity in the microbial community (Gulliver et al., 2014). After 56 days of exposure to pCO2 as low as 0.1 MPa, overall population growth was hindered and sensitive populations were depleted while survivor populations persisted. Another laboratory experiment with samples from a natural gas field found CO2 exposure resulted in the emergence of a CO2-resilient microbial community (Frerichs et al., 2014). An in situ experiment with a freshwater aquifer exposed to CO2(aq) revealed that a low CO2 exposure of 0.006 g CO2/L was accompanied with a slight increase in DNA concentration, but exposures up to 1.53 g CO2/L had otherwise little effect on microbial population numbers. In this experiment, the CO2-exposed microbial community decreased in microbial diversity, and a change in dominant populations was observed (Gulliver et al., 2014). A similar in situ experiment also found CO2 injection to be accompanied by a slight increase in microbial cell concentration and a shift in the most abundant phylotypes (O'Mullan et al., 2015).
Previous studies determined microbial communities expected in various subsurface environments are responsive to CO2 exposure. However, each site is expected to have different water quality parameters and initial microbial community. Therefore, two potential scenarios exist. In one scenario, the site-specific water quality parameters and initial microbial community will drive microbial response to CO2 exposure. This scenario would indicate a need to either independently examine the effect of CO2 on each subsurface microbial community or determine the CO2-impacted site characteristics that drive microbial community change. In the other scenario, exposure to CO2 or the resulting pH change is the driver of microbial community change, leading to an emergence of similar CO2-resistant microbial populations regardless of site. In this case, an ability to predict microbial community changes for future CO2-exposed environments may be possible without additional investigation in site characteristics. An understanding of the CO2-resistant microbial populations that follow exposure may be used to guide further research into the long-term microbial-driven processes that will affect the capacity, security, and impacts of CO2 deposits and CO2 leakage scenarios.
The objectives of this study were to (1) determine the microbial community response to CO2 exposure in depleted oil reservoir samples, (2) determine the microbial community response to CO2 exposure in freshwater aquifer samples, and (3) compare microbial community changes to CO2 exposure among a saline aquifer (previously published), a depleted oil reservoir, and a freshwater aquifer. The microbial community in formation fluid from the Mirando oil reservoir (3.4 MPa, 40°C) and the Plant Daniel freshwater aquifer (0.5 MPa, 22°C) were exposed to CO2 partial pressures at formation temperature and pressure. The relative impact of pH changes was also examined by comparing microbial community response with and without buffering. Results from these exposure experiments were compared to results published in Gulliver et al. (2014), in which comparable CO2 exposure experiments were conducted with formation fluid from the Arbuckle saline aquifer (14 MPa, 40°C). Microbial community changes were measured using 16S rRNA gene clone libraries and quantitative polymerase chain reaction (qPCR) so results could be directly compared to the previously published Arbuckle aquifer study (Gulliver et al., 2014). This is the first study to examine and compare the response of three relevant subsurface microbial communities at conditions expected during GCS. This comparison increases the understanding of important environmental drivers for microbial community changes in CO2-exposed environments.
Experimental Protocols
Site background
The Mirando oil field, Zapata County, Texas, is part of the Eocene formation, 490 to 610 m depth, consisting of fine grained sand. The reservoir pressure is 3.4 MPa, and the reservoir temperature is 40°C. Before sampling, this was producing about 10 barrels of oil per day. Fluid slurry sample was withdrawn from Chargos Creek Well A (latitude 27.1506936, longitude 98.9972297) and shipped overnight on ice to the laboratory. The samples had an 8–10% oil water cut and had <0.5 g/L suspended solids.
A detailed site description of the Plant Daniel freshwater aquifer is given in Trautz et al. (2013). Briefly, the Plant Daniel freshwater aquifer is an Energy Power Research Institute (EPRI) site used for investigating the geochemical and geophysical changes that can be expected in a freshwater aquifer from CO2 leakage from an underlying GCS site (Dafflon et al., 2013; Trautz et al., 2013). The freshwater aquifer is located in Escatawpa, MS, and consists of sandy units with semiconfining clay-rich units and is about 55 m in depth and 6 m in thickness. The reservoir temperature is 22°C, and reservoir pressure is 0.5 MPa. Samples were drawn after utilizing the Environmental Protection Agency (EPA) low purge sampling protocol and shipped overnight on ice to the laboratory. Samples had <0.5 g/L suspended solids.
Pressurized vessel exposure experiments
Mirando oil field formation samples were exposed to CO2 in 1-L, Teflon-lined stainless steel static pressure vessels; details of these vessels can be found in Kutchko et al. (2007). A volume of 200 mL of unfiltered reservoir fluid was added to each vessel. Syringe pumps were used to pressurize vessels with pure CO2 gas first to achieve the desired pCO2 and N2 gas second to maintain a fixed total pressure of 3.4 MPa. The experimental pCO2 was 0, 0.03, 0.34, and 3.4 MPa. This represented 0%, 1%, 10%, and 100% of the total pressure, respectively, where 100% pCO2 of the total pressure-simulated conditions expected closest to the plume, 10% and 1% pCO2 simulated conditions at a distance where CO2 is attenuated, and 0% pCO2 simulated conditions before CO2 injection. In addition, to understand the effect of buffering on the aquifer system, a separate vessel was pressurized for 56 days with 200 mL formation fluid, 10 g/L CaCO3, and pressurized with 0.34 MPa pCO2. All reactors were maintained at a constant temperature of 40°C, which closely resembles reservoir temperature. Sampling was performed by sacrificing vessels after 56 days of exposure to CO2.
Unfiltered fluid samples from the Plant Daniel freshwater aquifer were placed in 150 mL Swagelok vessels rated for 14 MPa. The 80 mL of Plant Daniel sample was pressurized to 0.5 MPa using 100% N2, 1% CO2/99% N2, 10% CO2/90% N2, or 100% CO2. In addition, to understand the effect of buffering on the aquifer system, a separate vessel was pressurized for 56 days with 80 mL formation fluid, 10 g/L CaCO3, and pressurized with 10% CO2/90% N2 gas. The vessels were stored at room temperature, which closely resembles aquifer temperature. Sampling was performed by sacrificing vessels after 56 days of exposure to CO2.
After sampling, the fluid was centrifuged at 4,000 g for 25 min. The bottom 5 mL of the fluid containing solids was used for the microbial community analysis described below, and the remaining fluid was filtered for chemical analysis. The initial raw fluid sample, without incubation, was also centrifuged at 4,000 g for 25 min. DNA extracted from the bottom 5 mL of this sample and results are described as is described as “Initial Water.” The remaining initial sample fluid was filtered for chemical analysis.
Microbial community analysis
DNA was extracted from 500 μL of the bottom centrifuged 5 mL sample utilizing the Power Soil DNA Isolation Kit (Mo Bio Laboratories, Carlsbad, CA). The microbial community structure was determined utilizing 16S gene clone libraries, which allowed analysis at the genera or species level. However, this method only assessed microorganisms that were high in relative abundance; the microbial community structure of lower relative abundance was not investigated. The PCR protocol is previously published in detail elsewhere (Gulliver et al., 2014). Briefly, bacterial 16S rRNA genes were amplified using two sets of universal bacteria primers, the 8F primer with the 519R primer (Lane et al., 1985) and the 338F primer (Amann et al., 1995) with the 907R (Lane, 1991). Archaea 16S rRNA genes were amplified using a set of universal archaea primers, the 344F (Raskin et al., 1994) primer with the 915R primer (Delong, 1992). Primers are listed in Supplementary Table S1. A 20 μL PCR with 2 μL DNA template was amplified in the thermocycler for 30 cycles. Efficacy of the DNA extraction and PCR was verified using gel electrophoresis and Escherichia coli DNA as a positive control for Bacteria and Methanococcus sp. as a positive control for Archaea. Negative controls utilized DNA-free water and revealed no contamination during any PCR procedure. No Archaea DNA was detected, and all further biological analyses were only performed utilizing methods for bacteria DNA.
PCR products of the two bacterial primer sets were cloned using the Invitrogen TOPO TA cloning kit (Life Technologies, Grand Island, NY) according to the manufacturer's instructions. Ninety-six clones per sample were sequenced at Functional Biosciences (Madison, WI). Rarefaction curves based on 97% similarity are given in Supplementary Fig. S1 for the Mirando oil reservoir and Supplementary Fig. S2 for the Plant Daniel freshwater aquifer.
16S rRNA gene clone library sequences were trimmed using FinchTV (Schloss et al., 2009). Chimeras were detected using Bellerophon (Huber et al., 2004). Sequences with 97% similarity were grouped into operational taxonomic units (OTU's) on the genus level using Mothur and NCBI Blast (Altschul et al., 1990; Schloss et al., 2009). OTU's with greater than 3% abundance were selected as dominant phylotypes and are listed at the genus level in Figs. 1–4. All detected OTU's with greater than 97% similarity to a cultured phylotype are displayed in Supplementary Figs. S3–S6. All sequences were entered into the NCBI Blast database and are assigned accession numbers KM656885–KM657021. In addition, sample OTU's were clustered in the vegan package of R utilizing the Canberra equation (Lance and Williams, 1967; Team, 2008). Sequences were clustered utilizing the weighted UniFrac equation in Mothur with an outlier of Methanococcus. A community tree was constructed in Mothur with the Yue and Clayton theta diversity measure and displayed utilizing TreeViewX. Clustered sequences were then plotted on a weighted UniFrac plot (Lozupone et al., 2011).
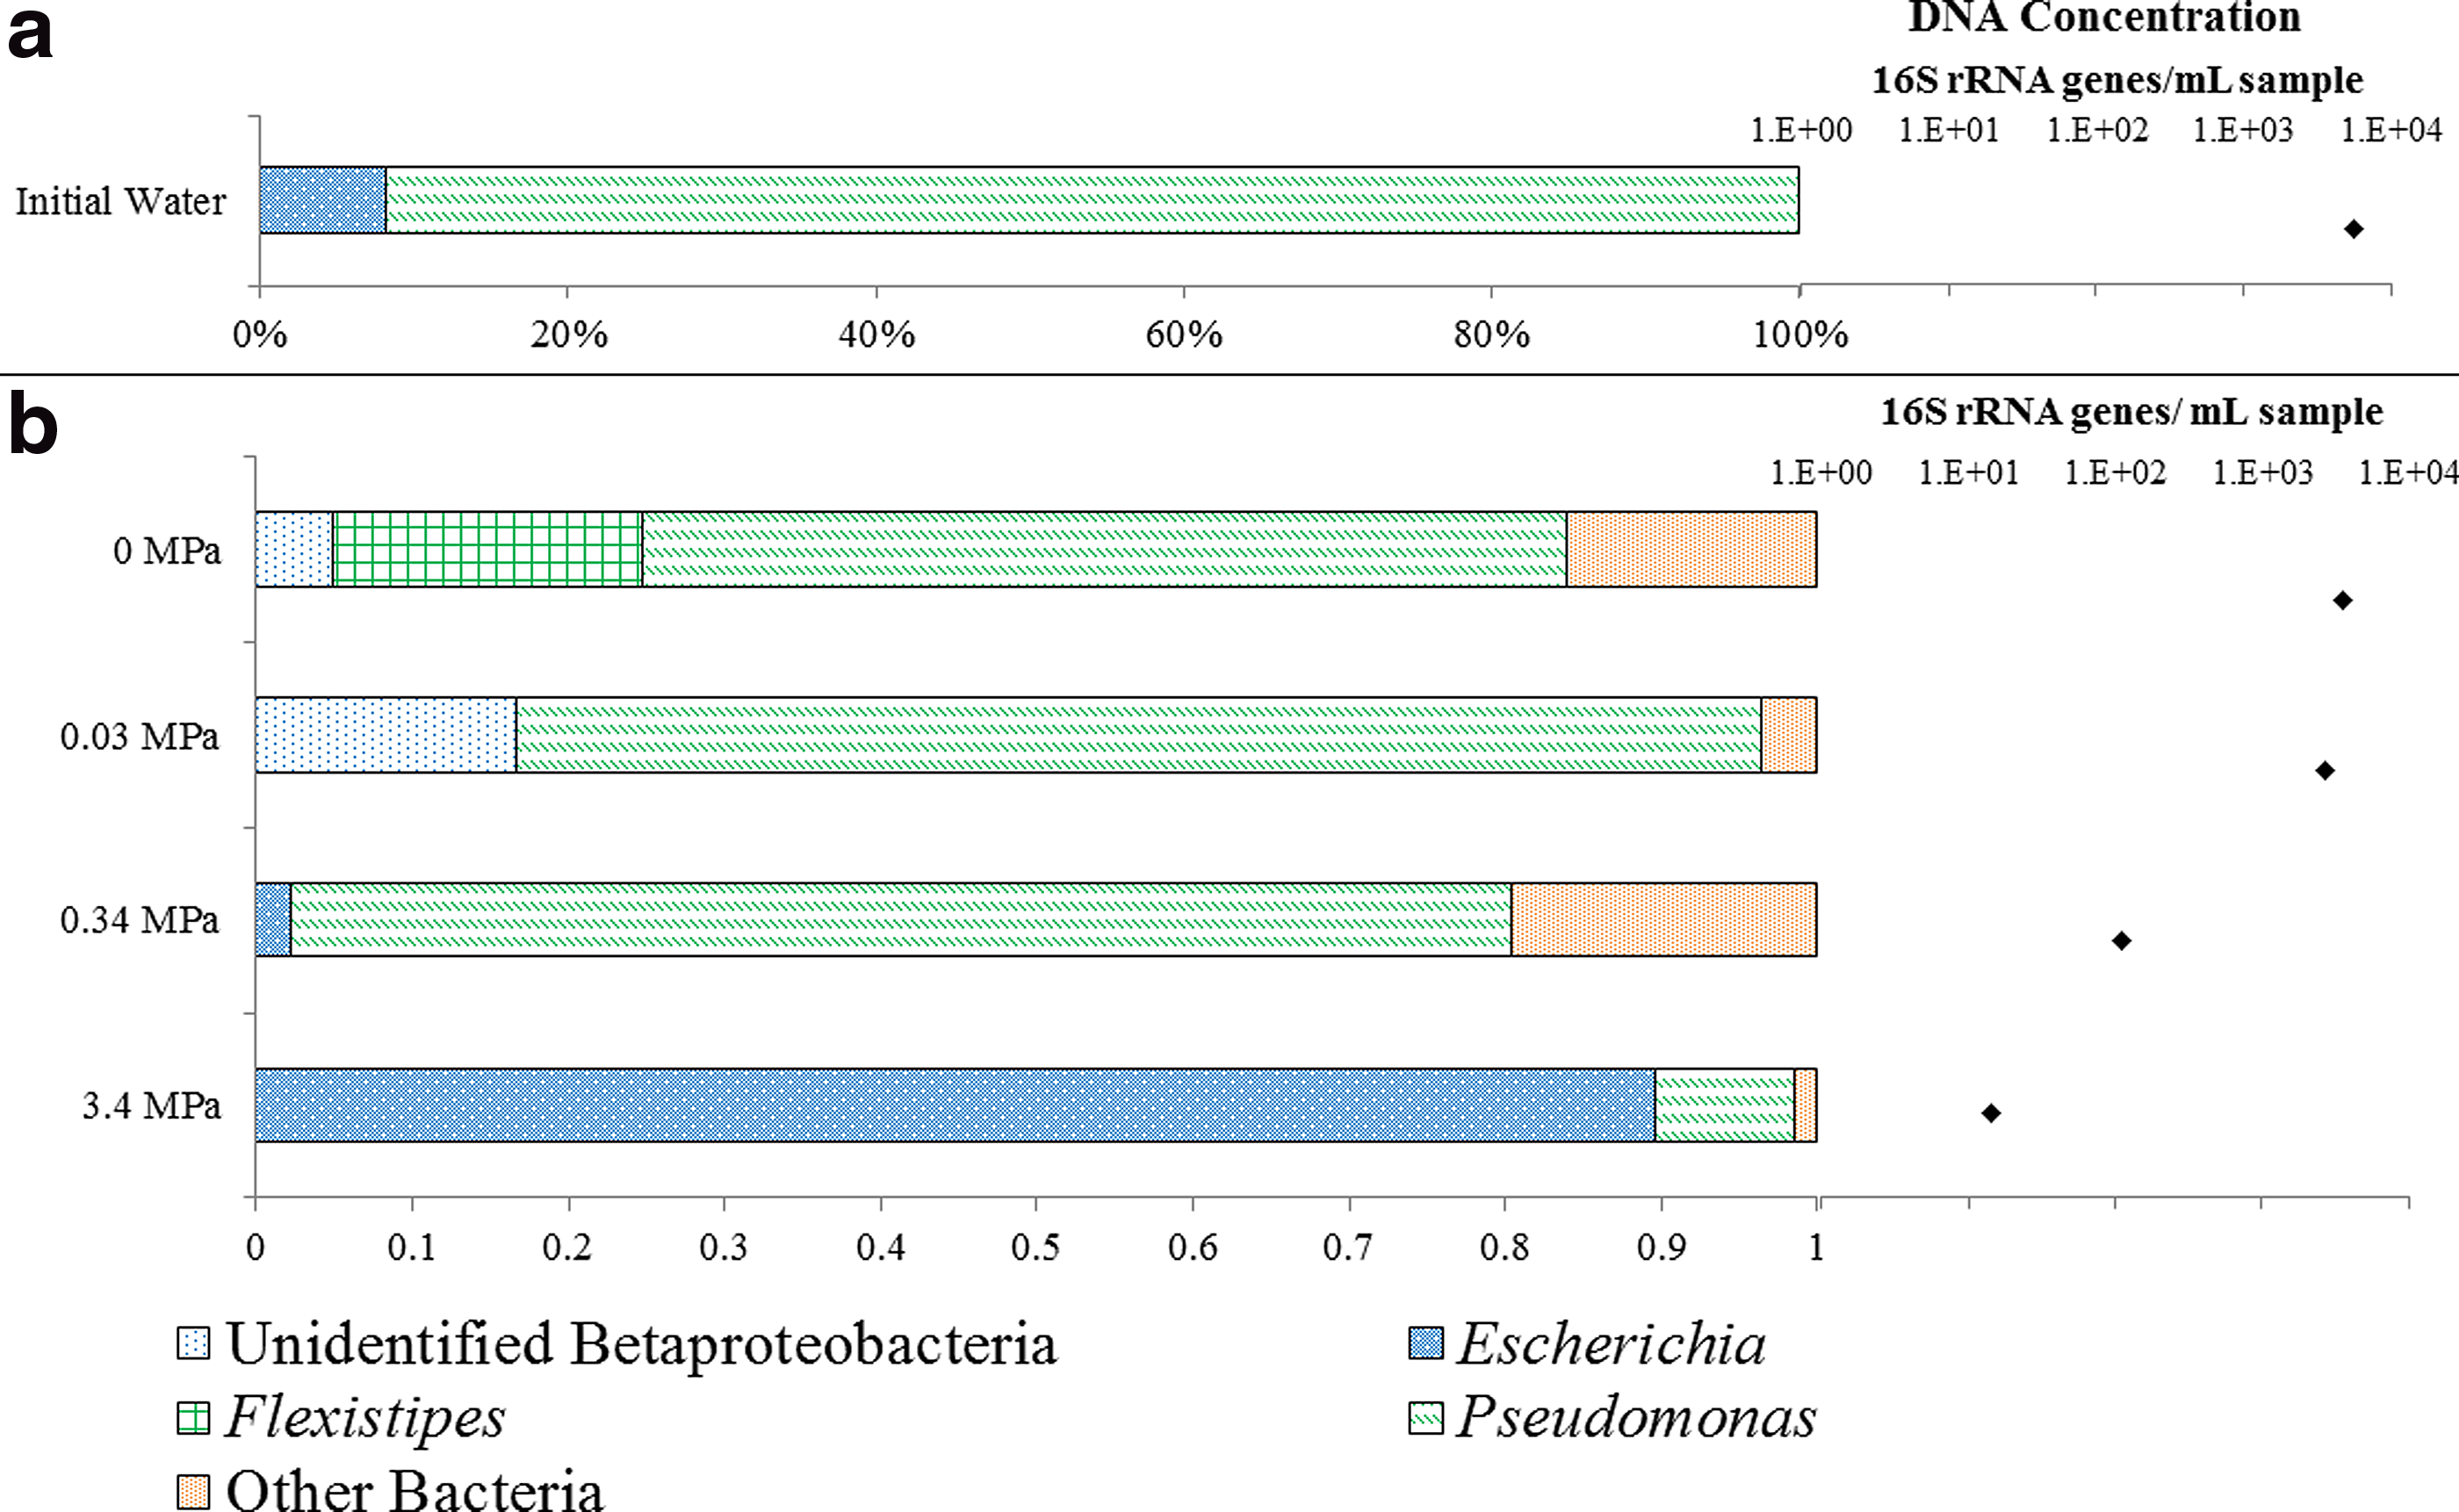
Relative proportions of dominant phylotypes (>3% relative abundance) recovered from reactors exposing unfiltered Mirando produced fluid samples to increasing pCO2 as revealed by 16S rRNA gene clone libraries and qPCR for

Relative proportions of dominant phylotypes (>3% relative abundance) recovered from reactors exposing unfiltered Mirando produced fluid samples to increasing pCO2 as revealed by 16S rRNA gene clone libraries and qPCR for 56-day exposures to 0.34 MPa pCO2 or 0.34 MPa pCO2 with CaCO3 buffer. Clones were assigned a genera based on >97% similarity to cultured organisms. Clones with <3% relative abundance were characterized as “other.” All detected phylotypes with 97% similarity to a cultured organism are displayed in Supplementary Fig. S2.
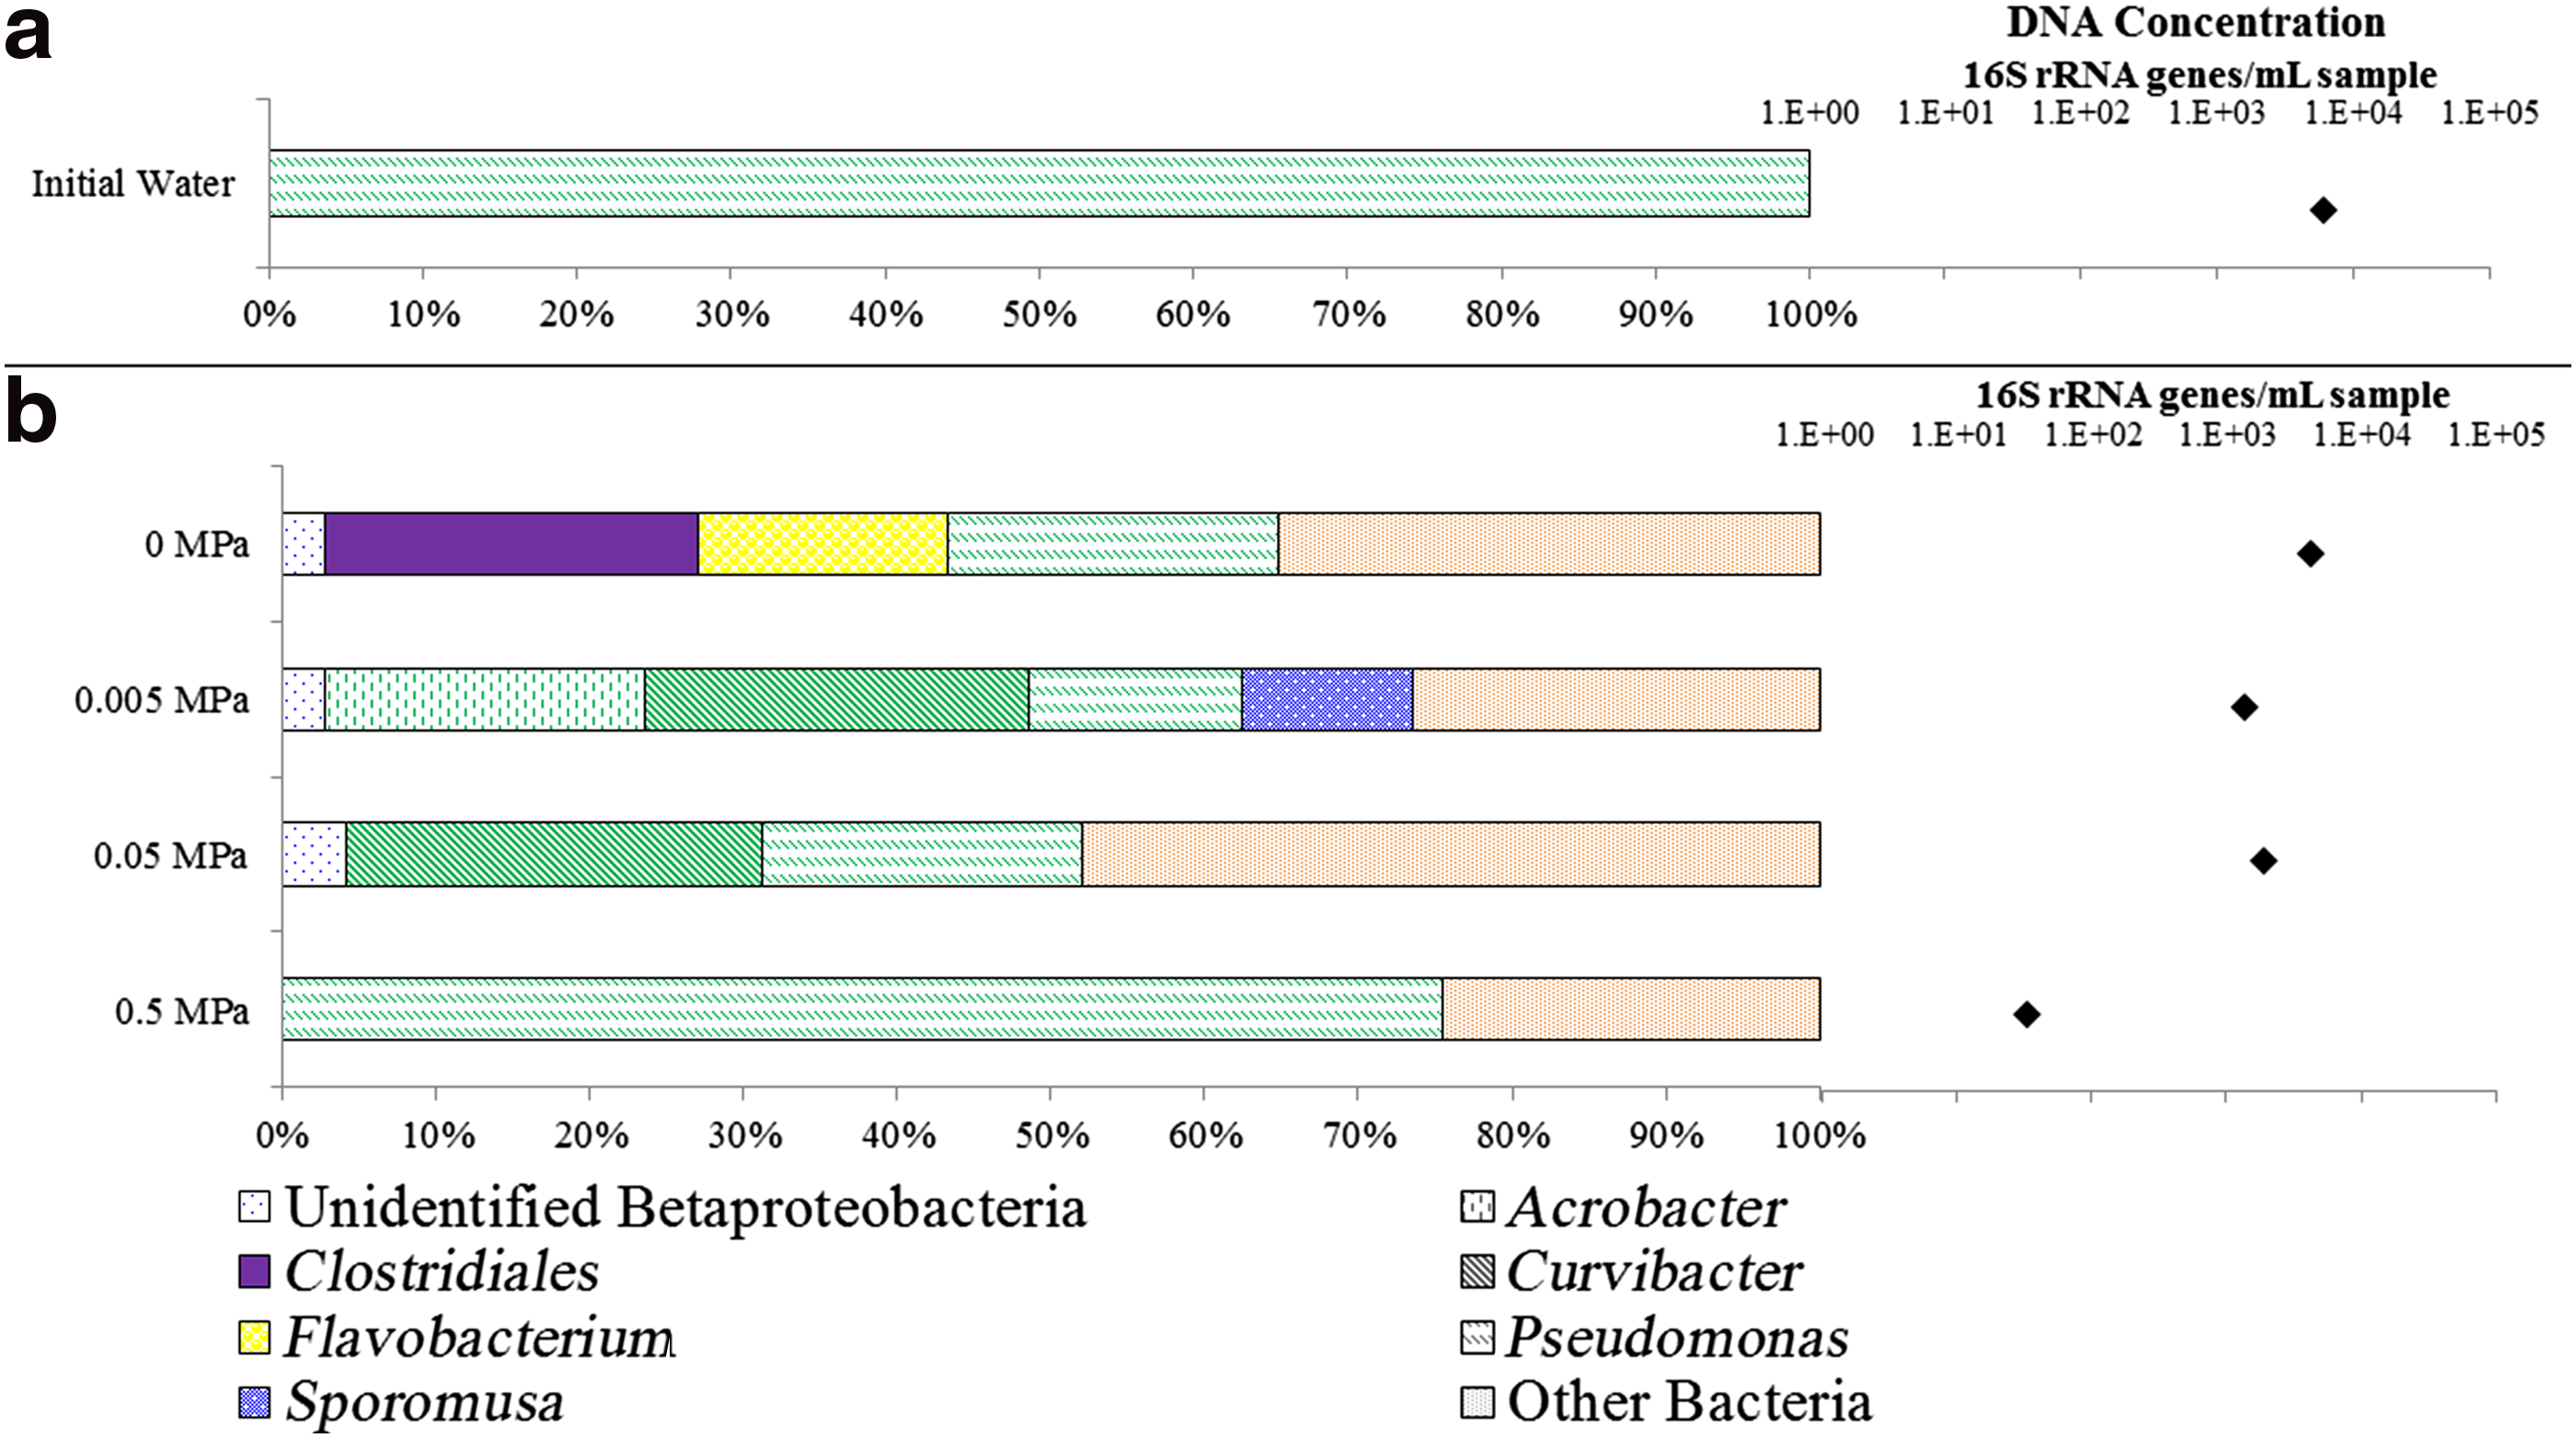
Relative proportions of dominant phylotypes (>3% relative abundance) recovered from reactors exposing unfiltered Plant Daniel freshwater aquifer samples to increasing pCO2 as revealed by 16S rRNA gene clone libraries and qPCR for

Relative proportions of dominant phylotypes (>3% relative abundance) recovered from reactors exposing unfiltered Plant Daniel freshwater samples to increasing pCO2 as revealed by 16S rRNA gene clone libraries and qPCR for 56-day exposures to 0.05 MPa pCO2 or 0.05 MPa pCO2 with CaCO3 buffer. Clones with <3% relative abundance were characterized as “other.” All detected phylotypes with 97% similarity to a cultured organism are displayed in Supplementary Fig. S1.
Microbial diversity represented in each clone library was determined by grouping clones into phylotypes based on 16S rRNA gene similarity of >97%. Equitability was calculated at the species-level phylotypes for each sample using the equation J = H/Hmax, where Hmax is the maximum Shannon–Weaver index and H is the sample Shannon–Weaver index. Shannon–Weaver indices were calculated using the equation −Σ[(ni/N) ln (ni/N)], where N is the total number of phylotypes and ni is the number of “i” phylotypes (Holmes et al., 2004).
The total bacterial abundance was estimated using quantitative real-time PCR described in Gulliver et al., 2014. qPCR methods may detect both viable and nonviable DNA. However, nonviable DNA is likely degraded under temperature and pressure over the incubation time of 56 days (Lindahl, 1993; Nguyen-Hieu et al., 2012). The qPCR method was assumed to correlate with biomass (Suzuki et al., 2000). Briefly, qPCR determined the bacteria 16S rRNA gene concentration utilizing the 1369F primer with the 1492R primer and the TAMRA 6 FAM 1389F probe. Diluted samples of known concentrations of E. coli were used as standards, and DNA concentrations were amplified utilizing qPCR thermocycler methods with 40 cycles.
Chemical analyses
All chemical analyses were performed in triplicate with undiluted supernatant samples filtered through a 0.2 μm filter. Selected cations were measured using ICP-OES (PerkinElmer Optima 7300 DV) under EPA method 6010C. Anions were analyzed using a Dionex Ion Chromatograph under EPA method 300.1 with Fisher Scientific multicomponent mix as a standard. Samples were acidified to pH = 2 with H2SO4, and total organic carbon was measured using 1010 Total Organic Carbon Analyzer with Potassium Hydrogen Phthalate (KHP) as a standard. Alkalinity was measured by titration of 30 mL volumes with sulfuric acid to a pH of 4.5. Values of the average of triplicates for all chemical analyses can be found in the Supplementary Data and Supplementary Tables S2 and S3.
Water chemistry model
Since pH could not be directly measured in the pressurized reactors, it was estimated using Geochemist Workbench. The initial system was defined using the measured alkalinity and pH of the initial sample. Cation concentrations above 10−2 M (from the ICP-OES data) were used to define the initial system with chloride as a counter ion to ensure electroneutrality. Conversion of pCO2 to moles of CO2 reacted in each system was calculated from the real gas law using the pCO2, the remaining 800 mL vessel volume, and site temperature. The gas compressibility factor was assumed to be 1 for all reactors, except the 100% pCO2 Mirando vessel. This vessel was calculated to have a CO2 compressibility factor of 0.83 using a reduced pressure-reduced temperature chart (Standing and Katz, 1941).
The geochemistry of the samples was compared using a distance matrix calculated in R with the vegan package utilizing the Canberra equation (Lance and Williams, 1967; Team, 2008). Parameters used to calculate the site condition distance matrix were site temperature, total pressure, alkalinity, pH, and concentrations of selected elements (Ca, Fe, K, Mg, Mn, Na, P, Cl, SO4, Br). An additional distance matrix was created for the OTU's of each sample also utilizing the Canberra equation. The site condition distance matrix and the OTU distance matrix were then compared in R with the vegan package with the Mantel equation (Legendre and Legendre, 2012) to calculate a correlation coefficient. The Mantel equation was also used to compare the UniFrac distance matrix with the site condition distance matrix, but this correlation coefficient was not found to be significant (>0.1).
Results and Discussion
Mirando oil reservoir
The effect of CO2 on microbial communities in a depleted oil reservoir was investigated utilizing fluid samples from the Mirando Oil Reservoir, TX. Samples were placed in batch reactors with pCO2 exposures of 0, 0.03, 0.34, and 3.4 MPa at reservoir total pressure (3.4 MPa) and temperature (40°C). This represented 0%, 1%, 10%, and 100% of the total pressure, respectively, where 100% pCO2 of the total pressure simulated conditions expected closest to the plume, 10% and 1% pCO2 simulated conditions at a distance where CO2 is attenuated, and 0% pCO2 simulated conditions before CO2 injection. The microbial community was analyzed with qPCR and 16S rRNA gene clone libraries after 56 days.
Exposure to CO2 appeared to have an adverse effect on the overall population numbers of the microbial community in produced fluid from the depleted oil reservoir (Fig. 1). While the DNA concentration in the 0 MPa pCO2 reactor and the 0.03 MPa pCO2 reactor remained around 104 gene copies/mL sample, the concentration decreased to 102 gene copies/mL sample in the 0.34 MPa pCO2 reactor and 101 gene copies/mL sample in the 3.4 MPa pCO2 reactor. This decrease in 16S rRNA gene concentration (presumed to correlate to biomass) is consistent with previous reports that CO2 exposure causes a decrease in microbial population numbers (Dillow et al., 1999; Zhang et al., 2006; Gulliver et al., 2014). These results imply that in areas distant from the CO2 front, where CO2 concentrations are lower, microbial populations may remain viable and drive biogeochemical reactions in the formation. This importance of the microbial impact on the formation at low CO2 exposures has previously been suggested by in situ studies (Gulliver et al., 2014; O'Mullan et al., 2015).
Sequences most similar to the genus, Pseudomonas, were recovered in all of the samples and were most abundant in vessels with pCO2 <0.34 MPa (Fig. 1). A significant percentage (69–97%) of the Pseudomonas genus was closely related to Pseudomonas stutzeri, a species known to inhabit a variety of environments, including soil, wastewater, and marine environments (Lalucat et al., 2006). The broad distribution of P. stutzeri and similar phylotypes may be due to the versatility of its metabolism for adaptation to a variety of electron donors, electron acceptors, and carbon sources (Lalucat et al., 2006).
While Pseudomonas appeared to be dominant in the 0, 0.03, and 0.34 MPa reactors, it only represented 9% at 3.4 MPa (Fig. 1). Previous studies with P. stutzeri revealed it to be incapable of surviving pH <4.5 (Lalucat et al., 2006). The pH of the fluid in the reactor with 3.4 MPa of CO2 (100% pCO2) was modeled to have a pH of 4.3 (Supplementary Table S1). It is plausible that the low pH inhibited this population of bacteria with a high degree of similarity to P. stutzeri.
At the highest pCO2 exposure (3.4 MPa), a majority of sequences recovered were most similar to Escherichia (Fig. 1). The phylum was most closely related to E. coli and is known to be CO2 tolerant (Molin, 1983). Escherichia is often used as an indicator of wastewater contamination in natural systems. When introduced to natural systems, it adapts and may become a significant part of the impacted microbial community (Ishii and Sadowsky, 2008). Recovery of sequences most similar to E. coli may be due to an introduction of the species during drilling or stimulation of the production wells, in which surface water, wastewater, or seawater may be used for drilling muds and water flooding (National Petroleum Council, 2011). While Escherichia appeared to be the most resilient to CO2 exposures of 3.4 MPa or greater, the DNA concentration was only 101 gene copies/mL sample in this reactor. This suggests bacteria similar to Escherichia are surviving, rather than thriving in this environment. Whether members of Escherichia would continue to survive with longer exposure times remains unclear.
To determine whether pH buffering lessened the impact of CO2 on the microbial community, an additional reactor with Mirando sample and 10 mg/L CaCO3 was pressurized with 0.34 MPa pCO2 at reservoir temperature (40°C) and total pressure (3.4 MPa). The CaCO3 addition to the vessel resulted in a final pH of 5.8 compared to a pH of 5.3 for the 0.34 MPa pCO2 unbuffered reactor.
DNA concentrations in the 0.34 pCO2 buffered reactor were increased by an order of magnitude over that of the 0.34 pCO2 unbuffered reactor (Fig. 2). These observations demonstrate pH to be an important driver for microbial community changes, and buffering in the formation may reduce CO2-driven stress on the microbial community. That said, the DNA concentration of the buffered reactor was nearly an order of magnitude less than in the 0 MPa reactor, suggesting that even the buffered CO2 exposure stresses the community. Moreover, the large effect on recoverable DNA for a decrease of 0.5 pH unit suggests that the microbial communities are sensitive to pH changes over even a narrow range, a finding also observed with soil microbial communities; (Fernandez-Calvino and Baath, 2010) a change in pH of at least this magnitude is expected to occur with CO2 injection (Kazuba et al., 2003; Kharaka et al., 2009; Smyth et al., 2009). Therefore, CO2 injection may lead to a decrease in microbial population even with buffering from accessory clays.
While Pseudomonas remained a dominant genus, representing 16% of the detected microbial community, the buffered reactor sample had an increase in relative abundance of organisms within the Sporomusa genus (26%), and an uncultivated member of Betaproteobacteria (24%). The phylotype of Sporomusa was most closely (98%) related to the species Sporomusa malonica, a homoacetogenic organism identified in anoxic freshwater sediments (Moller et al., 1984). The uncultivated member of Betaproteobacteria was most closely related (99%) to an uncharacterized phylotype isolated from wild rice (unpublished, AY235688).
The Mirando oil reservoir pressure vessel experiment is an initial characterization of a microbial community response that may be expected to occur in an oil reservoir after CO2 exposure. The increasing CO2 exposure was found to decrease DNA concentration, and the microbial community appeared to be sensitive to a reduced pH within the range of 5.3 and 5.8. Results suggest Pseudomonas growth in the 0.03 MPa pCO2 reactor and Pseudomonas and Escherichia survival in the 0.34 MPa pCO2 and 3.4 MPa pCO2 reactors.
Plant Daniel freshwater aquifer
The effect of CO2 on microbial communities in a freshwater aquifer was investigated utilizing samples from the Plant Daniel freshwater aquifer. Samples were placed in batch reactors with pCO2 exposures of 0, 0.005, 0.05, and 0.5 MPa at reservoir total pressure (0.5 MPa) and temperature (25°C). This represented 0%, 1%, 10%, and 100% of the total pressure, respectively, where 100% pCO2 of the total pressure simulated conditions expected closest to the plume, 10% and 1% pCO2 simulated conditions at a distance where CO2 is attenuated, and 0% pCO2 simulated conditions before CO2 injection. The microbial community was analyzed with qPCR and 16S rRNA gene clone libraries after 56 days.
The 16S rRNA gene copy concentration following CO2 exposure varied within an order of magnitude between 103 and 104 gene copies/mL with 0, 0.005, and 0.05 MPa pCO2 (Fig. 3). However, the vessel at the highest CO2 concentration (0.5 MPa) had the lowest recoverable DNA concentration of only 101 gene copies/mL sample. The low DNA concentration in this vessel indicates a lethal stress of the highest CO2 concentration to the microbial community in the aquifer water. This finding is in agreement with the Mirando oil reservoir results (Fig. 1) and with the Arbuckle saline aquifer results (Gulliver et al., 2014). Previous studies also demonstrated that increasing CO2 concentrations from 0.08 to 0.1 MPa decreased the growth rate in pure cultures of common freshwater bacteria, including Pseudomonas putida, Bacillus subtilis, Desulfovibrio vulgaris, and Thauera aromatica (Schulz et al., 2012). In another study, D. vulgaris respiration stopped at CO2 exposures as low as 1 MPa (Wilkins et al., 2014). However, the 16S rRNA gene copy concentration of the aquifer samples did not appear to be impacted at lower pCO2 exposures (Fig. 3), suggesting that only the community nearest to the source of the leakage may be lethally affected by the CO2. Below 0.05 MPa pCO2, the response of a mixed microbial community to CO2 exposure may lead to an emergence of CO2-resilient microorganisms.
In all vessel samples, Pseudomonas appeared to be a dominant genus in the microbial community (Fig. 3). The most common phylotype identified in the samples among pseudomonads was the ubiquitous soil species, Pseudomonas fluorescens (0–30%) and Pseudomonas IK-S1 (25–35%) (Hamamura et al., 2013).
While pseudomonads have been recovered from a wide variety of environments (Peix et al., 2009), one study revealed that P. fluorescens growth was inhibited with 0.02 MPa pCO2 exposure (Gill and Tan, 1979). Our study examined a mixed microbial community in freshwater subsurface samples, which had a high relative abundance of Pseudomonas phylotypes, suggesting survival in environments up to 0.05 MPa pCO2 exposure. The reason for the tolerance of Pseudomonas to CO2 exposure is unclear. However, the ubiquity of Pseudomonas has been suggested to arise from its resilient to a variety of environmental stress, including some heavy metals and antibiotics (Allen et al., 1977).
The dominance of Pseudomonas in the 0.5 MPa vessel after 56 days suggests that this genus is relatively resilient to stress caused by CO2 exposure. However, this reactor had the lowest detectable DNA concentration of 101 gene copies/mL sample, suggesting Pseudomonas is not thriving in this CO2-exposed system.
In addition to Pseudomonas, sequences that were most similar to the Curvibacter genus also emerged in the 0.05 and 0.005 MPa pCO2 vessels, representing 25–27% of the community. The spore-forming soil bacteria, Clostridiales (Paredes-Sabja et al., 2011), and the common chemoorganotrophic freshwater bacteria, Flavobacterium (Bernardet et al., 2002), appeared to decrease in relative abundance with CO2 exposure, suggesting these genera may have not been adaptable to the CO2 exposure or pH reduction.
The Curvibacter phylotypes were most similar to Curvibacter delicatus, a well water isolate that remains poorly characterized (Ding and Yokota, 2004). The increase in abundance of C. delicatus is in agreement with a previous study with Plant Daniel freshwater samples after in situ CO2 exposure. In this study (Gulliver et al., 2014), microbial diversity decreased with increasing CO2 concentration and organisms with high sequence similarity to C. delicatus emerged as the dominant phylotype, representing 74% of the relative abundance with 1.53 g CO2/L in situ exposure. The emergence of Curvibacter may be due to its adaptability to environmental stress, as members of this phylotype are known to be resilient against a variety of environmental stress, including heavy metal exposure (Dekker et al., 2014), UV radiation (Ordonez et al., 2009), and antibiotics (Falcone-Dias et al., 2012). The lowest CO2 concentration vessel of 0.005 MPa additionally was enriched in Arcobacter, a common microorganism found in drinking water (Shah et al., 2012), and, to a lesser extent, Sporomusa, a fermentative microorganism capable of CO2 conversion to acetate (Moller et al., 1984). These results suggest a greater variety of genera will be adaptable at lower CO2 concentrations expected further downgradient from the CO2 leakage source.
Previous work at the Plant Daniel site revealed buffering due to the dissolution of accessory clays (Trautz et al., 2013), which may result in a higher pH than that in the unbuffered pressure vessels (Supplementary Table S2). To determine the effect of buffering, an additional reactor with fluid sample and 10 g/L of CaCO3 were pressurized with 0.05 MPa of pCO2 under aquifer pressure (0.5 MPa) and temperature (25°C) for 56 days. The CaCO3 addition to the vessel resulted in a final pH of 6.8 compared to a pH of 6.4 for the 0.05 MPa pCO2 unbuffered reactor.
The buffered reactor had an order of magnitude higher DNA concentration compared to the unbuffered reactor following CO2 exposure (Fig. 4). This suggests that buffering may prevent the microbial population numbers from decreasing to the extent observed in the 0.5 MPa CO2 56-day vessel. The dominant species found in the buffered reactors was most similar (93%) to an uncultivated member of Betaproteobacteria that was identified in Mirando reactor (Fig. 2). As the calcite was sterilized before use and no DNA was detected in the sterilized buffer, the introduction of this phylotype in the buffer was unlikely. The addition of CaCO3 may have provided a favorable condition for the emergence of this species. Although the reasons for this are unclear, previous reports suggest that biological calcium metabolism may play a role in calcium-saturated solutions (Hammes and Verstraete, 2002), and other studies suggest calcium may stabilize cell-to-cell aggregation (Fitzgerald et al., 2012). The suggested impact of dissolved calcium on the microbial community further suggests that rock–water interactions will play a large role in selecting for microorganisms post-CO2 injection. Further examination on the effect of CO2-driven rock–water interactions on microbial structure is warranted.
The Plant Daniel pressure vessel experiment characterizes the microbial community response that may occur in a CO2 leakage scenario. DNA concentrations remained within 103–104 gene copies/mL sample at pCO2 below 0.05 MPa. Only at the pCO2 of 0.5 MPa was the DNA concentration reduced to 101 gene copies/mL sample, suggesting a reduced microbial community near the CO2 leakage source might play a limited role on the behavior of the impacted aquifer over the relatively short timeframe examined in this study.
Multiple site comparison
Results from the Mirando oil reservoir and the Plant Daniel freshwater aquifer suggested that increasing CO2 exposure concentration will lead to selected microbial communities and decreased population sizes. An open question remains whether similar trends may be observed among different CO2 storage sites and what, if any, drivers for these changes may be identified. To determine if any trends may be observed in the microbial community changes due to CO2 exposure, results from vessel experiments described here, as well as results from a vessel experiment with saline storage sites samples (Gulliver et al., 2014), were compared. The changes in gene copies were plotted against both pCO2 exposure and pH. Microbial communities of each vessel were compared with a UniFrac distance matrix.
While detected gene copies/mL sample decreased with increasing pCO2 across all three sites (Supplementary Fig. S7), a clearer trend emerged with a decrease in 16S rRNA gene concentration with decreasing pH (Fig. 5). The greatest effects were observed below a pH of about 5.5 for all sites. This suggests the decrease in DNA concentration was primarily due to the CO2-driven pH decrease in these three fluids.

DNA concentration of Plant Daniel freshwater aquifer, Mirando depleted oil reservoir, and Arbuckle saline aquifer (Gulliver et al., 2014) measured by qPCR for modeled pH. Black data represent samples in presence of 0.05 and 0.34 MPa pCO2 and 10 g/L CaCO3. The gray datum represents a sample examined to understand the effect of pH by adjusting the pH to 4.4 (initial) and 5.1 (final) with HCl in the absence of CO2 exposure.
It is noteworthy that the Plant Daniel vessel with buffer increases 16S rRNA gene copy concentration by two orders of magnitude compared to unbuffered reactors. In this case, it appears the CaCO3 buffer enabled survival within the Plant Daniel microbial community. This result might have been due to an emergence of a microbial community that benefitted from the addition of CaCO3. Regardless, the results across all three sites suggest a buffered aquifer or reservoir will reduce the largely pH-driven effects of CO2 exposure on the microbial community.
The observation that microbial population is dependent on the system pH contrasts previous findings that CO2 exposure is more lethal to microorganisms than a pH reduction alone (Zhang et al., 2006; Wu et al., 2010). Wu et al. (2010) found that 1 h of exposure to 150 psi (1.03 MPa) CO2 resulted in extracellular protein release by Shewanella oneidensis, whereas cultures exposed to only a lowered pH did not. Wu et al. report that aqueous CO2 is the toxic parameter affecting microorganisms while our results suggest that the reduced pH is primarily responsible for the observed decrease in gene copies/mL sample. The difference may be that a pure culture of S. oneidensis, utilized in the study by Wu et al., may have been sensitive to dissolved CO2 exposure and tolerant of pH reduction. In this study, both the buffered reactor experiments and the apparent trend in Fig. 3 suggest the overall mixed community (without a detectable population of Shewanella) was found to be sensitive to pH below pH = 5.5. This suggests that buffering may enable greater survival of bacteria in the community, despite a CO2-driven pH reduction.
Microbial community changes for all sites and samples are presented visually in the UniFrac plot created with a principle component analysis based on pairwise sample comparisons of DNA sequences principal coordinate 1 (PC1) and principal coordinate 2 (PC2) are used as the x and y axis, respectively (Fig. 6). The UniFrac plot reveals a distributed variance among the samples; PC1 describes 12.5% of the variance and PC2 describes 10.5% of the variance, with 11 principles coordinates (PCs) describing over 80% of the variance. Despite this distributed variance, the UniFrac plot also reveals that sequences are generally more closely related to other sequences from the same site as opposed to clustering with pH or with pCO2 exposure. A community tree similarly displays the DNA sequences correlate by site, with three sample outliers of Mirando 100% pCO2, Plant Daniel 0% pCO2, and Arbuckle Initial Water (Supplementary Fig. S8).
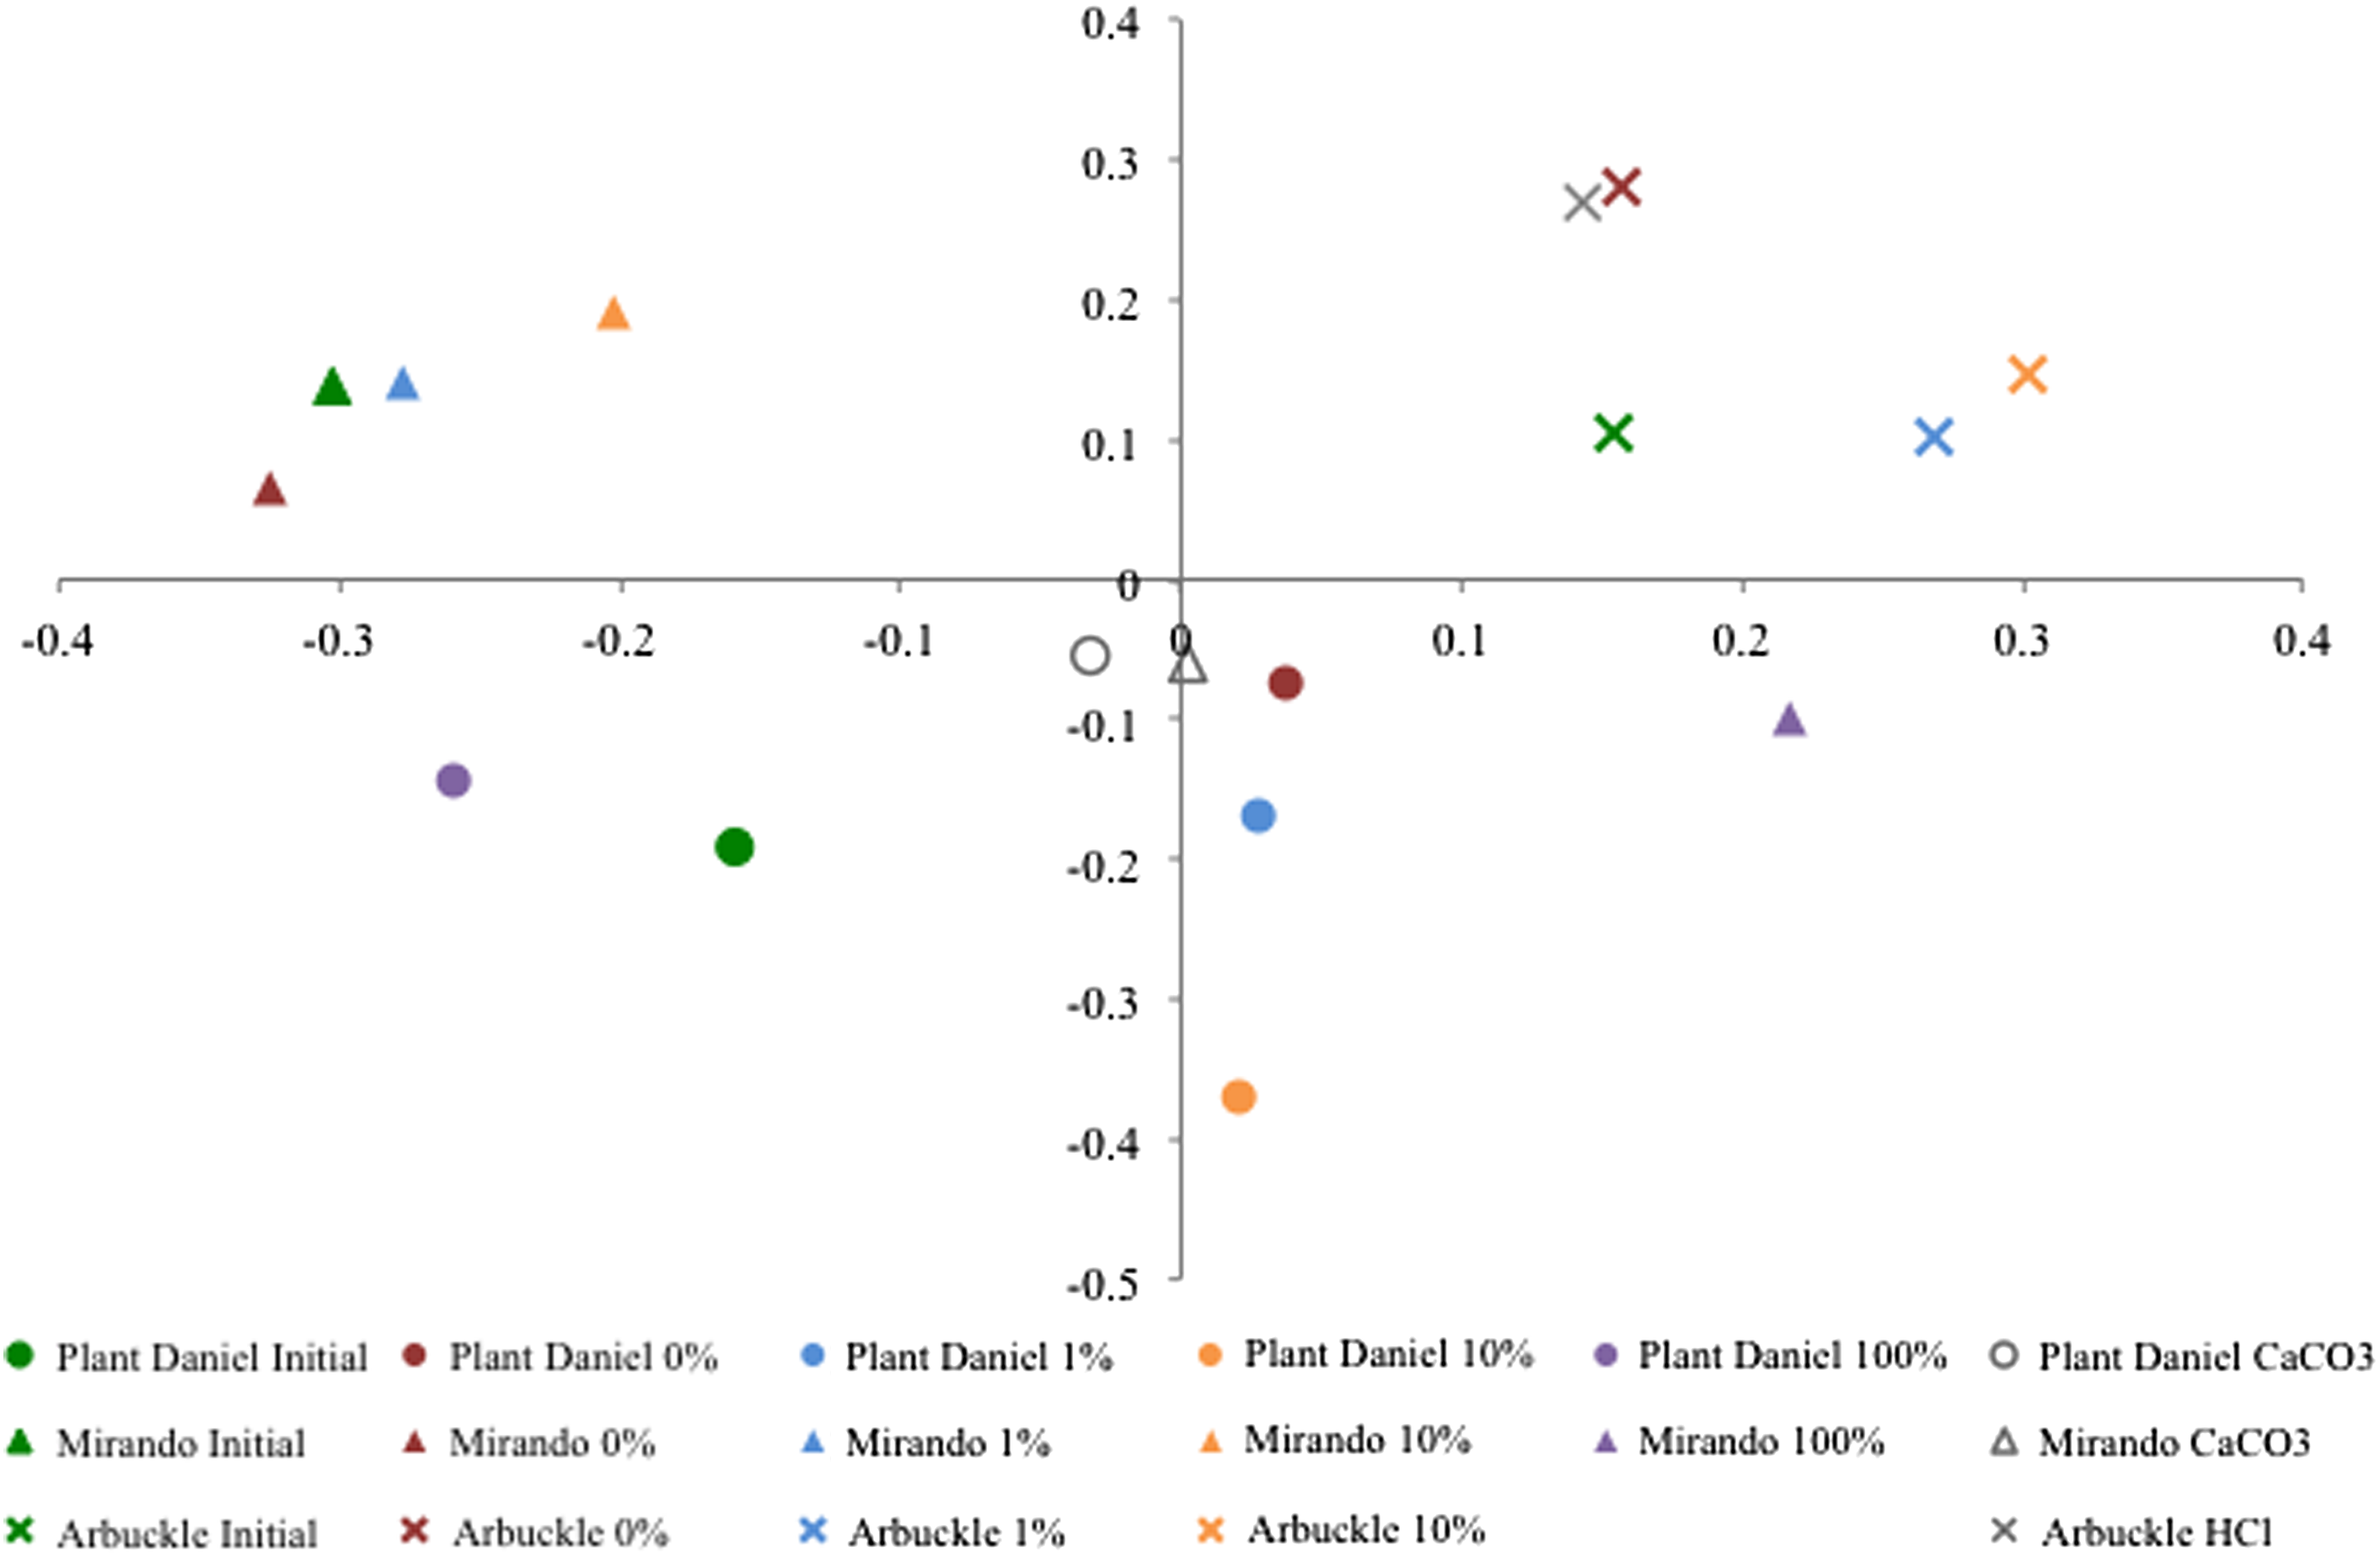
UniFrac plot of sequences recovered from vessel experiments with Plant Daniel freshwater aquifer sample, Mirando oil reservoir sample, and Arbuckle saline aquifer sample. Detectable DNA was not recovered from the Arbuckle 100% sample.
While most of the sequences clustered by site, the Mirando 100% pCO2 vessel was an outlier from the remaining Mirando sequences. Reasons for this behavior are not clear. However, the Mirando 100% pCO2 sample contained a very low amount of biomass (101 gene copies/mL sample), and the community in these conditions was merely surviving rather than thriving.
Similar to the site clustering illustrated in the UniFrac plot and community tree of DNA sequences (Fig. 6 and Supplementary Fig. S8), the site clustering was illustrated in a dendogram of subsurface conditions, where pH, total pressure, temperature, and dissolved ions were considered (Supplementary Fig. S9). Although both the DNA sequences (Fig. 6) and the subsurface conditions (Supplementary Fig. S9) appear to cluster by site, comparison of the distance matrix calculated by OTU and distance matrix calculated for subsurface conditions results in a slightly positive correlation coefficient of only 0.55. The correlation coefficient between the UniFrac distance matrix and the subsurface conditions was even lower, with a value <0.1. While the correlation coefficient of 0.55 suggests that the subsurface conditions may exert some influence on the changes in the microbial community, the relatively low correlation may be due to the influence of initial microbial communities among the sites.
Other carbon storage sites (or associated impacted aquifers) will likely have different initial microbial communities. For example, Lavalleur et al. characterized the initial microbial community with water samples from Columbia River Basalt, a potential GCS unit (Lavalleur and Colwell, 2013). In this study, the dominant genera that were detected included Hydrogenophaga, Geoalkalibacter, Thiovirga, Methylotenera, Methylomonas, and Methermicoccus. The dominant genera detected by Lavalleur et al. were not similar to the dominant genera detected in any of the initial microbial communities from the Arbuckle aquifer (Gulliver et al., 2014), the Mirando oil field (this study), or the EPRI freshwater samples (this study) (Gulliver et al., 2014). The varying initial microbial communities likely contributed to an emergence of unique postexposure microbial communities at each site.
Previous research by Wandrey et al. (2011) conducted a similar pressure vessel experiment, in which the microbial community from deep saline aquifer sediment samples was exposed to 5.5 MPa pCO2 for 24.5 months at a reservoir temperature of 40°C. In this experiment, the genera Rhizobium and Burkholderia emerged as dominant phylotypes. In another study, Frerich et al. exposed the microbial community from natural gas field fluid samples to 10 MPa CO2 for 30 days at a temperature of 50°C. In this study, spore forming Clostridiales emerged as CO2 tolerant (Frerichs et al., 2014). The results from these studies could not be directly compared to our results on the UniFrac plot, due to different methods utilized (16S rRNA gene clone libraries here versus denaturing gradient gel electrophoresis extraction and terminal restriction fragment length polymorphism in the other studies). However, these genera detected by Wandrey et al. (2011) and Frerichs et al. (2014) did not emerge as predominant phylotypes in this study, despite some similarities in site conditions such as temperature, pressure, and salinity. This further suggests that the emerging microbial community in CO2-exposed environments will be site dependent. Future work is needed to determine whether the expected site dependence may be due to variation of initial microbial community and/or initial geochemical conditions.
This is the first study to report a significant impact of pH on microbial community following simulated exposure to CO2 during GCS. The buffered experiments with the Mirando samples and the Plant Daniel samples revealed that CO2-driven pH reduction and the correlating water chemistry may impact the microbial community structure and the total microbial abundance. In addition, this suggests that the microbial community that emerges post-CO2 injection will largely depend on the secondary effects of CO2 exposure, such as the decreased pH and the resulting water–rock interactions particular to each subsurface site. Future work on the effect of these indirect responses to CO2 exposure is warranted.
While the present study provides insight into how CO2 and the environmental conditions can affect microbial communities from the subsurface, it is pertinent to note that only three sites were compared in this study. This limited number of comparable sites arises from the need for rare and difficult to obtain samples. Samples from additional subsurface sites and published results from similar experiments will allow a more thorough comparative study, further illuminating trends to be expected in microbial communities following CO2 injection or leakage. Due to the limited number of pressure vessels, only a single sample at each pCO2 exposure was analyzed. While the results presented here demonstrate a consistent trend in microbial community structure, there is risk of stochastic interactions, and replicates would have made a more robust experiment.
Summary
This study provides initial insight into the effect of CO2 exposures to microbial communities in oilfield and freshwater environments. Furthermore, it draws first comparisons across multiple CO2-exposed environments relevant to geologic carbon sequestration and enhanced oil recovery. The results reveal that microbial population numbers should be expected to decrease with increasing CO2 exposure. Moreover, findings show that the impact of CO2 on a community may be linked to pH rather than dissolved CO2 concentration. Finally, no single dominant microbial community appeared to emerge with CO2 concentration, suggesting the adapted microbial community that emerges during carbon storage or CO2 leakage will be dependent on other conditions besides CO2 exposure alone. Future work on the CO2-driven secondary effects, such as site-specific rock–water interactions, on the microbial community is warranted. Additional studies at site-relevant temperature and pressure are needed to enhance the understanding of the microbiology and ecology of CO2-impacted subsurface.
Footnotes
Author Disclosure Statement
No competing financial interests exist.
References
Supplementary Material
Please find the following supplemental material available below.
For Open Access articles published under a Creative Commons License, all supplemental material carries the same license as the article it is associated with.
For non-Open Access articles published, all supplemental material carries a non-exclusive license, and permission requests for re-use of supplemental material or any part of supplemental material shall be sent directly to the copyright owner as specified in the copyright notice associated with the article.