
Abstract
Abstract
Although many treatment methods have been employed to remove soluble Fe(II) and Mn(II) from water, for some smaller water treatment plants or under emergent circumstances such as sharp increase of iron and manganese concentrations in source water during summer, traditional physicochemical removal methods are more flexible and effective. In this article, a coupling technique of chlorine dioxide (ClO2) preoxidation and manganese sand filtration for iron and manganese removal from potable water have been proposed. Fe(II) and Mn(II) removal efficiencies of different filter materials (natural manganese sand, quartz sand, and fiber bundle filter (FBF) material) were compared. Influences of ClO2 dosage, liquid flow rate, particle size of filter material, and thickness of filter bed on removal efficiency were also examined. In addition, performance of ClO2 preoxidation–manganese sand filter technique was investigated under the optimum operating conditions to remove Fe(II) and Mn(II). Results indicated that natural manganese sand filter showed higher capability of removing Fe(II) and Mn(II) than quartz sand filter and FBF. It was found that manganese removal efficiencies increased with higher dosage of preoxidant, lower liquid flow rate, smaller sand particle diameter, and thicker filter bed. When initial concentrations of Mn(II) and Fe(II) in feed water were 1.5 and 1.0 mg/L, respectively, ClO2 dosage was 0.99 mg/L, liquid flow rate was 282.6 mL/min, sand particle diameter was 0.6–1.2 mm, and filter bed thickness was 60 cm, the process showed good performance of Fe(II) and Mn(II) removal with both removal rates more than 95%.
Introduction
I
Up to now, many treatment methods have been developed and employed to remove soluble ferrous iron (Fe(II)) and dissolved Mn(II) from water, mainly including chemical oxidation technology (Graveland and Heertjes, 1975; Wong, 1984), biological treatment technology (Vandenabeele et al., 1992; Tekerlekopoulou and Vayenas, 2008; Qin et al., 2009), sand filtration (He et al., 2010; Tiwari et al., 2011), membrane filtration (Kabsch-Korbutowicz and Winnicki, 1996; Molinari et al., 2001; Teng et al., 2001; Lastra et al., 2004), and various combinations of them (Choo et al., 2005; Liu et al., 2009; Lin et al., 2012). Needless to say, each removal technology more or less has its own advantages and disadvantages. During recent years, researchers have focused on the technology of biological treatment and membrane filtration to remove Fe(II) and Mn(II) from potable water due to their high removal efficiency. Nevertheless, for some smaller water treatment plants or under emergent circumstances such as sharp increase of iron and manganese concentrations in source water during summer, the traditional physicochemical removal methods are more flexible and effective.
Iron can be oxidized at low redox conditions (<200 mV), while manganese needs higher redox conditions (>400 mV) for neutral pH (Mouchet, 1992). Thus, abiotic homogenous manganese oxidation by oxygen is very slow at pH values below 9, not to mention in most drinking waters (pH 6–8) (Stumm and Morgan, 1996; Katsoyiannis and Zouboulis, 2004). The conventional oxidants used for iron and manganese oxidation in water treatment are chlorine, chlorine dioxide (ClO2), hypochlorite, ozone, or potassium permanganate. ClO2 is used mainly as preoxidant and disinfectant in water treatment (Long et al., 1999). He et al. (2009) reported that ClO2 and KMnO4 both showed effective Mn(II) removal capabilities, with removal rates more than 96%. Zhang et al. (2003) compared the Mn(II) removal rates of ClO2 and Cl2 under the same weight dosage and found that the former was 40% higher than the latter. Furthermore, the application of manganese removal by ozone is limited due to its complex operational process and high cost. After Fe(II) and Mn(II) are oxidized to their higher oxides, they can be removed by either clarification or sand filtration, or both.
Manganese sand is made of natural manganese ores and widely used as water treatment filter media in China due to its high mechanical strength, active surface property, large specific surface area, and porosity (Wu et al., 2011). However, some scholars pointed out that manganese could not be removed by solely adopting manganese sand filters (He et al., 2009; Qin et al., 2009). Consequently, it is better to use the manganese sand filter in conjunction with preoxidation or other treatment technologies. There are a few published studies concerning the coupling technique of ClO2 preoxidation and manganese sand filtration (He et al., 2009; Li, 2011). However, most of them focused on the removal of high Mn concentrations (>5 mg/L) of groundwater and the application of this coupling technique in potable water or raw water with low Mn concentrations is few. Furthermore, the addition of ClO2 can promote the “Mn sand self-catalytic oxidization” process, which was proposed by Li and Liu (1987), thereby improving Mn and Fe removal rate. Therefore, it is important to study the reasonable operating parameters of the coupling technique on the basis of “Mn sand self-catalytic oxidization” theory to save chemical cost.
Wangjuan Resevoir locates in Jimo, China, which is an important source of freshwater for local urban water supply, agricultural irrigation, and aquaculture. During recent years, the dramatical increase of iron and manganese concentrations in reservoir water during summer brings great challenges for the local water treatment plant. Our multiple investigation results showed that the maximum values of iron and manganese concentrations of the reservoir were 0.75 and 1.28 mg/L, respectively. Through the currently employed treatment process, KMnO4 is used as the preoxidant to oxidize Fe(II) and Mn(II), followed with fibrous bundle media filtration. However, the treatment performance of iron and manganese is unsatisfactory and the effluent concentration of Mn(II) is more than 0.1 mg/L.
Therefore, the aim of this work was to study Fe(II) and Mn(II) removal from potable water using ClO2 preoxidation–manganese sand filter technique and solve the key water quality problem of Wangjuan Reservoir. The Fe(II) and Mn(II) removal efficiencies of different filter materials (natural manganese sand, quartz sand, and fiber bundle filter (FBF) material) were compared. The influences of ClO2 dosage, liquid flow rate, particle size of filter material, and thickness of filter bed on Fe(II) and Mn(II) removal efficiency were also examined. Finally, experiments were conducted to investigate Fe(II) and Mn(II) removal performance of ClO2 preoxidation–manganese sand filter technique under the optimum operating conditions.
Materials and Methods
Reagents and materials
Feed water was a mixture of solutions of iron (in the form of FeSO4·7H2O) and manganese (in the form of MnSO4·H2O) with water from the water supply network and was freshly prepared before use. The pH of the feed water was adjusted with diluted hydrochloric acid (0.1 mol/L) and sodium hydroxide (0.1 mol/L). The stock solution of ClO2 was prepared using diluted H2SO4 and sodium chlorite in the laboratory according to the standard method of APHA (1998). The ClO2 concentration was determined using the 4500-ClO2 DPD method (APHA, 1998).
The filter media used in this study were quartz sand (0.5–1 mm), FBF material (20–50 μm), and natural manganese sand of three different particle size ranges (dsand), 0.5–1, 0.6–1.2, and 1.0–2.0 mm, from Jiade Filter Medium Ltd., Qingdao, China. Tables 1 and 2 present the basic characteristics of these filter materials.
Experimental apparatus and methods
The schematic diagram of the experimental apparatus is shown in Figure 1. The whole system consisted of a preoxidant tank, a feed water tank, a rapid mixer, a sand filter, and a clean water tank. The dosometric pumps and flow meters were also employed. ClO2 was applied as a preoxidant before the mixing stage. The sand filter was made of a plexiglass column (120 cm length × 6 cm i.d.) equipped with a gravel supporting layer (thickness: 10 cm) to support the filter material and avoid its escape from the column. In the column, the thickness of the filter material (H) was 80 cm. There were nine sampling ports along the column for Fe(II) and Mn(II) concentration measurements in the liquid. Feed water was pumped through a 5-mm-diameter rubber hose and introduced at the top of the filter. Aeration was conducted through natural draft and no external mechanical aeration apparatus was used in the filter. The filter backwashing was manually controlled and preceded for 10 min using the filtered water.
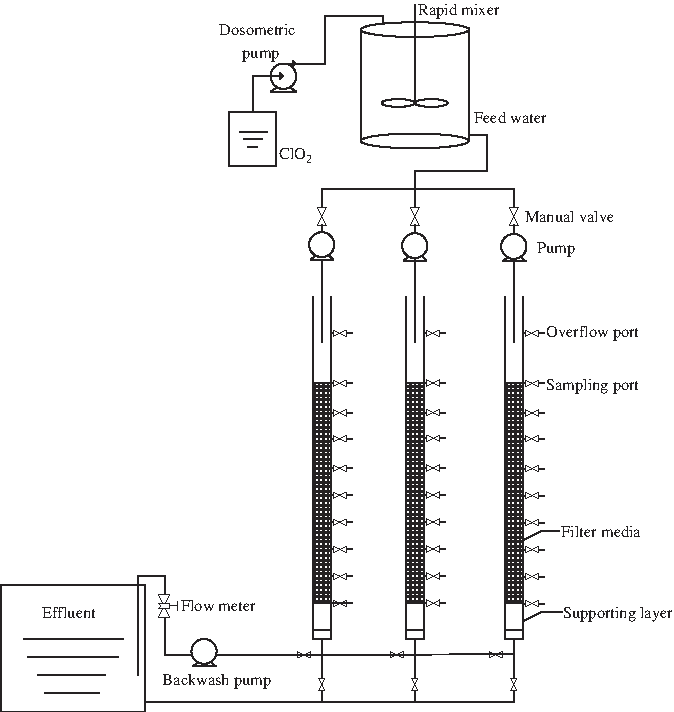
Schematic diagram of experimental apparatus.
The experimental program was conducted as follows:
(1) Phase I aimed at comparing the Fe(II) and Mn(II) removal capabilities of natural manganese sand filter (NMSF), quartz sand filter (QSF), and FBF at raw water pH, using the stoichiometric dose (0.99 mg/L) of the oxidant. The particle size of quartz sand and manganese sand used was both 0.5–1 mm. The mass of manganese sand, quartz sand, and fiber bundle was 3608.24, 3608.24, and 135.65 g, respectively. In combination with the practical situation of the reservoir, the initial concentrations of Mn(II) and Fe(II) in feed water were chosen as 1.5 and 1.0 mg/L, respectively. The liquid flow rate (q) of the filter was 282.6 mL/min. (2) Phase II aimed at verifying the experiment operating conditions, including ClO2 dosage (DO)(0.24, 0.62, 0.99, and 1.74 mg/L), liquid flow rate (188.4, 282.6, 376.8, and 471.0 mL/min), particle size of filter material (0.5–1.0, 0.6–1.2, and 1.0–2.0 mm), and the thickness of filter bed (10, 20, 30, 40, 50, 60, 70, and 80 cm), to determine the optimum operating condition of ClO2 preoxidation–manganese sand filtration technique. The initial concentrations of Mn(II) and Fe(II) in feed water were 1.5 and 1.0 mg/L, respectively. (3) Phase III aimed at investigating the Fe(II) and Mn(II) removal efficiency under the optimum operating condition.
Analytical methods
Feed water and permeate samples were analyzed for key water quality parameters such as iron, manganese, pH, dissolved oxygen (DO), and chlorite. The water samples for Fe(II) concentration determination were acidified to analyze the total residual Fe(II). Then concentrations of Fe(II) and Mn(II) were determined spectrophotometrically with 1,10-phenanthroline and formaldoxime (APHA, 1998), respectively, both with a detection limit of 0.01 mg/L. The values of pH and DO were measured with a portable multiparameter water quality instrument (HACH, HQ40d, USA). The concentrations of chlorite were measured by the spectrophotometric method employing lissamine green with a detection limit of 0.05 mg/L (Hofmann et al., 1998). Flow rate and water temperature were also recorded. The removal rate R(%) was defined as:
where Cin is the concentration of feed water (mg/L), C is the effluent concentration (mg/L).
All experimental data were the averages of triplicate experiments whose relative errors were less than 5%.
Results and Discussion
Removal mechanism of Fe(II) and Mn(II) by ClO2
Fe(II) and Mn(II) can be oxidized by ClO2 to form insoluble precipitate, even at relatively low pH. Then, the insoluble precipitate can be removed through subsequent filtration–separation method. In addition, the value of E0 of ClO2/Cl− is 1.5 V, which is higher compared with O2/H2O (1.2 V) (Heslop and Jone, 1976).
Reaction of ClO2 and Mn(II) is fast and the reaction product, chlorite (ClO2−), can further react with Mn(II). The mechanism stated above can be expressed as (Zhang et al., 2003) follows:
The total reaction equation is
According to Equation (2), the ClO2 demand for oxidation of 1 g of Mn(II) is 2.45 g, in other words, [ClO2]/[Mn2+] = 2.45. According to Equation (4), the relational expression should be [ClO2]/[Mn2+] = 0.5. The reaction stoichiometry for the oxidation of Fe(II) by ClO2 is given in Equations (5)–(7) (Henderson et al., 2001).
Based on Equation (7), only 0.24 g of ClO2 is needed to oxidize 1 g of Fe2+, in other words, [ClO2]/[Fe2+] = 0.24. It is important to note that the major byproduct, ClO2−, is harmful and may cause blood-related problems (Świetlik et al., 2002). The maximum contaminant level of ClO2− in drinking water regulated by USEPA is 0.8 mg/L (Long et al., 1999), while in China the level is 0.7 mg/L (MoH and SA, 2006). According to our previous study (Cui et al., 2014), when the initial concentrations of Mn(II) and Fe(II) in water were 1.5 and 1.0 mg/L, respectively, the dosage of ClO2 could be set as 0.99 mg/L ([ClO2]/[Mn2+] = 0.5, [ClO2]/[Fe2+] = 0.24) to guarantee the removal efficiency of Mn(II) and Fe(II) and control the generation of ClO2−.
Comparison of Fe(II) and Mn(II) removal capabilities of NMSF, QSF, and FBF
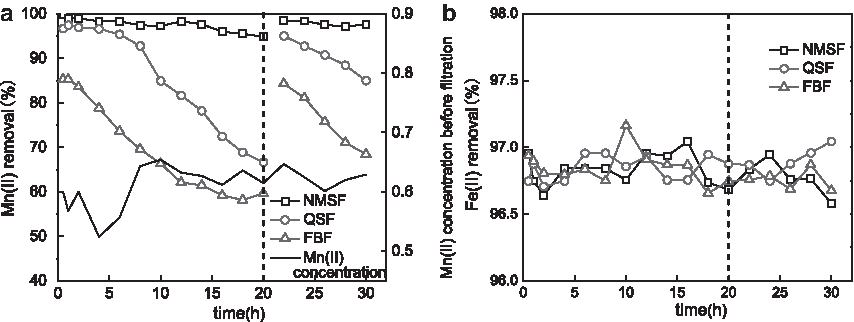
Figure 2a shows the Mn(II) removal efficiencies of NMSF, QSF, and FBF. As shown in Figure 2a, the Mn(II) concentrations before flowing into filters were about 0.6 mg/L, indicating that a portion of Mn(II) had been oxidized to MnO2 by ClO2. During the course of the experiment, the Mn(II) concentration in the NMSF effluent remained lower than the standard value (0.1 mg/L). According to calculations, NMSF contributed to 97.6% of Mn(II) removal on the time average. Comparatively, QSF and FBF resulted in lower Mn(II) removal efficiencies, which were 87.1% and 71.9% on an average, respectively. Furthermore, the Mn(II) removal efficiencies of QSF and FBF were satisfactory at the beginning. However, with the elapsed time, the Mn(II) removal rates of QSF and FBF dropped rapidly to 66.6% and 59.6% at 20 h, respectively. This phenomenon is similar to that observed by Qin et al. (2009). Considering the big head loss of these filters, backwashing was performed at 20 h. After backwashing, the Mn(II) removal rates of QSF and FBF were retrieved to their initial levels. Nevertheless, they dropped again as experiment further proceeded. In conclusion, the Mn(II) removal capability of NMSF was superior to that of QSF and FBF.
Comparison of
Since the running time of this experiment is short and ClO2 preoxidation will result in the formation of MnO2, the main removal mechanism of Mn(II) are the filtration and adsorp tion by filter material (He et al., 2009; Qin et al., 2009; Tizaoui et al., 2012). Compared with quartz sand, manganese sand exhibited higher porosity and larger specific surface area (Table 1), therefore, it performed a stronger adsorption ability for Mn(II) (Wu et al., 2011). This is in agreement with the report of Yang et al. (2008), which indicated that the tested natural manganese sand had a stronger adsorption for Mn(II) than the quartz sand. Although FBF had a higher voidage and specific surface area, the Mn(II) removal rate of it was lower compared with NMSF. This is probably because the void of FBF is too big to intercept the MnO2 formed. As the running time increases, the adsorption capacities of quartz sand and FBF material on Mn(II) reach their maximum values, resulting in stripping of Mn(II) from filter materials (Xu et al., 2009). During backwashing, the adsorption equilibrium was broken. Mn(II) and its oxide adsorbed on the two filter materials were desorbed and released into the water, thus forming new available adsorption sites for Mn(II) (Liu et al., 2009; Lin et al., 2012). As a result, quartz sand and FBF material displayed enhanced, but short-lived Mn(II) removal capability after backwashing.
Removal efficiencies of Fe(II) by different filtration units are presented in Figure 2b. As can be seen from the figure, all the Fe(II) removal rates were above 96.0%. According to our experimental results, before the feed water flowed into filters (i.e., after ClO2 preoxidation), the concentration of Fe(II) in the water has already reduced to 0.32 mg/L, which is very close to the Fe(II) concentrations in effluents from these filters. The high Fe(II) removal rates can be due to the pH of feed water and the natural aeration process of the experimental apparatus. Because tap water with a pH of 8.3 is applied as raw water, Fe(II) in feed water can be easily oxidized by ClO2 and O2 (Sallanko et al., 2006; Tekerlekopoulou and Vayenas, 2007).
Removal Efficiency of ClO2 preoxidation–manganese sand filtration
According to experimental results, the removal efficiency of Fe(II) is ideal, and there is no significant difference among different operation conditions. Given that, the following sections mainly focus on the removal efficiency of manganese.
Effect of ClO2 dosages on manganese removal
Figure 3 illustrates the residual Mn(II) concentrations in NMSF effluent under the conditions of different ClO2 dosages which are 0.24, 0.62, 0.99, and 1.74 mg/L, respectively. Because the oxidation reduction potential of Fe(II) is lower than Mn(II), ClO2 would react with Fe(II) first (Mouchet, 1992). According to the reaction ratio of ClO2 to Mn(II) and Fe(II) (referred in The removal mechanism of Fe(II) and Mn(II) by ClO2 section) and the initial concentrations of Mn(II) and Fe(II), the specific setting principle of ClO2 dosages is listed in Table 3. At 4 h, the Mn(II) concentrations corresponding to the above ClO2 dosages were 0.092, 0.093, 0.084, and 0.076 mg/L, respectively, all below 0.1 mg/L. However, after 6 h, Mn(II) concentrations under the conditions of low ClO2 dosages (0.24 and 0.62 mg/L) began to exceed 0.1 mg/L and continued to rise with time.

Residual Mn(II) concentrations of NMSF effluent at different ClO2 dosages (CinMn = 1.5 mg/L, CinFe = 1.0 mg/L, dsand = 0.6–1.2 mm, q = 282.6 mL/min, H = 60 cm). ClO2, chlorine dioxide; NMSF, natural manganese sand filter.
ClO2, chlorine dioxide.
Since the redox potential of iron is lower compared with manganese (Canfield et al., 2005), in this experiment ClO2 first reacts with Fe(II) to form iron oxide, which coats the surface of the filter materials. Then, surplus ClO2 continues to react with Mn(II) to form manganese oxide. Both Fe and Mn oxides display strong adsorption ability to further adsorb Fe(II) and Mn(II) in the water (Benjamin, 1983; Post, 1999; Sallanko et al., 2006) and result in higher Fe(II) and Mn(II) removal efficiencies. As a result, the increase of ClO2 dosage is beneficial to Fe(II) and Mn(II) removal. Nevertheless, considering the formation of ClO2− and treatment cost, the ClO2 dosage of 0.99 mg/L is advisable.
Effect of liquid flow rate on manganese removal
The effect of liquid flow rate (188.4–471.0 mL/min) on manganese removal has been studied. In Figure 4, a sharper increase of Mn(II) concentration with elapsed time was observed at higher flow rates. At the end of the experiment, the residual Mn(II) concentrations in the effluent corresponding to flow rates of 188.4, 282.6, 376.8, and 471.0 mL/min were 0.06, 0.09, 0.24, and 0.53 mg/L, and the corresponding Mn(II) removal rates were 96.1%, 94.1%, 83.9%, and 64.7%, respectively. The Mn(II) concentrations at low flow rates (188.4 and 282.6 mL/min) were below 0.10 mg/L (the standard value) during the experiment period. However the further increase of the flow rate to 376.8 and 471.0 mL/min triggered declined removal performance, which was in agreement with other studies (Pacini et al., 2005; Štembal et al., 2005; Tekerlekopoulou et al., 2008).

Residual Mn(II) concentrations of NMSF effluent at different liquid flow rates (CinMn = 1.5 mg/L, CinFe = 1.0 mg/L, dsand = 0.6–1.2 mm, Do = 0.99 mg/L, H = 60 cm).
In this study, there are two possible reasons that may lead to this consequence. On one hand, dissolved Mn(II) is oxidized by ClO2 into tiny Mn oxide particles, which do not flocculate without a flocculant (Benjamin, 1983; Herszage and dos Santos Afonso, 2003). When the liquid flow rate is relatively high and hydraulic load of filter is big, these particles will penetrate the filter layer along with the water flow, causing high Mn(II) concentration in the effluent. On the other hand, as the liquid flow rate increases, the residence time for Fe(II) and Mn(II) in the 60-cm column is shortened, which results in the incomplete oxidation of all Fe(II) and Mn(II) in water and accounts for the phenomenon that Fe(II) and Mn(II) in NMSF effluent exceed the standard. After passing the effluent sample through a 0.45-μm filter and determination, it could be found that the average amounts of Mn particulates (Mnpart) of the effluents at the flow rate of 376.8 and 471.0 mL/min accounted for 8.3% and 11.5% of the total Mn. This indicates that the shortened residence time mentioned above was the main reason. In conclusion, to ensure water flux and water quality, the flow rate of 282.6 mL/min can be applied in the technique.
Effect of sand particle diameter on manganese removal
The effect of sand particle diameter on manganese removal was studied and the results are shown in Figure 5. Results revealed that more effective removals of Mn(II) were obtained at smaller sand sizes, which was in accordance with the results presented by Tekerlekopoulou and Vayenas (2007). When the sand particle size ranges were 0.5–1 and 0.6–1.2 mm, the Mn(II) concentration in NMSF effluent met the water quality standard and the Mn(II) removal rates were between 95% and 100%. As the sand particle size increased to 1–2 mm, the corresponding Mn(II) concentration versus time (h) curve presented a downward trend first and then moved upward. At the beginning of the experiment, the superfine Mn oxide particles penetrated the filter layer, causing the residual Mn(II) concentration of effluent rise to 0.36 mg/L. As time went on, more and more Mn oxide particles were trapped in the pore spaces within the filter layer. As a result, residual Mn(II) concentration of effluent reduced gradually at first and then remained at a low level around 0.22 mg/L. Later, the residual Mn(II) concentration of effluent began to rise again because of the decrease in adsorption capacity of the sand. Based on this experiment, the sand particle size range of 0.6–1.2 mm is selected as the desired one.
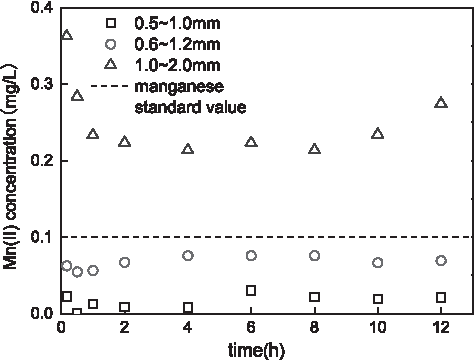
Residual Mn(II) concentrations of NMSF effluent at different sand particle diameters (CinMn = 1.5 mg/L, CinFe = 1.0 mg/L, q = 282.6 mL/min, Do = 0.99 mg/L, H = 60 cm).
Effect of filter bed thickness on manganese removal
Figure 6 shows the effect of filter bed thickness (H = 10–80 cm) on manganese removal. The results showed that the curves representing the change of Mn(II) concentration had the similar shape and did not superimpose, which indicated, under the conditions studied, that the thickness of sand had an important effect of NMSF on manganese removal. Before 4 h, the residual Mn(II) concentrations in NMSF effluent at the filter bed thicknesses ranging from 30 to 80 cm were all below 0.1 mg/L and the corresponding manganese removal rates were between 80% and 97%, indicating that most Mn(II) in the feed water could be removed within 30 cm of filter bed. The residual Mn(II) concentrations in effluents sampled at the filter bed thicknesses of 10 and 20 cm were 0.25 and 0.13 mg/L, respectively, which were higher than those collected from other bed thicknesses.
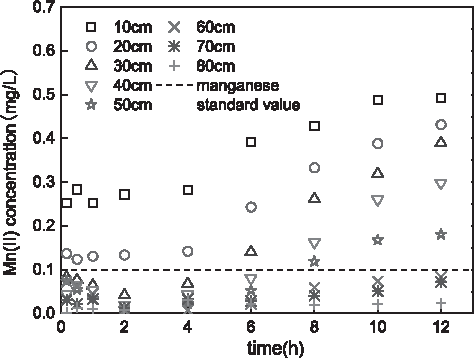
Residual Mn(II) concentrations of NMSF effluent sampled at different filter bed thicknesses (CinMn = 1.5 mg/L, CinFe = 1.0 mg/L, Do = 0.99 mg/L, q = 282.6 mL/min, dsand = 0.6–1.2 mm).
At 6 h, the residual Mn(II) concentrations of effluents sampled at the filter bed thicknesses less than 40 cm began to increase. Moreover, the thinner the filter layer thickness was, the faster the Mn(II) concentration in effluent increased. However, for the test systems whose filter bed thicknesses were more than 60 cm, their corresponding residual Mn(II) concentrations in effluents remained below the water quality standard value during the course of the experiment. It should be attributed to that the higher filter layer thickness guarantees greater adsorption capacity and longer residence time of Mn(II) in the filter bed, which facilitate Mn(II) adsorption on the filter material and subsequent oxidation. Therefore, taking both manganese removal efficiency and processing cost into consideration, 60 cm is suggested to be the optimum filter bed thickness.
Operation stability analysis of NMSF
The optimal parameters obtained above were adopted in this experiment so as to analyze the manganese and iron removal efficiency of NMSF and its valid time under the optimum operating conditions. The Mn(II) and Fe(II) removal results of this experiment are shown in Figure 7. According to Figure 7, during the whole experiment, Fe(II) removal rate was ∼95% and the Fe(II) concentration in effluent kept within the standard 0.3 mg/L. At the beginning of the experiment, the Mn(II) concentration in effluent was below the standard 0.1 mg/L. However, since the time of 17 h, the residual Mn(II) concentration in effluent started to increase rapidly and it reached 0.3 mg/L at 29 h, with the corresponding Mn(II) removal rate decreasing from 94% to 79%. This phenomenon has repeatedly appeared in former experimental results, which is because the filter material has reached its saturation adsorption capacity.
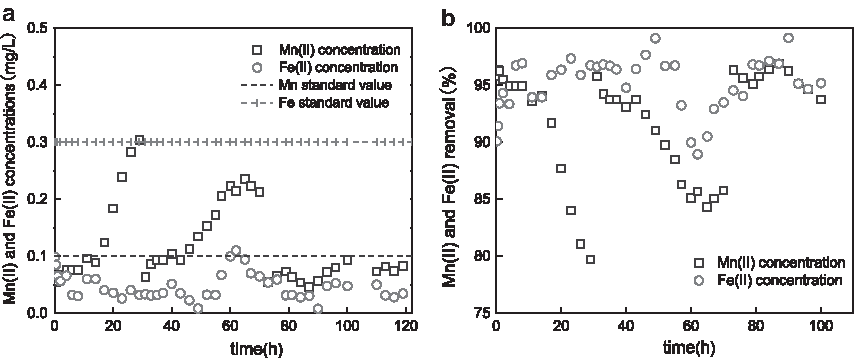
Mn(II) and Fe(II) removal results of NMSF under the optimum operating conditions (CinMn = 1.5 mg/L, CinFe = 1.0 mg/L, Do = 0.99 mg/L, q = 282.6 mL/min, dsand = 0.6–1.2 mm, H = 60 cm).
Since the head loss of sand filter was rather big, backwashing was performed at the time of 30 h. After backwashing, the Mn(II) concentration of effluent met the standard again. At the time of 49 h, the residual Mn(II) concentration of effluent raised once more and increased to 0.22 mg/L at the time of 60 h. Since then, the residual Mn(II) concentration did not increase further, but was stable around 0.22 mg/L. Consequently, the second backwashing was performed at the time of 70 h. After the second backwashing, the residual Mn(II) concentration kept within 0.1 mg/L and did not increase again. It can be deduced that a layer of Mn and Fe oxides with adsorption and catalytic activity has formed on the surface of filter material. As mentioned earlier, ClO2 can react with Mn(II) and Fe(II) to form Mn and Fe oxides as a coating on the surface of the material. This coating in turn continues to adsorb residual Fe(II) and Mn(II) in the water. After being adsorbed, Fe(II) and Mn(II) are further oxidized by oxygen and bacteria in the water, forming new coating with adsorption and catalytic activity. Thus, new adsorption sites are generated and hence the process continues. This mechanism of Fe has been studied by Takai (1973) and Barry et al. (1994) and can be represented as follows (Sallanko et al., 2006):

where ≡S is the surface of filter media.
For the removal of Mn, considering that the coating contained a kind of amorphous Mn oxide, shorthand for MnO2·xH2O, which was the key reason for Mn removal, the reaction principle equation is expressed as (Li and Liu, 1987)
Besides, the “Mn sand self-catalytic oxidization” referred by Teng et al. (2001) also has the same mechanism. However, more and more researchers thought that this self-catalytic oxidization of Mn and Fe mainly attributes to the metabolism of relative bacteria (Hatva, 1989; Ruggiero and Gounot, 1990; Vandenabeele et al., 1992). This also explains why sand filter needs a long time to form a stable Mn removal performance. In addition, the preoxidation of ClO2 can accelerate the formation of Mn sand self-catalytic oxidization, which has obvious and stable effect on Mn(II) and Fe(II) removal in water.
Conclusions
A technique of ClO2 preoxidation–manganese sand filtration was developed to remove manganese and iron from potable water. NMSF showed higher potential of removing manganese than QSF and FBF, indicating the stronger adsorption ability of manganese sand on Mn(II). Thereafter, the process of ClO2 preoxidation–manganese sand filtration was proposed for manganese and iron removal in engineering. It was found that the manganese removal effectiveness of the technique increased with higher dosage of preoxidant, lower liquid flow rate, smaller sand particle diameter, and thicker filter bed. Experiments revealed that when the initial concentrations of Mn(II) and Fe(II) in feed water were 1.5 and 1.0 mg/L, the optimum operating conditions were Do = 0.99 mg/L, q = 282.6 mL/min, dsand = 0.6–1.2 mm, and H = 60 cm. Under this operating condition, the process showed good capability of removing iron and manganese with the removal rates more than 95%. Besides, the preoxidation of ClO2 could accelerate the formation of Mn sand self-catalytic oxidization. Based on the results obtained, this process is feasible for manganese and iron removal in engineering.
Footnotes
Acknowledgment
The authors are grateful to the financial support by the National Natural Science Foundation of China (51409236).
Author Disclosure Statement
No competing financial interests exist.