
Abstract
Abstract
Wastewater generated during pulp and paper production usually contains large amounts of organic matter that may be converted to biogas through anaerobic treatment. These effluents can also contain a variety of inhibitors such as resin acids and long-chain fatty acids (RFAs) among other compounds. A multivariate data analysis was conducted with performance and water quality data from an anaerobic reactor at a pulp and paper mill, which provides unprecedented evidence for the long-term inhibitory effects of RFAs during full-scale operation. Although RFAs in the reactor influent did not cause serious process disturbance, they significantly contributed to the variability in the percentage removal of soluble chemical oxygen demand (percent sCOD removal) (∼45% to ∼75%), as well as the variability in volatile fatty acid concentration in the effluent (2 to >20 meq/L). Furthermore, a linear correlation was found between RFA concentrations in the reactor sludge bed and the percent sCOD removal. An effective strategy to remove RFAs before anaerobic treatment is upfront removal of particles within the primary clarifier. Based on an exploratory model, a graphical method is introduced that allows for quick assessment of the extent to which resin acids are sorbed to particles, and associated potential for upfront settling. When the pH of high-solids wastewater is below 7, the majority of resin acids will be associated with particles and a considerable fraction of these can therefore be removed by means of settling or floatation. Finally, a novel liquid chromatography–mass spectrometry method that rapidly quantifies major RFA constituents was developed. In the full-scale reactor, dehydroabietic acid (DHA) represented the bulk (∼92%) of the resin acids within the granular sludge. DHA in sludge warrants special attention and should be monitored closely.
Introduction
A
Resin acids act as a natural wood preservative and protectant against beetle and fungus infestations. Although the extent to which each of the individual resin acids present in mill streams varies, the most commonly occurring substances are dehydroabietic and abietic acids (Makris, 2003). Long-chain fatty acids (LCFAs) are carboxylic acids with typical chain lengths of C18–C24 that are formed during pulping as hydrolysis products of esters, namely fats and waxes. The most commonly occurring LCFAs in mill streams are palmitic acid, oleic acid, linoleic acid, and stearic acid (Makris, 2003), although stearic is quickly transformed to palmitic acid through β-oxidation (Pereira et al., 2005). The molecular weights of RFAs are relatively small (200–400 g/mol) making them readily bioavailable (Field et al., 1990).
Resin acids should exhibit log KOW values of ∼6.5 at pH 7 (ECHA, 2008), whereas LCFAs are even more hydrophobic with log KOW values on the order of magnitude of 7.5 (Patton et al., 1984; Makris, 2003). Therefore, at neutral pH, the majority of the RFAs should be sorbed to particles or colloids. Most previous studies investigating inhibition of anaerobic digestion by resin acids report concentrations as the sum of all resin acids. Sierra-Alvarez et al. (1994) found 50% inhibition concentration (IC) values (concentrations at which 50% of the activity of methanogens is inhibited) for total resin acids ranging between 21 and 400 mg/L. Only one study was identified that investigated inhibition of individual resin acids (Sierra-Alvarez and Lettinga, 1990), where 50% IC values of 43 mg/L for dehydroabietic acid (DHA) and 89 mg/L for abietic acid were measured. In pulp and paper mill streams, concentrations of LCFAs are typically lower than those of resin acids (Makris, 2003), whereas reported 50% IC values are higher and range between 73 and 1,670 mg/L (Koster and Cramer, 1987; Hwu et al., 1996; Kim et al., 2004).
Few studies have investigated how RFAs accumulate within the granular sludge bed of anaerobic wastewater reactors. In a bench-scale study conducted by McFarlane and Clark (1988), screw press wastewater from a pulp mill was fed to an upflow anaerobic sludge bed (UASB) reactor for the duration of 2.5 years. At the end of the experiment, the resin acid concentrations in the UASB sludge were measured. The highest concentrations were found for DHA (1,640 mg/L sludge bed volume), exceeding DHA influent concentrations by 13-fold. In the same study, the concentrations of LCFAs in the UASB sludge bed were measured, with palmitic acid being the most abundant (456 mg/L sludge bed volume).
In another study Liver and Hall (1996) conducted anaerobic batch experiments, where unacclimated biomass was exposed to resin acids. Concentrations exceeding 3.1 mg/g volatile suspended solids (VSS) within the sludge bed caused notable inhibition. However, the inhibited methanogenic populations were capable of becoming acclimated to higher resin acid concentrations after 7–13 days of exposure. Guiot et al. (1998) suggest a much higher threshold concentration of 100 mg/g VSS in the sludge bed for inhibition to occur.
The size of the particles to which RFAs become sorbed ranges widely. Leiviskä et al. (2009) analyzed integrated kraft pulp and paper mill wastewater in terms of the size fractionation of the suspended solids that contain RFAs. Accordingly, 44% of the RFAs were sorbed to particles >0.45 μm, 20% to colloids (0.45 μm–3 kDa), and 36% were present in the <3 kDa fraction. However, this fractionation may vary largely because the affinity of RFAs to suspended solids within wastewater strongly depends on the type of the solids; for example, the extent of sorption to fiber and fiber-like fines is notably higher than that to biomass or inorganic material (Makris, 2003).
At neutral pH, large fractions of the RFAs in incoming wastewaters should be associated with suspended solids (Nyren and Back, 1958; Makris, 2003). Therefore, efficient solids removal in the primary clarifier and before anaerobic treatment may provide two benefits. First, a notable fraction of RFAs associated with suspended solids is settled out and, therefore, does not enter the anaerobic reactor. Second, high-rate anaerobic wastewater treatment reactors typically only accept streams with a total suspended solids (TSS) concentrations less than ∼500 mg/L or 10–20% of the chemical oxygen demand (COD) concentration (Totzke, 2012). Many in-mill streams, however, carry a much higher suspended solids load [refs. in Meyer and Edwards (2014)].
Sorption does not only govern the behavior of RFAs in the clarifier, but also within the anaerobic reactor. Considering the strong relationship between the extent of sorption of RFAs and the concentration of TSS (Makris, 2003), the very high TSS concentrations in the form of biomass within the anaerobic granular sludge bed (10,000–100,000 mg/L) causes virtually all RFAs to be sorbed to these solids.
Most previous studies on the effect of RFAs on anaerobic treatment have conducted laboratory experiments, and the few full-scale studies on this topic were evaluated based on the results of previous laboratory-scale studies. However, extrapolating from results of laboratory studies to full-scale operation is associated with large uncertainties. Furthermore, previously reported threshold values of RFA concentrations that indicate toxicity, range over more than two orders of magnitude (Meyer and Edwards, 2014). Therefore, the objective of this study was to investigate for the first time the effects of RFAs and other potential inhibitors on full-scale anaerobic reactor operation.
A multivariate data analysis (MVDA) was implemented to identify dependencies between reactor performance and RFA and other feed constituents simultaneously present in the wastewater. The target parameters relating to process performance and stability were the percentage removal of soluble COD (% sCOD removal) and the concentrations of volatile fatty acids in the effluent (VFA effluent concentration). A partitioning space map was generated to rapidly assess the extent of sorption of resin acids to organic material in pulp and paper mill wastewater as a function of pH and suspended solids concentration on an order of magnitude basis, and the associated potential benefits to an operator if upfront suspended solids removal were implemented before digestion.
Experimental Protocols
Full-scale reactor study
A full-scale anaerobic expanded granular sludge bed reactor at a Canadian sulfite pulp mill was investigated. During the time period of investigation, the reactor was operated at a hydraulic retention time ranging between 6 and 10 h, a sludge retention time of ∼20 days, and at an organic loading rate ranging between 15 and 20 kg COD/m3 day. Daily reactor operation data covering the time period from February 2006 to August 2010, including RFA influent concentrations and numerous other parameters were used to conduct an MVDA (see details below). All samples referred to in the operating data file were taken as composite samples, each covering a whole day.
Samples of anaerobic granular sludge from the full-scale reactor were taken 10 times from May 2007 to July 2008. The samples were subdivided into triplicates (four samples) and duplicates (six samples), centrifuged (8,000 g and 25°C for 20 min), and then, the solid fraction was stored at −80°C for 5–6 years. Afterward, the samples were analyzed for RFAs. The average relative standard deviation for the RFA concentrations in the triplicate and duplicate samples was 9.7%. Concentrations in the anaerobic granular sludge bed on a volume basis were calculated using measured concentrations of RFAs sorbed to suspended solids on a dry weight basis, and TSS concentrations from routine sludge inventory measurements conducted at the mill. The average TSS content within the reactor segment from which the samples were taken was 76,000 mg/L (relative standard deviation [RSD] = 6.9%). In addition to the full-scale reactor study, a bench-scale experiment on RFAs in mill wastewater was conducted (Supplementary Data).
Multivariate data analysis
The MVDA tool SIMCA v14 (MKS Umetrics, Umeå, Sweden) was used to perform a partial least squares (PLS) regression analysis. This software has been applied and described in detail in previous studies, where operating data related to wastewater treatment and/or pulp and paper production were investigated (Pell and Ljunggren, 1996; Eriksson et al., 2001; Goode et al., 2007; Hajiha, 2009). MVDAs have been increasingly applied to interpret large datasets, identify patterns, and correlations while considering all data simultaneously (Rathore et al., 2014). During the analysis, an empirical model is created based on measured data (independent variables X), and by calculating latent variables that are orthogonal to each other. In the case of PLS regression, these latent variables are selected to maximize their description of the output (dependent variables Y) variance. The method is robust to noise in X and Y, and can handle correlations among variables, as well as missing data.
Previous MVDA studies on biological wastewater treatment refer to a delayed response of dependent variables to some input parameters (van Dongen and Geuens, 1998; Eriksson et al., 2001; Barampouti et al., 2005). To address the dynamics of the process and to enhance model predictability, a time series analysis was implemented by adding lagged variables to the model. Variable lagging is applied by adding variables at day t + i for i = 1 to n. The variable n refers to the response time of the dependent variable (Y) (Hansen et al., 1980), and was determined in an iterative way and to achieve the strongest increase in explained and predicted model variation (see “Results and Discussion” section).
Before building the PLS model, the data were preprocessed, which involved the exclusion of unreasonable data such as those generated during shut-down events of wastewater treatment plant components. Also, all data were scaled to unit variance, and data related to several variables required transformation to logarithmic scale.
Extraction of RFAs
Resin acid standards were purchased from Orchid Cellmark, and fatty acids from Sigma-Aldrich Co. LLC. Labeled dehydroabietic acid-6,6-d2 was purchased from Ramidus AB.
For RFA analysis of anaerobic granular sludge from the full-scale reactor ∼100 mg (dry weight) of the stored sludge was resuspended in 40 mL methanol. After vigorous shaking and sonication (30 min at 25°C), a 1 mL aliquot was taken, filtered through a 0.2 μm filter, and amended with milli-Q water to a final composition of 50% water (vol/vol) for liquid chromatography–mass spectrometry (LC-MS) analysis. The remaining 39 mL was again centrifuged and the supernatant decanted. Finally, the particles were dried in a 104°C oven and weighed to enable determination of the RFA concentrations per gram particle dry weight.
Liquid chromatography–mass spectrometry
Sample extracts were analyzed using a Thermo Fisher Scientific Exactive LC-MS analyzer, with electrospray ionization. Two separation columns were used, a Hypersil GOLD C18 (reversed phase) column (50 × 2.1 mm I.D.), and a C8 (reversed phase) column (100 × 2.1 mm I.D.), both with a particle size of 1.9 μm. A detailed description of the analytical method is described in the Supplementary Data. Briefly, the target resin acids were DHA, and seven nonaromatic resin acids. By using the C8 column, of the seven nonaromatic resin acids, three peak areas can be quantified. The first peak comprises levopimaric acid and neoabietic acid; the second peak abietic acid, pimaric acid, and sandaracopimaric acid; and the third peak palustric acid and isopimaric acid (Supplementary Fig. S1). The analyzed fatty acids were oleic acid, palmitic acid, linoleic acid, and stearic acid. RFAs were quantified with five external calibration standards.
Dehydroabietic acid-6,6-d2, dichloro dehydroabietic acid and heptadecanoic acid (margaric acid) were added to seven samples before extraction to determine recovery efficiencies. The latter two substances were not detectable in any of the wastewater samples and, therefore, were used as surrogate standards. The recovery efficiencies range from 69% to 89% (RSDs: 5–13%) (Supplementary Table S1). Estimated method detection limits were calculated according to EPA method 8280A (U.S. EPA, 1996) and are listed in the Supplementary Table S3.
Other analyses
TSS was determined by filtration using glass fiber filters from Whatman (934-AH) with a pore diameter of 1.5 μm. VSS was determined by the weight loss of a sample (dried at 104°C) during high temperature combustion (525°C). COD analyses were performed by applying the dichromate method (Jirka and Carter, 1975) and using a spectrophotometer (DR-3900 from Hach). sCOD was analyzed by preceding filtration (Whatman 934-AH). The VFA concentrations were determined by means of titration with 0.1 N NaOH, and after steam distillation (Siedlecka et al., 2008). Sulfite concentrations were measured by means of iodometric titration using standard potassium iodide–iodate titrant and a starch indicator (NEMI—Method 4500 B).
Results and Discussion
Impact of influent RFA concentrations on the performance of full-scale reactor
Daily full-scale reactor operation data covering the time period from February 2006 to August 2010 were used to conduct an MVDA and find relationships between operational parameters and reactor performance and stability variables.
The independent variables (X) included the reactor influent concentrations of sCOD, sulfite, VFA, TSS, and RFA (Fig. 1), the oxidation–reduction potential and pH in the reactor feed tank, the flow rates of three types of in-mill effluents, as well as the amounts of chemicals added to the reactor feed tank (lime, caustics, ferric sulfate, ammonia, phosphoric acid, and micronutrients) (Supplementary Table S6).
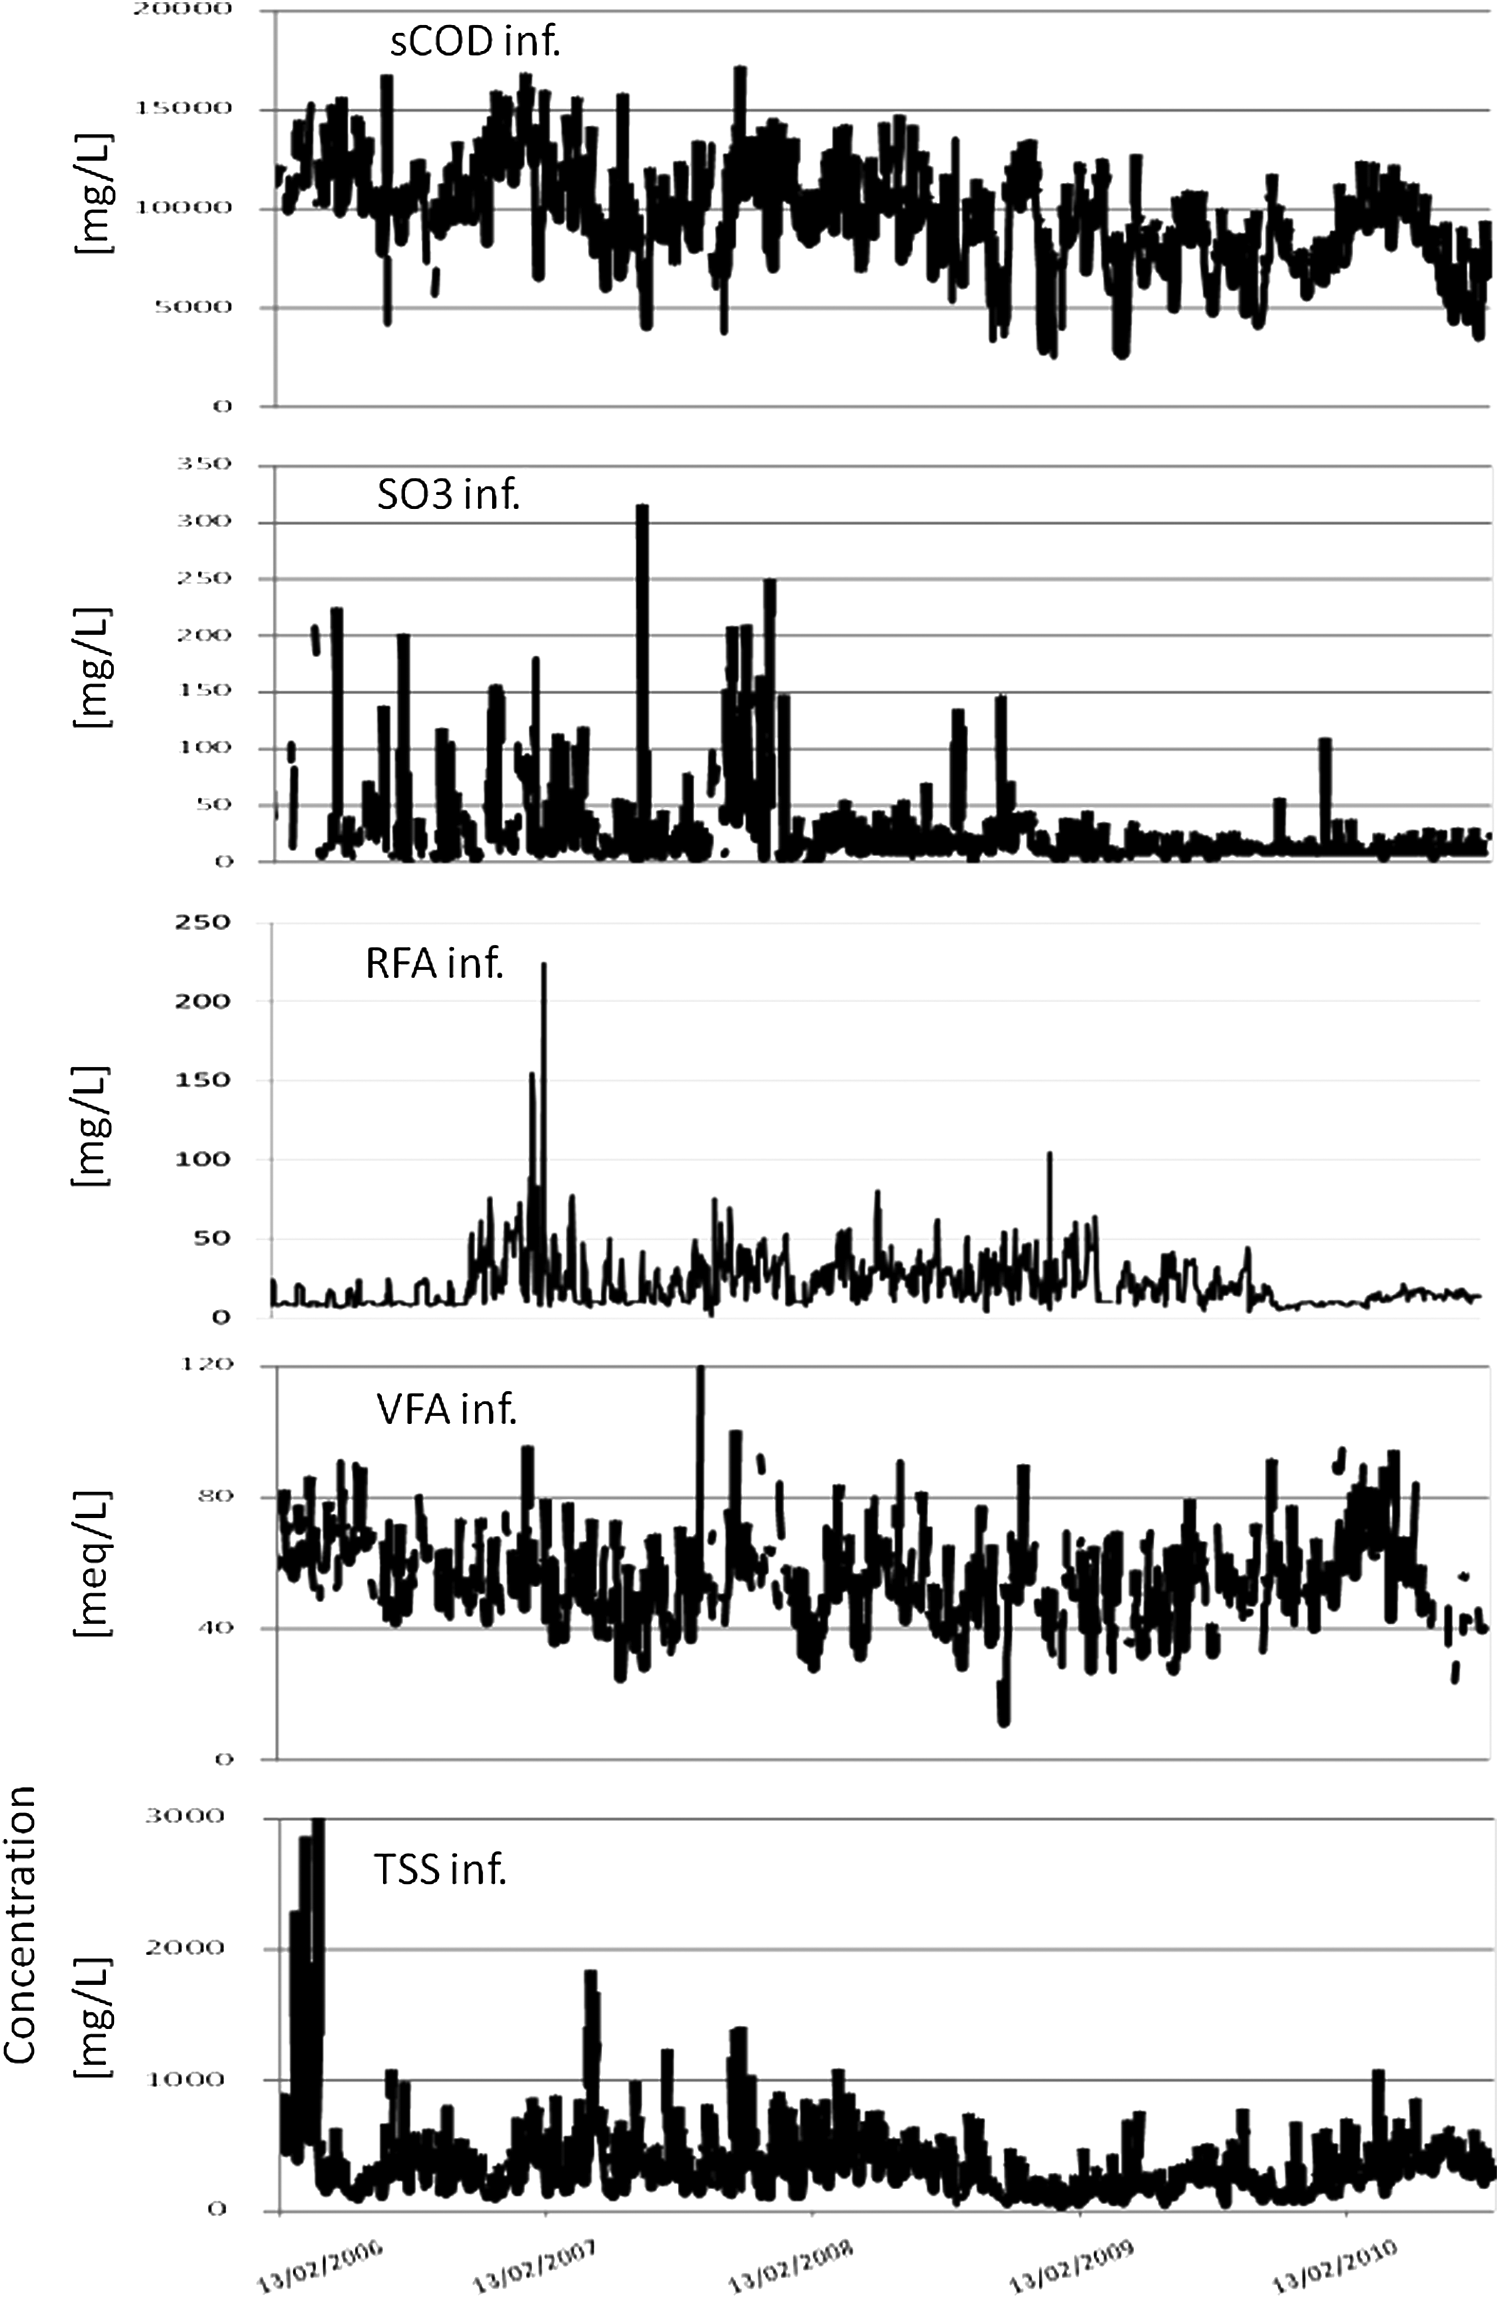
Time series of influential input parameters.
The dependent parameters (Y) were the % sCOD removal and the VFA effluent concentration. The % sCOD removal efficiency was calculated by subtracting the effluent from the influent concentration, and dividing the difference by the influent concentration. Influent and effluent concentrations refer to composite samples taken on the same day. Although the % sCOD removal efficiency characterizes the reactor performance, elevated VFA effluent concentrations are a widely recognized indicator for anaerobic process deterioration (McCarty and McKinney, 1961; Speece, 2008; Franke-Whittle et al., 2014; Yirong et al., 2015).
Figure 2 shows the regression coefficients for the % sCOD removal efficiency and the VFA effluent concentration related to the scaled and centered X-variables. The size of each of the coefficients refers to the change in the dependent variable (Y) when the independent variable (X) varies from 0 to 1, in coded units, whereas the other variables are kept at their averages. Therefore, these coefficients describe the correlation between the Y-variable and the systematic part of each of the X-variables. The error bars illustrate the confidence intervals, whereas the coefficient is significant, when the confidence interval does not include zero.

PLS model coefficient plots for the two Y-variables % sCOD removal
Of all independent variables (X), the RFA concentration in the influent exerts the highest influence on the % sCOD removal efficiency. Sulfite, which is another known anaerobic inhibitor, has also a significant negative impact on the reactor performance. Significant positive correlations between RFA and sulfite concentrations on the one hand, and VFA effluent concentrations on the other, confirm the inhibitory impact of these substances. Figure 2 also shows relatively strong positive correlations between the parameter VFA effluent concentration and the two parameters referring to concentrations of sCOD and VFA in the influent. However, these two latter parameters do not seem to have a negative impact on the process performance in terms of % sCOD removal.
Cross-correlation analysis indicated that several influent parameters were significantly correlated to the Y variables that were lagged in time. Therefore, in a second step, lagged variables were introduced to improve the model predictability. After systematically investigating the impact of various lags applied to X-variables and Y-variables, it appeared that by only applying lags 1–5 (1–5 days) to both Y-variables (% sCOD removal, VFA effluent concentration), the explained model variation (R2Y) could be improved from 0.33 to 0.54 in the case of % sCOD removal and from 0.36 to 0.60 in the case of VFA effluent concentration. The associated predicted variation (Q2Y), determined by means of cross validation increased similarly (Table 1).
sCOD, soluble chemical oxygen demand; VFA, volatile fatty acids.
R2Y, which is the fraction of the variation of a Y variable that can be explained by the model, illustrates the goodness of fit of the model. Q2Y indicates how well a Y variable can be predicted. During cross validation, a part of the X data is first being kept out of model development, then predicted by the model, and the prediction is finally being compared with the actual values. This procedure is repeated until every data point has been kept out once. Along with an increasing number of principal components, the R2Y and Q2Y parameters follow different trends. With increasing model complexity R2Y approaches unity, whereas Q2Y first reaches a plateau and then decreases again. A valid model should not only have relatively high R2Y and Q2Y values, they should also be relatively close to each other (Eriksson et al., 2013). Considering the complexity of wastewater treatment processes in pulp and paper mills, the R2Y and Q2Y values listed in Table 1 refer to well-modeled Y variables (Eriksson et al., 2001).
Figure 3 displays the time series plots with the measured versus the predicted % sCOD removal, and the measured versus the predicted VFA effluent concentration. Furthermore, the measured versus predicted values for both dependent parameters as diagonal plots are shown in Supplementary Figure S5. Applying more lags (days) did not improve the model significantly. Therefore, it can be concluded that the anaerobic system responds relatively quickly and within a few days to the varying influent conditions.

Measured versus predicted percent sCOD removal
Figure 4 shows the PLS Loadings Scatter Plot that display the correlation structure between all X variables and Y variables. The figure includes the loading weights involving the first three PLS regression components. Parameters negatively correlated to each other can be found on opposite locations within the loadings scatter plot, and those positively correlated are close to each other. As can be seen, the parameter RFA influent concentration contributed the most to the PLS model, and the plots confirm the above-described negative correlation of this parameter with the % sCOD removal efficiency, as well as positive correlation with the VFA effluent concentration.

Loadings scatter plot comprising first three components, w*c1 versus w*c2
During the investigated time period, RFA influent concentrations ranged between ∼10 and ∼225 mg/L (21-day moving average range: 10–50 mg/L), and those of the sulfite ranged between ∼5 and ∼315 mg/L (21-day moving average range: 10–120 mg/L) (Fig. 1). According to previous research, those concentrations can cause inhibition. Reported resin acid concentrations, above which notable anaerobic inhibition occurs, varies widely from 20 to 600 mg/L (Field et al., 1988; McCarthy et al., 1990; Sierra-Alvarez and Lettinga, 1990; Kennedy et al., 1992), and those for LCFAs varies from 73 to 1,670 mg/L (Koster and Cramer, 1987; Hwu et al., 1996; Kim et al., 2004). A threshold value of 50 mg/L of sulfite in the influent of high-rate anaerobic wastewater reactors has been suggested by Habets (2012, pers. comm.). Not much is known about possible compounded effects of various inhibitors which may be larger than the sum of the effects of each individual inhibitor.
Whether the microbial biomass in a reactor is suffering from inhibition is not only governed by the absolute concentrations of inhibiting compounds in the influent, but also by the extent of day-to-day variation in wastewater composition. The composite stream fed to the reactor consisted of three effluents from different pulping operations and the amounts of each of these effluents contributing to the composite stream varied largely. The stress that the microbial biomass was experiencing during the investigated time period was also expressed by the relatively short sludge retention time (see section “Experimental Protocols”), and a constant but small loss of biomass along with the effluent over time (data not shown). Therefore, on an occasional basis unacclimated granular sludge from UASB reactors treating wastewater at food companies was added to the reactor.
Although the concentrations of RFAs and sulfite in the influent were not excessively high, and these compounds have not caused any serious process upset, they have significantly contributed to the observed variability in % sCOD removal and VFA effluent concentration. During the observed time period, the % sCOD removal was ranging between ∼45% and ∼75%. This variation in COD removal can have a notable impact on the overall costs of wastewater treatment at a mill. Assuming an average mill generating wastewater that contains 30 tons of COD per day (Hagelqvist, 2013), a difference in 30% COD removal (9 tons) is equivalent to the production of ∼1,800 m3 biogas or 13.5 GJ (3.8 MWh) electricity per day. Furthermore, by treating 9 tons of COD in the activated sludge process instead of in the anaerobic reactor, an additional net energy of 28 GJ (7.8 MWh) per day is required (Paasschens et al., 1991; Hagelqvist, 2013). Anaerobic wastewater treatment in mills is always followed by aerobic posttreatment. Finally, activated sludge treatment of the 9 tons COD refers to the generation of 1–2 tons/day of secondary sludge (dry solid basis), which requires cost-intensive dewatering and disposal.
RFA concentrations in full-scale reactor
Figure 5 and Supplementary Table S5 presents the concentrations of the sum of RFAs sorbed to anaerobic granular sludge and the RFA concentrations in the influent. Concentrations in the effluent were measured only very sporadically and are, in general, about half of those in the influent (results not shown). Concentrations of RFAs in the sludge bed on a volume basis ranged between 150 and 550 mg/L (see Experimental Protocol section for the calculation) and were higher than in the influent by more than one order of magnitude. The relatively large variations of RFA concentrations in the granular sludge were not correlated to the pH or to the suspended solids concentrations.
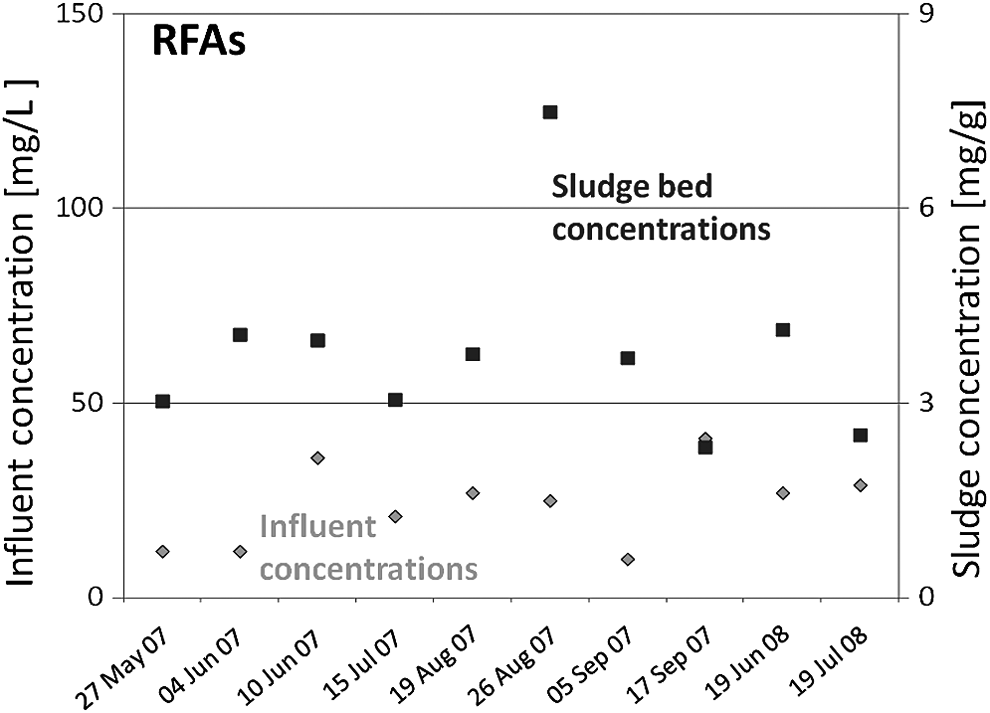
Concentrations of sum of RFAs in influent and in granular sludge bed of full-scale reactor. RFAs, resin acids and long-chain fatty acids.
Of all resin acids determined in the granular sludge, DHA was by far the most abundant compound comprising ∼92%.
Because RFA concentrations in the sludge bed could not be included into the MVDA, Pearson correlation was calculated between these concentrations (on the dry particle weight basis) and the % sCOD removal (Table 2). Although the number of observations (days) applied to the MVDA was 1,663, the sample size used to calculate correlations with granular sludge concentrations was only 10. To each of the measured RFA concentrations in the granular sludge, the 3-, 7- and 21-day moving average of the % sCOD removal efficiency was assigned (Supplementary Data) to accommodate the noise of the data and the response time of the % sCOD removal.
RFA, resin acids and long-chain fatty acids.
Accordingly, a significant, strong, and negative correlation was found between the two parameters in all three cases. Those correlations were as follows: −0.67 (p < 0.05) for the 3-day moving average, −0.76 (p < 0.05) for the 7-day moving average, and −0.71 (p < 0.05) for the 21-day moving average (Table 2). RFA levels in the sludge bed seemingly had a negative impact on the % sCOD removal efficiency, although the observed effect was fairly small (Table 2).
Assessing the degree of resin acid sorption and potential for upfront removal
The MVDA has shown that RFA levels in the influent can adversely affect the reactor performance. Not only a lower pH, but also a higher suspended solids concentration causes more RFAs to be associated with particles. Makris (2003) observed that in a primary clarifier containing a TSS concentration of 160 mg/L, 40% of the RFAs were in the dissolved phase. This percentage increased step-wise to 90% within the final effluent, where the TSS concentration was as low as 11 mg/L. A potential strategy for upfront removal of RFAs would be to enhance the settling of solids, and in particular fiber-like solids, within the primary clarifier. Although the very hydrophobic LCFAs are largely sorbed to suspended solids under most circumstances, the partitioning of the less hydrophobic resin acids is more variable.
To assess the extent of sorption of resin acids to suspended solids within the wastewater and ultimately the potential for upfront removal, we have developed an exploratory model and plotted the percentage of resin acid sorption as a function of the pH conditions, the associated chemical's log KOC value, and the TSS concentration (Fig. 6) [adapted from Meyer et al. (2011)]. The KOC is the equilibrium sorption coefficient of the chemical normalized to organic carbon. The pH-dependent KOC values were calculated using an equation from Franco et al. (2009), which enables estimating KOC values of a wide range of organic acids by means of pKa and log KOW values (Makris, 2003). A more detailed description on the determination of the KOC values is provided in the Supplementary Data.
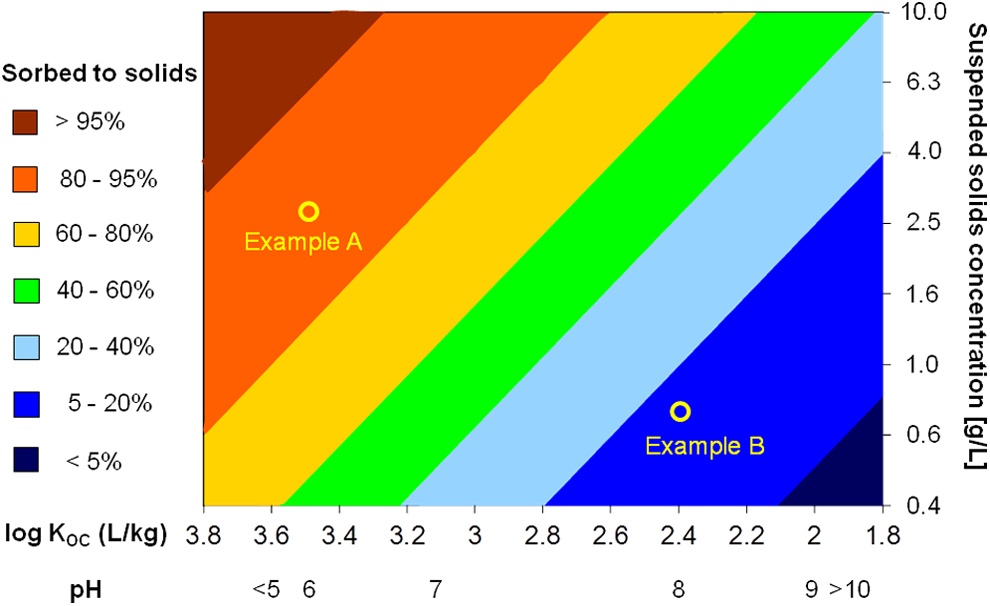
Calculated percentage of resin acids that are sorbed to suspended solids in pulp mill wastewater. The x-axis delineates the sorption coefficient (log KOC) and the associated pH. The y-axis refers to the concentration of suspended solids in the influent of primary clarifiers. Example A—in wastewater containing 3 g/L suspended solids at pH 6, >80% of the resin acids are sorbed to solids. Example B—in wastewater containing 700 mg/L suspended solids at pH 8, <20% of the resin acids are sorbed to solids. In Example A, upfront solids settling have the potential to notably diminish the resin acids load in the stream that goes to the anaerobic digester.
In Figure 6 the fraction of resin acids that is sorbed to suspended solids is indicated by different colors. Based on these equilibrium partitioning calculations, the extent of resin acids that might be subject to settling can be assessed. With increasing suspended solids concentrations and decreasing pH within a primary clarifier, the extent of resin acids that are associated with suspended solids increases, while shifting the position of those compounds on the map in Figure 6 to the upper left. Sorption of resin acids on suspended solids may further increase along with an increasing fraction of fiber-like material in the wastewater (Makris, 2003) (Supplementary Data).
As outlined above, an enhanced upfront removal of suspended solids can diminish the adverse effects of two potential process inhibitors at the same time. First, the TSS concentration in the influent of anaerobic reactors can be decreased, which diminishes the accumulation of suspended solids in the sludge bed, and as a consequence, the deterioration of the settleability of the anaerobic granular sludge. The latter can lead to biomass washout episodes. Second, by removing an additional amount of particles before anaerobic treatment, the influent RFA concentrations will be diminished as well.
RFA removal by means of solids settling may be improved by applying coagulants or other chemicals, or by combining various in-mill streams to a composite stream that has a high particle and fiber load and a low pH. A benefit of adding coagulating agents to the primary clarifier would be to also settle smaller particles and colloids, which can contain a notable fraction of the sorbed RFAs (Leiviskä et al., 2009).
The graphical method introduced in this section may involve another potential application. Whereas reported concentrations of RFAs in the final mill effluent are on average 2 mg/L, concentrations of DHA alone range around 1 mg/L (Makris, 2003). RFA concentrations on this order of magnitude can cause toxicity to aquatic organisms downstream of pulp and paper mills (Peng and Roberts, 2000; Makris, 2003), especially in cases of process upsets or spills. The partitioning between the particulate and dissolved phases decides which fraction of the RFAs will settle in areas of calmed flow, and which fraction will be transported within the water column over longer distances. Therefore, measuring the concentration of RFAs in the final effluent and the concentration of TSS in the outfall area may help in the assessment of the environmental impact of pulp and paper mill operation.
Summary
In this study an MVDA was conducted to explore the inhibitory effects of RFAs during anaerobic treatment of mill wastewater. Although a number of studies have systematically investigated the inhibitory effects of RFAs on an experimental scale, there is no known previous study that has closely monitored and conducted statistical analysis on the effects of RFAs in the influent and granular sludge, and other inhibitors during full-scale reactor operation. The most significant inhibitors in the full-scale reactor influent were the RFAs and sulfite. Concentrations of both types of compounds in the influent were positively correlated to VFA effluent concentrations and negatively correlated to the percentage sCOD removal. Also, a linear negative correlation between RFA concentrations in the granular sludge and the percentage sCOD removal was found, although the effect to the latter was relatively small.
The observed variation in sCOD removal, as influenced by the presence of RFAs in the influent, can notably impact the overall costs of wastewater treatment due to the additional required activated sludge treatment and the associated production of biosludge. RFA levels in the wastewater may be diminished by means of enhancing the settling within the primary clarifier or equilization basin before anaerobic treatment. This can be achieved by providing conditions that keep the bulk of the RFAs sorbed to suspended solids and/or by adding chemical agents such as coagulating polymers to improve the solids' settleability.
A graphical method was developed for quick assessment of the extent to which resin acids can be settled out before anaerobic treatment. At a pH lower than 7 in high-solids primary clarifier influent, the majority of resin acids is associated with suspended solids and can be subject to settling or floatation. This graphical method can also be of assistance in assessing the fate of resin acids in the outfall of pulp and paper mills. Due to the toxic and refractory character of some resin acids, adverse effects of these compounds downstream of mills can be expected.
Of all investigated resin acids, DHA is the least degradable compound. After prolonged exposure, DHA is the most abundant resin acid within the anaerobic granular sludge bed of the reactor. At the same time DHA is the least hydrophobic compound of all RFAs and a small part of it is in the dissolved phase of the sludge bed. Concentrations of DHA in the sludge bed of anaerobic reactors should be monitored on a regular basis.
Footnotes
Acknowledgments
The authors gratefully acknowledge funding from the Government of Canada through Genome Canada and the Ontario Genomics Institute (2009-OGI-ABC-1405) as well as the Government of Ontario (GL2-01-004), the Natural Sciences and Engineering Research Council of Canada (NSERC), and Tembec, Inc. They are thankful for the comments from the unknown reviewers.
Supplementary Data
Author Disclosure Statement
No competing financial interests exist.
References
Supplementary Material
Please find the following supplemental material available below.
For Open Access articles published under a Creative Commons License, all supplemental material carries the same license as the article it is associated with.
For non-Open Access articles published, all supplemental material carries a non-exclusive license, and permission requests for re-use of supplemental material or any part of supplemental material shall be sent directly to the copyright owner as specified in the copyright notice associated with the article.