
Abstract
Abstract
Stormwater runoff from urban and agricultural watersheds carries nitrate, which is difficult to remove because it is highly soluble and thought to be relatively inert in abiotic processes such as ion exchange and sorption. Thus, current practice relies on denitrification to capture nitrate in stormwater treatment practices, requiring storage of captured stormwater, anaerobic conditions, and enough residence time for the bacteria to convert nitrate to nitrogen gas. The purpose of this research was to (1) quantify abiotic nitrate removal and removal capacity of two granular activated carbons (GACs), and (2) illustrate use of GACs in stormwater treatment practices. Batch and upflow column experiments found that two commercially available GACs captured nitrate abiotically, although competition between (bi)carbonate and nitrate limited removal of nitrate. Compared with removal of nitrate by denitrification, abiotic capture of nitrate during storm events requires less stormwater storage volume and less residence time to remove nitrate because it accumulates on the media as stormwater passes through the filter. This suggests that nitrate can be removed from stormwater with less storage and smaller treatment practices.
Introduction
U
Sources of nitrate in urban runoff include fertilizers, plant debris, and animal waste (U.S. EPA, 1999). Kayhanian, et al. (2007) analyzed the results from 34 highway water quality stations and a total of 634 storms to determine that nitrate and total Kjeldahl nitrogen (TKN) concentrations increased with increasing antecedent dry period and traffic counts and decreased with an increase in storm rainfall and seasonal cumulative rainfall. The mean and median concentrations were 1.07 and 0.6 mg/L with a standard deviation of 2.6 mg/L for nitrate and 2.06 and 1.4 with a standard deviation of 1.9 mg/L for TKN, respectively. The difference between the mean and median indicates that the concentration distribution was skewed toward higher concentrations and the large standard deviation indicates that the distribution was relatively broad. Kayhanian, et al. (2012) reviewed 15 highway stormwater quality studies around the world where nitrate and TKN were reported, with a mean, median, and standard deviation in nitrate concentration, [NO3−], of 2.13, 1.07, and 2.29 mg/L, respectively. These observations indicate that [NO3−] in runoff from highways varies substantially, both between storms and between locations. [NO3−] in runoff from agricultural practices is also variable, but it is generally higher than that from highways (Stuntebeck et al., 2011).
Removing nitrogen from impacted waters requires an understanding of biotic and abiotic nitrogen cycling. Nitrogen cycling in the environment is dominated by biologically mediated redox processes (Brezonik and Arnold, 2011). Nitrification is the chemoautotrophic oxidation of ammonium (NH4+) to nitrite (NO2−) through Nitrosomanas and to nitrate (NO3−) through Nitrobacter (Stumm and Morgan, 1981). Denitrification is the anaerobic biodegradation of nitrate to nitrogen gas (N2) by bacterial species such as Pseudomonas and Clostridium (Smil, 2000). Such processes are commonly used to remove nitrogen from wastewater, but the short residence time and limited water storage volume provided by stormwater treatment practices are often not sufficient to allow adequate removal of nitrates by denitrification alone, unless significant design changes are incorporated (Kim et al., 2003; Hsieh and Davis, 2005). Although sorption and ion exchange are not among the well-known nitrogen removal processes, recent research (Fig. 1) has shown that materials capture nitrogen, particularly as nitrate, through these abiotic processes.

Literature values for nitrate adsorption (Langmuir) isotherms compared with Hydrodarco 3000 data and isotherm fit (a = 4.44 mg NO3-N/g GAC; b = 0.07 L water/mg NO3-N; R2 = 0.57) at 20–25°C. (C 2009 = Chatterjee and Woo, 2009; G 2011 = Gao et al., 2011; M 2004 = Mizuta et al., 2004; D 2010 = Demiral and Gunduzoglu, 2010; B 2008 = Bhatnagar et al., 2008). GAC, granular activated carbon.
Chatterjee and Woo (2009) found that adsorption of nitrate to chitosan hydrogel beads in a synthetic stock solution at equilibrium was described by the Langmuir isotherm, with the sorption being both temperature and pH dependent. The sorption capacity increased by 14–27% when temperature was decreased from 50°C to 20°C. When pH was decreased from pH 5 to pH 3, the sorption capacity increased by 4–20%, and when pH was increased from pH 5 to pH 8, the sorption capacity decreased by 43–56%. Reported sorption capacities were 90 mg/g for pH 3, initial [NO3−] = 1000 mg/L, at 20°C; but as low as 15 mg/g for pH 8, initial [NO3−] = 50 mg/L, at 30°C. They also found that nitrate could be desorbed after 24 h of mixing under high pH conditions (∼87% desorption at pH 11 and 12) and suggest that electrostatic interactions dominate the removal process (Chatterjee and Woo, 2009). Stormwater runoff is typically between a pH of 7 and 8 and a temperature of 5°C and 25°C, so these results are marginally helpful for stormwater.
Modified corn residue adsorbed nitrate from a synthetic stock solution according to the Langmuir isotherm with a maximum capacity of 81 mg/g at 20°C and 73 mg/g at 40°C (Gao et al., 2011). They found that lower pH resulted in less sorption, which is contrary to the findings of Chatterjee and Woo (2009). Zhang et al. (2007) found that a zeolite sourced from Gongyi, Henan Province, removed 70% of total nitrogen and nearly 90% of NH4+ from lake water and raw wastewater in a simulation of a vertical flow constructed wetland with a hydraulic loading rate of 1000–2500 mm/day (41.7–104.2 mm/h). The authors attribute removal to the high ion-exchange capacity of the zeolite (Zhang et al., 2007).
Granular activated carbon (GAC) made from bamboo residue adsorbed nitrate from a synthetic stock solution with a Langmuir isotherm sorption capacity of 1.25 mg/g for initial [NO3−] = 10 mg/L at 10°C (Mizuta et al., 2004). When the temperature was increased from 10°C to 20°C, the nitrate sorption capacity decreased to 1 mg/g.
Demiral and Gunduzoglu (2010) found that the Langmuir isotherm sorption capacity for nitrate adsorption to GAC was affected by temperature (9 mg/g at 25°C up to 28 mg/g at 45°C) but was not dependent on pH in a synthetic stock solution. When a commercial GAC (coconut shells) was chemically treated with zinc chloride (ZnCl2), the nitrate capture in a synthetic stock solution increased from 1.7 mg/g to 10.2 mg/g (initial [NO3−] = 200 mg/L, 25 ± 2°C, pH 5.5, time = 2 h), and nitrate capture was described by the Langmuir isotherm (Bhatnagar et al., 2008). Bhatnagar et al. (2008) also showed that nitrate capture increased as temperature decreased (similar to Chatterjee and Woo, 2009; contrary to Demiral and Gunduzoglu, 2010) and that nitrate capture was relatively constant for pH 4–11 but decreased for pH 3 because of competition with Cl− (HCl used to adjust pH) and also at pH 12 because of electrostatic repulsion with negatively charged GAC surface.
Clark (1997) found that only GAC mixed with sand, out of nine materials tested, could capture >90% nitrate from natural stormwater. Clark (2000) reports a nitrate removal capacity for GAC of 6 mg/g from batch studies in natural stormwater, but only 0.3 mg/g in long-term breakthrough column studies, and concludes that batch studies are not appropriate for estimating removal capacity for field applications. From these studies, the authors concluded that GAC removes pollutants through sorption and ion exchange (with sulfates) (Clark, 1997, 2000). Additional experiments on natural stormwater found that coconut-based GAC removed nitrate but could export phosphorus (Clark and Pitt, 2011) and that nitrate removal coincides with release of phosphorus initially and chlorides toward the end of the experiments, suggesting ion exchange (Pitt et al., 2010a, 2010b).
Previous studies indicate that although nitrate capture by various sorbents is possible, the following must be considered: (1) the capacity of sorbents varies substantially (0.3–90 mg/g), (2) capacity is affected by temperature and pH, and (3) the removal mechanism is hypothesized to be ion exchange or adsorption. It is possible that the variability in capacity and temperature and pH dependence is because of the variability in sorbent material and manufacturing process, as well as the experimental conditions (primarily [NO3−] range). In this work, abiotic capture of nitrate by GAC is explored. The capacity of two carbon sources is evaluated, and the experimental flow conditions and the effects of competition with other dissolved species are investigated. Finally, the potential use of GAC in stormwater treatment practices for nitrate removal is illustrated.
Experimental Protocols
Two GACs were studied rigorously: Hydrodarco 3000 (HD) and CR830A Low Density Sub-Bituminous (SB). HD (Norit, 2012) is manufactured by high-temperature steam activation of lignite coal and has a bulk density of ∼344.4 kg/m3 (21.5 lb/ft3). SB (Carbon Resources, 2010) is a low-density sub-bituminous carbon produced by high-temperature steam activation of sub-bituminous coal and has a bulk density of approximately 352.4–384.4 kg/m3 (22–24 lb/ft3). Both HD and SB have less than 5% by weight passing #30 sieve (0.600 mm) and less than 5% by weight retained on the #8 sieve (2.36 mm).
Experiments described in the following sections focus on ranges of [NO3−], temperature, and pH that are typical for urban and agricultural stormwater runoff, although the capacity measured in this study will be compared with results in the literature. Two sets of batch studies and four sets of upflow column studies were performed as follows:
1. Media selection batch studies: Experiments were performed to determine which of several materials captured the most dissolved nitrate while also capturing at least some dissolved phosphorus and metals (cadmium, copper, lead, and zinc). HD and SB were chosen as the best at nitrate and metals removal while not releasing phosphate. The experimental protocols, results, and discussion are provided in the Supplementary Data (Supplementary Figs. S1–S6). 2. Isotherm batch studies: Experiments were performed to measure nitrate removal kinetics and capacity at equilibrium under controlled experimental conditions for the two GACs. 3. Upflow column studies: Experiments were performed to understand the breakthrough of nitrate in a nearly saturated flow-through system, at near-constant vertically upward flow rate, for the two GACs. The purpose of these experiments was to identify and quantify specific treatment processes and capacities, when possible. Synthetic stormwater mixed without nitrate was passed through GAC columns to determine how much, if any, nitrate is released from GAC. The GACs used in the column experiments did not release nitrate (data not shown) and thus no correction to the observed [NO3−] in other experiments was needed. Four sets of upflow experiments were performed and each experiment was performed continuously (no dry periods) until equilibrium (inflow concentration = outflow concentration). 3.1 Dispersion and contact time experiments: Sodium chloride (NaCl) was passed through the columns as a conservative tracer (Crittenden et al., 2005) to estimate the dispersion and contact time of flow through the column experiments. Results are provided in the Supplementary Data (Supplementary Fig. S7). 3.2 Capture experiments: Deionized (DI) water was passed through the columns at a near-constant flow rate (15–25 mL/min) for ∼1 h to remove any fine GAC particles, fully saturate the pore space in the GAC, desorb any loosely bound ions on the GAC, and to adjust the pumps before introducing synthetic stormwater. To determine the capture capacity of the GAC to remove nitrate, the supply was immediately switched to synthetic stormwater, which was passed through the columns until equilibrium with the influent synthetic stormwater (10–14 h) was achieved. 3.3 Competition experiments: Each pollutant (e.g., PO43–P) in the synthetic stormwater was mixed separately with nitrate (NO3−–N) and passed through a previously unused column of GAC to determine whether other ions in the synthetic stormwater competed with nitrate for capture sites on the GAC. 3.4 Release experiments: To determine how much previously captured nitrate could be released, DI or potable (tap) water was passed through columns previously tested in the capture experiments (i.e., at equilibrium with synthetic stormwater) until effluent concentrations were at equilibrium (10–12 h).
Isotherm batch studies
For each batch experiment, 500 mL borosilicate glass bottles were acid washed with 10% HCl, rinsed with ultrapure water (Milli-Q, 18.2 MΩ·cm), acid washed with 10% oxalic acid, and rinsed again with ultrapure water (Milli-Q, 18.2 MΩ·cm). After drying, 500 mL of ultrapure water and inorganic salts were added and mixed to represent typical values for natural stormwater, as listed in Table 1. The inorganic salts used were KNO3 (≥99%; Fisher Scientific), KH2PO4 (99.9%, J.T. Baker), NaHCO3 (99.7–100.3%; Sigma Aldrich), CaCO3 (99.5%, J.T. Baker), Na2CO3 (100.1%; Fisher Scientific), MgCO3 (40.0–43.5%; Fisher Scientific), and MgCl2 (99.0–102.0%, J.T. Baker, 99.4%; Fisher Scientific).
Hydrochloric acid (0.06 M HCl, 37%; Sigma Aldrich) was added to adjust the pH to the median stormwater pH of 7.4 (Maestre and Pitt, 2005). Although the median value for conductivity in natural stormwater is 121 μS/cm with a 1.75 coefficient of variation (Maestre and Pitt, 2005), the measured conductivity of the synthetic stormwater was ∼270 μS/cm because of the salts used to create the pollutant concentrations. Thus, the conductivity was not adjusted. Other parameters of natural stormwater such as suspended sediment, bacteria and pathogens, and organic material were not added to the synthetic stormwater to minimize biological activity, limit particle interaction with dissolved compounds to the media, and reduce the number of experimental variables.
Initial samples were collected in acid-washed glass vials and analyzed before adding media to ensure accurate initial pollutant concentrations. Batch test bottles (with media) and blanks (no media) were placed on a Labline Orbital Shaker table at 250 RPM. Samples were collected at several time intervals up to 96 h of mixing, filtered through a 0.45-micron filter to remove particulates, and frozen until analyzed for ion concentrations. Samples were analyzed for [NO3−], [Cl−], and [SO42−] using a Dionex ICS-1100 IC System with a Thermo Scientific AS22 Ionpac exchange column and an AS-DV autosampler.
Upflow column studies
Vertical columns were constructed from a 31-cm long, 5-cm diameter clear PVC and each column was filled with 19–23 cm (150 g) of GAC (typically five replicates of either HD or SB) or 20 cm (∼780 g) of C-33 sand (one replicate) (Paus et al., 2014a, 2014b). Sampling occurred immediately before and after each column through a Luer Lock fitting.
A peristaltic pump was connected to each column to ensure near-constant upward flow through each column. Flow rate varied from 15 to 25 mL/min (0.74 to 1.23 cm/min linear velocity) in these experiments. The peristaltic pumps collected supply water from a 150-L supply tank. Synthetic stormwater was mixed to represent typical stormwater concentrations (Table 1). Nitrate and ortho-phosphate concentrations for the column studies were intentionally set higher than typical urban stormwater to also represent agricultural runoff (Kato et al., 2009; Stuntebeck et al., 2011).
Samples were collected at regular time intervals, filtered through 0.45-μm PTFE filters, and stored in sampling vials until analysis. Nitrate was analyzed colorimetrically (Pritzlaff, 2003). Alkalinity was measured through titration with Bromcresol green indicator and hydrochloric acid (Eaton et al., 1998, method 2320B). For dispersion and contact time experiments using NaCl as a tracer, the effluent conductivity was measured continuously with an Engineered Systems & Design model 72 conductivity meter.
Data analysis
Isotherm batch studies
Equilibrium concentration (Ce) was measured and capture capacity (qe) was calculated as the ratio of the mass of nitrate captured to the mass of GAC in each bottle. The Langmuir isotherm model (1) was used:
where x is mass of nitrate captured (mg NO3−–N), m is mass of GAC (g), qe is capture capacity (mg NO3−–N/g GAC), a is empirical constant (mg NO3−–N/g GAC), b is empirical constant (L water/mg NO3−–N), and Ce is equilibrium concentration of nitrate (mg/L).
Upflow column studies
From the flow rate and [NO3−], the mass of nitrate removed by GAC was calculated and plotted as a function of pore volume (Supplementary Figs. S8 and S9). Note that when the mass of nitrate captured by GAC was normalized by the mass of GAC in each column, the result is the capture capacity (mg NO3−–N/g GAC). Similarly, the mass of nitrate released from GAC was calculated from the flow rate and [NO3−] and plotted as a function of pore volume, as shown in Figure 4 (see Supplementary Fig. S10 for SB data). The mass of nitrate released was normalized by the mass of nitrate captured in the capture experiments (Fig. 4) to illustrate the fraction of previously captured nitrate that is released.
Results and Discussion
Abiotic removal
Although no antibiological agents were used, biological removal or transformation of nitrate is unlikely and thus the removal process is believed to be abiotic for several reasons:
1. Batch experiments were mixed for 1 h (Media Selection) or up to 96 h (Isotherm). Although no antibiological agents were used, biological activity is assumed to be negligible because (1) ultrapure (Milli-Q, 18.2 MΩ·cm) water and inorganic salts were used for the experiments, (2) the experiments were contained in acid-washed glassware and sealed between sample collection, and (3) the GAC was not exposed to any obvious source of waterborne denitrifying bacteria before or during the experiment. 2. The upflow column experiments used the same water, materials, and media as the batch experiments. Flow through the experiments occurred continuously for 10–16 h, although the contact time with the media was approximately 11 min (HD, Table 1 and Supplementary Table S1), 19.1 min (SB, Supplementary Table S1), and 5.4 min (Sand, Table 1 and Supplementary Table S1). 3. The 100% sand replicates in all experiments removed minimal, if any, nitrate.
Isotherm batch studies
The Langmuir isotherm model (1) was fit to data collected for HD and compared with Langmuir isotherm parameters and range of equilibrium concentrations reported in the literature (discussed previously), as shown in Figure 1. The results from HD extend to smaller equilibrium concentrations compared with literature values, and better represent concentrations found in urban and agricultural stormwater. The literature did not provide data below ∼0.6 mg/L NO3−–N. Literature values for sorption capacity vary substantially, ranging across approximately one order of magnitude for any given equilibrium [NO3−]. The capture capacity for HD is similar to that of bamboo powdered charcoal and commercial activated carbon studied by Mizuta et al. (2004), but is generally less than that of other GACs shown in Figure 1. This is likely because the other GACs were modified (modified corn residue, Gao et al., 2011), treated to improve performance (Bhatnagar et al., 2008; zinc chloride treated, Demiral and Gunduzoglu, 2010), or specifically fabricated (chitosan hydrobeads, Chatterjee and Woo, 2009). HD, as tested, is commercially available and does not require any additional treatment or modification.
Upflow column studies
Capture experiments
Five replicates of 100% GAC are shown in Figure 2 for HD (see Supplementary Fig. S11 for SB data). The experiments indicate that 100% of the nitrates (C/C0 = 0) were captured until ∼10 pore volumes had passed through the columns. After 10 pore volumes, the effluent [NO3−] increased and exceeded the influent concentration (C/C0 > 1) at between 20 and 30 pore volumes. The effluent concentrations peaked at 120% of the influent and then gradually decreased to equilibrium (C/C0 = 1) after ∼60 pore volumes. Similar results were obtained for SB, as shown in Supplementary Figure S8. Note as shown in Figure 2, the effluent nitrate concentration of 100% sand column [Sand (1)] quickly reached equilibrium with the influent (C/C0 = 1), suggesting that sand has little, if any, capacity to remove nitrate from synthetic stormwater. In general, all five replicates of HD produced similar results with slight variations (Table 3 and Supplementary Table S2, Fig. 2). The differences could be because of variations in flow rate (Table 2) or trapped air pockets (or lack thereof). Although the capture capacity peaked, the capture capacity at equilibrium is more representative of the capture capacity that could be expected in field applications.
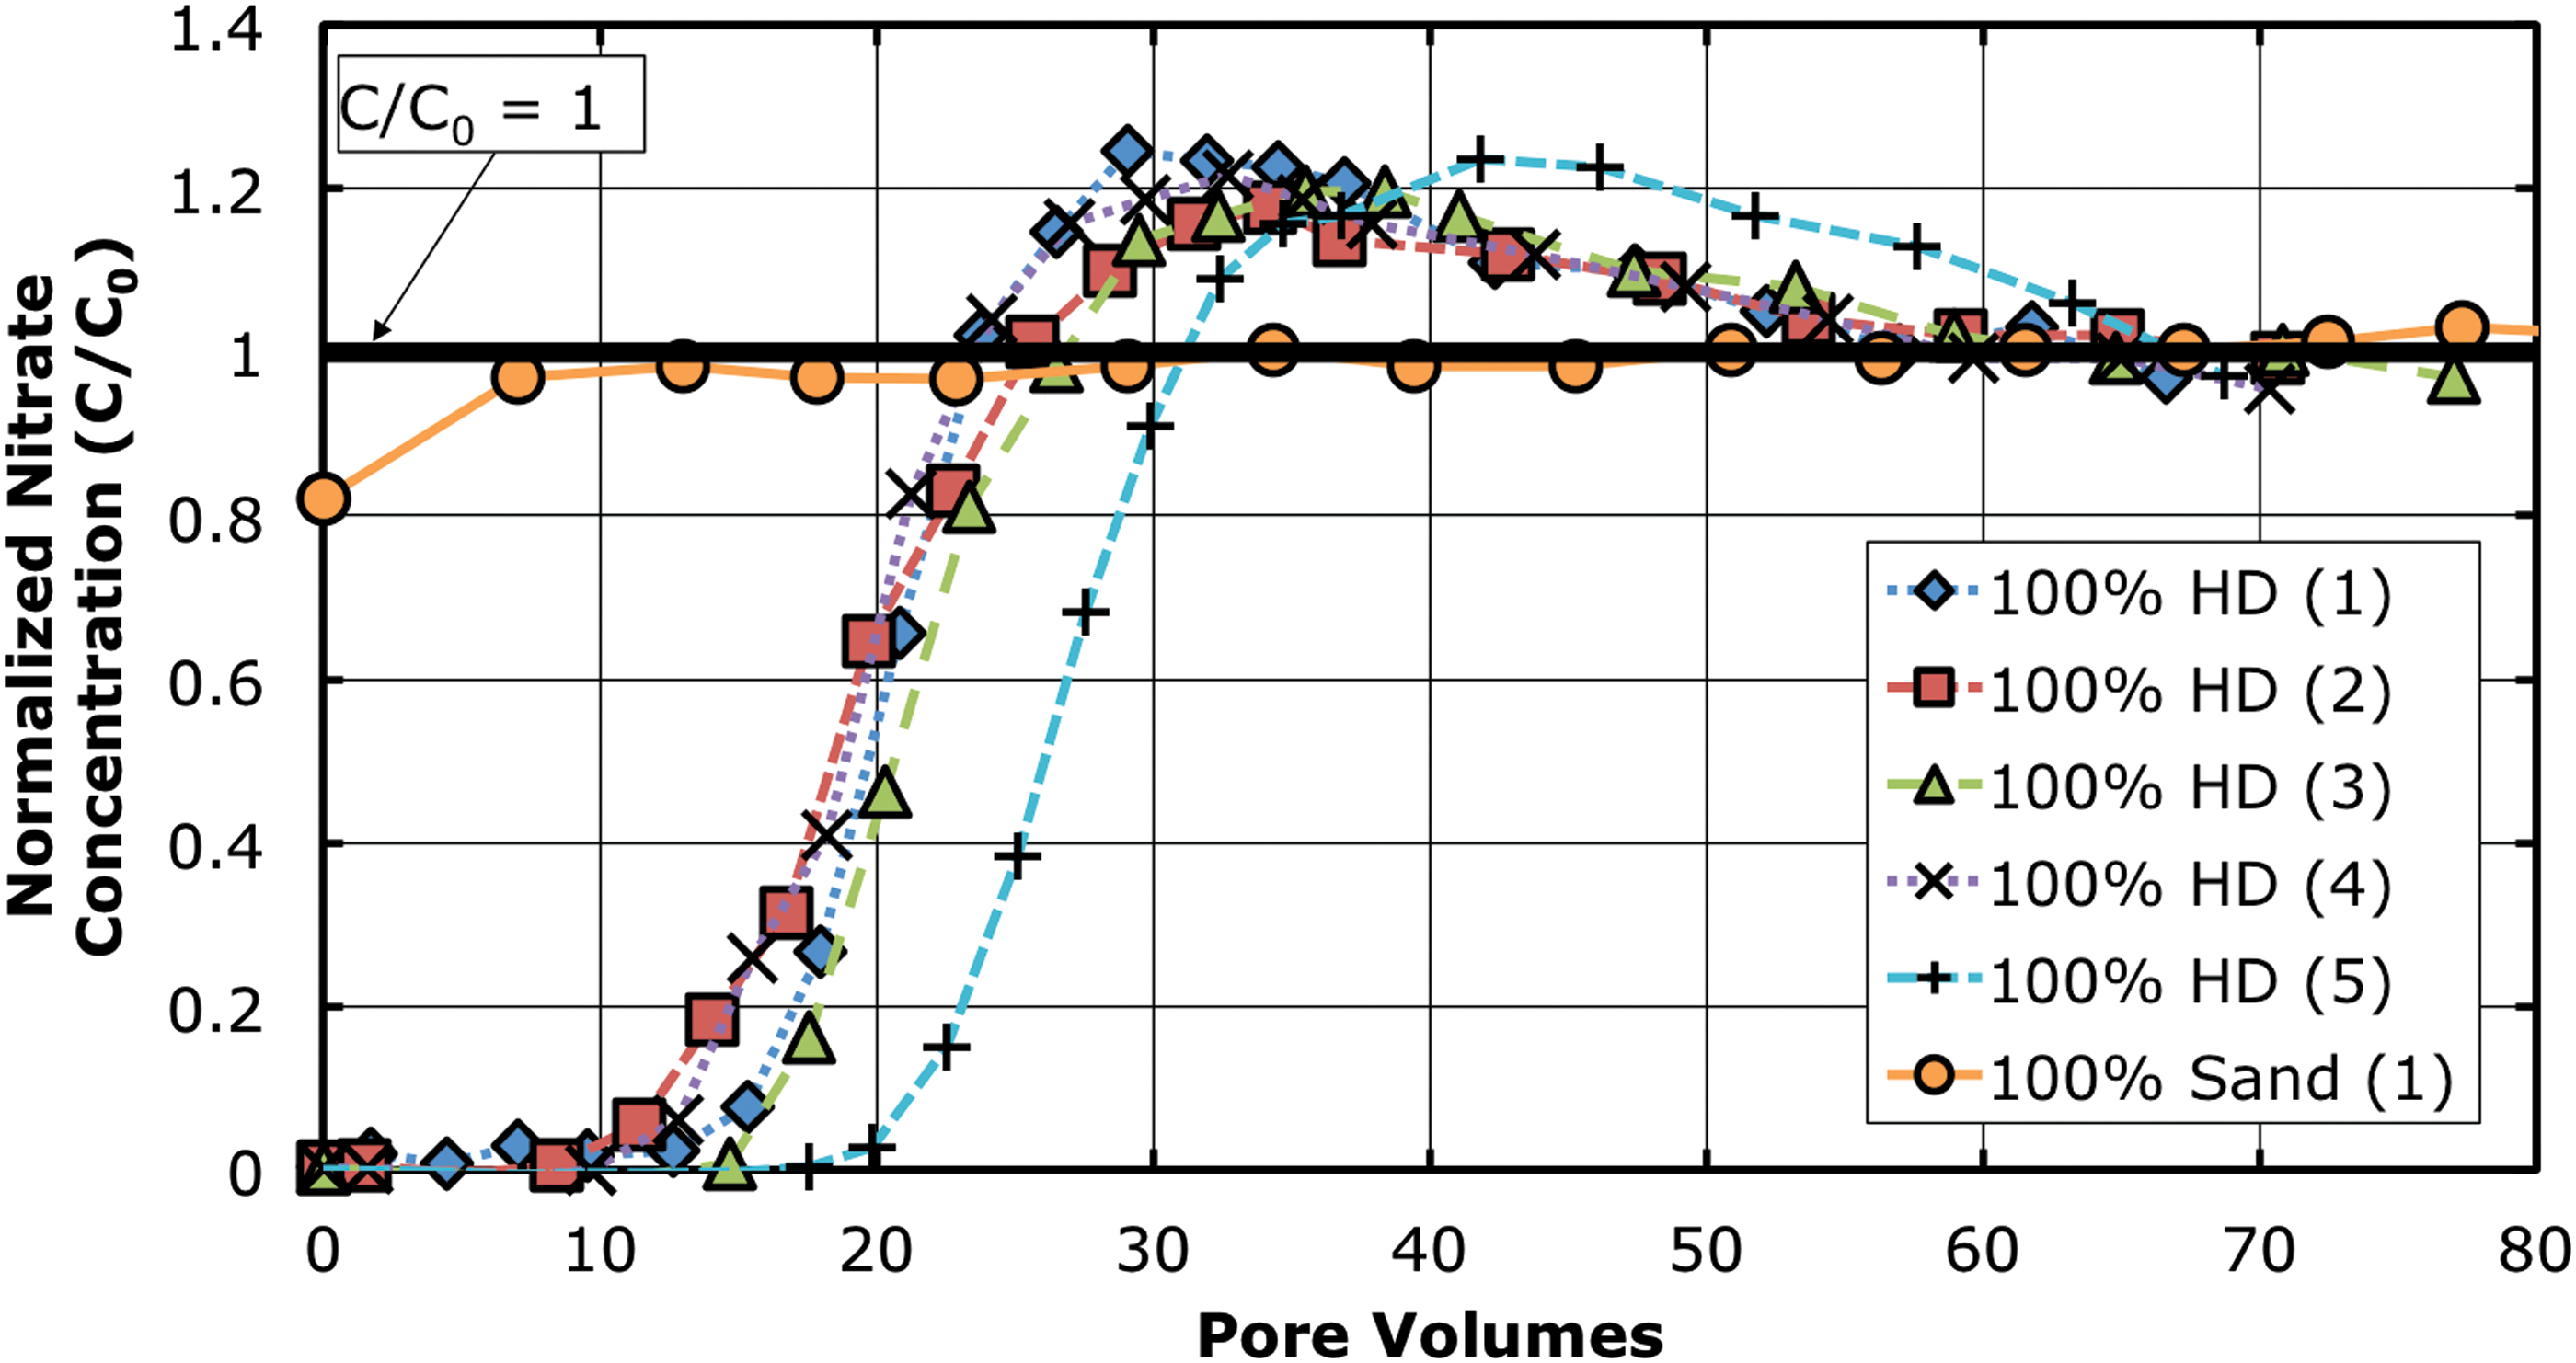
Upflow column experiments: breakthrough curves for nitrate sorption experiments for five Hydrodarco (HD) columns and one C-33 sand column. (see Supplementary Fig. S11 for Sub-Bituminous data).
DI, deionized water; HD, Hydrodarco; N/A, not applicable; SS, synthetic stormwater; TW, tap (potable) water.
The equilibrium capture capacity for four of the five HD replicates is approximately 0.12 mg NO3−–N/g GAC. The other replicate [HD (5)] was identified as possibly having better contact between the GAC and the synthetic stormwater, resulting in a larger capture capacity (∼0.17 mg NO3−–N/g GAC).
Competition experiment
The effluent [NO3−] exceeded the influent (C/C0 > 1) after 20–30 pore volumes (Fig. 2, Supplementary Fig. S8). A possible explanation is competition of ions on the GAC. At the beginning of an experiment, the GAC has many sites available for the attachment of ions. Initially, most ions attach to the GAC but as the capacity is approached, the ions begin to compete for sites. Some ions will bond more strongly than nitrate to GAC, resulting in release of nitrate ions. These released nitrate ions in addition to the nitrate ion already present from the influent may explain why the [NO3−] in the effluent exceeded that of the influent.
Additional experiments were performed to test this hypothesis, which involved separating each of the source compounds (e.g., KH2PO4) used to represent pollutants (e.g., PO43−–P) or water chemistry (e.g., alkalinity) in the synthetic stormwater (Table 1) and dosing a previously unused single column of GAC with a single source compound and nitrate (NO3−–N), as shown in Figure 3. One column experienced no competition because only nitrate was added to the synthetic stormwater (KNO3 only). Three pollutant combinations (KNO3 only, KNO3 + KH2PO4, and KNO3 + CaCO3) behaved similarly and the GAC captured 1.076 mg NO3−–N/g GAC (n = 3, standard deviation = 0.021 mg NO3−–N/g GAC). For the pollutant combination of KNO3 + Na2CO3, the GAC captured 0.444 mg NO3−–N/g GAC whereas for KNO3 + MgCl2, the GAC captured 0.639 mg NO3−–N/g GAC. Thus, the order of capture capacity (mg NO3−–N/g GAC) is as follows: KNO3 + Na2CO3 = 0.444 < KNO3 + MgCl2 = 0.639 < KNO3 only = KNO3 +KH2PO4 = KNO3 + CaCO3 = 1.076 mg NO3−–N/g GAC.

Upflow column experiments: normalized nitrate concentration (top) and sorption capacity (bottom) for competition experiments with separated source compounds and activated carbon (Hydrodarco) (see Table 1 for pollutants concentrations). For comparison, one replicate [HD (1), Fig. 2] of nitrate breakthrough with mixed synthetic stormwater is also shown.
First, it is important to note that the columns dosed with NO3−–N only [5 mg/L (0.357 mM) KNO3–N], NO3−–N with KH2PO4 [0.25 mg/L (0.008 mM) KH2PO4–P], and NO3−–N with CaCO3 [5 mg/L (0.05 mM) as CaCO3] perform similar to each other and do not exceed the influent [NO3−]. The column dosed with NO3−–N and MgCl2 [130 mg/L (1.299 mM) as CaCO3] appears to slightly exceed the influent (C/C0 ∼ 1.05), but this may be within the measurement error. The column dosed with NO3−–N and Na2CO3 [34 mg/L (0.340 mM) as CaCO3] is the only column that appears to increase to a C/C0 = 1.2, similar to the columns shown in Figure 2. This suggests that either sodium (Na+) or (bi)carbonate (HCO3−/CO32−) is competing with nitrate, where (bi)carbonate is more likely than sodium because (bi)carbonate and nitrate are both negatively charged.
It is also important to note that breakthrough required substantially more pore volumes in this experiment (∼200 pore volumes, Fig. 3) than previous experiments (∼30 pore volumes, Fig. 2), resulting in a substantially larger capture capacity (∼1.1 mg NO3−–N/g GAC, Fig. 3) than previous experiments (∼0.12 mg NO3−–N/g GAC). The columns dosed with NO3−–N (KNO3) only, KH2PO4, and CaCO3 reached equilibrium (100% breakthrough) at ∼200 pore volumes and the column dosed with Na2CO3 required approximately 100 pore volumes before the effluent [NO3−] exceeded the influent [NO3−]. This supports the hypothesis that nitrate competes with other ions, particularly bi(carbonate), for capture by GAC. The increase in capture capacity also suggests that competition of ions in previous experiments is significant, because the GAC captures more nitrate when the pollutants are separated than mixed synthetic stormwater. Also, because the columns dosed with KH2PO4 and CaCO3 perform similarly to the column dosed with KNO3 only, it is assumed that KH2PO4 and CaCO3 do not provide noticeable competition with nitrate on GAC at concentrations typical of agricultural stormwater runoff.
The data shown in Figure 3 and Table 4 suggest that nitrate and (bi)carbonate are captured by GAC before any breakthrough occurs. As capacity is approached, the (bi)carbonate begins to outcompete the nitrate, causing the effluent [NO3−] to exceed the influent [NO3−]. The reason that competition is not evident in the column dosed with CaCO3 could be because the total carbonate concentration is a factor of ∼7 less than the column dosed with Na2CO3 [5 mg/L (0.05 mM) of CaCO3 vs. 34 mg/L (0.340 mM) Na2CO3 as CaCO3].
The competition and KNO3 only experiments used Hydrodarco media.
Competition = Capture Capacity (KNO3 only) − Capture Capacity.
GAC, granular activated carbon.
Release experiments
The capture experiments provide columns in equilibrium (i.e., saturated) with a [NO3−] = 5.14 mg/L NO3−–N. Release experiments were performed ∼2.5 days after the capture experiments to determine how much, if any, nitrate would be released in the presence of nitrate-free water by pumping DI water and potable (tap) water through the saturated columns. The results from the release experiments are shown in Figure 4 (see Supplementary Fig. S11 for SB data). Note that the effluent [NO3−] was normalized by the influent [NO3−] from Figure 2 (5.14 mg/L NO3−–N). As shown in Table 2, two additional columns [HD (6) & HD (7)] were constructed with unused GAC and dosed with synthetic stormwater without nitrate. These columns did not release any background nitrate, suggesting no adjustment to the capture experiments is required.

Upflow column experiments: nitrate concentration normalized by the influent nitrate concentration from Figure 2 (top) and fraction of nitrate mass released from Hydrodarco (bottom) in desorption experiments with deionized (DI), potable (tap), and nitrate-free synthetic stormwater (w/o NO3−–N). (see Supplementary Fig. S11 for Sub-Bituminous data).
During the capture experiments, the columns were filled with synthetic stormwater containing [NO3−] = 5.14 mg/L NO3−–N, which is C/C0 = 1. Between the capture and release experiments, this water is stored within the pore volume of the columns so the initial normalized [NO3−] at the beginning of the release experiments is expected to be close to one (C/C0∼1). The effluent concentration in the columns with HD was initially 80–90% of the influent concentration from the capture experiments (Fig. 4), which approximates expectations. Within 30–40 pore volumes, the effluent concentration was less than 10% of the capture experiment influent and close to equilibrium because the normalized concentration is nearly constant.
As shown in Figure 4, both HD replicates initially released previously captured nitrate. HD (2) released ∼80% after ∼50 pore volumes, whereas HD (3) released ∼30% after 15 pore volumes, but then removed nitrate from the influent tap water. The background [NO3−] in tap water was measured as ∼0.9 mg/L NO3-N (0.2 C/C0), which partially explains the difference between HD (2) and HD (3). The release experiments show that a filter with the HD or SB GACs has the potential to release previously captured nitrate when clean water passes through. This is a concern for stormwater treatment because the [NO3−] in stormwater can vary substantially over time, although tap water may be more representative of low [NO3−] stormwater than ultrapure water.
Estimate of Field Performance
It is important to note that the experiments already described were conducted in a laboratory setting with synthetic stormwater. The response of a GAC filter while treating actual stormwater will likely be different because of several reasons, including media clogging, biological activity in field applications, and water quality parameters present in actual stormwater that were not included in these experiments, among others. Water quality characteristics of urban and agricultural stormwater also vary substantially (Kayhanian, et al., 2007, 2012; Stuntebeck et al., 2011), depending on land use, rainfall characteristics, soil types, and stormwater management systems. The results of these experiments may not predict the actual field performance, but can be used to approximate what may be observed in the field.
Practical application of this technology for treating stormwater runoff requires understanding of capacity, lifespan, and maintenance. The expected lifespan of a field application depends on the rainfall, contributing area, and pollutant concentration, which vary. An estimate, however, of field performance can be made for a hypothetic rainfall, watershed, and filter design. For example, assume a 5-cm (2-inch) rainfall event occurs over a 1-ha parking area with 90% impermeable surface area, which generates 430 m3 of runoff according to Equation (2) (Schueler, 1987).
where WQV is water quality volume (m3), P is rainfall (cm), A is watershed area (m2), and I is percentage of impervious cover (%). The WQV is the amount of runoff that a stormwater treatment practice captures and treats without overflow. Assuming the average [NO3−] = 0.6 mg/L, the total NO3−–N mass in the surface runoff from this storm is 258 g (430 m3 × 0.6 mg NO3−–N/L = 258 g).
If this runoff and nitrate load are routed to a stormwater filter composed of GAC with a capture capacity similar to that of the upflow column experiments (0.12 mg NO3−–N/g GAC), then the amount of GAC required to capture the nitrate load from one storm is 2150 kg (258 g NO3−–N/0.12 mg NO3−–N/g GAC = 2150 kg). This amount of GAC would cost ∼$14,220 (2015 USD), but additional cost would be required to install the filter (labor, equipment, materials other than GAC, etc.). If the nitrate captured by the GAC could be removed through denitrification after each storm event, the filter could be sized to treat a single storm. Denitrification requires an anoxic environment and in situ denitrification has been observed in some filter designs used for surface runoff treatment today (Passeport et al., 2009; Brown and Hunt, 2011; Luell et al., 2011). If practical, denitrification could regenerate the activated carbon between storm events and a GAC filter will provide sustainable nitrate treatment of urban and agricultural runoff, although this topic would require more research to understand the minimum requirements and limitations.
Summary
Two GACs were tested and found to capture dissolved nitrate abiotically. The short contact time and inorganic characteristics of the influent synthetic stormwater suggest that the nitrate is captured by ion exchange, but (bi)carbonate may compete with nitrate for capture by GAC. The results of this study have the potential to improve stormwater treatment practices and water quality by providing an understanding of the capacity and application of a GAC filter to stormwater treatment. Although using GAC to treat urban or agricultural stormwater runoff can quantifiably and reliably remove dissolved nitrate, additional research is needed to determine whether a filter that combines denitrification with nitrate removal by GAC will sustainably regenerate removal capacity, which could reduce the typical size of the filter.
Footnotes
Acknowledgments
The authors thank the Minnesota Pollution Control Agency for funding this research through its Federal Clean Water Act Section 319 grant program, project B43205 c.o. 1–3. The authors thank Greg Johnson the project manager for steering us through the reporting process. The authors thank Norit Americas and Carbon Resources, Inc. for donating the GAC media for these experiments. The authors also thank several undergraduate and graduate students for assisting with the experiments described herein: Anne Haws, Lanre Adekola, Elliot Spronk, Laina Breidenbach, and Ugonna Ojiaku. The authors also thank Professors Jian Peng (University of Saskatchewan) and Peter Weiss (Valparaiso University) for their helpful insight and advice. Finally, the authors thank Professor Paul Capel (University of Minnesota) for providing timely laboratory space to conduct the experiments while primary laboratory space was under renovation.
Author Disclosure Statement
No competing financial interests exist.
References
Supplementary Material
Please find the following supplemental material available below.
For Open Access articles published under a Creative Commons License, all supplemental material carries the same license as the article it is associated with.
For non-Open Access articles published, all supplemental material carries a non-exclusive license, and permission requests for re-use of supplemental material or any part of supplemental material shall be sent directly to the copyright owner as specified in the copyright notice associated with the article.