
Abstract
Abstract
Many studies have shown that both Chironomid larvae and Microcystis aeruginosa would form disinfection by-products (DBPs) under chlorination or chloramination. However, in the natural state, Microcystis aeruginosa and Chironomid larvae exist together. DBPs of chlorination between Chironomid larvae and Microcystis aeruginosa were widely assumed to be “black box.” This study focused on effects of Microcystis aeruginosa on DBP formation during the chlorination of Chironomid larvae metabolites. Results of the study suggest that the presence of Microcystis aeruginosa not only influences the concentration of DBPs from Chironomid larvae metabolism, but also changes the trend of individual DBPs. Results suggest that Microcystis aeruginosa may change the trend of chloropicrin (TCNM), and Microcystis aeruginosa may promote TCM, 1,1-DCP, 1,1,1-TCP, and TCNM formation, while inhibiting the accumulation of DCAA and TCAA. Results illustrate the mechanism of Microcystis aeruginosa participating in DBP formation during chlorination of Chironomid larvae.
Introduction
D
NOM, such as humic acid and fulvic acid, is a well-known precursor of DBPs. A recent study conducted by Fang et al. (2010b) and Huang et al. (2009) indicates that algal cells also affect DBP generation during chlorination. These algal cells contain large amounts of organic nitrogen, such as polysaccharoses, proteides, proteins, aminophenol, and other organic acids, which transform into nitrogenous DBPs after their dissolution and following chlorination (Zhang et al., 2012; Chu et al., 2015a). With this in mind, many researchers have begun to study the effects of algae on water disinfection as it relates to eutrophic water sources (Sun et al., 2007).
Water eutrophication is often accompanied by the rapid population growth of Chironomid larvae, which is known to occur in reservoirs, lakes, and stagnant water sources as a result of high oxidation. Chironomid larva cannot be effectively controlled by the conventional disinfecting methods because the resulting biomass or debris could potentially harm the sensory indicators of the person administering the treatment (Abdullah et al., 2013). The frequent occurrence of algal blooms in drinking water reservoirs causes problems to water supply. One major problem is the release of algal organic matter, including extracellular organic matter (EOM) and intracellular organic matter, in high concentrations to water sources. EOM are the metabolites excreted from algal cells into the surrounding environment (Fang et al., 2010b).
During the chlorination process, total organic carbon (TOC), types of organic precursors, pH, temperature, ultraviolet (UV) absorbance, bromide (Br-), and reaction time showed different impacts on the DBP formation (Sun et al., 2014). The THMs and HAAs contents were increased with increasing reaction time and chlorine dosage, whereas the unstable DBPs, such as HANs and haloketones (HKs), remained relatively stable at the same time. Higher pH led to an increase of THMs, but a reduction of HAAs, dichloroacetonitrile (DCAN), and 1,1,1-trichloropropanone (1,1,1-TCP) generation.
In regard to DPBs formation, the effects of alga on Chironomid larvae metabolites remain unknown, specifically when it relates to eutrophic water as a water source. This study will investigate the generating profiles of chlorination DPBs, with the coexistence of alga (Microcystis aeruginosa) and Chironomid larvae metabolite dissolution under the varying parameters of pH, temperature, chlorine concentration, and reaction time.
Materials and Methods
Preparation of the Microcystis aeruginosa metabolite dissolution
Seeds of axenic cultures of Microcystis aeruginosa were obtained from the Culture Collection of Algae at the Institute of Hydrobiology, Chinese Academy of Sciences, China. Microcystis aeruginosa was cultivated in 250-mL flasks containing 150-mL BG11 media under a fluorescent lamp with an automated 12-h light/12-h dark cycle in an incubator at 28°C. Algal cells were grown for different periods to achieve exponential (27 days). In this research, we extracted different amounts of (the number of algal cells about 108, 109, 1010) count/L exponential phase of algae. Then, algal cell suspensions were filtered by a 0.45 μm membrane and the EOM of Microcystis aeruginosa was obtained as the resulting filtrate was centrifuged then the resulting supernatant liquid through 0.45 μm fiberglass membrane and the resulting filtrate is the Microcystis aeruginosa EOM.
Preparation of the Microcystis aeruginosa Chironomid larvae metabolite dissolution
Thirty active Chironomid larvae of similar size were placed into a beaker containing 1 L of algae solution with 108, 109, 1010 count/L cells in stable exponential phase and were, respectively, cultured at 25 + 1°C for 72 h. The supernatant was then obtained with centrifugation (4,000 rpm) and filtration (0.45 μm membrane filter) processes.
Experimental procedures
Preprocessing of trichloromethane (TCM), CH, trend of chloropicrin (TCNM), DCAN, and trichloroacetonitrile (TCAN) sample according to USEPA Method 551.1. The pretreatment process is shown in Fig. 1. Preprocessing of DCAA and TCAA sample according to USEPA Method 552.3. The pretreatment process is shown in Fig. 2.
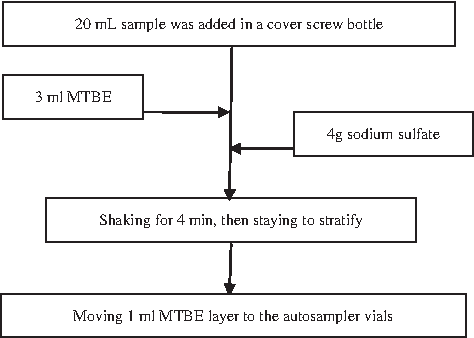
TCM, CH, TCNM, DCAN, and TCAN of sample pretreatment process. DCAN, dichloroacetonitrile; TCAN, trichloroacetonitrile; TCM, trichloromethane; TCNM, trend of chloropicrin.
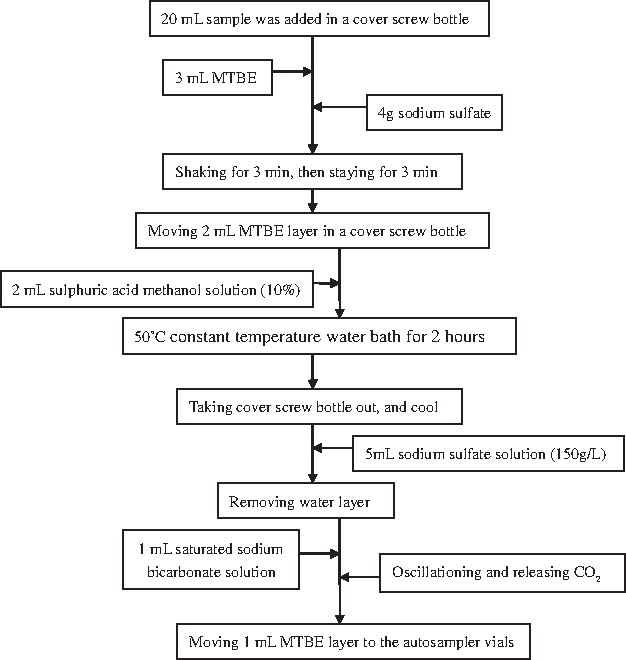
DCAA and TCAA of sample pretreatment process. DCAA, dichloroacetic acid; TCAA, trichloroacetic acid.
Analytical methods
Analysis of THMs, HAAs, HANs, HKs, CH, and TCNM was carried out on gas chromatography (GC) (Agilent 7890) with an electron capture detector (ECD) 1415. The THMs, HANs, HKs, CH, and TCNM concentrations were measured by liquid–liquid extraction procedure by methyl tert-butyl ether (MTBE) and acid methanol according to U.S.EPA Method 551.1 (2003). AHP-5 fused silica capillary column (30 mm × 0.25 mm I.D. with 0.25 mm film thickness) was used. The GC-ECD operating conditions were as follows: detector, 290°C; injector, 200°C; injection volume, 1 mL; and temperature program, 35°C for 5 min, ramped to 75°C at 10°C/min, held for 5 min, ramped to 100°C at 10°C/min, and then held for 2 min. The limit of detection of TCM, CH, TCNM, DCAN, and TCAN was 0.055, 0.005, 0.002, 0.001, and 0.002 μg/L.
For HAAs analysis, the samples were pretreated using an extraction/derivatization procedure with MTBE and acid methanol according to U.S.EPA Method 552.3 (2003). The column used was an HP-5 fused silica capillary column (30 mm × 0.25 mm I.D. with 0.25 mm film thickness). The injector, ECD, and GC oven temperature program for compounds other than HAAs were as follows: injector temperature: 200°C; ECD temperature: 290°C; and oven temperature: 35°C for 9 min, ramp to 40°C at 2°C/min, hold for 8 min, ramp to 80°C at 20°C/min, ramp to 160°C at 40°C/min and hold for 4 min. The temperature program for the HAAs was as follows: injector temperature: 210°C; ECD temperature: 290°C; and oven temperature: 30°C for 20 min, ramp to 40°C at 1°C /min, ramp to 205°C at 20°C/min, and hold for 4 min. The limit of detection of DCAA and TCAA, respectively, was 0.020 and 0.019 μg/L.
Results and Discussion
Effect of Microcystis aeruginosa generation of DBP formation on Chironomid larvae metabolites
Figure 3 shows the Chironomid larvae at different concentrations of Microcystis aeruginosa (0, 108count/L, 109count/L, 1010count/L) metabolites, due to the effect of chlorination, leading to a change in the trend of generation of DBPs. The graph shows that the presence of Microcystis aeruginosa may affect not only the concentration of metabolites generated from Chironomid of DBPs but may also affect the trend of individual DBPs. The trends of TCM (a), 1,1-DCP (c), 1,1,1-TCP (d), DCAA (e), and TCAA (f) did not seem to be affected by the Microcystis aeruginosa, and their generation capacity had increased. It is commonly known that the average metabolite of Chironomid larvae and Microcystis aeruginosa of TOC is higher than a single metabolite. While the Microcystis aeruginosa would normally change the trend of the TCNM (b), the formation of TCNM generated in constant fluctuation at 5 μg/L during chlorination of Chironomid larvae metabolite. When in the presence of Microcystis aeruginosa, the concentration of the TCNM increases with increasing chlorine dosage. TCNM, belonging to the family of unstable DBPs, is prone to oxidation and decomposition (Plewa et al., 2004). TCNM decays faster in the presence of free chlorine, compared to chloramines (Joo et al., 2007). The graph in Fig. 1 shows that the presence of Microcystis aeruginosa may inhibit the DCAA and TCAA of Chironomid larvae metabolite, as the generation of DCAA and TCAA requires adequate oxidants. However, the presence of Microcystis aeruginosa releases large amounts of algal toxins, which consume dissolved oxygen. This decreases the amount of dissolved oxygen in the solution, resulting in weak or nonexistent oxidation. Algal toxins then reduce the amount of the oxidizing agent, inhibiting the generation of both HAAs and TCNM.

Chironomid larvae at different concentrations of Microcystis aeruginosa (0■, 108 count/L , 109 count/L  , 1010 count/L
  ) metabolites in the effect of chlorination to generate a change in the trends of DBPs. pH 7.5, chlorination concentration: 20 mg/L, temperature: 20 ± 1°C, time: 48 h. The trends of TCM
Among the DBPs in focus, generation of TCM increased significantly. The formation of TCM generated was 13.08 μg/L during chlorination of Chironomid larvae metabolite, and in the presence of Microcystis aeruginosa with varying counts, TCM concentration increased to 77.68%, 47.1%, and 97%, respectively. It is believed that the formation of TCM increased significantly for two reasons: first, the presence of Microcystis aeruginosa may increase the concentration of the precomposition of TCM; second, Microcystis aeruginosa may promote the formation of unstable DBPs, such as the TCAN, 1,1-DCP, and 1,1,1-TCP. The TCM is the final hydrolysis or oxidation product of these volatile DBPs, such as 1,1,1-TCP, meaning that an increase in these DBPs will further increase the concentration of the TCM, as suggested by the previous study that uses free and combined amino acids (one of the main components of Microcystis aeruginosa) as precursors (Chu et al., 2015b, 2015c).
TOC of Microcystis aeruginosa and Chironomid larvae metabolites
As shown in Fig. 3, Microcystis aeruginosa and Chironomid larvae metabolites of TOC do not indicate a correlation with concentrations of Microcystis aeruginosa. The concentration of TOC is the lowest when the concentration of Microcystis aeruginosa is 109/L. In previous studies, it is suggested that Microcystis aeruginosa and Chironomid larvae exist in a codependent relationship with Chironomid larvae preying on Microcystis aeruginosa and decreasing its population and reducing the opportunity to release metabolites in aqueous solution. At the same time, Microcystis aeruginosa preys on Chironomid larvae metabolic product, further reducing the concentration of the metabolites in aqueous solution. Consequently, Microcystis aeruginosa and Chironomid larvae, in dynamic equilibrium, mutually influence the existence of each other. This may be one reason why the concentration of TOC was at its lowest.
In looking at both Figs. 3 and 4, it is clear that TOC concentration and DBP generation have a significant positive correlation, namely in terms of the TOC concentration, which suggests that the lower its concentration, the less chlorination DBPs are generated.
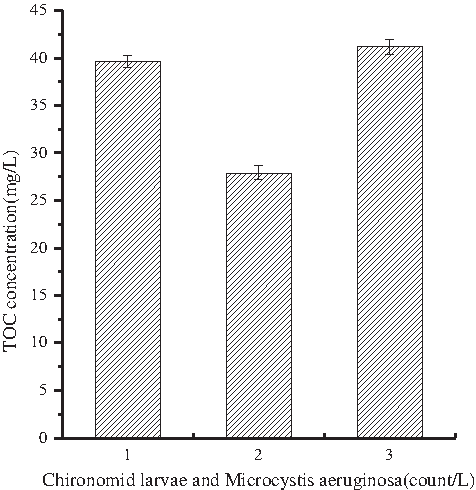
The change in trend of TOC Chironomid larvae with different concentrations of metabolites of Microcystis aeruginosa (108 count/L, 109 count/L, 1010 count/L). TOC, total organic carbon.
Effect of factor
Effect of reaction time
As shown in Fig. 5, the TCM, TCAA, and DCAA concentrations seemed to accumulate with the extension of time, with TCM being the highest. THMs and HAAs held relatively stable chemical properties, both of which were final DBPs. As there was a sufficient amount of chlorine, DBPs increased in concentration with the extension of reaction time (Yang et al., 2007). The concentration of 1,1-DCP1,1,1-TCP, and TCNM reached their maximum values at 48 h and then decreased with prolongation of reaction time. They were unstable DBPs; 1,1-DCP and 1,1,1-TCP could be hydrolyzed and then converted into TCAA and TCM (Reckhow et al., 1990), where at 48–72 h, the yields of TCAA and TCM increased significantly. 1,1-DCP and 1,1,1-TCP decomposition rate stood at 20.1% and 17.4%, respectively, which could be because 1,1-DCP can be oxidized to 1,1,1-TCP (Yang et al., 2007). Overall, the 1,1,1-TCP degradation rate was lower than 1,1-DCP.

Time-dependent formation of DBPs from the chlorination of Microcystis aeruginosa and Chironomid larvae metabolite dissolution at pH 7.5: chlorination concentration: 10 mg/L, temperature: 20 ± 1°C. The error bars represent the standard deviation of replicate measurements (n = 2).
Effect of pH
Figure 6 illustrates that the pH value greatly affected the reaction between chlorine and its precursors. As such, DBPs displayed different trends throughout. While the formation of TCM and DCAA both increased with the pH value, the TCAA concentration increased with pH ranging from 5 to 8 and then decreased slightly from 7.63 to 7.07 μg/L as the pH elevated to 9. The yields of 1,1,1-TCP and 1,1-DCP otherwise decreased consistently with an increase in pH from 5 to 9. The TCNM concentration increased with the pH ranging from 5 to 8 and then decreased. The maximum yield of TCNM was 8.52 μg/L at pH 8. This suggests that pH affects the stability of unstable DBPs. 1,1-DCP, 1,1,1-TCP and TCNM can be hydrolyzed and decomposed in alkaline conditions (Xie, 2004), where the hydrolysis rate is accelerated with the increase in pH (Nikolaou et al., 2000). In addition, 1,1-DCP can be oxidized to 1,1,1-TCP, and TCM is the common hydrolysate of 1,1,1-TCP and TCAA, and therefore, the concentrations of TCM are the highest among these DBPs (Zhuo et al., 2001).

Formation of DBPs as functions of pH after 48-h chlorination of Microcystis aeruginosa and Chironomid larvae metabolite dissolution, chlorination concentration: 10 mg/L, temperature: 20 ± 2°C. The error bars represent the standard deviation of replicate measurements (n = 2).
Effect of temperature
As displayed in Fig. 7, the concentration of TCM, TCNM, DCAA, and TCAA increased with the increase in temperature at the range of 10–30°C. The amounts of 1,1-DCP and 1,1,1-TCP initially increased, and then decreased. Following a temperature increase to 20°C, the concentrations of 1,1-DCP and 1,1,1-TCP reach their highest, at 5.45 and 4.46 μg/L, respectively. The 1,1-DCP and 1,1,1-TCP are both unstable DBPs, which indicates that they will undergo a hydraulic reaction. As the hydrolysis reaction is an endothermic process, raising the temperature to accelerate the rate of hydrolysis gradually decreases the concentration (Reckhow et al., 1990). Therefore, it is suggested that the concentrations of unstable DBPs at different temperatures depend on the balance of their formation and decomposition rates.
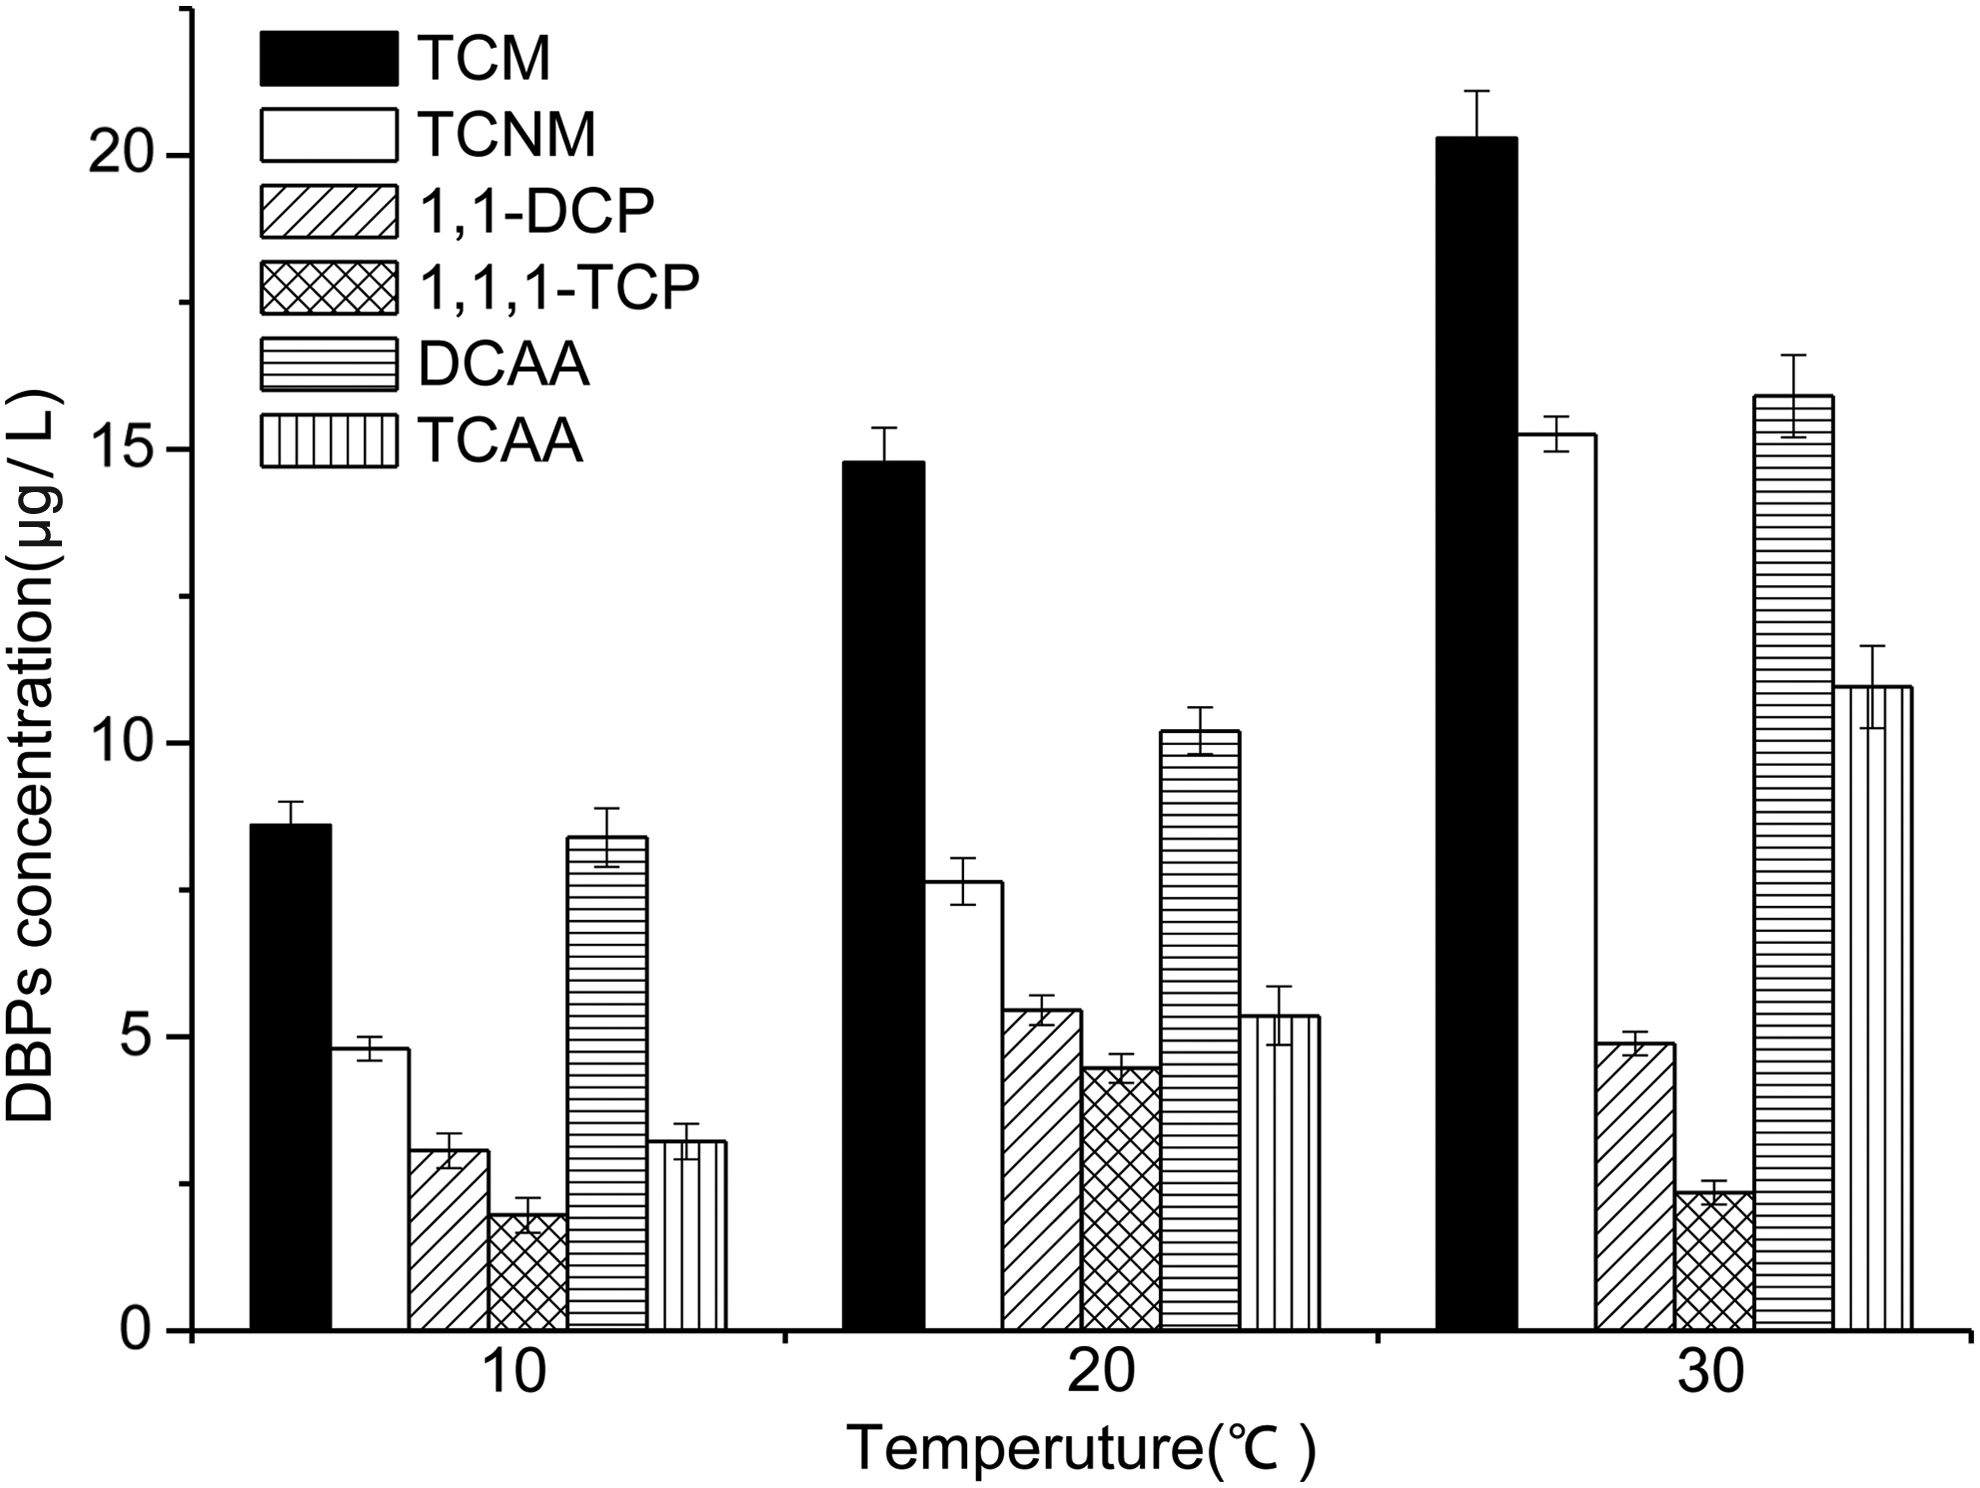
DBP formation at 48 h due to chlorination as a function of temperature (adding 10 mg/L preformed chlorination) of solutions at pH 7.5.
Conclusions
Chlorine disinfection of Microcystis aeruginosa and Chironomid larvae metabolite solutions could produce DBPs, which can affect water quality and safety. This study has shown that the presence of Microcystis aeruginosa may not only influence concentration of DBPs from Chironomid larvae metabolism but may also change the trend of individual DBPs. Also, the concentration of TCM, 1,1,1-TCP, DCAA, TCAA, and 1,1-DCP trends was not affected by Microcystis aeruginosa. Microcystis aeruginosa may cause TCNM and TCAN concentration to rise with an increase in the amount of chlorine, leading to the assumption that Microcystis aeruginosa inhibited the formation of HAAs during chlorination of Chironomid larvae metabolite.
Footnotes
Acknowledgments
The authors would like to thank the Northeast Forestry University's Department of Environmental Science. The project was supported by Foundation item: Supporting Certificate of China Postdoctoral Science Foundation (No. 200902408); and the National Natural Science Foundation of Heilongjiang Province of China (No. E200812).
Author Disclosure Statement
No competing financial interests exist.