
Abstract
Abstract
4-Nitrotoluene (4-NT) is widely used as a basic chemical for the manufacturing of a variety of intermediates, and exposure to this compound can cause environmental and health hazards. Bacterial transformation of 4-NT is often limited due to the presence of nitro group and substrate inhibition. The aim of this study was to optimize the biodegradation of 4-NT and specific growth rate of Rhodococcus pyridinivorans NT2 using Plackett-Burman and response surface methodology design of experiments. Of the process variables screened, 4-NT, MgSO4.7H2O, temperature, and inoculum size (OD) were selected as the most important (p < 0.05) factors. On the basis of central composite design, optimum conditions for 4-NT degradation were as follows: 480 mg/L 4-NT, 0.11 g/L MgSO4.7H2O, 37.5°C temperature, and 1.05 OD inoculum size. Under these culture conditions, an overall 1.20-fold increase in degradation was achieved with a 36 h reduction in total biodegradation time than that obtained at the unoptimized settings. Results of batch growth kinetics of R. pyridinivorans NT2 for various 4-NT initial concentrations revealed that the culture followed substrate inhibition kinetics, with the Andrews-Haldane model given the best fit. Biokinetic constants were estimated by fitting experimental data to several models available from the literature. Taken together, this is the first report in which (i) statistical optimization of culture conditions, (ii) biodegradation behavior in terms of kinetic models, and (iii) a Rhodococcus isolate was used for enhanced biodegradation of 4-NT.
Introduction
E
Several strains of bacteria have been isolated that are able to mineralize 2-NT (Haigler et al., 1994; Mulla et al., 2011), 3-NT (Singh and Ramanathan, 2013; Tian et al., 2013), 4-NT (Haigler and Spain, 1993; Rhys-Williams et al., 1993; Spiess et al., 1998), nitrobenzene (Nishino and Spain, 1995), and dinitrotoluenes (Nishino et al., 2000). Both oxidative and reductive degradation pathways for different nitroaromatic compounds are known and the enzymes and pathways leading to biodegradation have been the subject of several studies (Spain, 1995; Nishino et al., 2000; Anuradha et al., 2015). Despite promising laboratory results, inconsistent performance with removal of NTs has been observed at munitions and industrial wastewater facilities due to (i) the presence of mixture of organic contaminants, including ethanol, ether, and acetone, which are present at much higher levels than NTs (Boopathy, 2014; Huang et al., 2015) and (ii) the inhibitory effects of media ingredients such as sulfates and nitrates that are usually added in the media for culture growth (Sahoo et al., 2010). Although mononitrotoluenes are readily mineralized by many bacterial strains even without prior adaptation, the reported 4-NT degradation rates are within a range of 4–30 mg/L/day. Moreover, an external nitrogen source (as either yeast extract or ammonium) is often present in the mineral salts medium to ensure significant growth (Hudcova et al., 2011).
From the above, it can be concluded that using conventional media constituents and that too at unoptimized levels limits maximum removal efficiency and there is a need to screen and optimize the nutritional requirements and physicochemical cultivation conditions for enhancing the biodegradation of 4-NT. Statistical experimental designs, such as response surface methodology (RSM), have been successfully applied for the optimization of biodegradation of dye (Singh et al., 2010; Jadhav et al., 2015), diesel oil (Huang et al., 2008; Al-Zahrani et al., 2014), kerosene (Ghanem et al., 2015), tetrahydrofuran (Yao et al., 2009), polycyclic aromatic hydrocarbons (Mahanty et al., 2010), chrysene (Ghevariya et al., 2011), chlorophenol (Sahoo et al., 2010), chloroxylenol (Ghanem et al., 2013), 2,4,6-tribromophenol (Zu et al., 2013), omethoate (Yugui et al., 2008), carbamazepine (Ungureanu et al., 2015), and so on. However, to our knowledge, the combined effect of operational parameters on the optimum biodegradation of 4-NT has not been investigated so far.
For design of a suitable biological treatment system, knowledge of growth and degradation kinetics is essential to optimize the operational conditions and meet the effluent quality for discharge into the environment (Sahoo et al., 2011). However, till now, few studies focused on the dynamics of the biodegradation of 4-NT. In addition, aerobic mineralization of 4-NT by bacterial monocultures has seldom been reported. Keeping in view these limitations, the purpose of this study was threefold: (i) to optimize the medium components and cultural parameters using a sequential statistical design of experiments approach; (ii) to assess the biokinetic parameters during biodegradation of 4-NT; and (iii) to evaluate the extent of mineralization in the selected strain. To this end, a Plackett–Burman design (PBD) was used to determine the main and interaction effects of medium components on biodegradation efficiency and growth. An RSM with a central composite design (CCD) was then used to determine the influence of the factors that had significant effects. Finally, the calculation of growth kinetic constants and rate kinetic constants from different models was estimated to find out the quantitative relationship between specific growth rate and substrate concentration, a consideration of variable cell mass yield as well as the decay coefficient.
Materials and Methods
Chemicals
4-NT [C6H4(CH3)NO2, CAS#99-99-0] was purchased from Sigma-Aldrich with 98% purity. Acetone from Sigma-Aldrich was used as the carrier vehicle for all experiments. All other chemicals were purchased from Hi-Media. All chemicals used were of analytical grade.
Microorganism and culture conditions
R. pyridinivorans NT2, previously isolated 4-NT degrading actinobacteria, was used in this study (Kundu et al., 2013). It was routinely grown on basal mineral salts (MSB) slants (pH 7.0 ± 0.2) containing filter-sterilized 4-NT (100 mg/l from stock solution prepared in acetone) at 25°C. Seed culture of the isolate was prepared using the MSB medium, and an 18-h-old inoculum (OD600 = 0.5; ∼1.0 × 10⁷ CFU/ml; ∼1.6 mg CDW/l) was used in the time course biodegradation experiments unless otherwise mentioned. All biodegradation experiments were performed in 500 mL Erlenmeyer flask containing 100 mL of medium, as per the statistical design (detailed in “PBD for screening of medium constituents and culture conditions” and “Optimization of 4-NT degradation with screened process variables by RSM using CCD”).
PBD for screening of medium constituents and culture conditions
A 2-level 12-run PBD in duplicate (Plackett and Burman, 1946) was used to screen nine variables limited to nutrients (4-NT, K2HPO4, KH2PO4, MgSO4.7H2O, and yeast extract,) and physical parameters (pH, temperature, agitation, and inoculum size) at high (+1) and low (−1) levels (Table 1) to maximize the responses (% degradation and specific growth rate). In the 12-run PBD, each row represents an experiment and each column represents an independent variable.
4-NT, 4-nitrotoluene.
Optimization of 4-NT degradation with screened process variables by RSM using CCD
RSM is a sequential, exploratory approach and consists of a group of empirical techniques to study the relationship between a cluster of controlled experimental factors and the measured response. RSM was used to optimize the process parameters for enhancing biodegradation efficiency (%) and specific growth rate that involved four steps: procedures to move into the optimum region, behavior of the response in the optimum region, and estimation of the optimal condition and verification (Sahoo et al., 2010). Once critical factors were identified by screening and significant gross curvature was detected in the design space, the CCD was used to obtain a quadratic model for determining the optimum levels of the screened medium constituents for enhancing biodegradation and the specific growth rate of the strain NT2 (Box and Wilson, 1951). The significant factors selected by PBD as 4-NT (X1), MgSO4.7H2O (X2), temperature (X3), and inoculum size (X4) were further optimized by the CCD. The total numbers of experimental runs carried out were 2
k
+ 2k + n0, where “k” is the number of independent variables and n0 the number of replicate runs performed at center point of the variables. Thus, a total number of 31 experiments were carried out. Table 2 shows the range and levels of the four process parameters. The coded values of independent variables were found from the following equation (Sahoo et al., 2011):
where, Xi is the coded level (−α, −1, 0, +1 and +α) of any independent variable, Ui is the uncoded/actual level of the independent variable, U0 is the uncoded level of the independent variable at its centre point, and ΔU is the step change. In this case, as per the design, the default α value was taken to be 2.
For fitting the experimental results by response surface regression procedure, the following second-order polynomial equation was used:
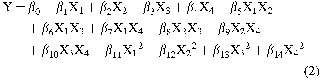
where, Y is the measured, fitted, or predicted response (% degradation and the specific growth rate, two responses in this case); X1, X2, X3, and X4 are the coded independent input variables; β0 is the intercept term; β1, β2, β3, and β4 are the linear coefficients showing the linear effects; β5, β6, β7, β8, β9, and β10 are the cross-product coefficients showing the interaction effects; and β11, β12, β13, and β14 are the quadratic coefficients showing the squared effects cross-product coefficients, showing the interaction effects.
Experimental validation of statistical model
An experimental run was performed at the model-predicted optimum levels of the cultivation parameters to check its validity. The run for the validation experiments were conducted in 250 mL Erlenmeyer flasks containing 100 mL aliquots of the optimized medium. The samples were withdrawn aseptically at appropriate intervals and further analyzed for biomass (OD), dry cell weight, and residual concentration of 4-NT.
Mineralization of NTs by R. pyridinivorans NT2 was checked by estimating the amount of CO2 evolved. Series of flasks (250 mL Erlenmeyer) containing 100 mL MSB medium amended with optimized concentration of 4-NT as the only C and N source were inoculated with a mid-log phase cell suspension and incubated. Total carbon dioxide in gas and liquid phase released (C-CO2, mgC) was measured by headspace gas chromatography (GC).
Modeling of growth and biodegradation kinetics
Batch 4-NT degradation experiments were carried out in Erlenmeyer flasks (250 mL) containing 100 mL of the MSB media with different initial 4-NT concentrations of 1, 1.5, 2.0, 2.5, 3.0, 3.5, 4.0, and 4.5 mM. Samples were taken at regular intervals of time during the experiments and were analyzed for biomass and residual 4-NT concentrations. In this study, the linear and nonlinear growth kinetic models were fitted by linear and nonlinear least squares methods using Windows based CurveExpert v.1.40 software. The details of the deterministic models used (Monod, Andrews-Haldane, Aiba-Edwards, Han-Levenspiel, Wayman-Tseng, and Alagappan and Cowan) are described elsewhere (Kovari and Elgim, 1998; Han and Levenspiel, 1988; Okpokwasili and Nweke, 2005; Edwards, 1970; Wayman and Tseng, 1976; Alagappan and Cowan, 2001; Choi et al., 2008) and given in Supplementary Data.
Analytical methods
Biomass in the samples was determined by measuring its optical density (OD) at 600 nm using a UV-visible spectrophotometer (Model lambda-45; Perkin Elmer). The OD value was then converted to dry cell mass using an appropriate calibration curve by plotting the dry weight of biomass per liter against optical density of the suspension. To determine the amount of remaining 4-NT, samples were periodically withdrawn from the culture (MSB) medium, centrifuged (6,000 g, 15 min), and extracted twice with diethyl ether. Each sample extract was evaporated to dryness at 30°C and redissolved in 0.5 mL methanol. 4-NT was quantitatively analyzed by an HPLC equipped with a UV (254 nm) detector using C18 column (4.6 × 250 mm; particle size: 5 μm) (Young Lin Autochro, S. Korea), using solvent methanol/water (60:40, v/v) as mobile phase at the flow rate of 1 mL/min as per U.S. EPA 8330 (Kundu et al., 2013). The response % biodegradation was calculated using the following formula:
where, C0 is the initial concentration of NTs in the medium and Ct is the concentration at time t. Each experiment was carried out for a period up to 168 h or until the residual concentration of 4-NT in flask was found to saturate with time and amount of biomass. Each result presented was the mean of three independent experiments and reported as average with a standard deviation of ±2.5%.
Carbon dioxide fraction in the gas phase was estimated at the end of experiments using headspace GC (Nucon 5765 Gas Chromatograph) using standard CO2 (Alchemie), by injecting headspace gas sample (0.5 mL) collected at periodic intervals into Porapak Q (80–100 mesh) column, eluted with helium as a carrier gas, and monitored with thermal conductivity detector. Temperature at injector was ambient, column at 60°C, and detector at 150°C. Data were measured using WinChrome06Ex Advanced Chromatography Software v2.0. Quantity of carbon dioxide (mg C) was calculated using the ideal gas law.
Statistical analysis
Experiments were carried out in duplicate and final data were reported in terms of mean values. Statistical experimental designs were generated and analyzed using the statistical software package, Reliasoft Design of Experiment (DOE++; v 9.0.13) with a risk factor (α) of 0.05 (i.e., 95% level of confidence) for both PBD and CCD. Three-dimensional surface plots were constructed for visualization of interaction between significant variables and their optimal values. Statistical analysis of the model was performed to evaluate the analysis of variance (ANOVA). The quality of the polynomial model equation was judged statistically by the coefficient of determination R2, and its statistical significance was determined by an F-test. The significance of the regression coefficients was tested by a t-test. Fit adequacy was checked by different diagnostic tests, which included the presence of outliers, a normal probability plot, Cook's distance, leverage, graphs of residual versus predicted values, and the graphic representation of predicted versus experimental values. Desirability function (Sahoo et al., 2010) was used for simultaneous optimization of all affecting parameters to achieve the highest % degradation and specific growth rate.
Results and Discussion
In this study, the MSB medium was optimized statistically for optimal degradation of 4-NT by R. pyridinivorans NT2. According to the results from literature review and preliminary studies, 4-NT (X1), MgSO4 (X2), K2HPO4 (X3), KH2PO4 (X4), yeast extract (X5), temperature (X6), pH (X7), agitation speed (X8), and inoculum size, that is, OD (X9), were selected to optimize the medium composition using 12-run PBD. The analysis of PBD leads us to identify the most significant factors to proceed to the second phase of experimentation.
Screening of medium constituents and physical parameters using two-level factorial design
All the nine cultivation parameters were investigated for their effects on biodegradation and specific growth rate of R. pyridinivorans NT2 by taking 95% as confidence level (α = 0.05) in statistical analysis of the results. Table 3 presents the ANOVA of percentage degradation and specific growth rate, in which the mean sum of squares (MS) of the model terms was obtained from the ratio of sum of squares and degrees of freedom; the Fisher's F value was calculated by dividing the MS owing to the model by the MS due to error. Generally, a large F value and a corresponding low value of p for a term in the model mean high significance of the term (Montgomery, 1991). Therefore, from the ANOVA table, the term for main effects of process variables in both the responses (percentage degradation and specific growth rate) was highly significant at p < 0.05. To assess the significance of each individual cultivation parameter on percentage degradation and specific growth rate, regression analysis was performed and the results are presented in Table 4. Generally, a large t value associated with a low p value of a variable or factor indicates a high significance of the corresponding model term. Therefore, from the screening experiment, inoculum size (OD) was found to have a maximum effect on the 4-NT degradation activity followed by MgSO4.7H2O, 4-NT, and temperature; however, 4-NT had maximum significant effect on the culture-specific growth rate followed by MgSO4.7H2O, inoculum size (OD), and temperature. All the other factors with p > 0.05 did not significantly affect biodegradation of NTs or the culture-specific growth rate and thus were ruled out. ANOVA for percentage degradation and specific growth rate indicated the F-values to be 34.69 and 20.33 and implied that the model was significant. Based on regression analysis of the model, the coefficient of determination (R2) values were 99.36% and 98.92% along with adjusted R2 values of 96.50% and 94.05% for percentage degradation and specific growth rate, respectively. These values again ensured a satisfactory adjustment of the model to the experimental data. Hence, the four factors inoculum size (OD), MgSO4.7H2O, 4-NT, and temperature had the most significant effect on both % biodegradation and specific growth rate. The remaining factors (agitation speed, pH, concentrations of K2HPO4, KH2PO4, and yeast extract) were fixed at the levels where Y% degradation and Yspecific growth rate were maximum. The higher system responses were obtained at the highest level of MgSO4.7H2O (0.1 g/L), KH2PO4 (2 g/L), yeast extract (1 g/L), temperature (40°C), pH (9), and inoculums size (1 OD) and the lowest level of K2HPO4 (0.5 g/L) and agitation speed (110 rpm).
df, degrees of freedom; SS, sum of squares; MS, mean sum of squares; F, Fisher's F value (calculated by dividing the MS owing to the model by that due to error); P, probability of incorrectly rejecting the null hypothesis when it is actually true. For specific growth rate, R2 0.9892; Adj R2 0.9405. For BR (%), R2 0.9936; Adj R2 0.9650.
ANOVA, analysis of variance.
Significant at p ≤ 0.05.
RSM approach for optimization of operational parameters
The CCD comprises three groups of design points: two-level factorial design points, axial points, and center points. Thus, the relationship and interrelationship of factors were determined by fitting the second-order polynomial equation to data obtained from the CCD experiments. Table 2 presents the matrix of the CCD design with actual values for independent variables and the corresponding two responses (specific growth rate and percentage biodegradation). For maximizing biodegradation efficiency and the culture-specific growth rate, the levels of the four screened process variables, that is, inoculum size (OD), MgSO4.7H2O, 4-NT, and temperature, were varied using the CCD. The four independent variables were studied at five different levels (−α, −1, 0, +1, +α) and a set of 31 experiments was carried out. Based on the results obtained, regression model equations were developed for depicting relationship between the various medium constituents and the responses on percentage biodegradation and specific growth rate. These second-order polynomial model equations for 4-NT degradation were as follows:

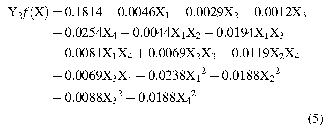
where, Y1 = percentage biodegradation, Y2 = specific growth rate, X1 is 4-NT, X2 is MgSO4.7H2O, X3 is temperature, and X4 is inoculum size (OD). The negative and positive signs of regression coefficients indicate the antagonistic effect and synergistic effect of each variable, respectively.
ANOVA of the models for percentage biodegradation and specific growth rate were obtained as before in the screening study, and are given in Table 5. Large value of F obtained indicated that most of the variations in the response could be explained by the regression model equation for biodegradation in this study. Generally, a large F value with a corresponding small p-value indicates a high significance of the respective coefficient (Tanyildizim et al., 2005; Sahoo et al., 2010). To determine the significance of the regression coefficients in the two models, the results were subjected to student's t-test and the results are presented in Table 6. In 4-NT biodegradation studies, squared model terms X12 and X22 and the interaction of X2 with X3 were highly significant model terms for percentage biodegradation at p < 0.001. In case of the model for specific growth rate, the coefficient of linear term X4 was highly significant (p < 0.001). Also, significance of all the coefficients of the squared model terms (except X32) in the specific growth rate model was high (p < 0.001). On the other hand, the interaction of X1 with X3 was significant model terms for specific growth rate at p < 0.001. The adequacy of a model and goodness of fit were observed through the coefficient of determination (R2). The R2 value ranged between 77% and 90% for both percentage biodegradation and specific growth rate. The value of R2 and adjusted R2 was close to 1.0, which is very high and has advocated a high correlation between the observed values and the predicted values. This means that the regression model provides an excellent explanation of the relationship between the independent variables (factors) and the responses (percentage biodegradation and specific growth rate). Adequate precision is a measure of the signal to noise ratio and a value greater than 4.0 is desirable. The adequate precision value ranged between 8.81 and 10.77, which indicated an adequate signal and suggested that the model can be used to navigate the design space. According to the above observations, it can be concluded that there is a good agreement between the experimental values and the second-order polynomial model developed, and the observed differences (i.e., the residuals) may be readily explained as random noise.
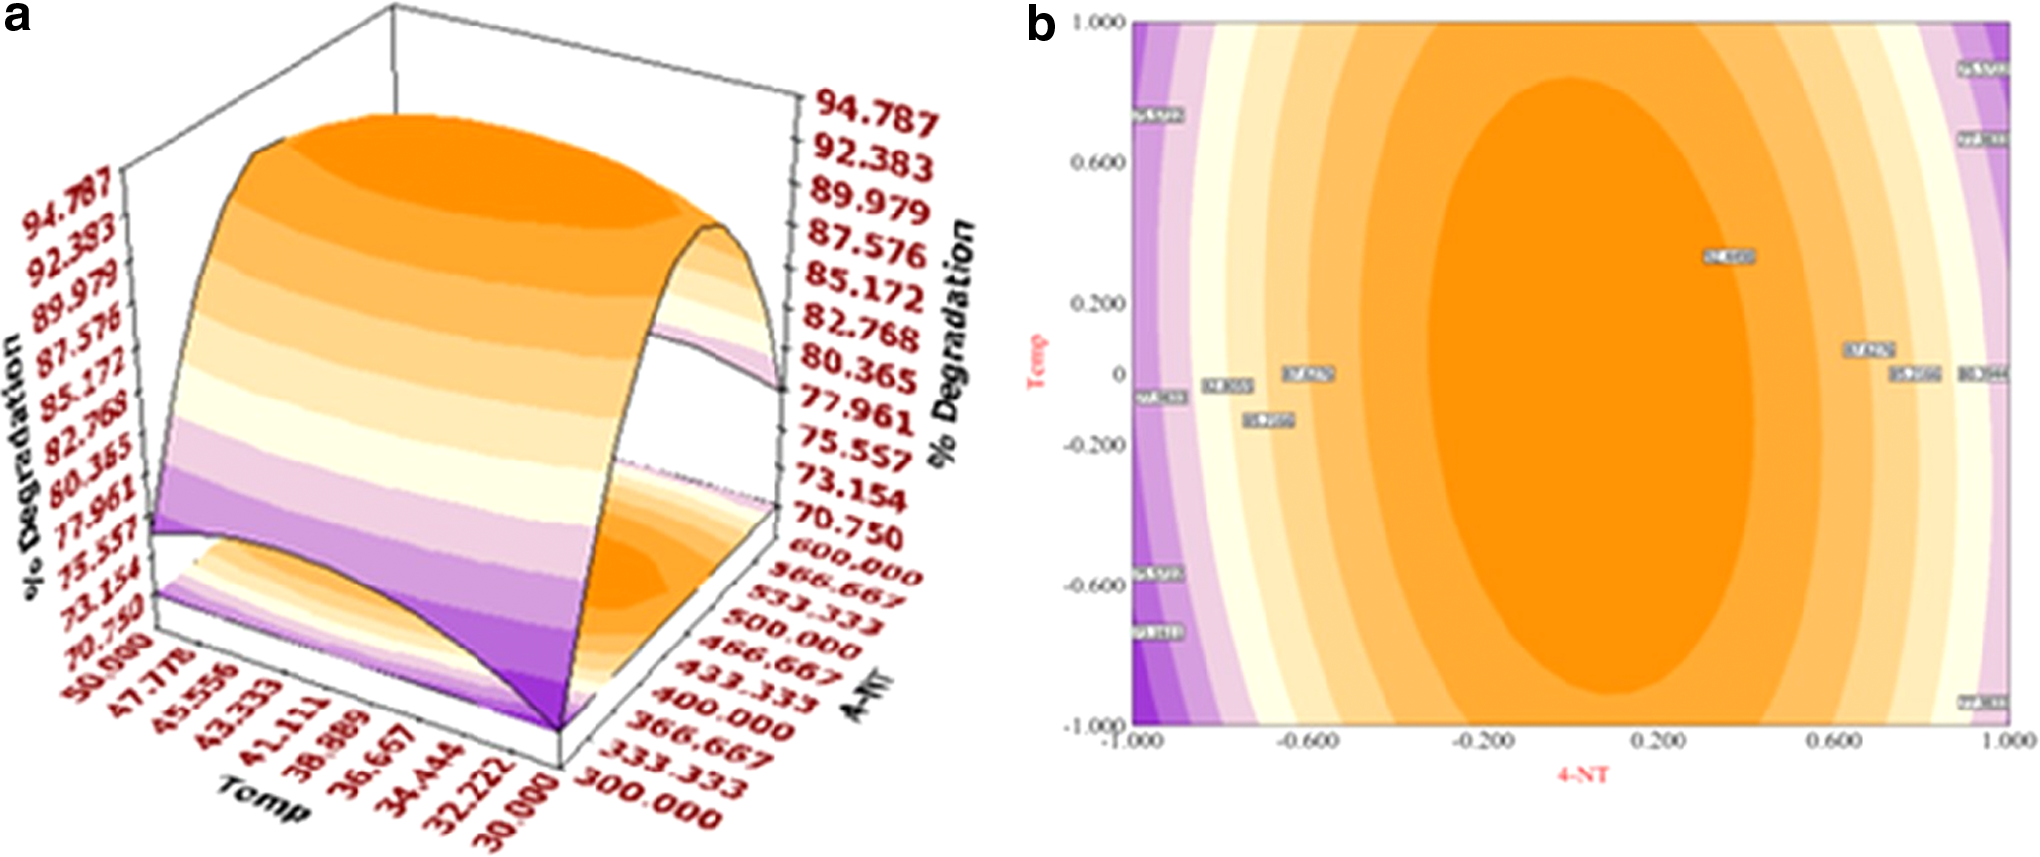
To investigate the individual and cumulative effects of 4-NT, MgSO4, temperature, and inoculum size (OD) on percentage biodegradation and specific growth rate, six pairs of 3D response surfaces and corresponding 2D contour plots were obtained by considering all the possible combinations, keeping other factors at their middle (0) levels. From the nature of the response surface contours, whether elliptical, circular, or saddle point, the interaction between the variables may be predicted. The most significant mutual effect of temperature with 4-NT (on % biodegradation) and MgSO4.7H2O (on specific growth rate) are depicted in Figures 1 and 2, respectively. The parity plot (Fig. 3) shows a satisfactory correlation between the experimental and predicted values (obtained from [Eq. (2)]) of % biodegradation and specific growth rate. It clearly reveals that the points cluster around the diagonal line and both the experimental and predicted values were in close agreement with each other. A number of factors play an essential role in the bioremediation of recalcitrant organic compounds: type of microbial strain, nature of the substrate, and abiotic factors in the surrounding environment, including inorganic salts (N, P, K,), pH, and temperature. (Ghevariya et al., 2011). Regarding inoculum size, several authors reported contrasting results about the benefit of inoculation size on the microbial survival and subsequent degradation. Some authors showed positive effects, while others observe marginal positive effects to the best (Lebeau, 2011). Degradation rate of Direct Black 22 and chrysene decreased with an increase in inoculum size as per Mohana et al. (2008) and Ghevariya et al. (2011), respectively. In this study, higher inoculum led to enhanced degradation of 4-NT, an observation similar to those reported by Abdelhay et al. (2008) during phenanthrene degradation. It is generally hypothesized that an increasing cell concentration leads to enhanced interfacial area by increasing biosurfactant secretion (Ghevariya et al., 2011). Based on our previous study with this strain during 4-NT degradation (Kundu et al., 2013), it is reasonable to assume that similar phenomena might have occurred in this study also. Various ions (from inorganic salts) have a significant impact on bacterial growth, and magnesium sulfate, calcium chloride, and dipotassium hydrogen phosphate play crucial roles in microbial consumption of recalcitrant compounds, which may, however, be inhibitory when presented beyond certain concentrations (Sahoo et al., 2010). While Mg2+ is known to be stimulatory for increasing cell density, the addition of SO42- to stimulate existing bacteria is a very effective remediation technique (Cuthbertson et al., 2007). In this study, optimum levels of magnesium sulfate necessary to achieve high 4-NT degradation and specific growth rate of the culture were found to be slightly low (0.11 g/L) compared to those found in the conventional media, probably due to the fact that accumulation of sulfate ions is inhibitory to the reductive metabolism by the microorganism (Sahoo et al., 2010). On the other hand, Zhao et al. (2009) and Hamitouche et al. (2010) showed maximum specific growth rate of microbes in phenol degradation with 0.1 g/L MgSO4. K2HPO4 and KH2PO4 serve the dual role of phosphate source to the microorganisms and buffering action. Compared to its level normally used in conventional media, the level found optimum in this study was higher at 0.5 and 2 g/L, respectively. This may be due to good buffering action at this concentration for improved performance of the microorganism. However, any further rise in the optimum concentration showed reduced 4-NT biodegradation due to its inhibitory effect on the reductive steps and is well supported from the literature reports (Sahoo et al., 2010). Another important process variable, that is, temperature greatly influences rate of degradation of pollutants. For example, biodegradation of phenol by E. americana and Rhodococcus UKMP-5M cells occurred at room temperature and the optimum was also obtained at 37°C (Karlsson et al., 1999; Suhaila et al., 2013). In this study, increasing 4-NT concentration up to 600 mg/L (4.38 mM) and temperature up to 50°C have a positive effect on specific growth rate. However, it shows a negative effect at lower ranges.


Parity plot showing the distribution of experimental versus predicted values of 4-NT degradation efficiency by R. pyridinivorans NT2:
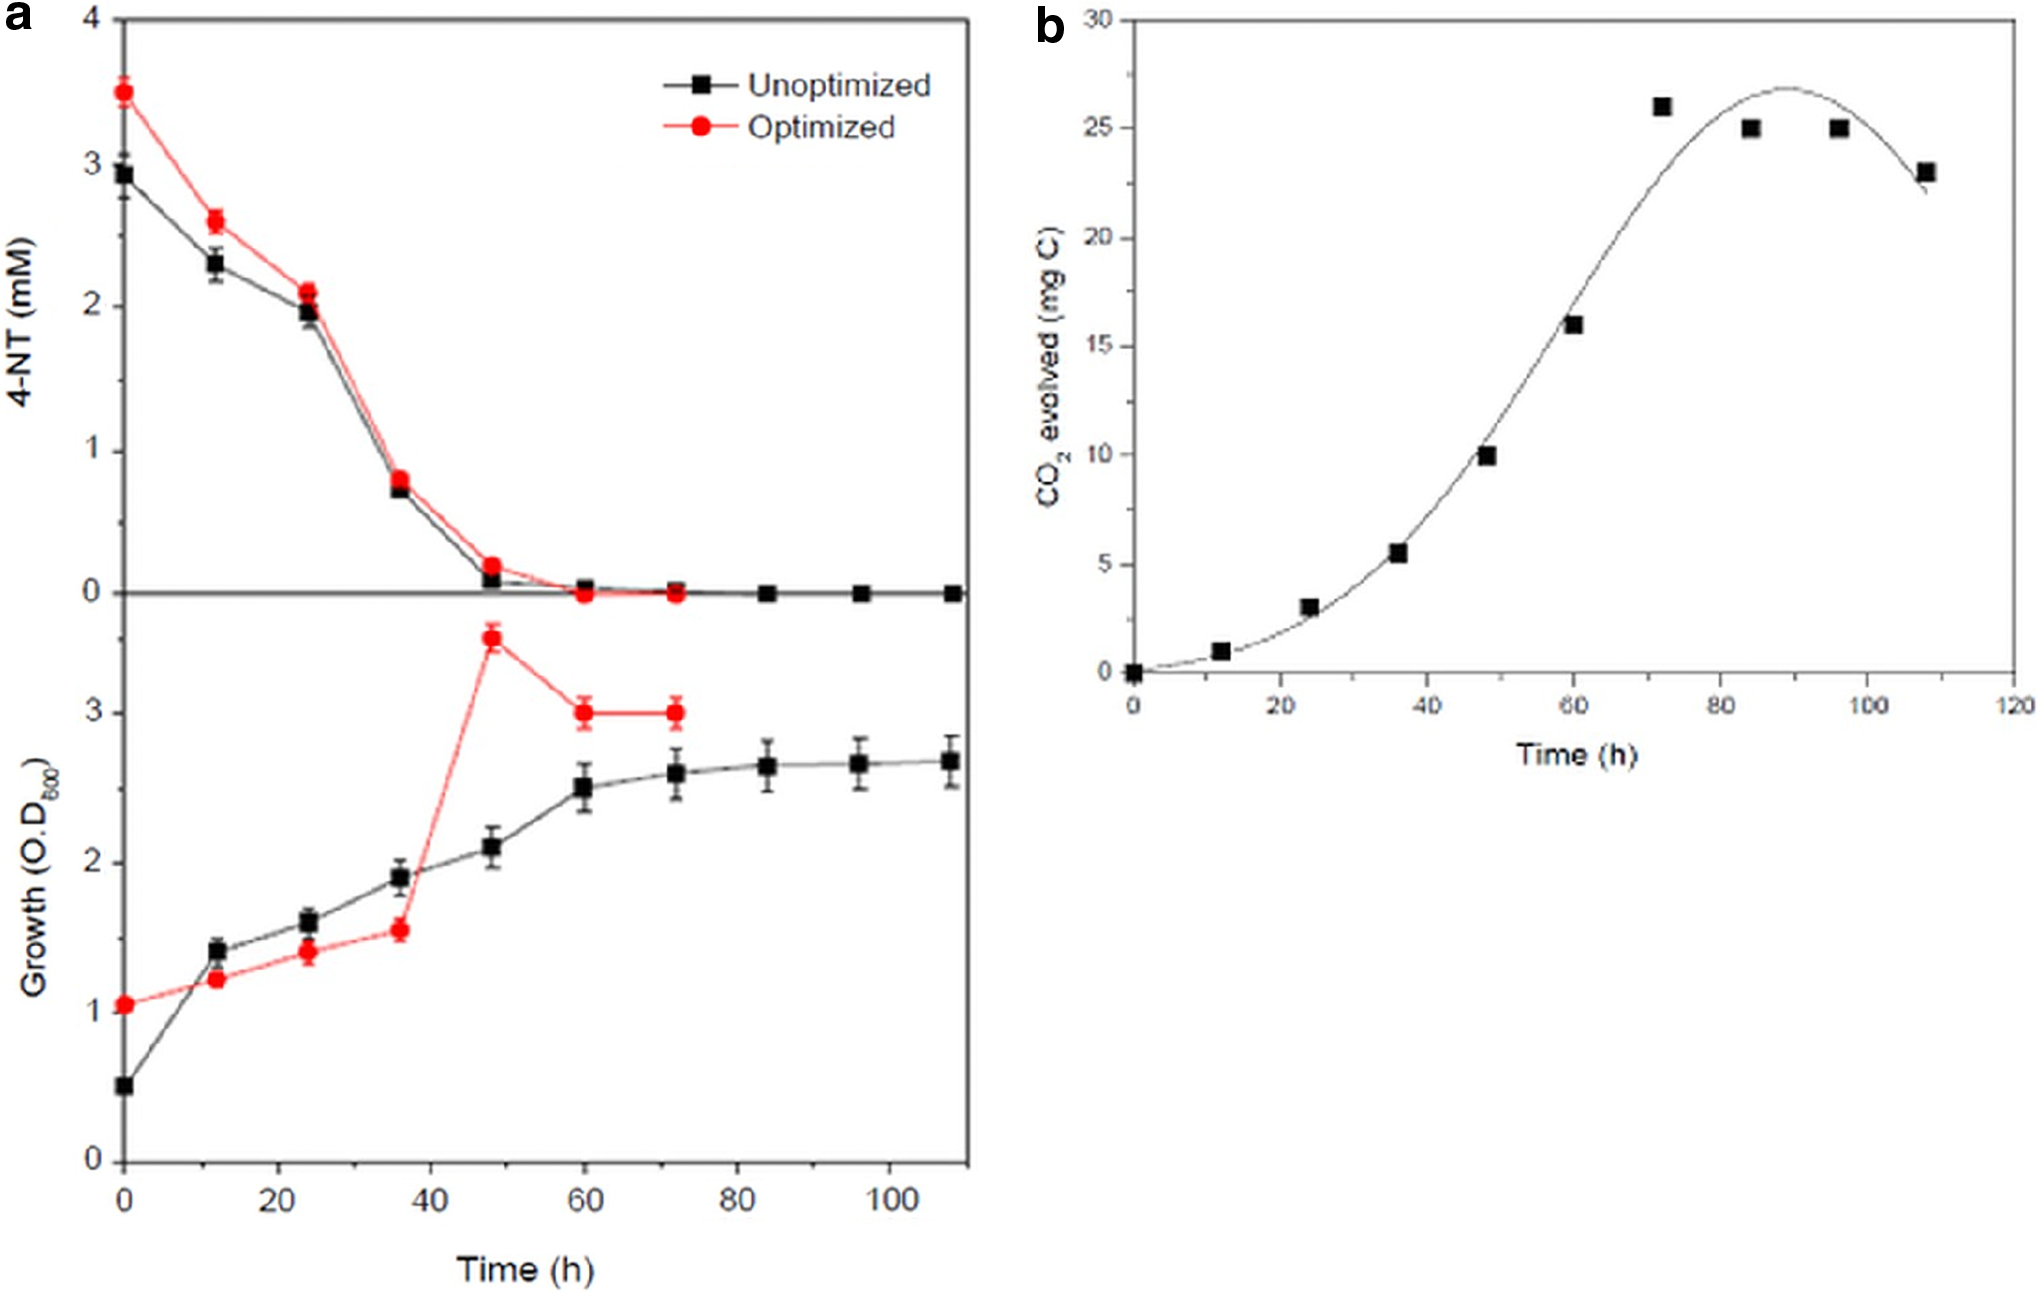
To determine the optimal levels of each variable for maximizing both 4-NT biodegradation and the culture-specific growth rate, the method of desirability function was applied. The desirability function test in this multiple response optimization reveals that the overall desirability function for 4-NT biodegradation and specific growth rate are close to 1, indicating that the function increases linearly toward the desired target values of the two responses. In addition, individual desirability values of the two responses were calculated and were found to be one each for the two responses. Thus, using the desirability function method for optimizing both the responses simultaneously, optimum values of the cultivation conditions were estimated as follows: 4-NT, 480 mg/L; MgSO4.7H2O = 0.11 g/L; temperature = 37.5°C; and inoculum size, 1.05 OD The predicted responses as maximum % degradation and specific growth rate under these optimum conditions were 95.35% and 0.19/h, respectively. To confirm the validity and accuracy of the model, additional confirmation experiments were done in triplicate according to the optimum configuration in batch shake flask. The estimated mean specific degradation rate was 0.058 mM/h and the specific growth rate of the strain in unoptimized and optimized media was 0.011 and 0.01/h, respectively (Fig. 4a). When compared with the previous unoptimized condition, the optimized settings resulted in (i) 1.20-fold increased tolerance to and degradation of 4-NT and (iii) significant reduction in total degradation time (108 h vs. 72 h). The good correlation between predicted and measured values validated the model and the existence of an optimal point. Moreover, CO2 in the gaseous phase produced during biodegradation profile was measured to investigate the extent of mineralization. It could be seen that CO2 levels increased with increase in culture growth (Fig. 4b). It was observed that (i) no CO2 was detected initially for 10 h, (ii) a peak of CO2 emerged after 12 h, (iii) the same increased till 72 h, and (iv) persisted up to 108 h vis-à-vis standard CO2. Strain NT2 yielded 26 mg C of total CO2 after 72 h during growth on 4-NT. The remaining substrate may be transformed to biomass and metabolic products as reported by Kundu et al. (2013).
Modeling and parameter identifiability for growth kinetics of R. pyridinivorans NT2 in presence of 4-NT
Figure 5 shows the specific growth rate (μ) and the rate of substrate consumption (RS) for different initial concentrations of 4-NT. For this purpose, μ for each initial concentration (Si) was determined during the exponential growth phase. The slope of the natural logarithm of the biomass versus time was calculated for each Si during the exponential phase and was identified as μ. The maximum experimental specific growth rate was 0.2/h at 2.5 mM (Fig. 5a). The decline trend of specific growth rate beyond this initial concentration confirmed that substrate inhibition occurred. Although no comparison with previous literature could be made due to paucity of data, these results agree with those reported for other inhibitory substrates by different bacteria (Sgountzos et al., 2006; Bajaj et al., 2009; Kιlιç et al., 2012), yeast (Yan et al., 2005), and filamentous fungi (Stoilova et al., 2006).

Relatively very few data exist in the literature about the rate of substrate consumption (RS) and most of the information available deals with the specific growth rate. Therefore, substrate degradation rates (RS) were calculated and plotted against initial 4-NT concentrations. The maximum degradation rate was achieved at ∼3 mM, a relatively high concentration (Fig. 5b). Variation of μ with respect to the 4-NT concentrations was modeled using suitable kinetic models and was solved using nonlinear regression. The models were compared with the experimental data of Figure 5. Values of kinetic constants for biodegradation of 4-NT using six growth kinetic models are listed in Table 7. On the basis of the goodness-of-fit tests, the Andrews-Haldane inhibitory model obviously yielded a much better fit to a reasonable level of accuracy (correlation coefficient, R2 = 0.96 for specific growth rate and 0.88 for % degradation) than the other models. Using the Andrews-Haldane model, the fitting parameters μmax (0.22/h), μ*max (0.213/h), and Sm (407 mg/L) were calculated. As Sm is the concentration corresponding to μmax, it can be regarded as the value below which growth is limited by substrate, and above which growth is increasingly subject to substrate inhibition. When we calculated Sm from data given in the literature and compared these values to those obtained for strain NT2, we observed that Sm from this study was among the highest values obtained for pure cultures, which is an advantage for further treatment of nitroaromatics contaminated water. However, the μmax was low when compared with other microorganisms. Nevertheless, this shortcoming is counterbalanced by the strain's ability to tolerate and degrade NTs at high concentration, as well as its ability to degrade different types of toxicants (Kundu et al., 2013, 2015a, b).
ND, not determined; RMSE, root mean square error.
In most of the earlier literature works, a discrepancy is observed between the graphical determination and the calculated value of μmax. The difference between μmax and μ*max was already reported, for example, by Shareefdeen et al. (1993) and Christen et al. (2012) during methanol and phenol biodegradation, respectively. Generally, in the literature, the values reported for μmax are overestimated with respect to the true μmax (μ*max), in a range varying from 24% to more than 100%. It is certain that the data from both this study and previous ones (Alagappan and Cowan, 2001, 2003; Abuhamed et al., 2004; Choi et al., 2008) show a clear inhibitory phase beyond a threshold substrate concentration, although the substrate concentration range for appearance of inhibitory phase differed from one to another study in the literature. One of the possible reasons for the large discrepancy between these data may be the fact that the oxygen regime imposed on the batch medium greatly differs from each other. Nonetheless, in general, the value of maximum specific growth rate (μmax = 0.22/h), estimated from the best fitted model of Andrews-Haldane, was much larger than the previous reports for aromatic compounds, such as phenol, p-nitrophenol, 4-chlorophenol, toluene, and picric acid.
The inhibition constant (Ki) obtained in this study is in the middle range of values reported in the literature for a pure culture. KS describes the ability of a microorganism to grow at low concentration. Most of the KS values found in the literature lie between 1 and 110 mg/L, and the value reported in this study was well within this range (Table 7). A high resistance of R. pyridinivorans NT2 as judged from the estimated Ki value may be due to the fact that some actinomycetes form hyphae and large microcolonies as a measure of protecting the inner cell mass, which may facilitate easy degradation and tolerance to toxic substrates (Sahoo et al., 2011). The combination of KS and Ki shows that, in comparison to other pure cultures generally grown on aromatic compounds, strain NT2 is able to grow on NT-containing wastewaters within a wide range of concentrations.
Yield coefficient
As initial 4-NT concentration varied from 1 to 4.5 mM, the yield coefficient (Y) varied between 0.16 and 0.31 g/g (Fig. 6a), and seemed to be low compared with that reported for other inhibitory substrates such as pyridine, phenol, and 2,4,6-trinitrophenol. In this study, a maximum biomass yield of 0.31 g/g was observed for Si = 2.5 mM, representing 33% of the theoretical value (0.94 g/g). This particular result, also reported during growth on Pseudomonas putida and Sulfolobus solfataricus, may be explained by the fact that at high substrate concentrations, the strain is exposed to stronger inhibition effects. Therefore, the energy needed to maintain membrane integrity would be expected to be higher. High values for yield factor have commonly been reported for other substrates with a high carbon ratio, such as benzene, toluene, and even methane (Christen et al., 2012).
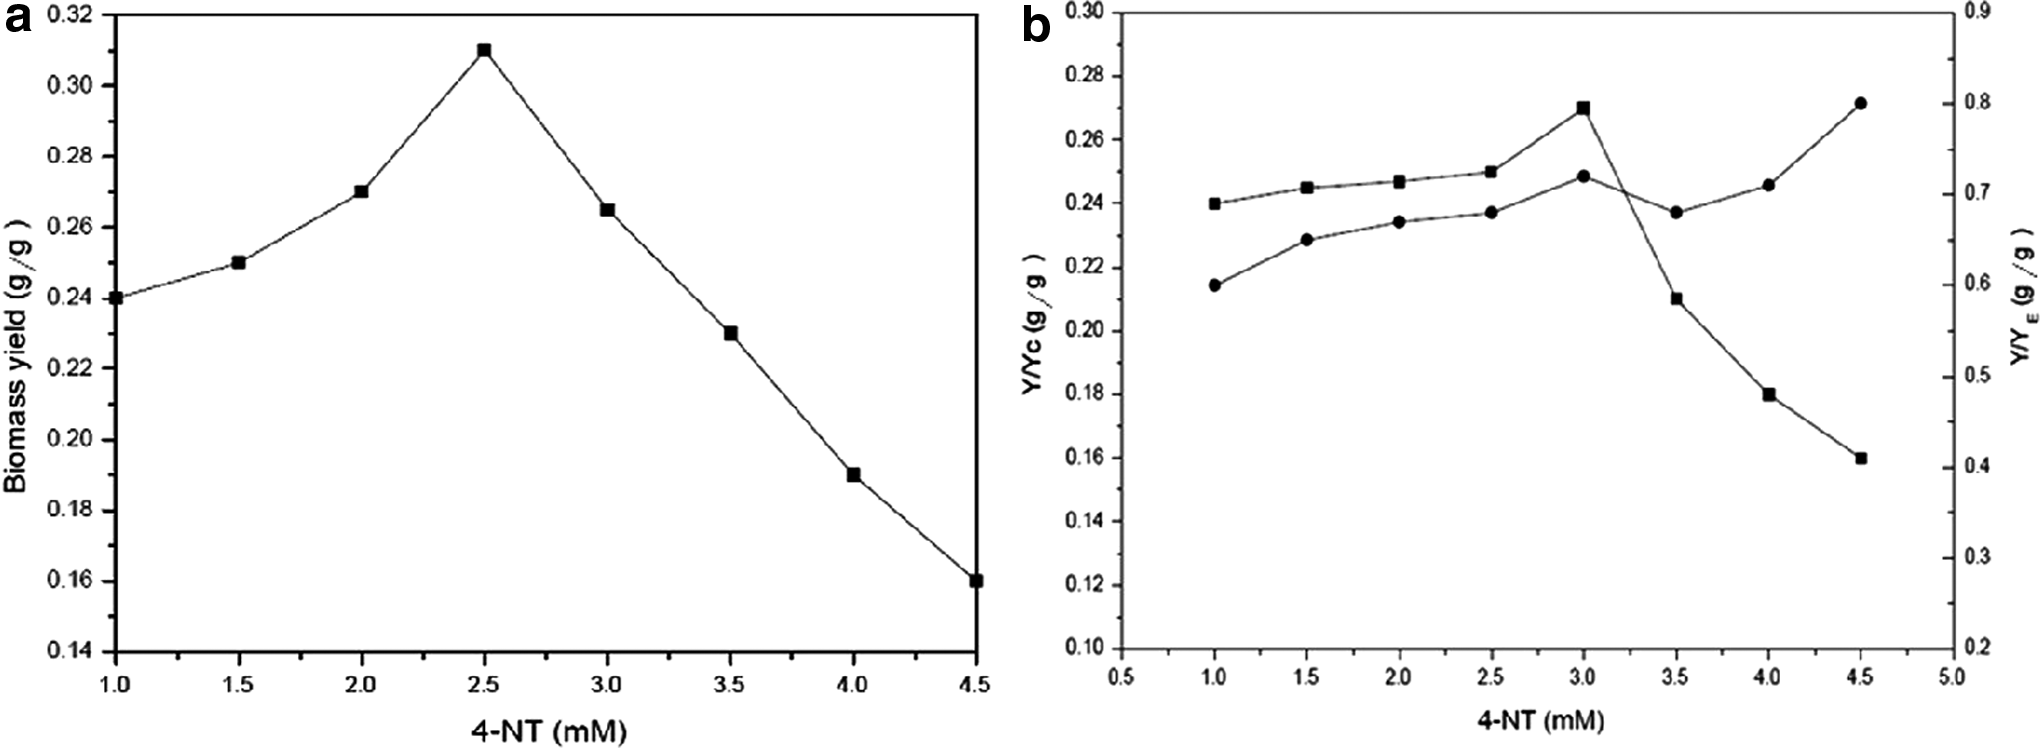
Figure 6b plots Y/YC (percentage of the total substrate carbon assimilated into biomass) and Y/YE (percentage of the total substrate carbon converted to energy for cell growth and maintenance) versus initial 4-NT concentration. Y/YE initially remained almost steady up to 2.5 mM. Thereafter, the value increased with a raise in concentration of 4-NT. Also, the relative proportion of the substrate consumed for energy (Y/YE) was drastically exceeded than for assimilation into cell mass (Y/YC) for concentrations beyond 2.5 mM, which could be attributed to the requirement of high maintenance energy for overcoming the effect of substrate inhibition at high levels of NTs. The tendency of both the specific growth rate and the growth yield coefficient with an increasing initial concentration of 4-NT showed that the substrate inhibitory function increased the energy requirements of strain NT2 to decrease the toxicity of 4-NT. The likely explanation for the variation of Y as function of S0 is that the energetic status of cells changes with the amount of 4-NT and the cells feel more stress in utilizing this physiologically unusual substrate. The maintenance requirements of microbial biomass represent the additional consumption of energy and carbon for purposes other than the production of biomass, and several reports presume that growth is a secondary feature of energy utilization after maintenance purposes (Pirt, 1975; van Bodegom, 2007).
Conclusion
This investigation is the first to use CCD and RSM to optimize the nutritional and physical parameters for enhanced biodegradation of 4-NT by R. pyridinivorans NT2. Based on the PBD for screening the medium constituents, 4-NT, MgSO4.7H2O, temperature, and inoculum size (OD) were found to be the most influential factors affecting the biodegradation rate and specific growth rate. At the RSM-optimized levels, the strain showed overall 1.20-fold increased % degradation. Also, the total biodegradation time was reduced from 108 h (unoptimized) to 72 h (optimized). Overall, the optimized cultivation conditions developed in this study proved useful not only in enhancing the efficiency of the microorganism to degrade 4-NT but also in overcoming the toxic effect of the nitroaromatic compound for its growth. Moreover, substrate inhibition due to 4-NT on growth of the microorganism was explained using suitable models found in the literature. The growth and substrate utilization kinetics was well characterized by the Andrews-Haldane model. The relatively higher μmax, Ks, and Ki values indicate that strain NT2 is a prospective bacterial strain that can be effectively applied to practical disposal of polluted wastewater with high nitrotoluene concentration.
Footnotes
Acknowledgments
Financial assistance in the form of Senior Research Fellowship from Council of Scientific and Industrial Research (CSIR), New Delhi, to D.K. and DST Inspire fellowship (Department of Science and Technology, New Delhi) to C.H. is gratefully acknowledged. We also acknowledge the Department of Science and Technology for financial assistance under DST-FIST programme and University Grants Commission, New Delhi, for Special Assistance Programme (UGC-SAP) to the School of Life Sciences, North Maharashtra University, Jalgaon.
Author Disclosure Statement
No competing financial interests exist.
References
Supplementary Material
Please find the following supplemental material available below.
For Open Access articles published under a Creative Commons License, all supplemental material carries the same license as the article it is associated with.
For non-Open Access articles published, all supplemental material carries a non-exclusive license, and permission requests for re-use of supplemental material or any part of supplemental material shall be sent directly to the copyright owner as specified in the copyright notice associated with the article.