
Abstract
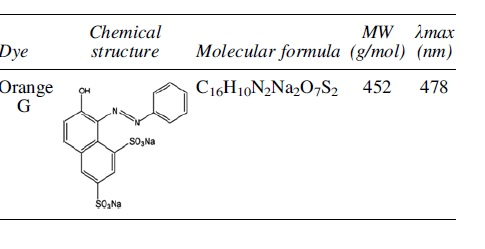
Decoloration of the azo dye Orange G (OG) was investigated by using hematite/H2O2 as a heterogeneous Fenton-like reagent. This study was performed to utilize the natural iron ore from nearby mining company in India. The cheaper and easier availability of this natural occurring iron ore makes this material attractive in effectively applying wastewater treatment. Parameters such as the initial concentration of dye (OG), dosage of mineral hematite (Fe2O3), hydrogen peroxide (H2O2), and reaction temperature were varied to study the efficiency of % OG decoloration. With an initial Orange G dye concentration of 100 mg/L and hematite, 20 g/L pH 3, temperature 25°C, and varying the concentration of H2O2 from 200 to 800 mg/L, the percent decoloration of Orange G increased from 64% to 95.14%, respectively, at reaction time of 60 min. In all the cases, decoloration kinetics of OG followed the pseudofirst-order reaction kinetics, and the activation energy E was calculated to be 24.78 kJ/mol between the temperature ranges from 25°C to 60°C. This work proposes a theoretical model for the decoloration of OG by the Fenton-like process, which involves hydrogen peroxide and mineral hematite. This study also reports the order of reaction with respect to catalyst and H2O2 concentration.
Introduction
Synthetic dyes discharged from different industries such as textile, paper and plastics, dyeing of cloth, leather treatment and printing are characterized by Biochemical Oxygen Demand (BOD) and Chemical Oxygen Demand (COD) value, suspended solids, toxic compounds, and the intense color. Usually the dye containing wastewater is discharged directly into the nearby drains, rivers, ponds, or lagoons. The textile industries have shown a significant increase in the use of synthetic complex organic dyes as the coloring material. These dyes create severe environmental pollution problems by releasing toxic and potential carcinogenic substances into the aqueous phases (Talarposhti et al., 2001). This may be a serious concern to the quality of the receiving water bodies, the aquatic ecosystem, and the biodiversity of environment (Pagga and Brown, 1986). Many azo dyes are visible in water at concentrations as low as 1 mg/L, and the presence of even trace concentrations of the dyes in industrial effluent is undesirable due to their toxicity to aquatic and terrestrial organisms (Wu et al., 2012). The discharge of dye effluents at high concentration without proper treatment may pose a serious environmental threat as most of the dyes are toxic and recalcitrant to biodecolorization (Dai et al., 2006; Gupta et al., 2006). Rasoulifard et al. (2011) show that azo dye Basic Red 46 can be degraded by using ultraviolet light-emitting diodes and peroxydisulfate from contaminated water. More than 90% of the dye content was eliminated using UV LED and peroxydisulfate simultaneously in 30 min. Araujo et al. (2011) show a study on the discoloration of the reactive dye Drimarene Red X-6BN in aqueous solutions by heterogeneous Fenton reaction using hematite powder (Fe2O3). The heterogeneous Fenton process using the mineral hematite in powder form was effective in removing the color of 100 mg/L Drimarene Red X-6BN azo dye solutions. Wastewater contaminated with dye creates problem in various ways. Color interferes with penetration of sunlight into water; it retards photosynthesis and inhibits the growth of aquatic biota (Robinson et al., 2002; Garg et al., 2004; Wang et al., 2005; Hamdaoui, 2006). Many processes such as the physical and/or chemical processes have been used in the treatment of industrial wastewater containing dye, but they are not cost-effective and not environmentally safe (Nigam et al., 1996; Rauf et al., 2007). Powdered activated carbon and activated bentonites have been commonly used for removal of dyes (Pala and Tokat, 2002; Yavuz and Aydin, 2002), but the problem with this process is the formation of large amount of sludge and the low efficiency of treatment, which have limited their use (Pearce et al., 2012).
Due to complex bond and low biodegradability of the azo dyes, these cannot be easily degraded through the bacterial action using a conventional treatment method. Therefore, alternative treatment processes, which are not only viable but also economically feasible, have become a necessity before their final discharge to the environment to meet the prescribed standard of Environmental Protection Agency (EPA). Removal of such pollutants by decoloration/mineralization can be successfully accomplished by advanced oxidation processes (AOPs). The potential of AOPs for the treatment of azo dye was investigated by several studies (Aleboyeh et al., 2005; Muruganandham and Swaminathan, 2006; Chang et al., 2010). Fenton and Fenton-like processes among AOPs can effectively be applied for removing industrialized dyes. In our process, hematite was used as a source of catalyst. The chosen catalyst, mineral hematite, is particularly attractive, being an abundant low-cost mineral. If sludge is produced, it can be discarded in blast furnaces as feed material for pig-iron production without causing any environmental impact (Yellishetty et al., 2010). The treatment occurs due to generation of highly reactive free radicals during the course of reaction (Chan and Chu, 2003). Hydroxyl radicals (HO•) are effective in degrading organic pollutants because they are reactive electrophiles (electron loving) that react rapidly and nonselectively with nearly all electron-rich organic compounds (nucleophile). They have an oxidation potential of 2.80 V and exhibit faster rates of oxidation reactions comparing to conventional oxidants. Once generated, the hydroxyl radicals can attack organic chemicals by radical addition, hydrogen abstraction, and electron transfer.
The Fenton's reaction can be outlined as follows:
where M is a transition metal, Fe or Cu.
The most accepted scheme of Fenton's oxidation can be described by the following equations.

The initiation step is the generation of •OH by the reaction of hydrogen peroxide and ferrous iron. These hydroxyl radicals react rapidly and nonselectively with organic compound and cause the oxidation [Eq. (3)]. Equations (4) and (5) show that •OH radicals may be scavenged by the reaction with excess hydrogen peroxide present or with another Fe2+ molecule. Dulman et al. (2012) focused on the decoloration and mineralization of Orange G acid dye by the heterogeneous catalytic system using H2O2 and macroporous chelating polymer. Another study revealed details of the decoloration of acid Orange-II in a nonhomogeneous Fenton process by natural vanadium–titanium magnetite (Liang et al., 2010). Doumic et al. (2013) studied the mineralization and efficiency of Orange-II dye in a simple homogeneous Fenton process. They determined the effect of various operating parameters such as initial dye concentration, oxidant concentration, catalyst dosage, and temperature on % decoloration. No report has been found on the study of decoloration of Orange G by cheap and natural hematite catalyst along with H2O2.
The present work deals with the decoloration of Orange G dye using mineral hematite and H2O2 as oxidizing agent. This study was performed to utilize the natural iron ore from nearby mining company in India. It is abundant in nature and easily accessible in Chhattisgarh, India, which makes hematite ore as a candidate material for applying in the heterogeneous Fenton process. At the same time, it is a cost-effective method. In addition to this, this catalyst can also maintain its ability to generate hydroxyl radicals from hydrogen peroxide, and so, iron hydroxide precipitation is prevented. Besides showing limited leaching of iron ions, the catalysts can be easily recovered after the reaction and can be reused for consecutive experiments.
In view of the above, the objectives of this study were (1) to investigate the efficiency of the naturally occurring hematite (Fe2O3) as an iron containing solid catalyst for oxidative decoloration of Orange G dye in aqueous solutions in a modified heterogeneous Fenton process and (2) to evaluate the influence of operative conditions on dye decoloration. The effect of most relevant operating parameters (H2O2 concentration, initial dye concentration, temperature, and catalyst dosage) was studied to arrive at the optimum conditions for maximum decoloration. This study is also attempted with the objective of determining the order of reaction with respect to catalyst and H2O2 concentration.
Physiochemical characteristics of an azo dye Orange G:
Experimental
Materials
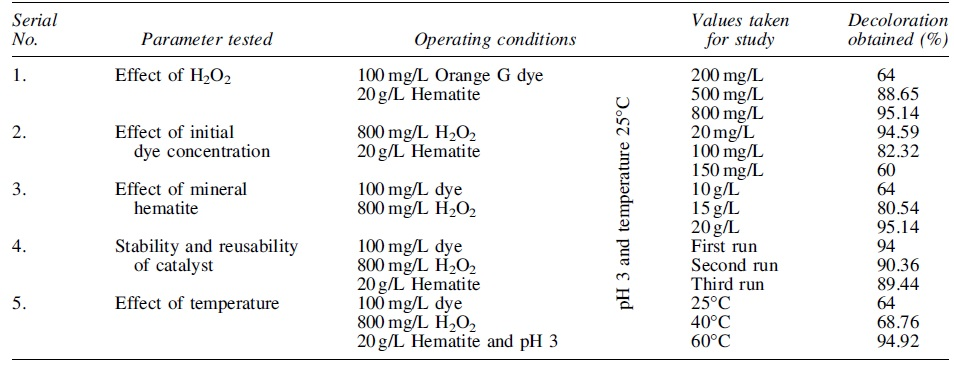
All chemicals used in this study were of analytical grade. All solutions were prepared in distilled water. Glassware used was washed with detergent, rinsed with tap water, and then with distilled water. The catalyst hematite (α-Fe2O3) was taken from a nearby mining company situated at Chhattisgarh, India. The chemicals used are Orange-G, hydrogen peroxide (30%, w/v) (Merck), sulfuric acid (Merck), and sodium hydroxide (Merck). Table 1 shows the experimental data for the different parameters tested and/or experimental conditions as tested in the study of decoloration of Orange G dye using fenton-like process catalyzed by mineral hematite.
Parameters Tested and/or Experimental Conditions as Tested
Method
All experiments were carried out in a 500-mL beaker (reactor) with reaction mixture volume of 300 mL. The aqueous dye solution was prepared using distilled water (Millipore purification system) and then its pH was adjusted using 4 N NaOH and 0.1 M H2SO4 solutions prepared using distilled water. A magnetic stirrer was used to stir reaction solutions continuously with a constant speed to maintain always a well-mixed solution during the experiments. Each experiment was started with an appropriate initial concentration of stock Orange G (100 ppm). Then, reactions were initiated by adding predetermined amounts of hydrogen peroxide (200 to 800 mg/L) and mineral hematite (10–20 g/L) to the reactor. Temperature was varied from 25°C to 60
Each experiment was performed twice under identical conditions and the mean value has been used. The reproducibility of the measurement was within ±3%. The concentration of dye in the reaction mixture at different reaction times was determined by measuring the absorption intensity at 478 nm and with a calibration curve. Before the measurement, a calibration curve was obtained by using the standard Orange G solution with a known concentration. A calibration curve was used to determine the concentration of dye in terms of absorbance. Figure 1 shows the calibration curve for Orange G dye. It is palpable that the relationship between absorbance and concentration is linear and the linear equation is found as y = 0.037x with coefficient of correlation as R2 = 0.998. To check the stability and reusability of catalyst, the resulting suspension was centrifuged at the end of experiment. The separated catalyst was reused for next set of experiments.

Calibration curve for Orange G for different concentrations of OG.
Fourier transform infrared (FT-IR) studies were performed using KBr pressed disks with the FT-IR spectrometer (FT-IR model—unit of Bruker, model alpha) transmission analyzer. This was done to confirm the active surface functional groups present in solid catalyst. The catalyst was characterized by X-ray diffraction (XRD model—PANalytical 3 kW X'pert) to ascertain the crystal structure and to study the phases of iron oxide present in the solid catalyst, which is responsible for its performance during experiments. The microstructure of the solid catalyst was magnified using scanning electron microscopy (SEM model—ZEISS EVO 18). Elements in the % weight composition of each present element were analyzed by using an energy dispersive X-ray detector (EDX) attached together with micrograph.
Results and Discussions
Results of characterization of catalysts, influence of some operating variables such as initial concentration of Orange G, concentration of H2O2, initial concentration of mineral hematite, and temperature on percentage decoloration of Orange G are demonstrated. Besides this, reaction kinetics is also presented. The theoretical model of kinetic is also discussed in this section.
Characterization of catalyst
The hematite mineral used in this work, obtained from a mining company, was ground to fine powder; it was used without any purification.
Fourier transform infrared spectroscopy analysis of hematite
FT-IR spectra of the catalyst (prepared as KBr discs) were collected on a FT-IR spectrometer with a detector. Spectra were recorded in the range from 4000 to 400 cm−1 (32 scans) and are presented in Fig. 2.
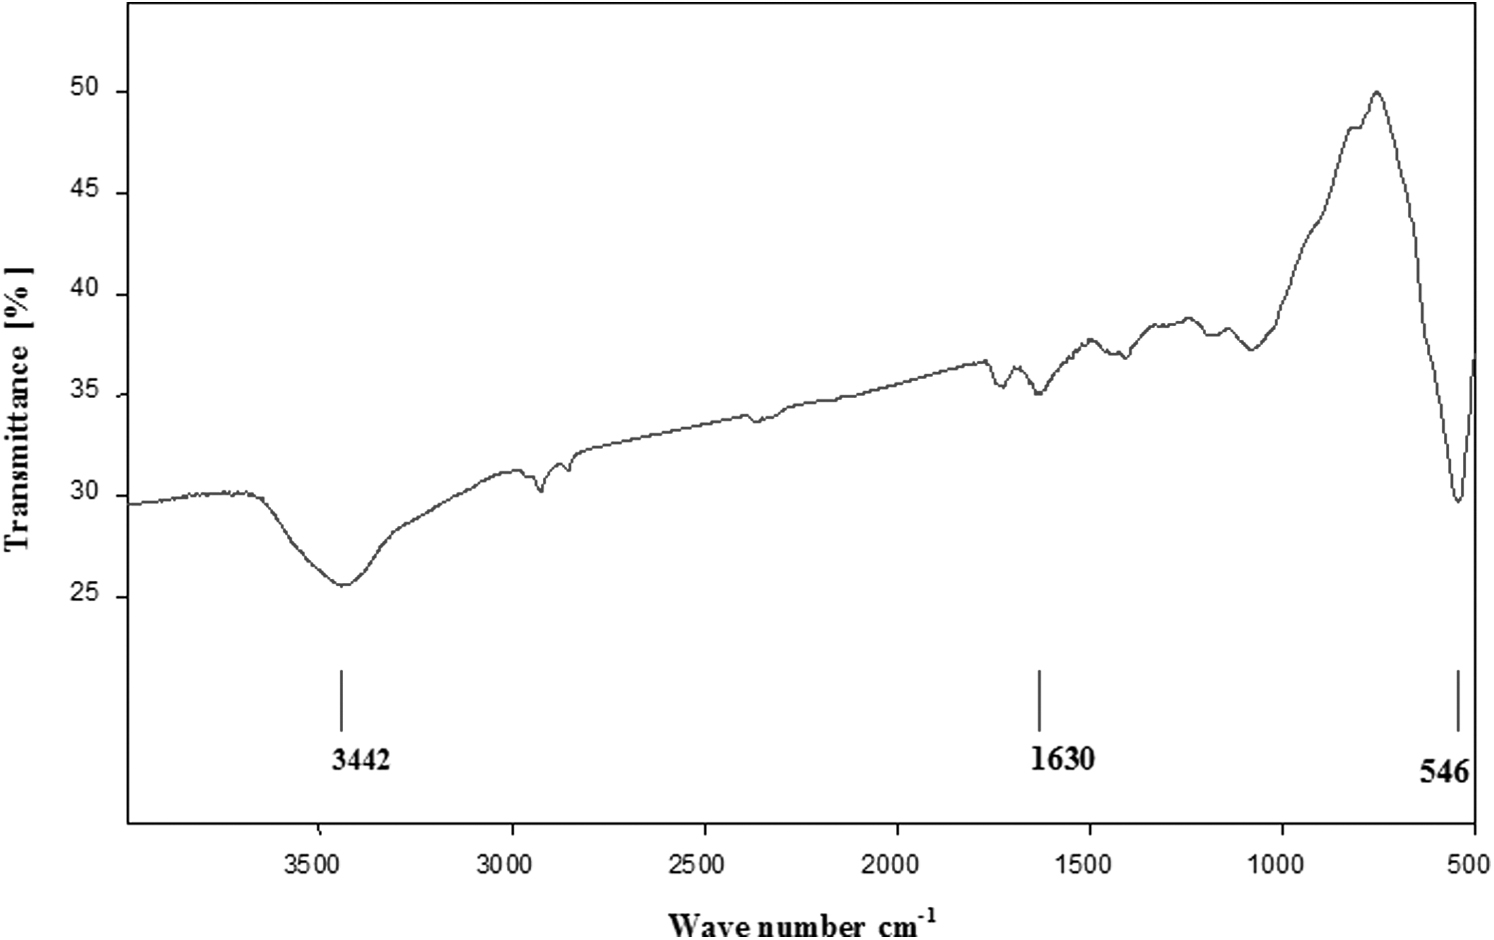
Fourier transform infrared spectra of catalyst.
From the spectrum, the band at 546 cm−1 was due to Fe-O stretching and bending vibration mode of α-Fe2O3 (Pirkanniemia and Sillanpaa, 2002). In addition, the band at 1630 cm−1 is due to the OH bending of water, and the absorption peak at 3422 cm−1 is for the hydroxyl group (−OH).
X-ray diffraction analysis
X-ray diffraction (XRD) pattern of hematite is presented in Fig. 3. Sample hematite shows peaks of rhombohedral α-Fe2O3 at different d-values. The unit cell of α-Fe2O3 is hexagonal and contains only octahedrally coordinated Fe3+ atoms (corundum structure). Crystallographic phases are present in hematite sample.
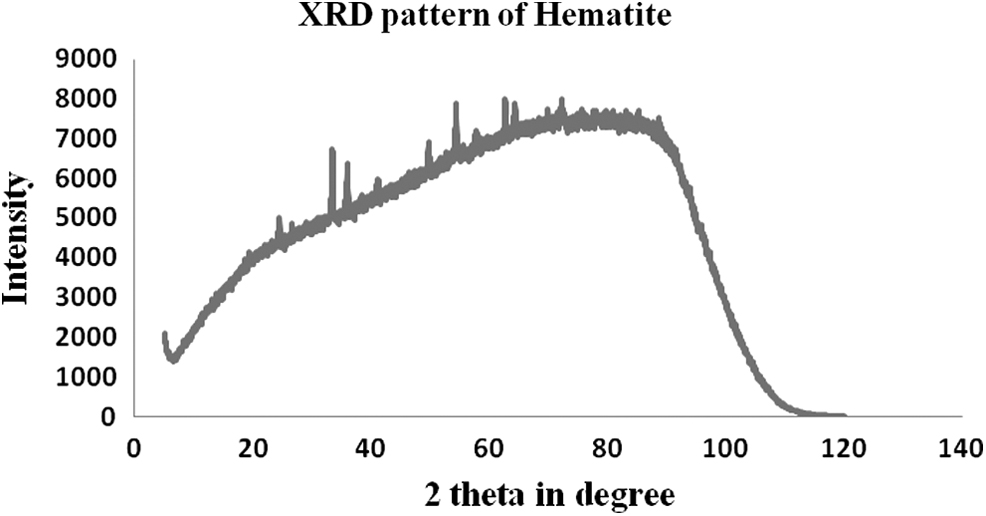
X-ray diffraction pattern of hematite.
Average crystallite size is calculated using broadening of most intense peaks from XRD pattern and Scherrer equation.
where D = average size of the crystallites
K = Scherrer constant (0.9 × 57.3)
λ = wavelength of radiation (1.5405)
h1/2 = peak width at half height and Θ corresponds to the peak position.
The diffraction maxima at 2Θ = 33.146 can be attributed to the crystalline characteristic of hematite (Pirkanniemia and Sillanpaa, 2002). According to Bragg's law (nλ = 2dsinΘ), the maxima indicate the interatomic distances corresponding to 2.7 Å and the corresponding average crystallite size is 376 Å.
Scanning electron microscope analysis
SEM micrographs of hematite catalyst before treatment, taken at different magnifications, are represented in Fig. 4a and b. Numerous pores on the catalyst surface can be observed. It clearly shows the porous nature of the catalyst. The catalyst has a rough surface. This reveals a good possibility for dye to be adsorbed and entrapped in the rough surfaces. The hematite with its high rough surface aimed at an improved catalytic reaction on the surface with H2O2 resulting oxidation of Orange G dye.

Scanning electron micrographs of hematite.
Energy-dispersive X-ray spectroscopy analysis
The elemental composition given by EDX is represented in Table 2.
Elemental Composition of Catalyst
High percentage of carbon (C) in hematite sample may be due to calcium carbonate deposited millions of years ago from the shells of dead sea creatures. It is possibly inorganic carbon. To check any dye adsorption effect by this carbon, we conducted some preliminary experiments with hematite ore, no degradation was observed, and so, it can be concluded that it is not the cause of decoloration of dye.
Variation of operating parameters
Effect of H2O2 on percent decoloration of Orange G
Concentration of hydrogen peroxide significantly influences the decoloration rate and extent. When increasing hydrogen peroxide concentration was increased from 200 to 800 ppm, decoloration efficiency also increases. It is due to the fact that with increase in hydrogen peroxide, more •OH radical is formed (El-Dein et al., 2001), which is the main cause of higher % of decoloration of OG. The result presented in Fig. 5 shows that in 60 min of reaction, the OG degraded by 64%, 88.65%, and 95.14% when the concentration of hydrogen peroxide is increased to 200, 500, and 800 ppm, respectively, with maintaining the concentration of Orange G 100 mg/L, 20 g/L hematite, pH 3, and temperature 25°C.
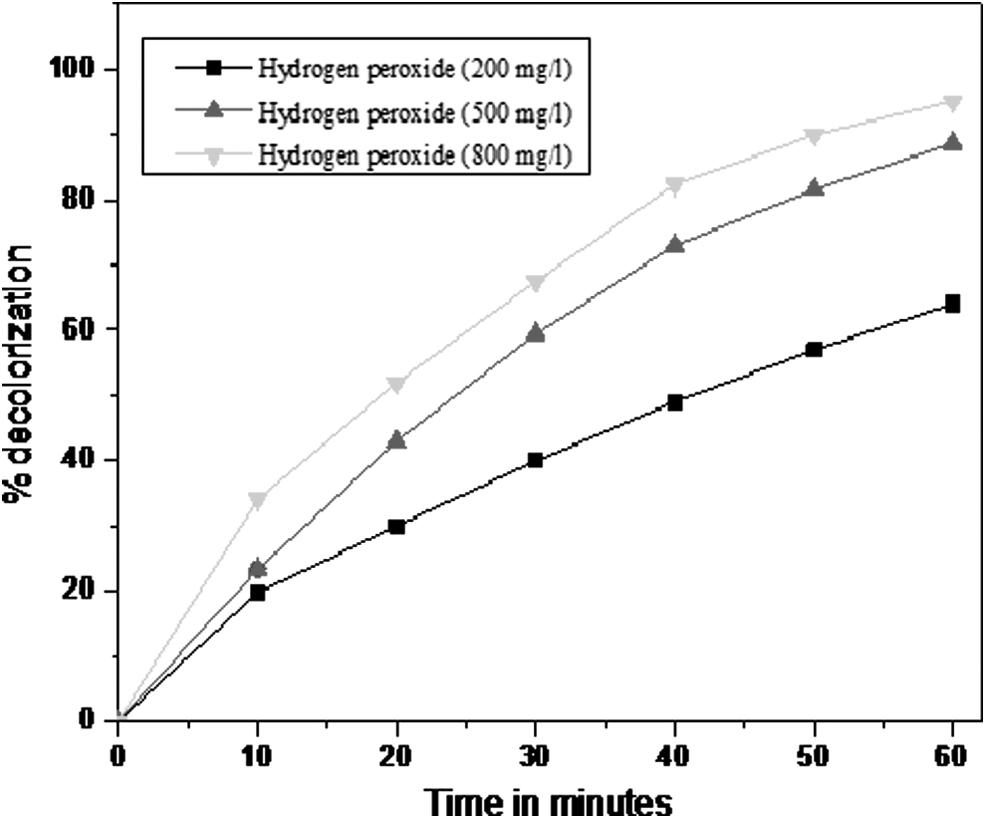
Effect of H2O2 on % decoloration of Orange G (100 mg/L dye concentration, 20 g/L hematite, pH 3, and temperature 25°C).
The plot of ln(C0/C) versus time (t) shows a linear relationship (Yao et al., 2014), indicating that the OG decoloration follows the first-order kinetic model below:
where C is the concentration of OG at time t; C0 is the initial concentration of Orange G; and k is the observed apparent reaction rate constant, which can be obtained from the slope of the line in the plots of ln(C0/C) versus time.
From Fig. 6, the apparent rate constant of Orange G decoloration was found to be 0.017 min−1 under a certain experimental condition: 200 mg/L H2O2, 100 ppm Orange G dye concentration, pH 3, and room temperature 25°C. The apparent reaction rate constants are found to increase from 0.017 to 0.045 min−1 with increase in dosage of H2O2 from 200 to 800 mg/L.
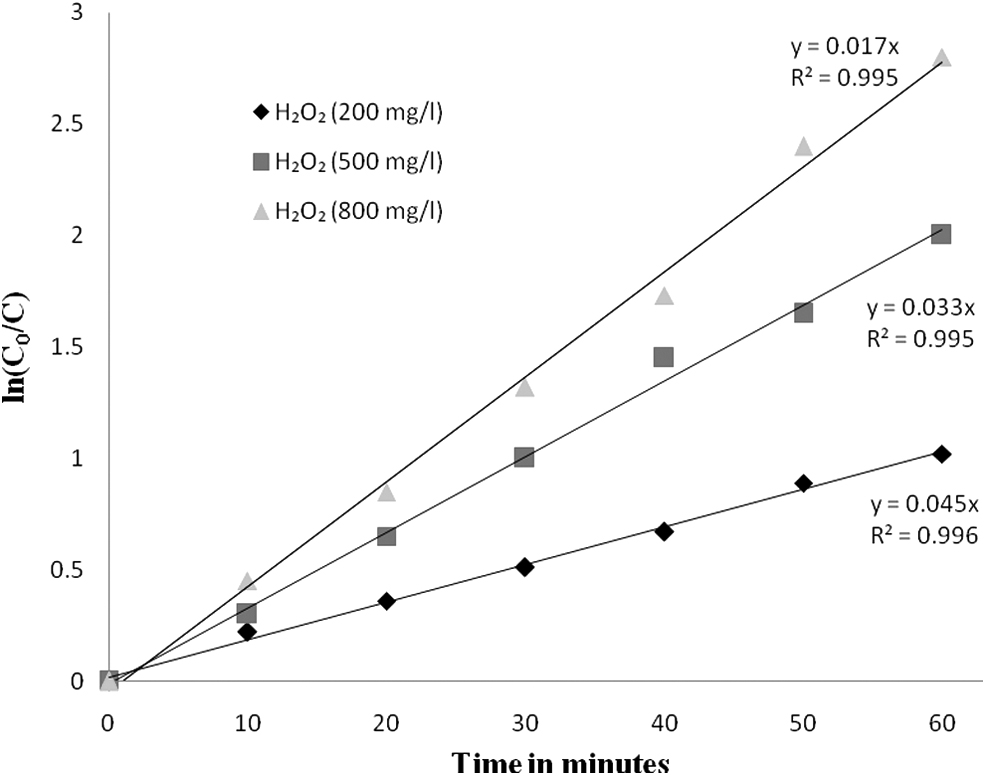
Determination of apparent reaction rate constants with different H2O2 concentrations (100 mg/L Orange G dye, 20 g/L hematite, pH 3, and temperature 25°C).
Effect of initial dye concentration on percent decoloration of Orange G
The effect of initial Orange G concentration was studied and the results are shown in Fig. 7. From the figure, it is concluded that with decrease in concentration of dye from 150 to 20 mg/L, the decoloration time decreases, that is, decoloration rate increases. For dye concentration of 20 mg/L, 94.59% decoloration was achieved in only 40 min, whereas for 150 mg/L dye, % decoloration was only 60% for the same duration of time. With the increase in concentration, the time required for decoloration also increases. At low concentration of OG (20 mg/L), the percentage decoloration is higher compared to that at a higher concentration. As the experiments were conducted at the same H2O2 concentration (800 ppm) and same catalyst dosage, the amount of hydroxyl radicals generated, the main species responsible for decoloration of dye, is also therefore expected to be close (Ali et al., 2013). As the proportion of the hydroxyl radical to the dye to be degraded falls with increasing concentration of dye, effectively a lower fraction of dye gets degraded. This phenomenon can also be explained with the fact that with the increase in initial concentration of the dye, more dye molecules are adsorbed onto the surface of catalyst. So, the generation of •OH radicals on the surface catalyst is reduced since the active sites are occupied by dye molecules (Zhang et al., 2009). From Fig. 8, the apparent rate constant of OG % decoloration was calculated under certain experimental conditions: 800 mg/L H2O2, 20 g/L hematite, pH 3, and temperature 25°C. The apparent reaction rate constants are increased from 0.025 to 0.069 min−1, with decrease in dosage of dye from 150 to 20 mg/L.
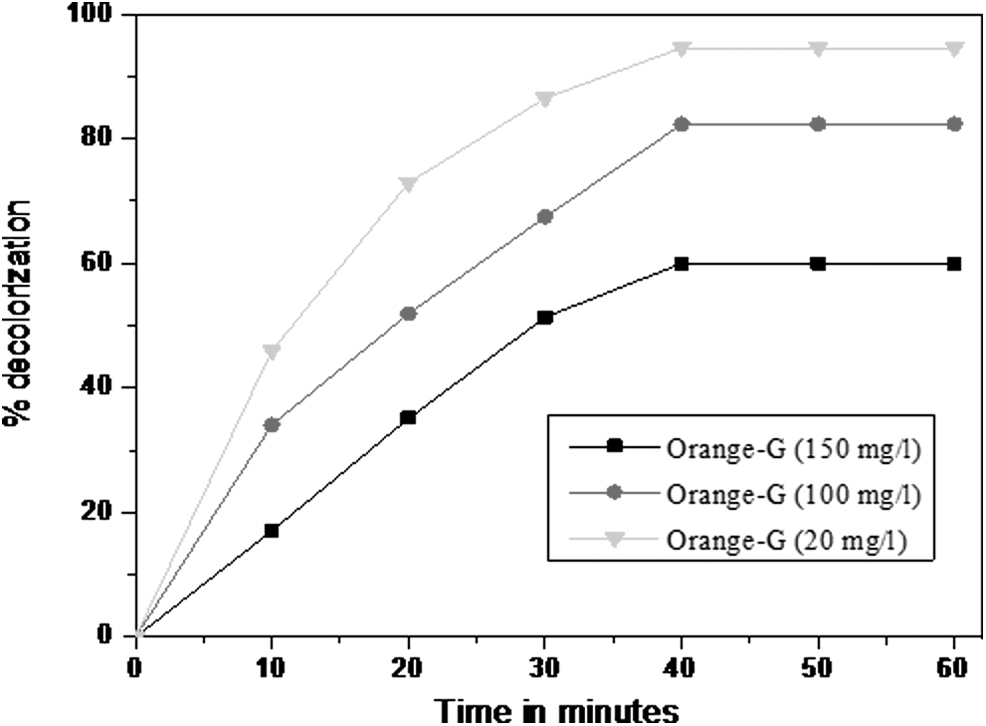
Effect of initial concentration of dye on % decoloration (800 mg/L H2O2, 20 g/L hematite, pH 3, and temperature 25°C).

Determination of apparent reaction rate constant at different initial dye concentrations (800 mg/L H2O2, 20 g/L hematite, pH 3, and temperature 25°C).
Effect of temperature on percent decoloration of Orange G
Figure 9 depicts the effect of varying temperature on the decoloration of Orange G. It can be observed that temperature has a significant effect on the decoloration of OG. For instance, the decoloration efficiency increased from 64% to 94.92% within 60 min of reaction when the reaction temperature increased from 25°C to 60°C. This is due to generation of more •OH radicals at higher temperatures, which accelerate the oxidation reaction, and therefore, decoloration of Orange G is enhanced (Sun et al., 2009). Another palpable reason is that the temperature influences reaction rate constants significantly and it influences the product yield also. Increasing the temperature could enhance the rate of the redox reaction, so a higher temperature resulted in the increased apparent reaction rate constant between hydroxyl radicals and dye, which led to maximum decoloration of OG. The apparent reaction rate constant increased from 0.016 to 0.045 min−1 when the reaction temperature increased from 25°C to 60°C. It may also be due to when we increase temperature of any reaction, kinetic energy of molecules is also increased, which causes the collision between the molecules and then breaks the complex bond. This is possibly the reason behind the increased rate with temperature. Figure 10 shows the value of corresponding apparent rate constants with temperature.

Effect of temperature on % decoloration of Orange G (100 mg/L dye concentration, 800 mg/L H2O2, 20 g/L hematite, and pH 3).
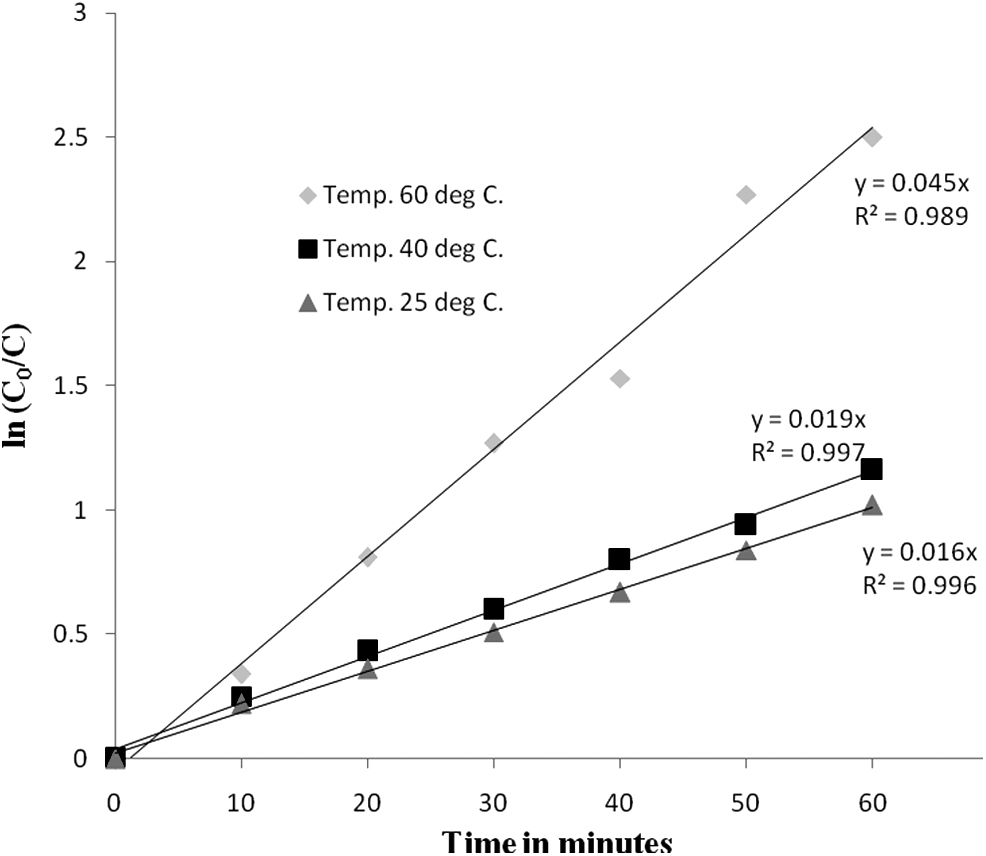
Determination of apparent reaction rate constant at different temperatures (100 mg/L dye concentration, 200 mg/L H2O2, 20 g/L hematite, and pH 3).
Effect of catalyst dosage on percent decoloration of Orange G
The effect of catalyst amount on % decoloration of Orange G was investigated keeping hydrogen peroxide concentration as 800 mg/L. The catalyst concentration was varied from 10 to 20 g/L in this study. Figure 11 depicts the decoloration curve. It is very evident that decoloration increases with increase in dosage of mineral hematite. An increase of catalyst dosage corresponds to a higher total surface site, which increases active sites for adsorption decoloration of Orange G dye leading to an increase in % decoloration rate (Wu et al., 2012).
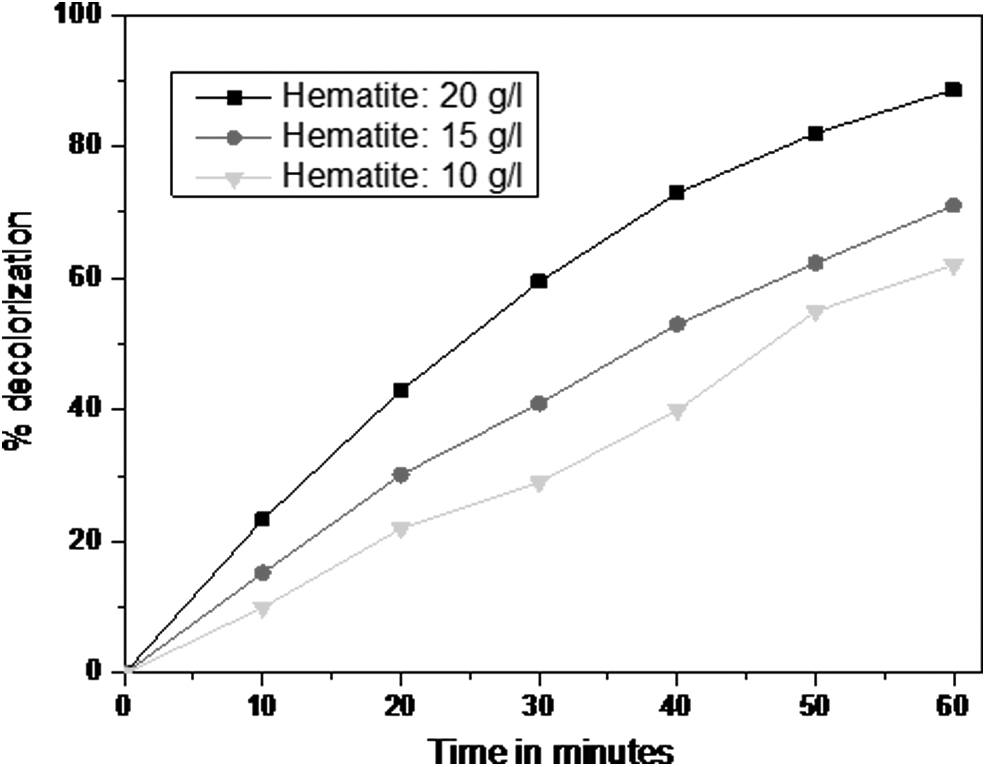
Effect of varying catalyst quantity on % decoloration of Orange G (100 mg/L dye concentration, 800 mg/L H2O2, pH 3, and temperature 25°C).
Figure 12 shows the kinetic of decoloration and apparent rate constants. Apparent rate constants increase from 0.021 to 0.045 min−1, with increase in dosage of mineral hematite from 10 to 20 g/L.
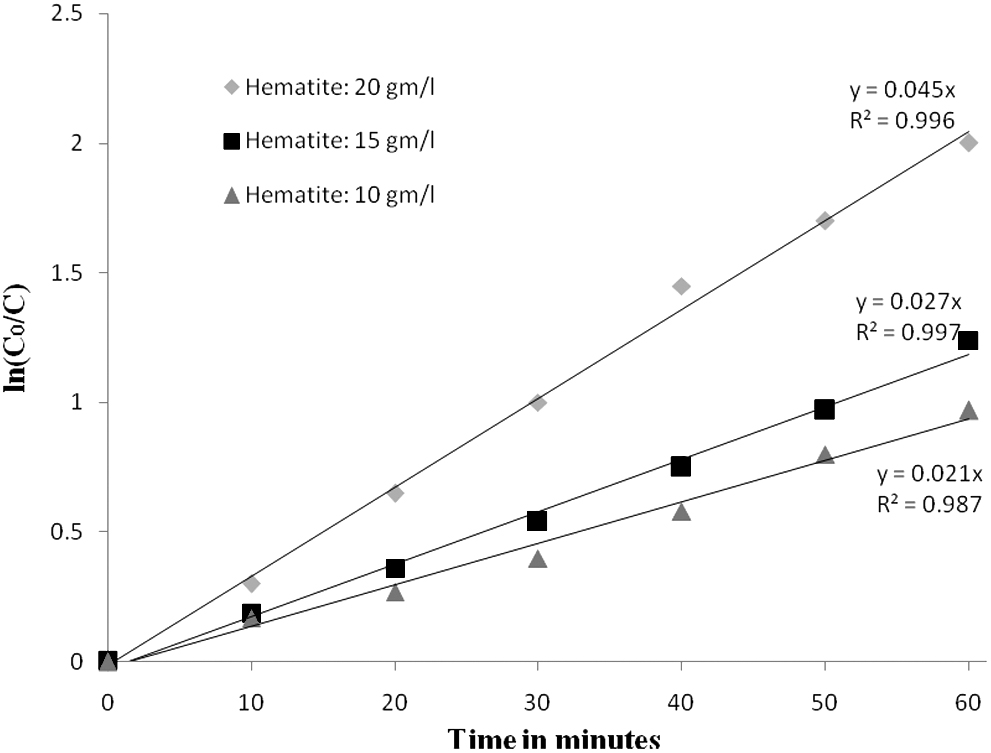
Determination of apparent reaction rate constant at different catalyst concentrations (800 mg/L H2O2, pH 3, and temperature 25°C).
Stability and reusability of catalyst
The hematite catalyst fulfils the requirement of high catalytic activity and insignificant iron leaching. The stability test was performed to evaluate the catalytic activity of catalyst during successive experiments and also to observe the possibility of catalyst reuse. The catalysts were used in three consecutive experiments by using fresh dye solutions at optimum conditions (100 mg/L dye concentration, pH 3, temperature 25°C, 800 mg/L H2O2, and 20 g/L catalyst). In the first run, about 94% decoloration efficiency of Orange G was observed within 60 min of reaction. In the second and third runs, the decoloration efficiency of Orange G was decreased to 90.36% and 89.44%, respectively. It was found that the concentration of iron ion in the solution after reuse of the catalyst for three consecutive cycles was 2, 1.4475, and 1.2304 mg/L, respectively.
Kinetics of Orange G percent decoloration
An attempt has been made for calculation of activation energy and order of reaction using the theoretical model for decoloration of Orange G.
Calculation of activation energy
Chemical reactions can be described by first-order equations depending upon the rate constant and change in reactant concentration. The reaction order and value of rate constant were determined experimentally.
In general, case for first-order kinetic for the reactant A is converted into product B.
The same equation may be followed for Orange G decoloration, it shows first-order kinetics.
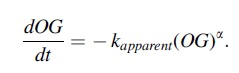
Hence,
For first order kinetics, α = 1
Also, the apparent reaction rate constant k depends upon temperature and follows Arrhenius equation.
k0 = Preexponential factor
Ea = Activation energy of the reaction, which is considered to be temperature dependent
R = Universal gas constant
Linear regression curve (shown in Fig. 13)
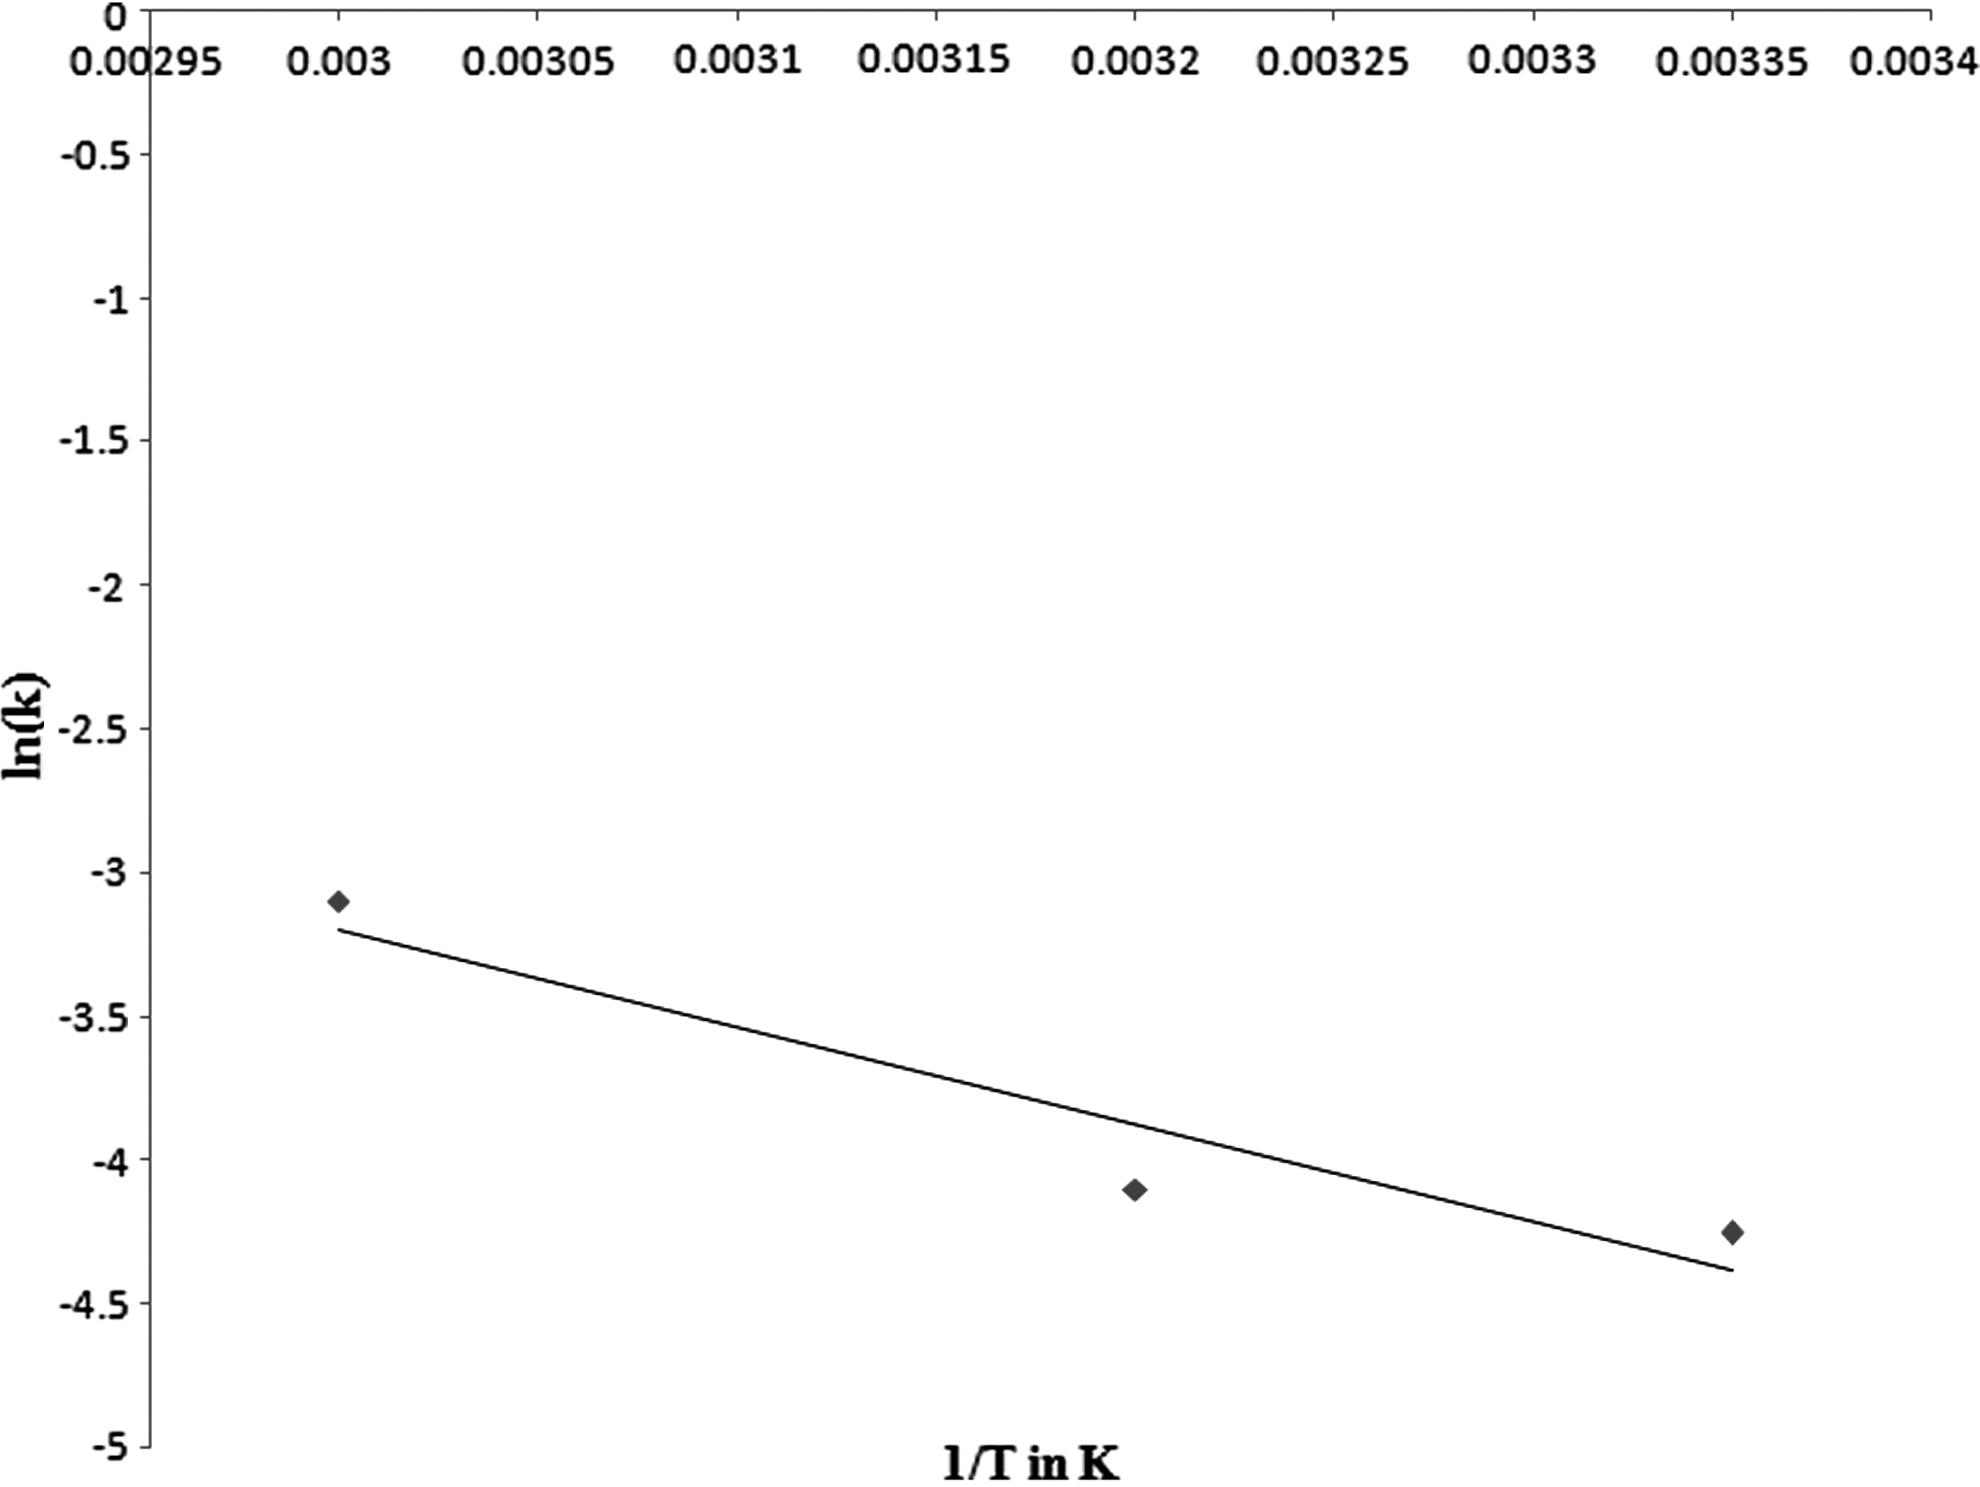
ln(k) versus 1/T.
Comparing with the standard equation [Eq. (12)] as,
where R is a constant having value of 8.314 J/mol.K or 1.987 Cal/mol.K.
We get Ea/R = 2981.
So, Ea = 2981 × 8.314 = 24784.3 J/mol or 24.84 kJ/mol.
Hence, activation energy (Ea) is found to be 24784.3 J/mol or 24.84 kJ/mol.
Generally, the activation energy of ordinary thermal reactions is roughly between 60 and 250 kJ/mol. The obtained Ea in this study is relatively low, agreeing with high measured efficiency of this reaction (Wu et al., 2012).
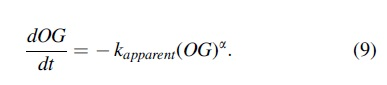
Reaction kinetics for determination of order of reaction
The reaction kinetics for OG decoloration follows pseudofirst-order kinetics.
For first-order reaction, α = 1
For the first case, kapp reaction rate constant = 0.017 min−1 at 25°C
And hence, rate of reaction for dye of 100 mg/L decoloration:

where C and [•OH] are concentrations of Orange G and hydroxyl radicals. k is the second-order rate constant and t is the reaction time. By assuming that instantaneous •OH concentration as constant, the kinetics of dye decoloration could be described according to the pseudofirst-order equation as given below:
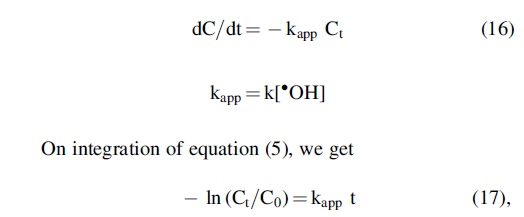
where Co is the initial concentration of Orange G.
kapp is the apparent pseudofirst-order rate constant (min−1).
The kapp constants were obtained from the slopes of the straight lines by plotting—ln (Ct/C0) as a function of time t through regression. Regression coefficients proved the curve to be a good fit.
Also, apparent rate constants depend upon concentration of mineral hematite and hydrogen peroxide. So, this can be written as the following:
where β, γ be the order of reaction corresponding to hematite and hydrogen peroxide.
Apparent rate constant is denoted by (k*), which depends upon concentration of mineral hematite and hydrogen peroxide.
To calculate order of reaction for catalyst and H2O2, it was assumed that the apparent rate constant calculated from pseudofirst order of decoloration process is directly proportional to the concentration of both mineral hematite and hydrogen peroxide.
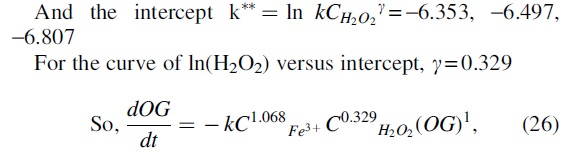
where k* is the apparent rate constant of pseudofirst-order kinetics, k is the actual rate constant, and k** = ln kCH2O2 γ
Comparing the above equation with y = mx + c.
The change in k* as a function in catalyst dose at 100 mg/L of dye concentration is shown in Fig. 14. The slope of straight lines is order of reaction in catalyst concentration (β), which was found to be 1 and intercept represents k**. The order of reaction in hydrogen peroxide concentration (γ) can be determined by plotting the intercepts (k**) versus ln(H2O2) concentration, which is shown in Fig. 15.
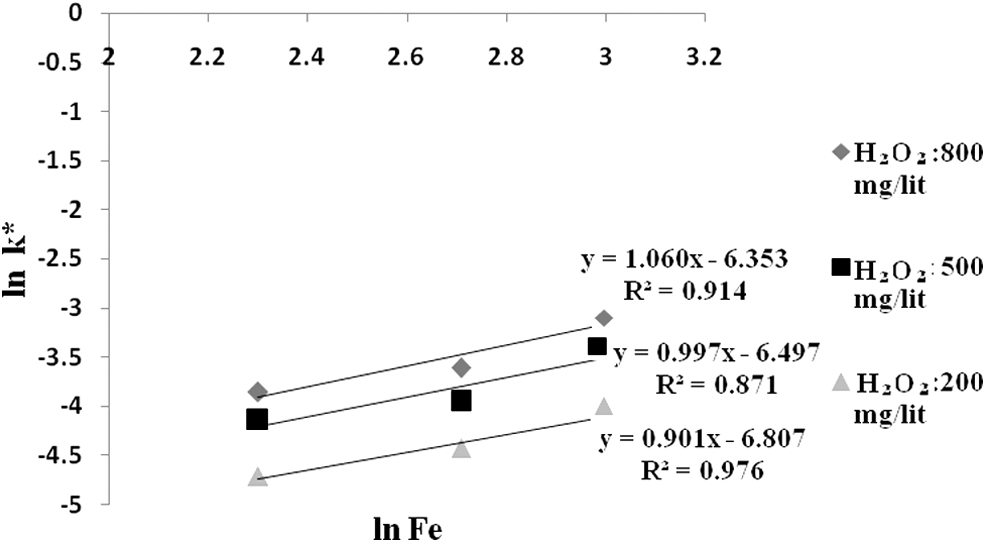
Change in rate constant with catalyst concentration at different H2O2 concentrations.
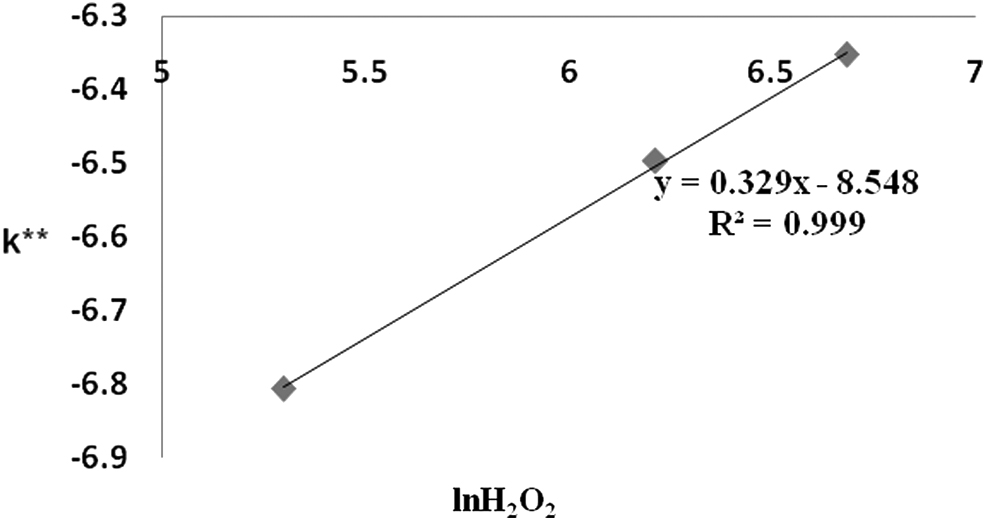
Change in k** with different H2O2 concentrations.
The calculated reaction order (γ) in H2O2 concentration is 0.329.
For the curve of ln(H2O2) vs intercept, γ = 0.329.
Comparing the equation of line obtained through regression with
We get β (slope) = 1.06, this is called the order of reaction corresponding to hematite.
where k is actual rate constant.
Conclusions
Influence of various operating parameters on % decoloration was investigated and the corresponding apparent reaction rate constants were also determined at these conditions. The decoloration kinetics of OG follows the pseudofirst-order reaction, and the activation energy E was found to be 24.78 kJ/mol in the temperature range from 25°C to 60°C. Order of reaction in hydrogen peroxide concentration was 0.329, while order of reaction in catalyst concentration was 1.068, respectively. This can be summarized that rate or reaction was more dependent on catalyst concentration rather than hydrogen peroxide concentration. This study strongly suggests the use of low-cost materials as catalysts in the heterogeneous Fenton process for decoloration of organic pollutants.
Footnotes
Acknowledgment
The authors are immensely grateful to DST-SERB, FILE NO. YSS/2014/000996-SERB for their financial support to the project.
Author Disclosure Statement
No competing financial interests exist.