
Abstract
Abstract
Landfill leachate was treated by a process involving use of sludge-based activated carbon (SBAC) combined with a membrane bioreactor (MBR), which reduced cost compared to traditional activated carbon. The MBR process was operated to compare the membrane fouling characteristics for exploring effects of the properties and amount of added SBAC on membrane fouling. Influences of extracellular polymeric substances (EPS) and soluble microbial products (SMP) on the transmembrane pressure (TMP) were illustrated based on the contents and components of EPS and SMP in sludge mixed liquor and on the membrane surface. Results showed that the EPS, SMP, proteins, and polysaccharides in sludge mixed liquor of the SBAC-MBR first increased and then decreased with the operation time, and accumulation of EPS, proteins, and polysaccharides on the membrane surface in the SBAC-MBR increased gradually with time during the operational cycle. TMP in the SBAC-MBR first increased gradually and then decreased exponentially during the operational cycle. Addition of SBAC to the MBR reduced the amounts and changed the compositions of EPS and SMP, which improved the properties and structure of the cake layer on the membrane surface and decreased membrane fouling. During the operational cycle, the period of slow increase of TMP in the reactor was prolonged by adding SBCA, which extended the cleaning cycle of the membrane module from 17 to 21 days.
Introduction
L
However, membrane fouling can decrease the membrane permeability and increase the frequency of membrane replacement and cleaning, which can affect the economics and practicality of MBRs (Sanguanpak et al., 2015). Adding the proper dose of powdered activated carbon (PAC) to the MBR was recently reported to improve the treatment efficiency and fouling of the MBR process (Skouteris et al., 2015). Several studies have shown that the addition of PAC increases the removal of low molecular weight organics by adsorption, acts as a supporting medium for attached bacterial growth, influences the bacterial population, and affects the EPS concentration (Satyawali and Balakrishnan, 2009a, 2009b; Meng et al., 2012). It is generally accepted that PAC increases the adsorption of organics in the bulk liquor and improves the filterability (Skouteris et al., 2015).
Sludge-based activated carbon (SBAC) is a type of activated carbon with a well-developed pore structure and rich surface functional groups that is produced by the pyrolysis of sludge from sewage treatment plants (Hadi et al., 2015). It has a similar surface structure to commercial PAC. The attractive properties of SBAC are controlled by the well-developed surface area and the type, number, and mode of bonding of different heteroatoms (oxygen, sulfur, nitrogen, boron, phosphorus, chlorine) on the carbon's surface (Zhai et al., 2013). Furthermore, it has been successfully adopted as an adsorbent in many fields, but few studies have examined the combination of SBAC with MBR treatment of landfill leachate (Tao et al., 2015). The addition of SBAC is expected to mitigate membrane fouling and enhance the biodegradation of recalcitrant or slowly biodegradable compounds, and it is thus particularly relevant to MBR treatment of landfill leachate. MBR treatment with SBAC is applied to the treatment of landfill leachate, which can decrease the cost of the activated carbon and also realize the value of the SBAC (Foo et al., 2013). Nonetheless, in contrast to commercial PAC, the properties and degree of membrane fouling of MBR, including the characteristics of the solution, sludge, and membrane, are influenced by the addition of SBAC for treating landfill leachate.
This study explored the effects of the properties and amount of added SBAC on membrane fouling in MBRs for treating landfill leachate. In addition, this study performs a comprehensive study of the chemical and physical properties of the solution, sludge, and membrane to provide fundamental knowledge for their application. In this study, an MBR with SBAC from a municipal wastewater treatment plant was used to treat landfill leachate in a practical treatment project. The results were compared with those from a normal MBR reactor to investigate the influence of the extracellular polymeric substances (EPS) and soluble microbial products (SMP) in the sludge mixed liquor and the composition and content of the EPS on the surface of the membrane on the transmembrane pressure (TMP) and to identify the mechanism of the influence of adding SBAC on membrane fouling in MBRs, both of which could support the engineering applications of this combined process.
Materials and Methods
Equipment
Experiments were carried out in two submerged MBR systems composed of plexiglass. For comparison, one system contained SBAC (named SBAC-MBR), and the other did not (named MBR). The MBR system was 400 × 200 × 450 mm in size and had an effective volume of 28 L, which consisted of an anoxic zone and an aerobic zone at a volume ratio of 1:3. The membrane module in the aerobic zone was a hollow fiber microfiltration membrane, which was manufactured by TIANJIN MOTIMO MEMBRANE TECHNOLOGY CO., LTD. Figure 1 shows a schematic diagram of the experimental equipment, and Table 1 shows the main characteristic parameters of the membrane module.
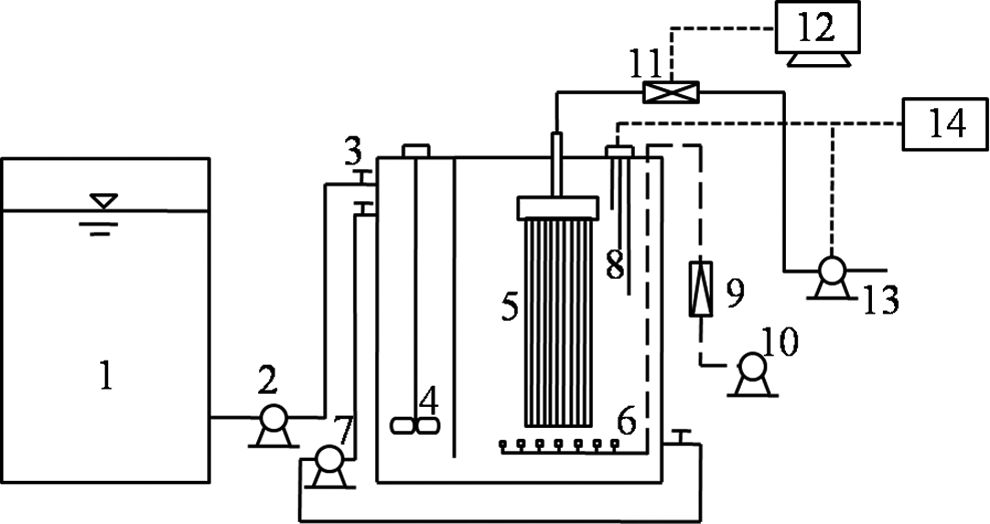
Schematic diagram of experimental apparatus (single group); 1. Water tank; 2. Intake pump; 3. Valve; 4. Stirrer; 5. Membrane module; 6. Microporous aerator; 7. Circulating pump; 8. Level meter; 9. Gas flow meter; 10. Aeration pumps; 11. Pressure sensor; 12. Data acquisition system; 13. Effluent pump; 14. Automatic control device.
Operating conditions
Two MBR systems were operated in this study, and 2.5 g/L SBAC was added to the SBAC-MBR system. The influent of the systems was continuous, and the effluent was intermittent. The membrane filtration flux was 3 L/(m2·h), and the hydraulic retention time (HRT) was 24 h. Programmable logic controllers (PLCs) were used to control the effluent of the MBRs. The operational period and backwashing flux were 10 min and 4.5 L/(m2·h), respectively. The effluent of the system was used as backwashing water. During the operating period, the dissolved oxygen (DO) in the MBRs was maintained at approximately 3.0 mg/L by adjusting the gas flow meters.
Properties of SBAC and influent quality
The SBAC was made of excess activated sludge from the municipal wastewater treatment plant. The properties of the SBAC are shown in Table 2.
Data in parentheses were proportion of microporous surface area and BET-specific surface area.
Porosity of the SBAC was dominated by the mesopore structure. The percent of micropores was 12.79%, which indicated that the SBAC had a large average pore diameter and a small specific surface area. In this study, the experimental water was the effluent of the upflow anaerobic sludge blanket reactor in the Harbin municipal landfill. The water quality is shown in Table 3.
Analysis and methods
Extraction of EPS and SMP in sludge mixed liquor
The EPS and SMP in the sludge mixed liquor were extracted by the heat extraction method as follows: (1) 50 mL of sludge mixed liquor was extracted from the MBR by being centrifuged at 3,000 rpm for 5 min in a centrifuge tube. The supernatant was filtered with a 0.45 μm filter membrane, and the SMP in the filtrate was tested immediately. (2) Deionized water was used to increase the volume of the deposited sludge from the centrifuge tube in the previous step to 50 mL, and the mixture was then treated with a rotary mixer for 1 min and then heated at 80°C in a water bath for 10 min. (3) The heated mixture in the centrifuge tube was centrifuged at 5,000 rpm for 5 min, the supernatant was filtered with a 0.45 μm filter membrane, and the EPS in the filtrate was then tested immediately.
Extraction of EP in cake layer deposited on membrane surface
Five membrane fibers were selected at different locations in the membrane module. The sludge on these membrane fibers was scraped with a sponge and dissolved with 50 mL of deionized water, and the EPS extraction procedure was then performed by following Step 1.
Determination of EPS and SMP
The main constituents of the EPS and SMP were protein and polysaccharide, and the sum of the protein and polysaccharide represent the content of EPS and SMP. The protein content was assayed with ultraviolet spectrophotometry using the bicinchoninic acid (BCA) method, which was performed with a BCA Protein Assay Kit manufactured by SHANGHAI LIDA BIOTECHNOLOGY CO., LTD., and the wavelength was 562 nm. The polysaccharide contents of EPS and SMP were assayed with ultraviolet spectrophotometry using the phenol sulfuric acid method, and the wavelength was 485 nm.
Transit membrane pressure
The TMPs of the MBR and SBAC-MBR reactors were determined using a pressure sensor (PTP708) between the membrane module and the effluent pump.
Fourier transform infrared spectroscopy
At the end of operation, the fouled membrane modules were removed from the membrane tanks. The cake layer on the membrane surface was carefully scraped off with a plastic sheet. Samples were dried in an aeration cabinet at 55°C for 48 h and kept in desiccators with silica gel until the analysis. Fourier transform infrared spectroscopy (FT-IR) was used to qualitatively identify the surface functional groups. The spectra were measured from 4000 to 400 cm−1 and recorded on an FTIR-8400S Spectrometer using KBr pellets that were prepared with a ratio of 1 mg sample/200 mg KBr. At least six FTIR spectra were registered for each sample. The spectra were recorded in transmission mode by coadding 64 scans with a 4 cm−1 spectral resolution.
Excitation–emission matrix fluorescence
Samples that were scraped off the membrane surface were dissolved with 50 mL of deionized water and then centrifuged for 20 min at 5,000 rpm. The supernatant was passed through 0.45 μm prerinsed sterile cellulose membrane filters before the fluorescence intensity analysis. Excitation–emission matrix fluorescence (EEM) measurements were conducted using a spectrofluorometer (FP-6500; Jasco) equipped with a 150 W xenon lamp at an ambient temperature of 25°C. A 1 cm quartz cuvette with four optical windows was used for the analyses. Emission scans were performed from 250 to 600 nm at 5 nm steps with excitation wave lengths from 200 to 500 nm at 5 nm intervals. The detector was set to high sensitivity, and the scanning speed was maintained at 2000 nm/min; the slit widths for the excitation and emissions were 5 nm and 5 nm, respectively.
Results and Discussion
Variation of EPS in the sludge mixed liquor with time
EPS is an organic polymer that is mainly composed of proteins and polysaccharides and also contains small amounts of nucleic acids and humus. EPS can promote the formation of a cake layer on membrane surfaces, which will cause membrane fouling (Liu et al., 2012). In this study, the contents of protein and polysaccharide of the EPS in the sludge mixed liquor in both the MBR and SBAC-MBR reactors were determined, and the total content of protein and polysaccharide represents the EPS content. The variations of the content and composition of EPS with operation time are shown in Figs. 2 and 3, respectively. Figure 2 shows that the EPS contents in both reactors first increased and then decreased with time. This trend was primarily due to the variation of biological activity of the activated sludge in the reactors. At the beginning of operation, the secretion rate of EPS was relatively high due to the high biological activity of the activated sludge, which resulted in the accumulation of EPS. With increasing operation time, the activated sludge became domesticated, and the influent material was not sufficient for microbial growth. The microbes in the activated sludge then utilized the protein and polysaccharide in the EPS as a source of carbon and nitrogen, and the accumulated EPS in the reactors was gradually utilized. The EPS content decreased until the secretion and degradation balance of the EPS was broken.

Variation of EPS content in sludge mixed liquor with operation time. EPS, extracellular polymeric substances.
Variations of the contents of protein and carbohydrates in EPS of sludge mixed liquor with operation time.
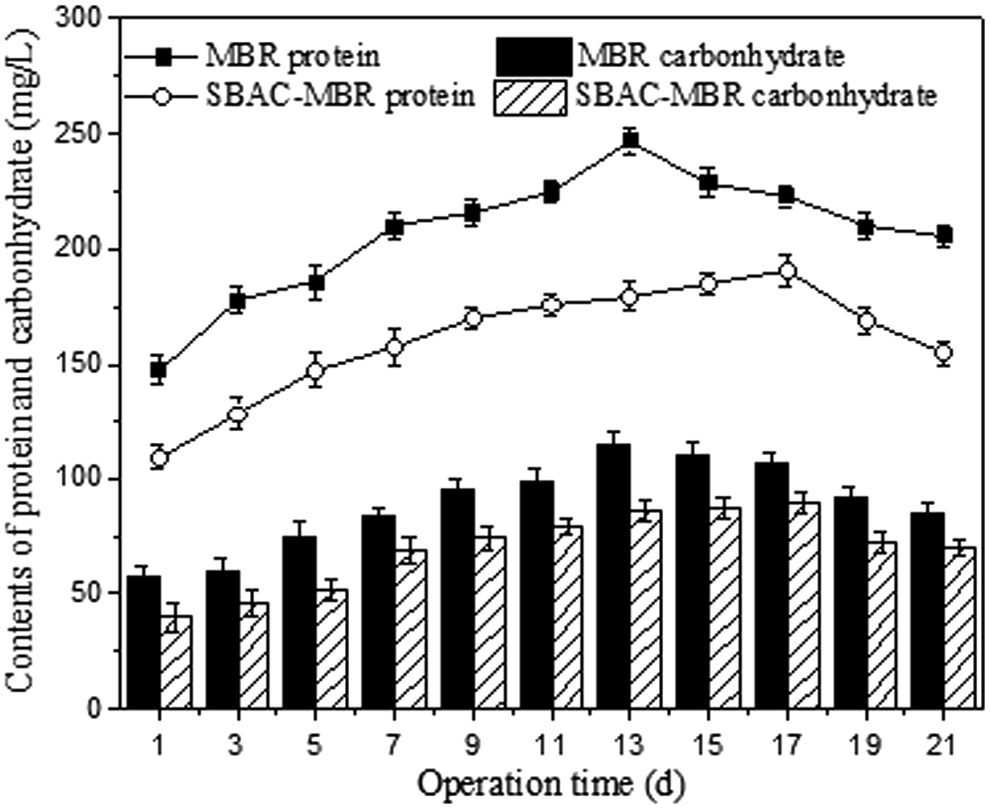
During the operation, the EPS content in the MBR varied from 204.5 to 366.88 mg/L and was highest on day 13, while the EPS content in the SBAC-MBR varied from 149.09 to 316.37 mg/L and was highest on day 17. Figure 3 shows that the protein and polysaccharide contents of EPS in the sludge mixed liquor of both the MBR and SBAC-MBR reactors first increased and then decreased with time, which was similar to the variation in the EPS content. Protein represented 65% of EPS in both reactors during the operational period, which indicates that protein is the main component of EPS. A comparison of Fig. 2 to Fig. 3 shows that the protein, polysaccharide, and EPS contents were lower in the SBAC-MBR than in the MBR.
Variation of SMP in sludge mixed liquor with time
SMP is the material that microbial cells secrete by their own metabolism and is always produced during the microbial decomposition matrix process and the endogenous respiration process (Guclu et al., 2013). Some researchers believe that SMP is the fundamental cause of membrane fouling. In this study, the protein and polysaccharide contents of the SMP in the sludge mixed liquor in both the MBR and the SBAC-MBR reactors were determined, and the total content of the protein and polysaccharide represents the SMP content. The variations of the content and composition of the SMP with operation time are shown in Figs. 4 and 5, respectively.

Variation of SMP content in sludge mixed liquor with operation time. SMP, soluble microbial products.

Variations of the contents of protein and carbohydrates in the SMP of the sludge mixed liquor with operation time.
Figures 4 and 5 show that SMP content, protein content, and polysaccharide content all first increased and then decreased with time. During the operational period, the SMP content in the MBR varied from 215.37 to 604.66 mg/L, and the contents of both the protein and polysaccharide were highest on day 13. The SMP content in the SBAC-MBR varied from 184.23 to 481.36 mg/L, and both contents were highest on day 17. Compared with the MBR, the SBAC-MBR had lower contents of SMP, protein, and polysaccharide, which indicated that SBAC can absorb the proteins and polysaccharides in the SMP (Xu et al., 2008) and after adding SBAC to the MBR, microbes grew and adhered to network floccules that formed with SBAC as the core in the reactor, which had different physiological characteristics than the suspended microbes in the original MBR and generated less SMP. The macromolecular substance usually could not pass through the membrane pores with water, but would gather in gaps between the microbial flocs that are present in the cake layer on the surface of membrane and thus increased the thickness of the cake layer (Jarungwit et al., 2014). On the other hand, small molecules could be absorbed in the membrane holes, which would decrease the size of the membrane hole or even block it and increase the resistance of the membrane pore (Samunya et al., 2013). The SMP content of the sludge mixed liquor decreases by the addition of SBAC, which decreases these two functions and slows membrane fouling.
Variation of EPS on membrane surface with time
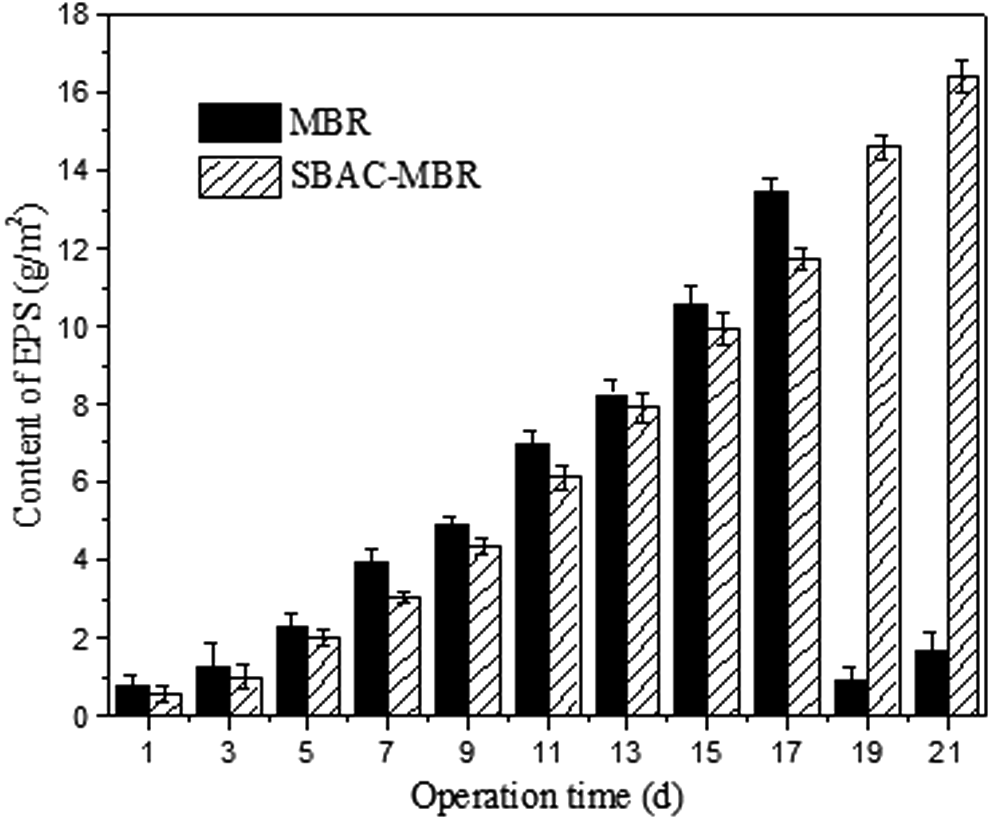
EPS in the MBR was not only in the sludge mixed liquor but also cross-linked the membrane by chemical bonds, which decreased the membrane's permeability and increased the filtration resistance (Marco et al., 2013). The content and composition of EPS can directly change the structure and characteristics of the cake layer on the surface of the membrane. This study investigated the changes in the EPS contents on the surfaces of the membranes in both the MBR and SBAC-MBR reactors with time (Figs. 6 and 7).
Variation of the EPS content on membrane surface with operation time.

Variations of the contents of protein and carbohydrates in EPS on membrane surface with operation time.
Figures 6 and 7 show that the EPS, protein, and polysaccharide contents increased gradually with time during the operational period because the EPS on the surface of the membrane came from the sludge mixed liquor in the reactor (Cho and Fane, 2002). During the initial period of operation, EPS accumulated in the reactor, which increased the contents of EPS, protein, and polysaccharide in the reactor over time and consequently increased the contents on the surface of the membrane, which led to the formation and growth of a cake layer on the surface of the membrane. A comparison of the EPS, protein, and polysaccharide contents in the MBR with those in the SBAC-MBR (Figs. 6 and 7) shows that adding SBAC decreased the EPS, protein, and polysaccharide contents, which is consistent with the influence of SBAC on the EPS, protein, and polysaccharide contents. On the other hand, the decrease of EPS content led to higher rigidity of the cake layer on the surface of the membrane, which effectively prevented EPS and SMP from reaching the membrane surface and thus reduced membrane fouling (Tian et al., 2011).
Variation of TMP in the reactor with time
In this study, the effluent fluxes of both reactors were limited to 20 mL/min by adjusting the speed of the effluent pump and keeping the membrane effluent flux constant; so the TMP was used as an indirect indicator of membrane fouling in the reactor. When the TMP of the reactor exceeded 40 kPa during the operational period, the membrane module was removed to be cleaned thoroughly and reloaded into the reactor after recovery of the flux. Figure 8 shows the variations of the TMP in the MBR and SBAC-MBR with time.

Variation of TMP in reactors with operation time. TMP, transmembrane pressure.
TMPs in both the MBR and the SBAC-MBR increased gradually with time during the operational period at a nonuniform rate. In the initial operational period, the TMPs increased slowly; the TMP in the MBR increased from 0.38 to 3.44 kPa in the first 10 days, while the TMP in the SBAC-MBR increased from 0.40 to 4.01 kPa in the first 10 days. The TMP then increased exponentially over time in both reactors. A comparison of the two curves shows that the TMP in the SBAC-MBR was higher than that in the MBR in the early period because the SBAC particles and substances in the sludge mixed liquor rapidly attached to the membrane surface; thus, membrane fouling was worse in the SBAC-MBR.
Subsequently, the TMP in the SBAC-MBR increased more slowly than that in the MBR because of the loose adhesive layer of SBAC on the membrane surface, which could easily be removed by the shear stress of aeration (Ng et al., 2006). Furthermore, the SBCA prolonged the period of the slow increase of TMP; this period increased from 6 to 10 days because of the addition of SBAC, which extended the operational cycle of the reactor. The TMP exceeded 40 kPa on day 17 in the MBR and on day 21 in the SBAC-MBR. Thus, the operational cycle of the SBAC-MBR was 4 days longer compared with the MBR, which indicates that SBAC can reduce the rate of membrane fouling in the reactor.
Variations of foulants on membrane surface in reactor
Infrared spectrum analysis of foulants on the membrane
FT-IR was used to identify different groups of foulants on the membrane (Fig. 9). The absorption peaks of the foulants on the membrane in both the MBR and the SBAC-MBR were at the same location, which indicates that the foulants on the membranes in both reactors contained the same kind of groups. The absorption peaks at 3400 cm−1, which are assigned to the hydroxyl group stretching vibration modes, appeared in the spectra of the foulants on the membranes in both reactors (Saha et al., 2007). The peaks at 2945 cm−1 were assigned to the C-H bond stretching vibrations, and the peaks at 1385, 1550, and 1650 cm−1 were assigned to amide III, amide II, and amide I, respectively, which are unique groups of protein secondary structure and indicate that the foulants on the membrane in both reactors contained proteins (Thygesen et al., 2014). The absorption peaks at 1100 cm−1 were assigned to the C-O bond stretching vibrations, which indicates that polysaccharides were present (Nataraj et al., 2008). Therefore, the analyses of the FT-IR spectra showed that proteins and polysaccharides were the main components of the foulants on the membranes in both reactors.

FT-IR spectra of foulants on membrane surface.
A comparison of the two FT-IR spectra of the foulants on the membrane surfaces in the MBR and SBAC-MBR shows that the peaks of the foulants in the SBAC-MBR at 1100, 1385, 1550, and 1650 cm−1 were weaker than those of the foulants in the MBR, which indicates that the foulants on the membrane in the SBAC-MBR contained fewer proteins and polysaccharides. The previous analysis showed that the membrane foulants in the MBR were from the sludge mixed liquor that made direct contact with the membrane module; proteins and polysaccharides were the main components of the EPS and SMP in the sludge mixed liquor of both reactors, and the protein and polysaccharide contents in the SBAC-MBR were lower than those in the MBR. Hence, the previous analyses of the contents and compositions of the EPS and SMP in both reactors are consistent with the FI-IR spectra.
Fluorescence spectrum analysis of foulants on membrane
The dissolved organic matter of the foulants on the membrane surfaces in both the MBR and SBAC-MBR was characterized by EEM to analyze the influence of SBAC on the composition and properties of the foulants on the membrane surface (Fig. 10).
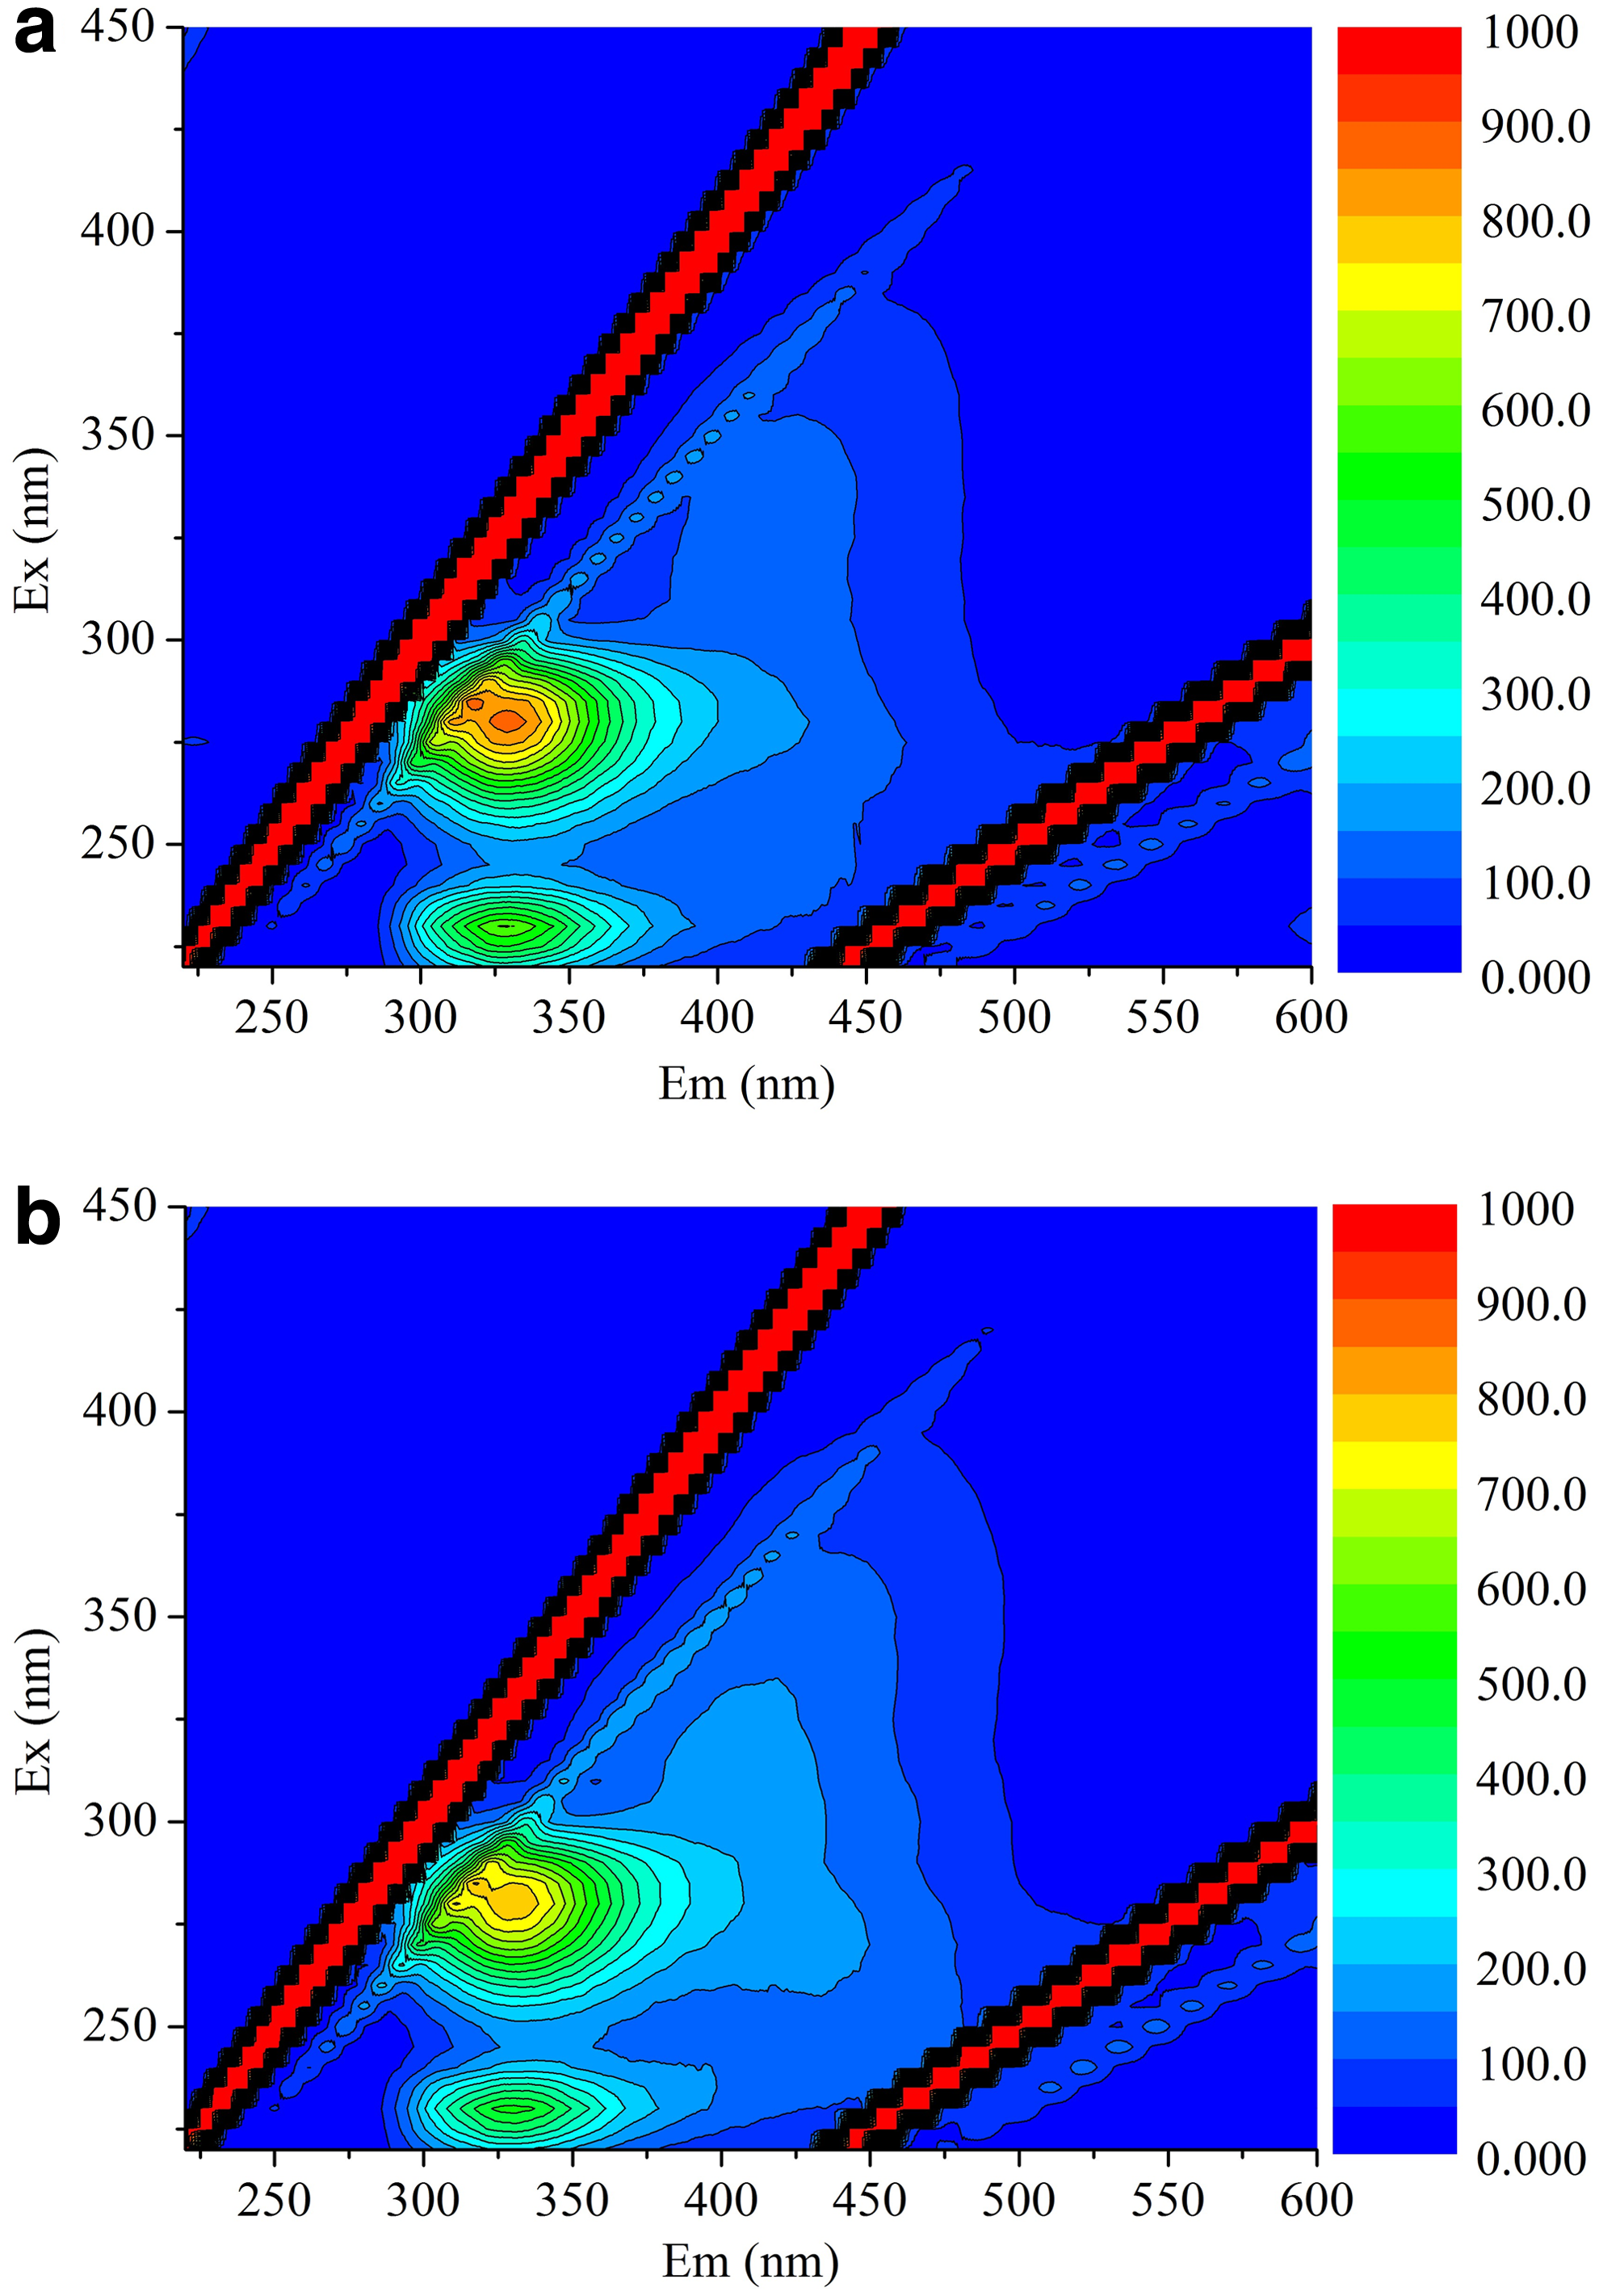
EEM fluorescence spectra of foulants on membrane surface:
Based on the ranges of the excitation wavelength (Ex) and emission wavelength (Em), the fluorescence spectra could be divided into five regions. Regions I and II (Ex < 250 nm, Em < 350 nm) represent the fluorescence response region of aromatic proteins, Region III (Ex < 250 nm, Em > 350 nm) represents the fluorescence response region of fulvic acid compounds, Region VI (250 nm < Ex < 280 nm, Em < 380 nm) represents the fluorescence response region of compounds of soluble microbial by-products, and Region V (Ex > 250 nm, Em > 350 nm) represents the fluorescence response region of humic acid compounds (Zhu et al., 2011).
Figure 10a shows that the EEM fluorescence spectra of the foulants on the membrane surface in the MBR contain three peaks; the first peak is located at Ex/Em = 280 nm/329 nm and has an intensity of 884.548, the second peak is located at Ex/Em = 230 nm/329 nm and has an intensity of 603.906, and the third peak is located at Ex/Em = 315 nm/353 nm and has an intensity of 179.633. The locations of these three peaks indicate that the foulants on the membrane surface in the MBR were mainly composed of aromatic proteins and fulvic acid compounds. The intensities of the first and second peaks are stronger compared with the third peak, which indicates that proteins were the main component of the foulants on the membrane surface. Figure 10b shows that the EEM fluorescence spectra of the foulants on the membrane surface in the SBAC-MBR contain two peaks; the first peak is located at Ex/Em = 280 nm/329 nm and has an intensity of 797.577, and the second peak is located at Ex/Em = 230 nm/330 nm and has an intensity of 522.662. The peaks indicate that the foulants on the membrane surface in the SBAC-MBR were mainly composed of aromatic proteins.
A comparison of Fig. 10a and b shows two differences. First, the spectra of the SBAC-MBR did not contain a peak of humic acid compounds, which indicates that the content of humic acid compounds on the membrane surface was decreased by the addition of SBAC to the reactor. There are two possible reasons for this: one is the adsorption of humic acid compounds by activated carbon, and the other is that fewer humic acid compounds were absorbed by the cake layer because the hydrophobicity of the cake layer was decreased by the SBAC, and humic acid compounds are hydrophobic (Satyawali and Balakrishnan, 2009a, 2009b). Second, the intensities of both protein peaks in the SBAC-MBR were lower than those in the MBR, which indicates that the protein content of the foulants on the membrane surface could be decreased by adding SBAC.
Conclusions
This study investigated the effects of the properties and the amount of added SBAC on membrane fouling in an MBR for treating landfill leachate. The effect of adding SBAC was assessed over 20 days. The main conclusions are as follows: (1) Adding SBAC to the MBR can effectively improve the properties and structure of the cake layer on the membrane surface and reduce the contents of EPS, SMP, proteins, polysaccharides, and humic acid compounds on the membrane surface. Thus, SBAC can enhance the filtration performance by increasing the critical flux and extending the cleaning cycle of the membrane module from 17 to 21 days. Operations at higher loading rates are also possible. (2) There contents of EPS, SMP, proteins, and polysaccharides in the sludge mixed liquor of the SBAC-MBR had increasing and decreasing trends due to the variation of biological activity in the activated sludge in the reactors. However, considering the resource utilization of municipal solid waste, adding SBAC is an effective method of controlling membrane fouling in MBRs to treat high concentration wastewater. The changes in MBR performance after the addition of SBAC indicate a synergistic effect due to the combined biodegradation–adsorption process. This aspect requires further investigation.
Footnotes
Acknowledgments
This study was supported by the Open Project of the State Key Laboratory of Urban Water Resource and Environment, Harbin Institute of Technology (No. ES201417), and the National Natural Science Foundation of China (No. 51408168). The authors would like to express their sincere appreciation for the financial support for this study.
Author Disclosure Statement
No competing financial interests exist.