
Abstract
Abstract
Phosphorus and nitrogen fractions of four core sediment samples collected from the north bay of Dianchi Lake in China were analyzed. The condition of various forms of phosphorus and nitrogen varied with sediment depth among different sites, and characters of vertical distribution are discussed. Large amounts of phosphorus and nitrogen were accumulated in sediments of the shallow and estuary. The contents of phosphorus in the sediments were relatively stable over a period of time, and the variation trend of reductant soluble phosphorus showed high vertical and spatial variations, which were related to the redox state of sediments. Vertical distribution of nitrogen and fractions presented complex change tendency and there were no obvious similarities of the variation trend among all sites. Average concentrations of phosphorus decreased with the distance of the estuary in the whole profile. Results reflected that the phosphorus and nitrogen load was aggravated with time of estuary of Panlong River in recent years. Mineralization and sedimentary rates of organic matter in all sediment sites were multiple in different periods and the complicated variability of sedimentary environment exerted influence on the formation process in different sites.
Introduction
A
In addition to the external points, under certain environmental conditions, there are also internal sources such as sediments and aquatic organisms (Zhang et al., 2012). The phosphorus and nitrogen contents depend on the physicochemical conditions of sediment, the settling velocity, and the mineralization processes (Pennuto et al., 2014), and amounts of nutrient substance cannot estimate well the unintuitive crisis of eutrophication, and the research of each phosphorus and nitrogen fractions was more significant. Moreover, the historical circumstance of different phosphorus and nitrogen forms reflected by vertical distribution and their relations to physicochemical characteristics of sediment were researched to realize the potential release and mineralization (Lukkari et al., 2008).
Therefore, this research was to characterize the fractions and distribution of sedimentary phosphorus and nitrogen of the bay adjacent to the Kunming city in Dianchi Lake, to elucidate the contributions of the phosphorus and nitrogen exchange, thereby assist water quality restoration.
Methods
Study sites
Most area of Dianchi Lake (24°40′–25°02′N, 102°36–103°40′E) is Plateau Monsoon System of warm temperate zone (Liu et al., 2009). The average altitude of lake is 1887.5 m, and the drainage area is 292 km2, with a maximum length of 36.3 km (N-S) by width of 12.9 km (W-E), average depth of about 4.4 m, and total water capacity of 15.7 × 10⁸ m3 (Xue et al., 2007). Through textual research from the relevant institutions, the urbanization and industrialization level of Dianchi basin with the most concentrated population is the highest in Yunnan province. From 1992 to 2014, the population increased from 1.86 million to 3.77 million, and agricultural population was 0.48 million, urbanization rate reached 88%, and the GDP increased about 110 times.
The study area is adjoined to the north shore of Dianchi Lake and Panlong River to a depth of approximate 3 m, with depth generally ranging between 2 m and 4 m. Meanwhile, stock dam of bay effectively prevents the soil into the lake. Therefore, on account of narrow, the area is affected relatively simple by the exogenous. The surface area is 2 km2, and its mean water storage is about 6 × 10⁶ m3. Discharge in the study area tends to be very considerable, mainly responding to entry from Panlong River. Through the monitoring focus on Panlong river by our research team in recent 30 years, it showed that stream-discharge record at the estuary ranged from 0.11 to 77.30 m3/s between 1999 and 2013; in addition, the Panlong river carried 3.50–46.00 mg/L of suspended matter containing around 0.18–1.28 mg/L of total phosphorus (TP) and 2.70–32.80 mg/L of total nitrogen (TN) between 1999 and 2012.
Sampling
Sediment samples were collected from four sites from the north bay in the lake in June 2013, and corresponding overlying water samples were collected in each month in 2013 (Fig. 1 and Table 1). The core sedimentary samples were sliced into ten copies on surface (0–10 cm), and remaining were according to 2 cm. All samples were sieved with 150 μm for research.
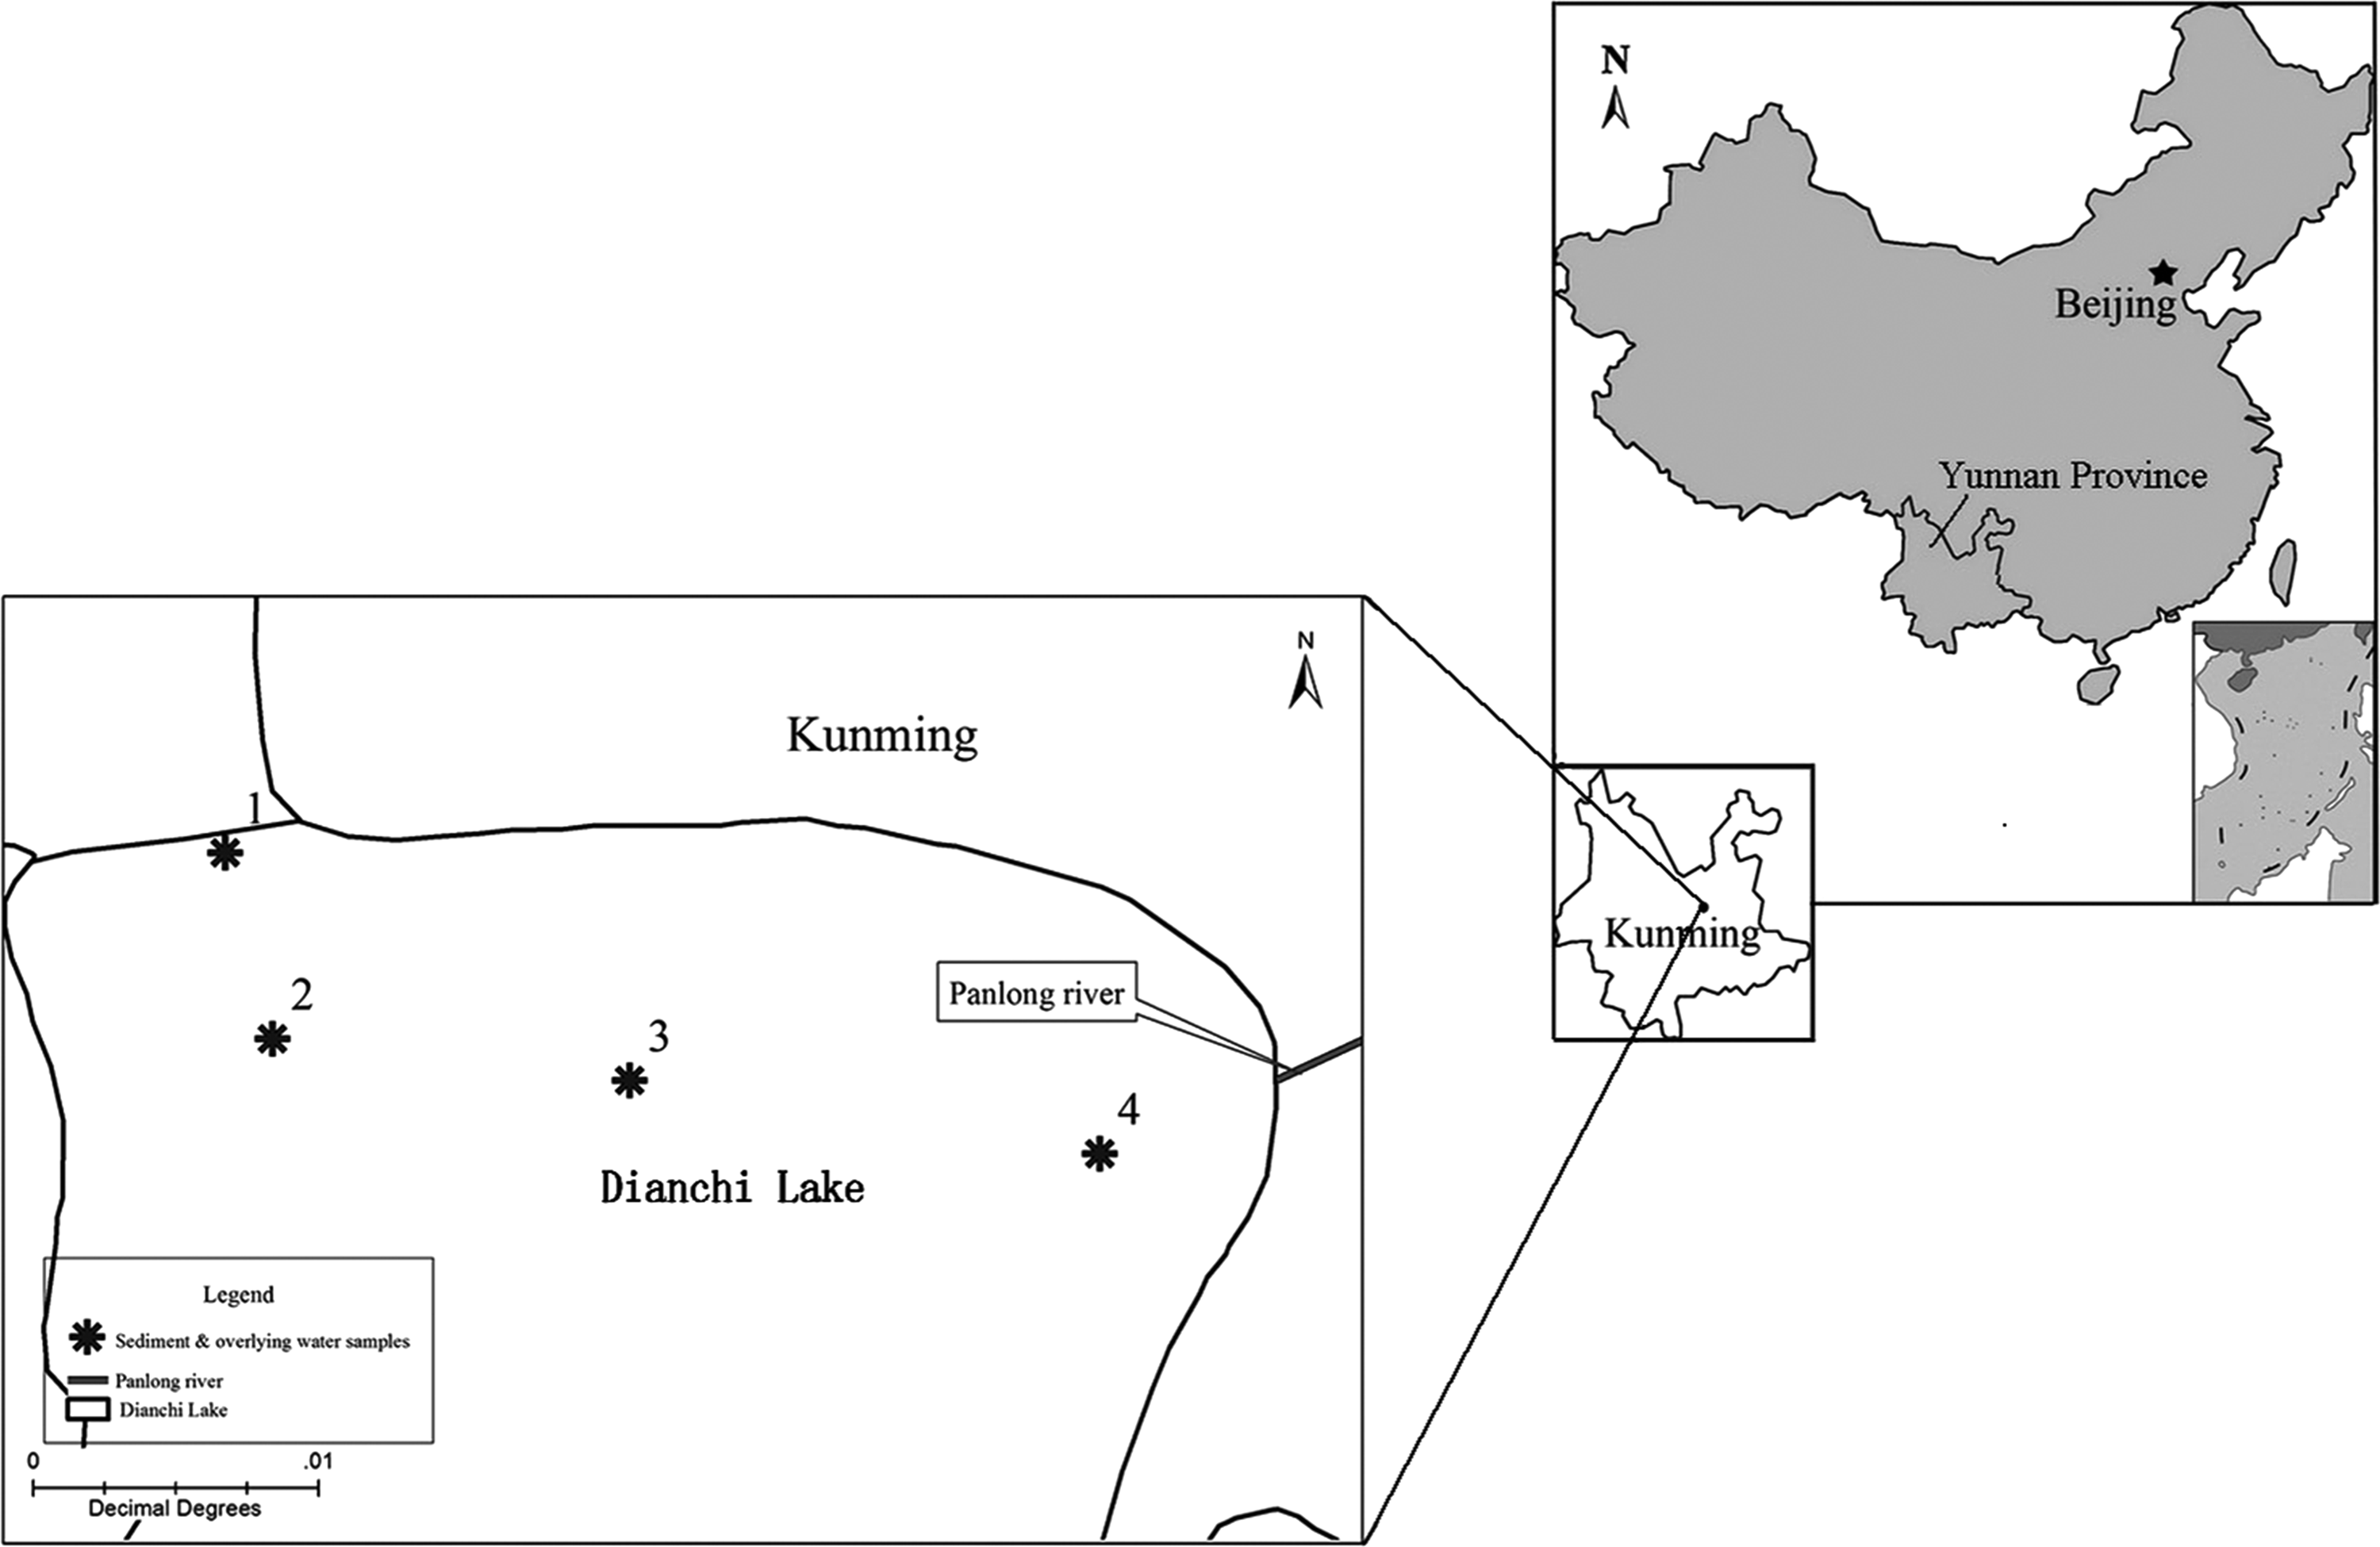
Map of sampling sites of the Dianchi Lake.
Analytical Method
Water samples
The parameters (DO, pH, TP, PO43−-P, TN, NO3−-N, and NH4+-N) of overlying water were determined by methods described by Eaton and Franson (2005).
Sediment
TP and TN were acquired by spectrophotometer (Hansen and Koroleff, 1999). The subsequent leaching was used for phosphorus-fraction of sediments (Psenner et al., 1984). The constituents were grouped into loosely sorbed form (NH4Cl-P) (1M NH4Cl, shake 2 h), reductant soluble form (BD-P) (0.11 M NaHCO3-Na2S2O4, shake 2 h), metal oxide bound form (NaOH-P) (0.1 M NaOH, shake 24 h), and calcium bound form (HCl-P) (0.5 M HCl, shake 24 h). The subsequent leaching was used for nitrogen fraction (Song et al., 2002). The TN was divided into transferable nitrogen form (Trans-N) and fixed nitrogen form (FN), and the Trans-N was grouped into exchangeable nitrogen form (IEF-N) (1M KCl, shake 6 h), weak acid extractable nitrogen form (WAEF-N) (HAC-NaAC, adjust Ph to 5, shake 6 h), strong alkali extractable nitrogen form (SAEF-N) (0.1 M NaOH, shake 24 h), and strong oxidation extractable nitrogen form (SOEF-N) (20 g/L K2S2O8, 2.4 M NaOH, shake 6 h, digested in 115°C).
Results and Discussion
Water samples
The parameters of overlying water are shown in Table 2. The TN and TP were clearly the highest in S4 and minimum in S1. The contents of TN and TP followed the general order of S4>S3>S2>S1, which decreased with the increase of distance of the estuary, and the distance from each site to estuary is 3,945 m (S1), 3,541 m (S2), 2,287 m (S3), and 797 m (S4), respectively. There were similar concentrations of each member of the three outermost sampling sites of Panlong River. S4 also exhibited the highest NH4+-N, NO3−N and PO43−-P concentration. It suggests that the content of each member is reduced by the diluting effects of the lake from the estuary, and insinuates of the Panlong River is the main source of phosphorus and nitrogen, which have been accumulated in sediments of the shallow and estuary.
Sediment
TP concentrations in whole sediments were as follows: 242.50–756.50 mg/kg in S1, 213.44–1112.43 mg/kg in S2, 843.75–2115.62 mg/kg in S3, and 1669.66–3754.50 mg/kg in S4 (Fig. 2). The peak concentrations adjacent to estuary of Panlong River were recorded in S4, and the average TP concentrations followed the order of S4>S3>S2>S1 and decreased with the distance of the estuary in the whole profiles. In contrast, TP contents generally decreased with depth. So it turned out that the phosphorus load exacerbated with time of the catchment area in recent years. In S1 and S2, the variation of the vertical distribution was less, suggesting that the contents of TP in the sediments were relatively stable over a period of time. One peak appeared at 16–18 cm in S4, while the simultaneous decreased of TP in whole profiles. It might be due to the biogeochemical processes, account for more dominant on the vertical distribution of phosphorus, and exceeded the sediment accumulation rates (Ruttenberg and Berner, 1993).
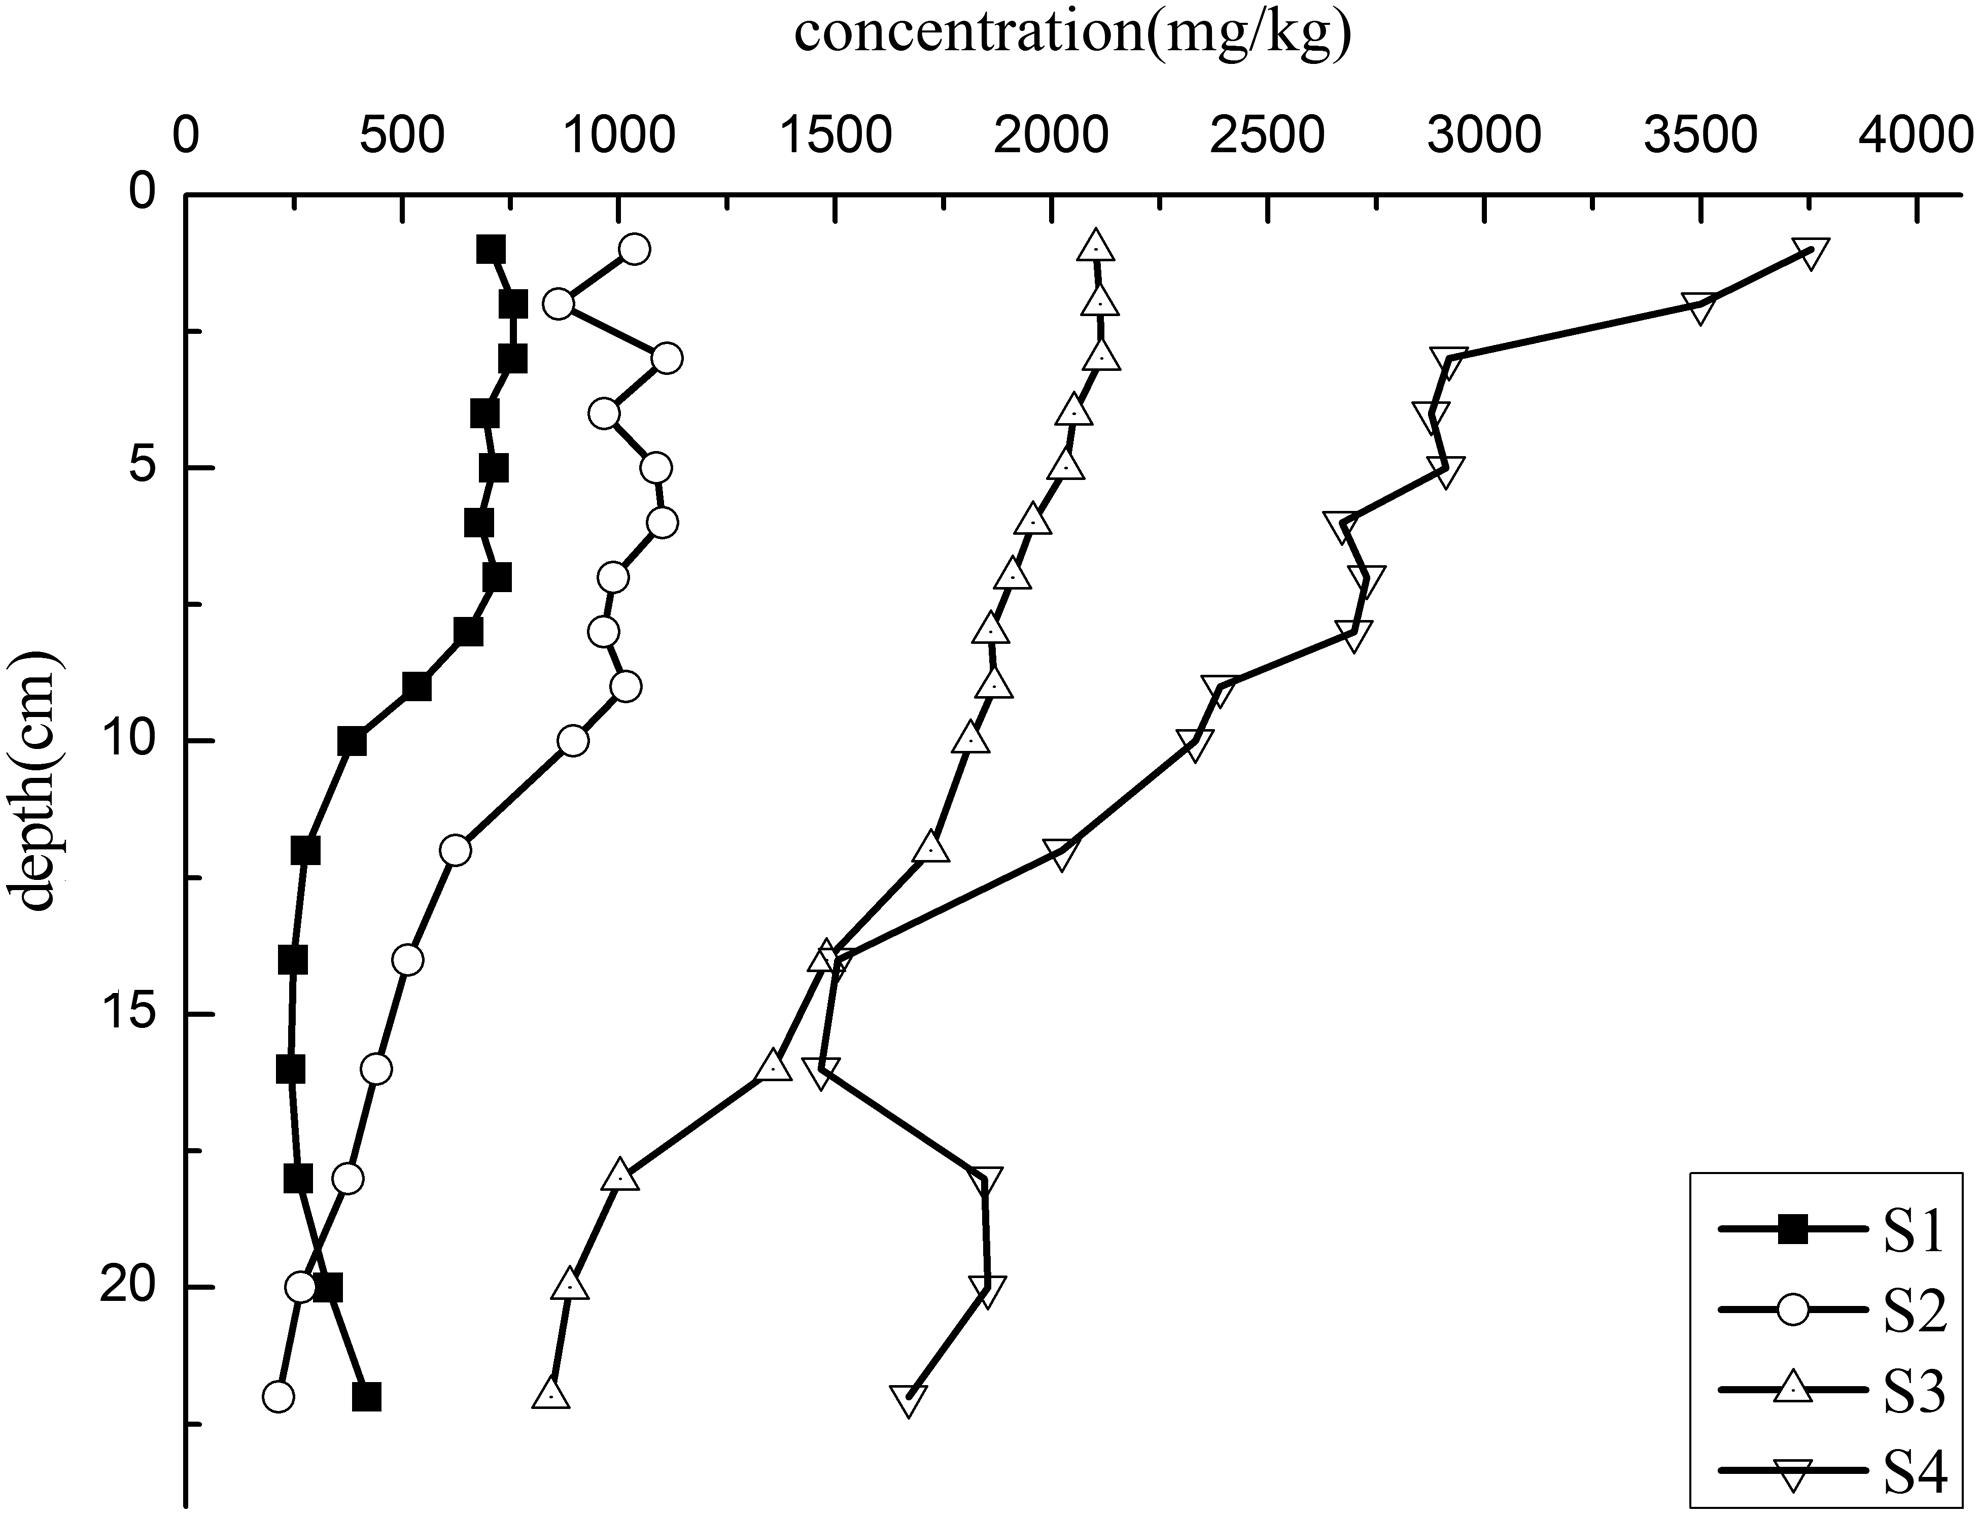
Vertical profiles of TP in four sediment cores of the Dianchi Lake, showing TP concentration versus depth. TP, total phosphorus.
The contents of each phosphorus form accorded with the relation of NaOH-P > HCl-P > BD-P > NH4Cl-P in whole profiles. And occupancy rate of each component for the inorganic phosphorus in sediments (amounts of each composition) is presented in Table 3.
NH4Cl-P is a phosphorus compound with periodic variation, which could keep in the interstitial water (Moorleghem et al., 2013). The content in each sediment sample was relatively low as follows: 2.46–12.45 mg/kg in S1, 2.01–17.38 mg/kg in S2, 2.51–10.87 mg/kg in S3, and 8.62–32.09 mg/kg in S4 (Fig. 3). The contents of NH4Cl-P followed the order of S4>S2>S1>S3 in whole profiles. NH4Cl-P contents generally decreased with depth, and similar to TP, the highest content was shown collected from S4 in surface layer where the content of outward released PO43—P flux was the highest. Even though NH4Cl-P comprised a rare content, it is important because it could directly affect aquatic organisms by diffusion from sediment into the water (Okubo et al., 2012). The NH4Cl-P represents 0.34–2.91% of the inorganic phosphorus in whole study area (Table 3), similar to other calcareous lakes with oversaturation (Penn et al., 1995).

Vertical profiles of NH4Cl-P in four sediment cores of the Dianchi Lake, showing NH4Cl-P concentration versus depth.
BD-P is a phosphorus compound mainly combined to Fe/Mn compounds, and the composition is regarded as a main source for endogenous phosphorus load, so it is used to evaluate the available phosphorus in sediments (Ribeiro et al., 2008), and it can indicate the sort of pollutants and bottom sediments (Yue and Huang, 2005). In sediments from the eutrophic lake, low content of reductive phosphorus tend to have been associated with low content of DO and bacterial activity, which could enhance release of BD-P (Perkins and Underwood, 2001). The BD-P concentrations exhibited high variability at all sites (Fig. 4). BD-P contents in S4 (109.64–389.50 mg/kg) adjacent to estuary of Panlong River were almost three times higher than S1 (39.87–142.69 mg/kg). The contents of BD-P followed the relation of S4>S3>S2>S1 in whole profiles. This indicates that the distribution of BD-P is related to the humanity to a certain extent. BD-P contents generally decreased with depth, and similar to TP, the highest content was shown collected from S4 in surface layer. This phenomenon is possibly ascribed to decline of Fe3+ and interception of diffused phosphorus to surface of Fe oxide in upper layer of sediment (Anschutz et al., 1998). It is related with the redox state of sediments. The redox potential of surface sediment is higher than that from the bottom, thus, the deeper the level, the more Fe3+ transform to Fe2+. Moreover, amorphous minerals tend to order gradually, the bonding force of oxide-Fe and hydroxide-Fe with phosphorus is weaker. Nevertheless, significant contents of BD-P were also found in the relatively lower levels. A possible explanation for this is: in the relatively deep of the sediments, the humus and abundant Fe2+ on Fe-oxide surfaces make the Fe compounds difficult to convert to reduction state (Hyacinthe and Van Cappellen, 2004).

Vertical profiles of BD-P in four sediment cores of the Dianchi Lake, showing BD-P concentration versus depth.
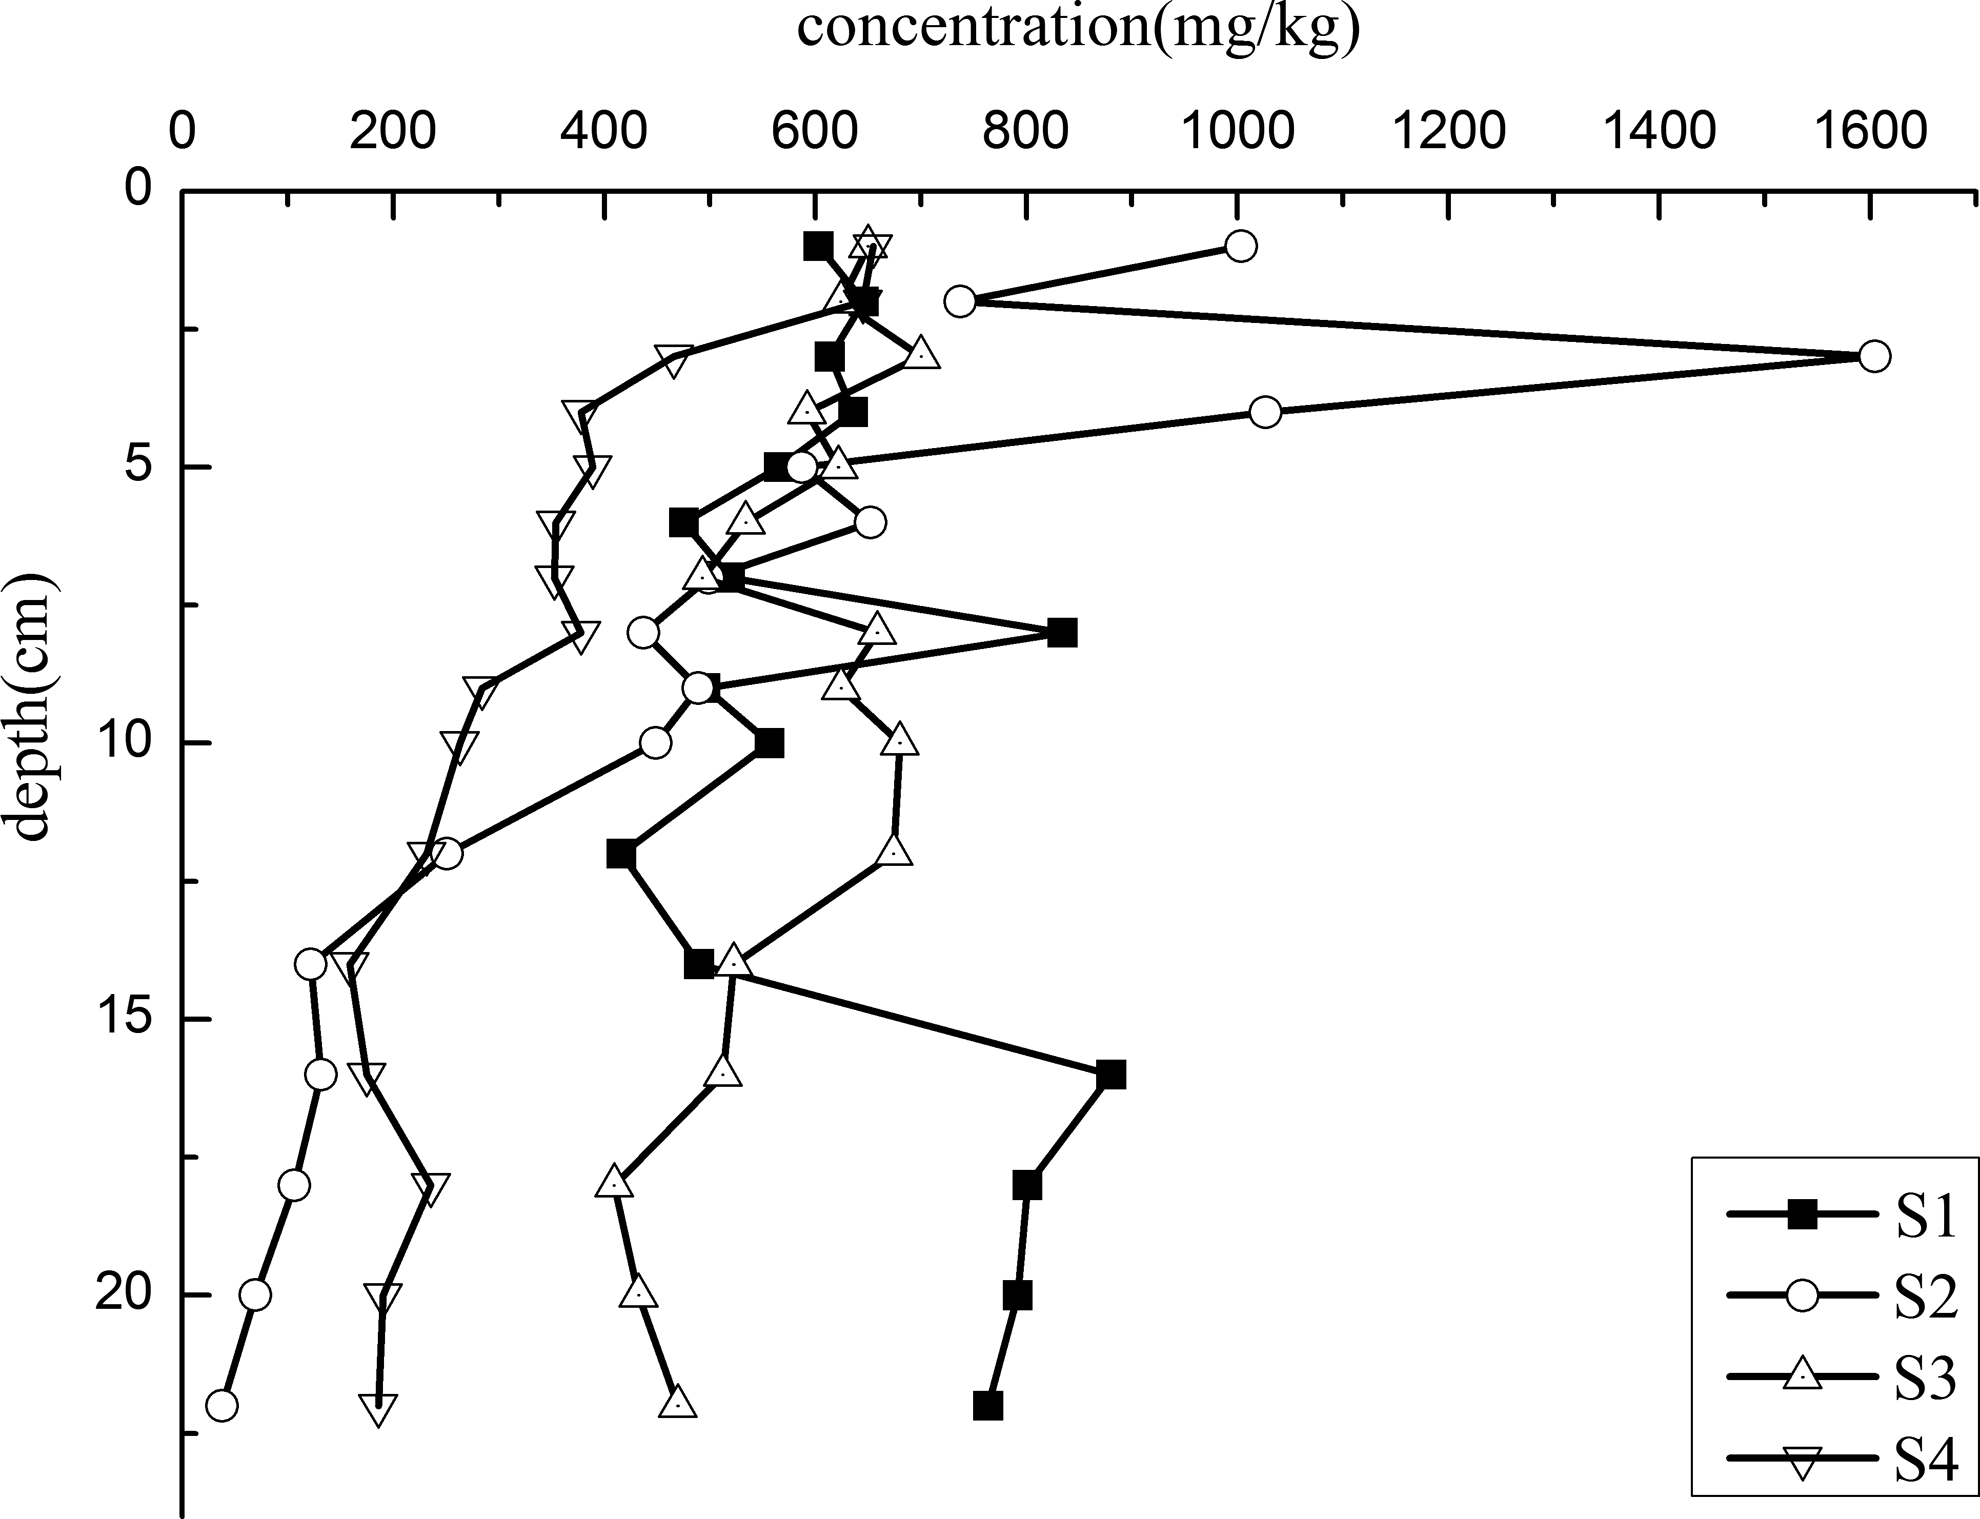
NaOH-P represents phosphorus combined to Al/Fe oxides principally; this component could be released in hypoxia (Jan et al., 2015). NaOH extractable phosphorus could evaluate the available phosphorus in sediments. The contents of NaOH-P were the highest of various forms: 20.50–108.95 mg/kg in S1, 34.16–266.53 mg/kg in S2, 177.44–650.65 mg/kg in S3, and 707.52–1338.27 mg/kg in S4 (Fig. 5). The contents of NaOH-P followed the relation of S4>S3>S2>S1 in whole profiles. This fraction was the most composition of TP in all sites ranging from 10.95% to 71.75% (Table 3). It may indicate that there was abundance of Al and Fe oxides, which retain phosphorus. The content of NaOH-P was the highest in S4, where it varied most significantly with depth. The contents of NaOH-P in S1 and S2 varied relatively unobvious, and this phenomenon confirmed that this component was stable in natural conditions, while in S3 and S4 sites, they decreased with sediment depth.

Vertical profiles of NaOH-P in four sediment cores of the Dianchi Lake, showing NaOH-P concentration versus depth.
HCl-P represents phosphorus bound to Ca. This component of TP is relatively stable compared with other fractions above. However, it would tend to be sensitive under the condition of low pH (Kufel et al., 2013). The HCl-P concentrations in the whole sediments were as follows: 18.91–253.27 mg/kg in S1, 47.02–399.60 mg/kg in S2, 260.02–623.89 mg/kg in S3, and 214.39–606.87 mg/kg in S4 (Fig. 6). The fraction was high in the shallow sites and the high content could be attributed to the massive background values of Ca compounds and F compounds, which could catalyze and accelerate the precipitating of Ca through riverine inputs in the basin. The contents of HCl-P followed the relation of S4>S3>S2>S1 in whole profiles, which indicated that HCl-P concentration was also affected by the input concentration of extraneous source phosphorus from the Panlong River.
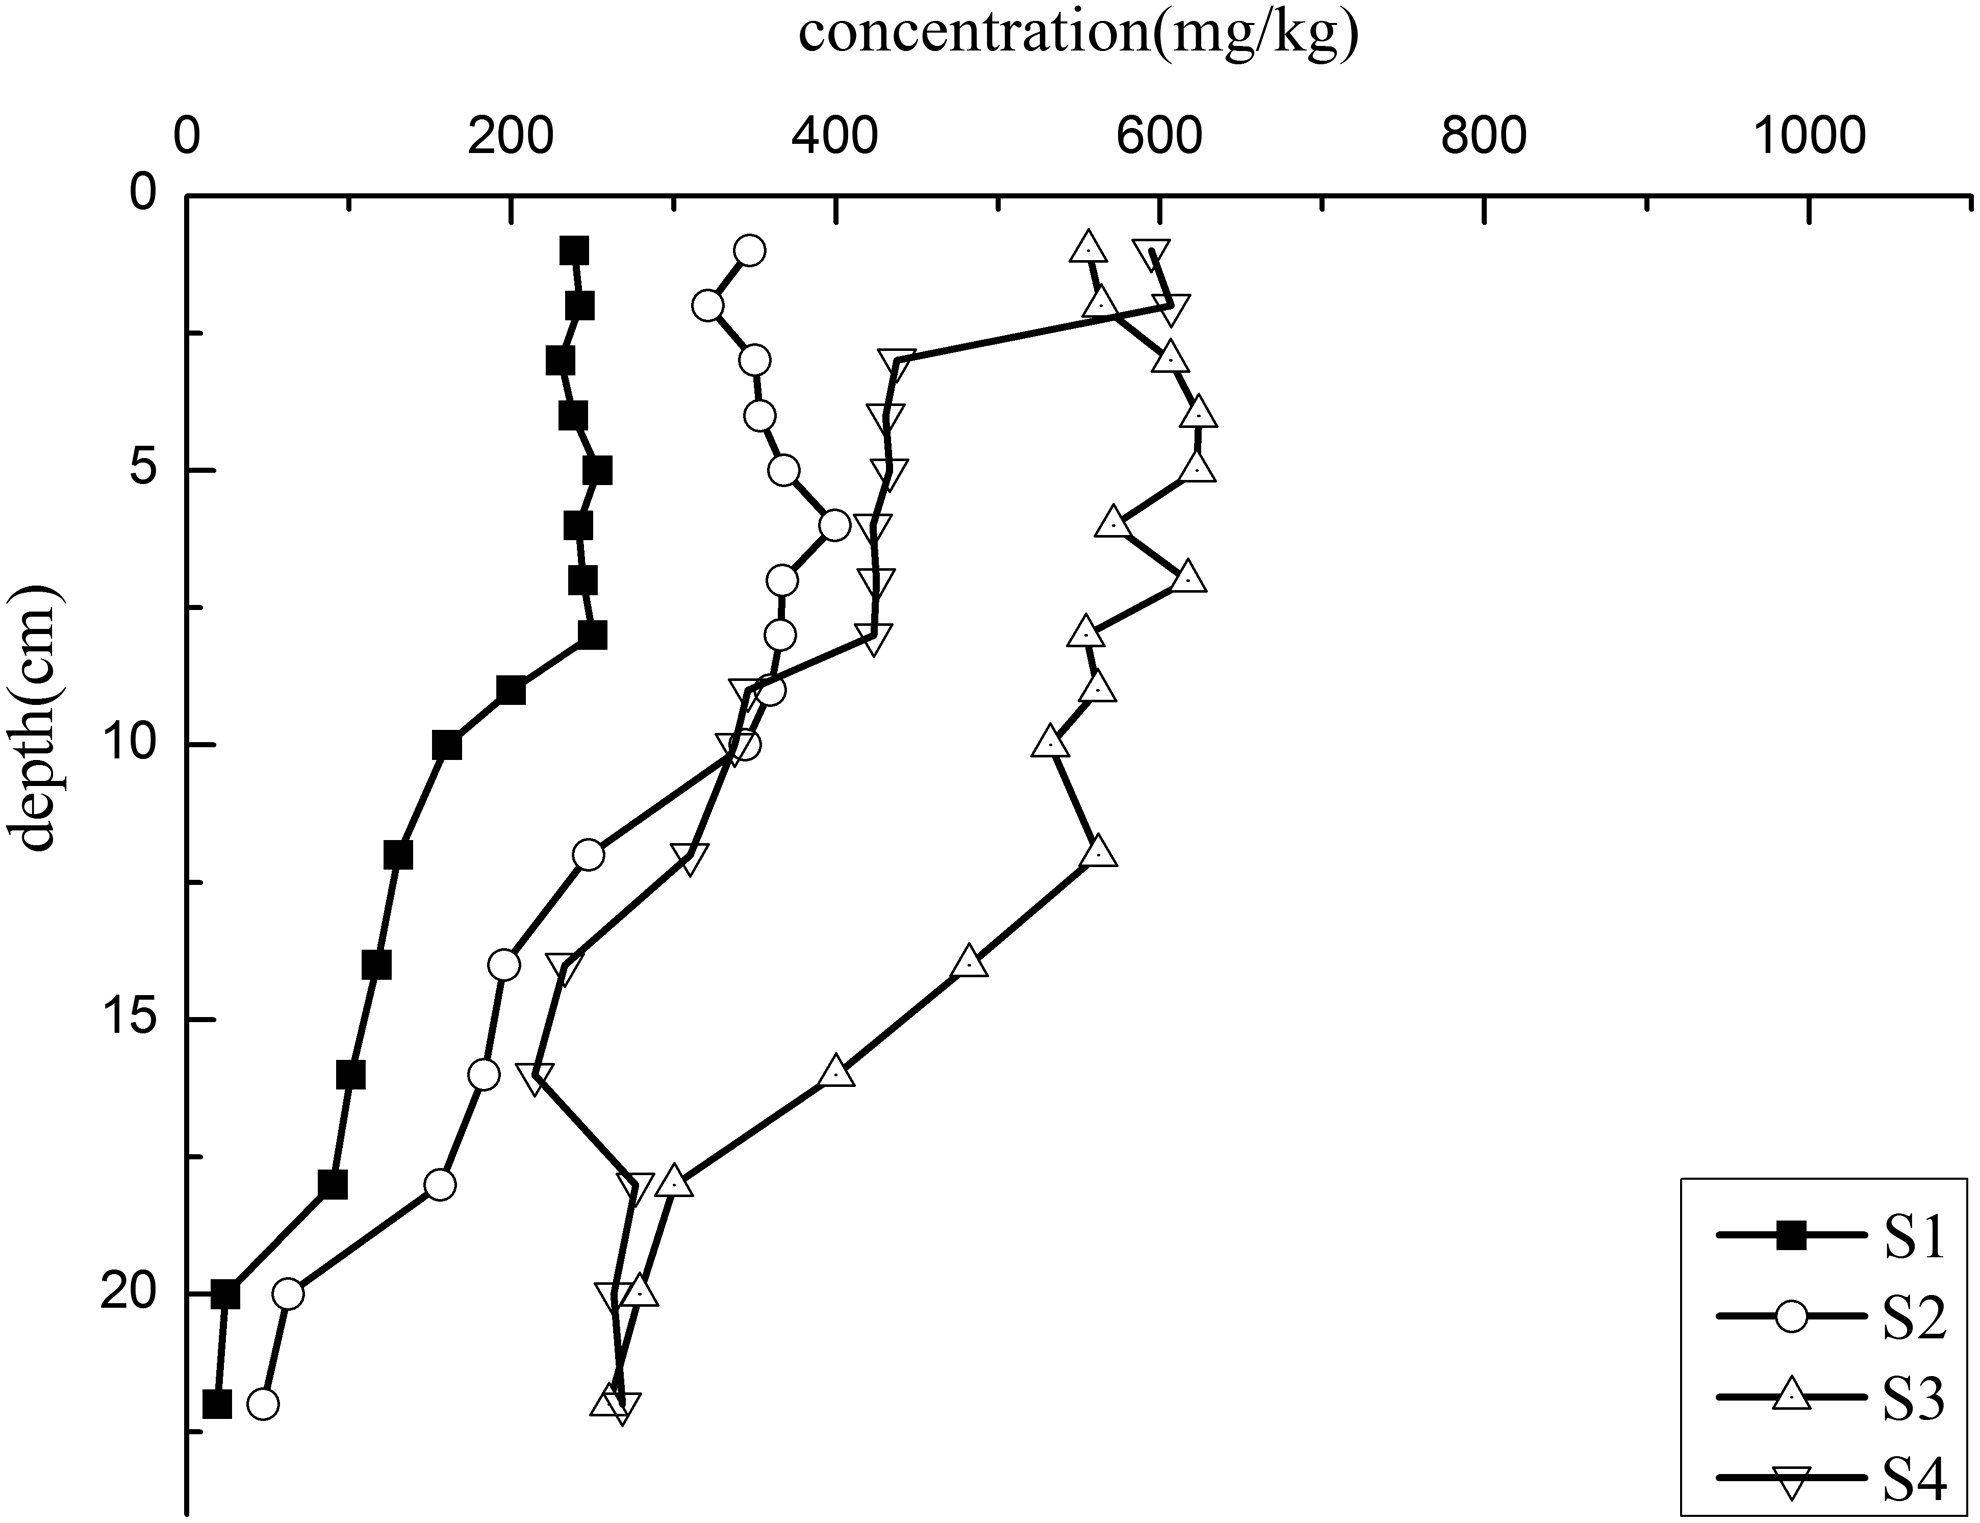
Vertical profiles of HCl-P in four sediment cores of the Dianchi Lake, showing HCl-P concentration versus depth.
Content of TN could measure the potential productivity of a lake (Wang et al., 2013), and the vertical distribution is attributed to the granularity and the origin of sediments. The TN concentrations in whole sediments were as follows: 1379.37–2503.28 mg/kg in S1, 1100.87–4480.14 mg/kg in S2, 1706.53–3076.24 mg/kg in S3, and 1893.93–4310.27 mg/kg in S4 (Fig. 7). The peak concentrations were recorded in S3, and the TN concentrations followed the order of S4 > S2 > S3 > S1 in the whole profiles. In the vertical distribution, four profile samples presented complex change tendency, in which the trends in S2, S3, and S4 were undulatingly decreasing. These results reflected the different intensity of mineralization in four profile samples and it also turned out that the nitrogen load exacerbated with time of the estuary of Panlong River in recent years.
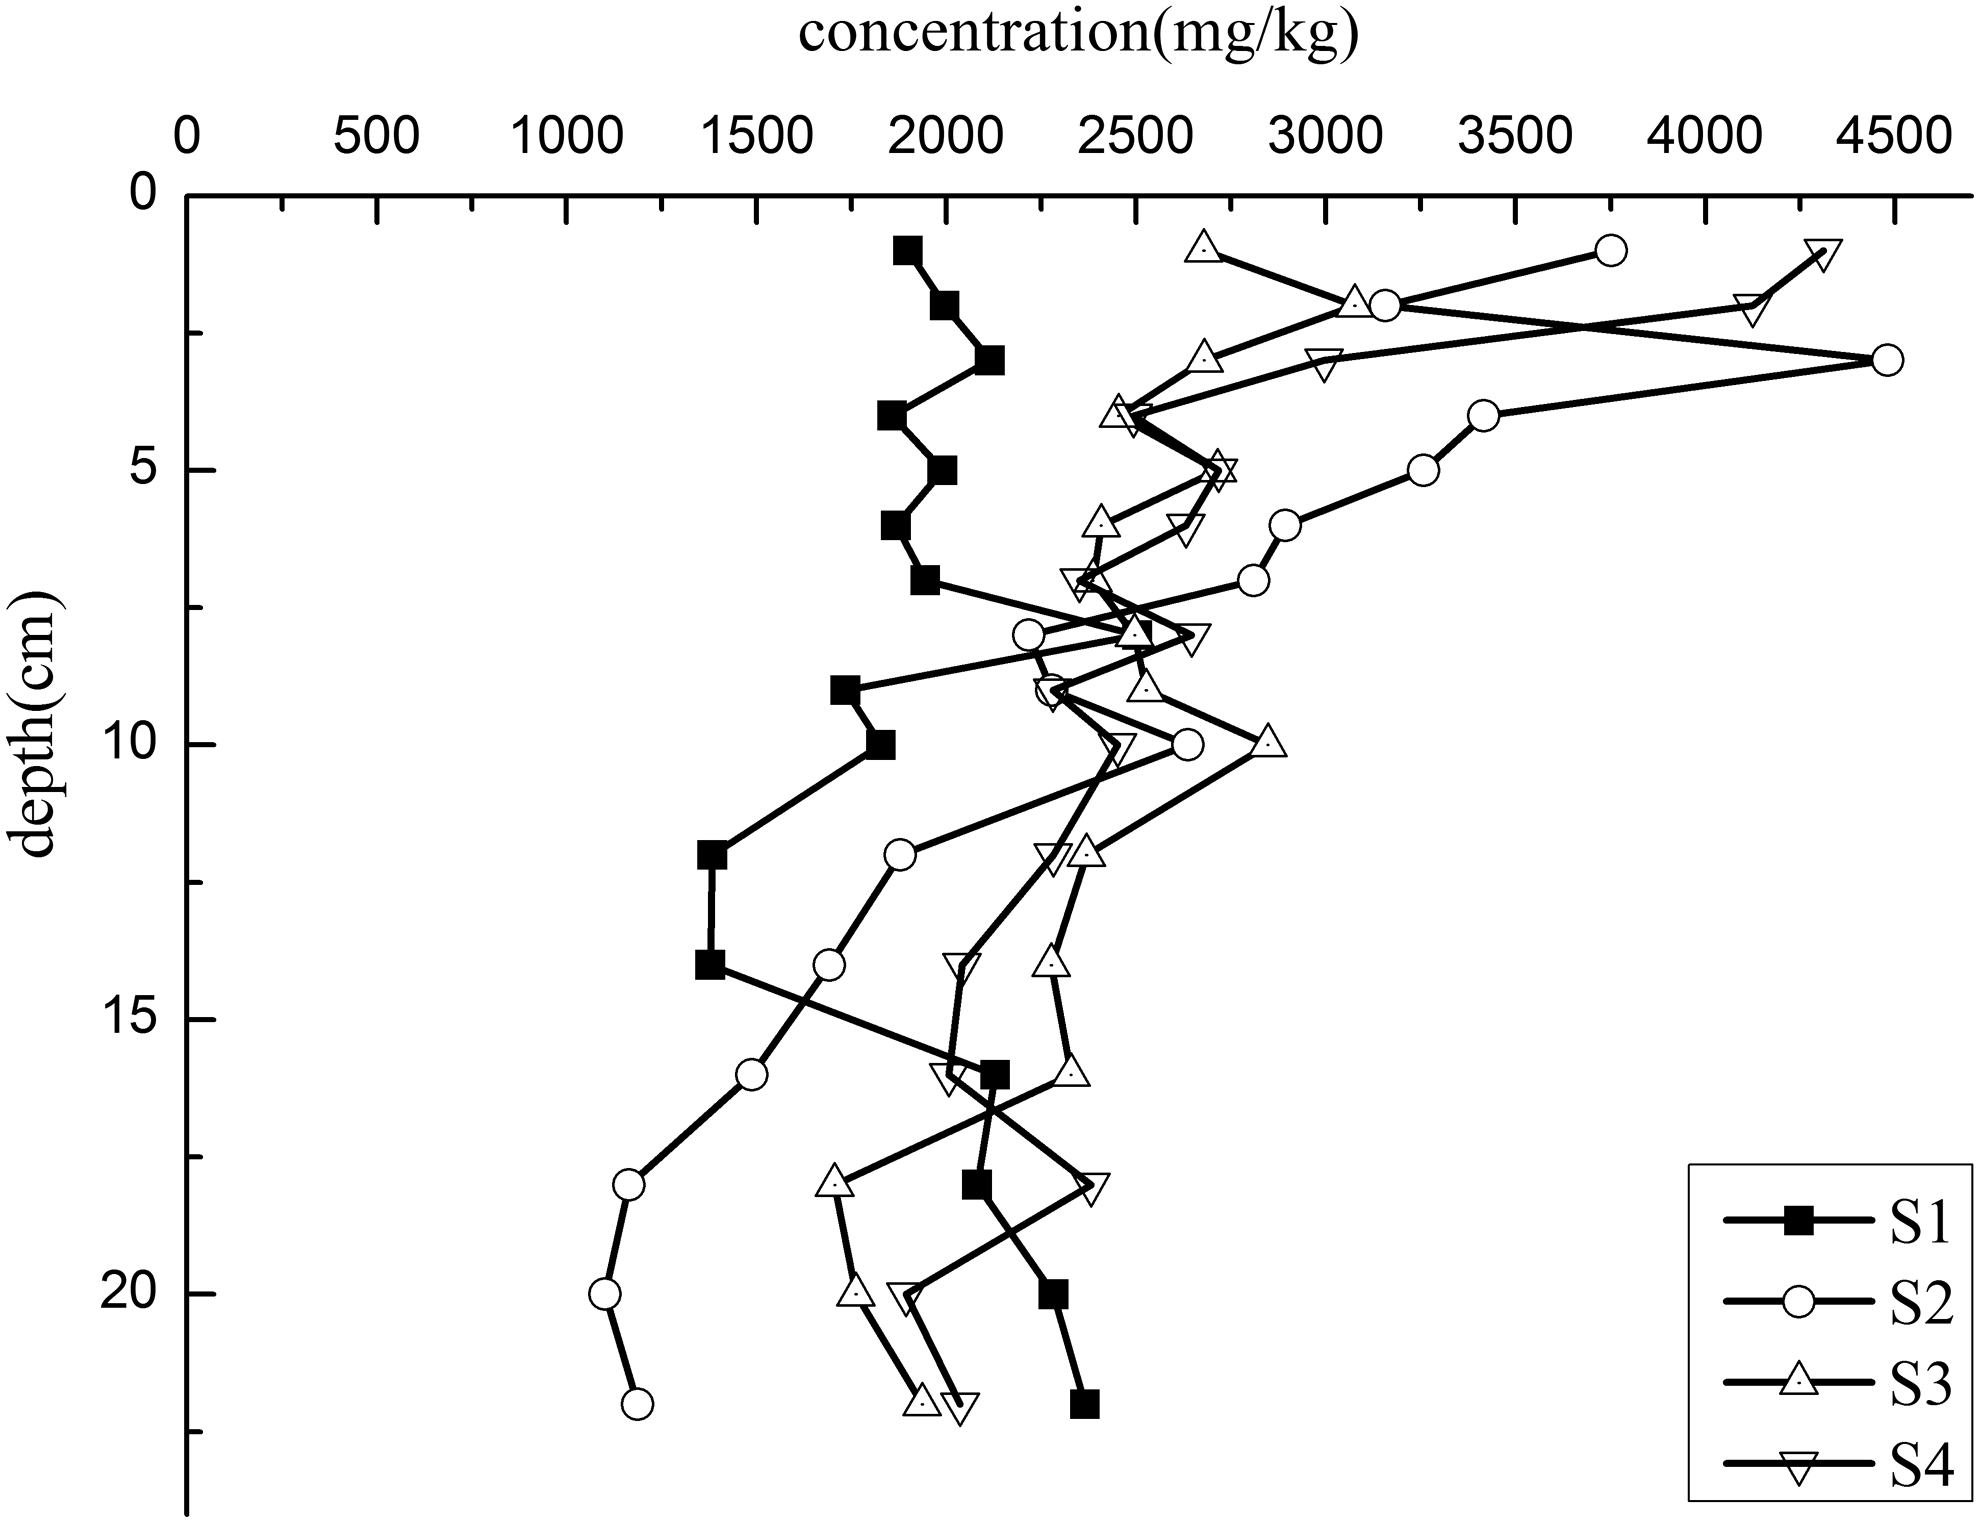
Vertical profiles of TN in four sediment cores of the Dianchi Lake, showing TN concentration versus depth. TN, total nitrogen.
Concentrations of nitrogen forms followed the relation of SOEF-N > SAEF-N > WAEF-N > IEF-N in the whole profiles. Detail of each nitrogen fraction is exhibited below.
IEF-N is the first component to participate in circulation because its stability is the weakest. The IEF-N concentrations in whole sediments were relatively low as follows: 85.65–318.43 mg/kg in S1, 66.66–138.28 mg/kg in S2, 154.29–338.23 mg/kg in S3, and 112.11–195.46 mg/kg in S4 (Fig. 8). The contents of IEF-N followed the order of S3>S4>S1>S2 in the whole profiles. In S4 site, variation trend of the content was irregularly dentate, while in S2, it is relatively slightly, and the phenomenon related to complex hydrodynamic conditions at the estuary. In the vertical distribution, four profile samples presented undulating decrease; it indicated that mineralization, which mostly occurred in the oxygen layer, gradually weaken with the increase of depth. However in S1 site, the IEF-N content decreased until 17 cm below the surface and then increased rapidly.

Vertical profiles of IEF-N in four sediment cores of the Dianchi Lake, showing IEF-N concentration versus depth.
The binding capacity of WAEF-N is equal to carbonate. The WAEF-N concentrations in whole sediments were as follows: 95.21–304.00 mg/kg in S1, 127.94–673.51 mg/kg in S2, 388.02–756.06 mg/kg in S3, and 156.55–572.24 mg/kg in S4 (Fig. 9). The content of WAEF-N is affected by many factors, especially pH and granularity in the sediments. The contents of WAEF-N followed the order of S3>S2>S4>S1 in the whole profiles. The concentrations change appreciably with sediment depth, and there were no obvious regularity and similarities of the variation trend among all sites. This indicated that the mineralization and sedimentary rates of organic matter in all sediment sites were multiple in different periods.

Vertical profiles of WAEF-N in four sediment cores of the Dianchi Lake, showing WAEF-N concentration versus depth.
SAEF-N is nitrogen adsorbing on metal oxides (Fe oxide or Mn oxide), and the component is susceptible to the oxidation-reduction status of sediment. The SAEF-N concentrations in whole sediments were as follows: 114.96–203.94 mg/kg in S1, 272.04–485.83 mg/kg in S2, 44.99–75.89 mg/kg in S3, and 506.80–1068.08 mg/kg in S4 (Fig. 10). The contents of SAEF-N followed the order of S4>S2>S1>S3 in whole profiles. The average SAEF-N concentrations were significantly different in the whole profiles. In S1 and S3, the variation trend of contents was relatively homogeneous, while in S2 and S4, it fluctuated distinctly with depth. In different positions, the main existence forms of SAEF-N were not identical. In S1, S2, and S4, the main occurrence formations of SAEF-N were ammonia nitrogen; and the similar contribution of nitric nitrogen and ammonia nitrogen was observed in S3. This reflected the complicated variability of sedimentary environment exerting influence on the formation process of SAEF-N in different sites.

Vertical profiles of SAEF-N in four sediment cores of the Dianchi Lake, showing SAEF-N concentration versus depth.
SOEF-N is nitrogen adsorbing on organic. The contents of SOEF-N in whole sediments were relatively the highest as follows: 416.36–880.65 mg/kg in S1, 37.34–1604.20 mg/kg in S2, 409.43–700.47 mg/kg in S3, and 158.55–654.59 mg/kg in S4 (Fig. 11). The contents of SOEF-N followed the order of S1>S3>S2>S4 in whole profiles. There were no obvious similarities of the variation trend among all sites, but it presented the decreasing trend upper layer. In the other sediment layers, there was no obvious regularity of the variation trend with the depth among all sites. This indicated that the mineralization and sedimentary rates of organic matter in all sediment sites were multiple in different periods.
Vertical profiles of SOEF-N in four sediment cores of the Dianchi Lake, showing SOEF-N concentration versus depth.
Parameters describing the relationship between TP and each phosphorus fraction analyzed by Pearson correlation, which tested by parametric statistical tests, are presented in Table 4. The NH4Cl-P, BD-P, NaOH-P, and HCl-P were correlated significantly with TP, with the correlation coefficient of 0.741 (p < 0.01), 0.880 (p < 0.01), 0.944 (p < 0.01), and 0.770 (p < 0.01), respectively. Parameters describing the relationship between TN and each nitrogen fraction analyzed by Pearson correlation, which tested by parametric statistical tests, are presented in Table 5. The IEF-N, WAEF-N, SAEF-N, and SOEF-N were positively correlated with TN, with the correlation coefficient of 0.276 (p < 0.05), 0.594 (p < 0.01), 0.390 (p < 0.01), and 0.642 (p < 0.01), respectively.
Correlation is significant at the 0.01 level (2 tailed).
TP, total phosphorus.
Correlation is significant at the 0.05 level (2 tailed).
Correlation is significant at the 0.01 level (2 tailed).
TN, total nitrogen.
Conclusions
The content of each member was reduced by the diluting effects of the lake from the estuary, and insinuating the Panlong River was the main source of large amount of phosphorus and nitrogen, which were buried in the research area.
Contents of phosphorus were relatively stable over a period of time, and the biogeochemical processes, account for more dominant on the vertical distribution of phosphorus, exceeded the sediment accumulation rates in the sediments. Similar to TP, in the drainage basin, each phosphorus form generally decreased with depth, and this indicated that human activities were intensified by the population growth in recent years. The variation trend of BD-P showed high vertical and spatial variations, and it was related with the redox state of sediments. HCl-P was rather stable with great content, varied indistinctly.
Results reflected that the nitrogen load aggravated with time of estuary of Panlong River. The order of the Trans-N was SOEF-N > SAEF-N > WAEF-N > IEF-N. The vertical distribution presented complex change tendency, and the concentration of each form did not change appreciably with sediment depth, and there were no obvious similarities of the variation trend among all sites. This indicated that the mineralization and sedimentary rates of organic matter in all sediment sites were multiple in different periods. The main occurrence formations of IEF-N, WAEF-N, and SOEF-N were ammonia nitrogen. The main existence forms of SAEF-N were not identical in different positions. This reflected the complicated variability of sedimentary environment exerting influence on the formation process of SAEF-N in different sites.
Footnotes
Acknowledgments
This work was supported by the National Natural Science Foundation of China (Grant No. 41301599) and the National Science and Technology Major Project for Water Pollution Control and Treatment (2012ZX07102-004). In this study, the authors acknowledge the experimental work and data provided by the Yunnan Key Laboratory of Pollution Process and Management of Plateau Lake-Watershed.
Author Disclosure Statement
No competing financial interests exist.