
Abstract
Abstract
Water loss in low permeability reservoirs during hydraulic fracturing well completions typically results in a decrease in natural gas production due to capillary trapping near the fractures. Shale gas reservoirs, however, have shown a trend of improved gas production with increased loss of completion fluids to the shale. This nonintuitive relationship between water imbibition and enhanced gas production in shale gas reservoirs is explored here through investigation of shale wettability alteration after exposure to two surfactants, one cationic and one anionic, commonly used in hydraulic fracturing fluids. Wettability alteration of samples from two unconventional natural gas reservoirs, the Marcellus and Collingwood shales, was examined in this study. In addition to individual surfactant solutions, 1:1 mixtures of cationic and anionic surfactants were examined at concentrations above and below critical micelle concentration levels. This study provides deeper understanding of adsorption mechanisms of cationic, anionic, and mixed ionic surfactants on the Marcellus and Collingwood reservoirs. Mixed surfactants were observed to alter wettability of shale from intermediate water-wet to more oil-wet and lower the capillary pressure and interfacial tension between gas and liquid phases at very low concentration (<0.45 mM). Such a reduction in capillary pressure may reduce capillary trapping of natural gas by imbibed treatment water and may help explain why natural gas production in the Marcellus and Collingwood has been observed to increase even after water is lost to the reservoir during shut-in periods.
Introduction
H
Researchers have begun to investigate this unusual correlation between water loss and gas production (Fan et al., 2010; Dehghanpour et al., 2013). Dehghanpour et al. (2013) observed that water imbibition can induce microfractures in organic-rich shale, thereby enhancing shale permeability and promoting faster water imbibition rates. In addition, rapid imbibition of water can enhance gas relative permeability by cleaning up water in fractures. Countercurrent flow can help explain higher initial gas production, but not higher gas production rates over the lifetime of the well. Another hypothesis explaining the relationship between gas production and water loss is that poor fracture generation often results in long, planar hydraulic fractures that have high-conductivity and less permeability-enhanced area. So, the loss of larger volumes of hydraulic fracturing fluid to the reservoir may be indicative of a more efficient fracturing completion (Fan et al., 2010).
Surfactants added in hydraulic fracturing fluid may also contribute to improved gas productivity by reducing interfacial tension, decreasing water imbibition, or altering rock wettability. Both the gas and liquid phase relative permeability rates increase with the decrease of interfacial tension caused by surfactant additions (Li and Firoozabadi, 2000; Kumar et al., 2006). Capillary pressure forces in porous media dominate the behavior of fluid retention (Bennion et al., 1996). Capillary pressure (
where
Surfactants contain both hydrophilic and hydrophobic groups, so the way in which they may alter surface wettability is dependent on the amount and mechanism of adsorption on a given surface. Stronger water-wet surfaces tend to promote water imbibition. Water imbibition in oil reservoirs is considered to be a positive factor in oil recovery due to the water driving out oil from the reservoir porosity. Although many studies have examined the role of surfactants in promoting enhanced oil recovery through wettability alteration (e.g., Standnes and Austad, 2003; Adibhatia et al., 2005; Wang et al., 2012), the relationship between reservoir wettability and gas recovery in shale reservoirs is less well understood. It has been proposed that unlike oil reservoirs, liquid imbibition in tight gas reservoirs could block gas flow and maintain high residual gas saturation (Kantzas et al., 1997). To achieve less water imbibition, Sun et al. (2015) altered gas shale wettability from water-wet (49.9° contact angle) to intermediate-wet (97° contact angle) by treating the shale with a 0.0025% nonionic surfactant solution. A multitude of studies have examined how the surfactant adsorption mechanism and resulting wettability alterations are impacted by the surfactant chemical structure, mix of different surfactants, rock surface properties, composition of oil and reservoir fluids, and water conditions such as salinity, alkalinity, pH, and temperature (see e.g., Somasundaran and Zhang, 2006). However, there are fewer investigations of the impact of surfactants on gas recovery (Makhanov et al., 2014; Sun et al., 2015). With the increasing amount of gas production from tight shale reservoirs, it is necessary to put more effort toward studying the fundamental mechanisms of surfactant adsorption in enhancing shale gas production. Previous studies addressing the role of surface-active agents within the context of shale gas production have mainly focused on single surfactant effects in altering wettability and changing imbibition of gas shale (Makhanov et al., 2014; Sun et al., 2015). However, according to the report from U.S. EPA in 2015, a variety of nonionic, anionic, and cationic surfactants are often added together in hydraulic fracturing fluids (EPA, 2015). Kang et al. (2001) illustrated enhanced synergism of mixed-charge surfactant solutions by strong interactions between two different surfactants with opposite charge.
In this study, the role of mixed cationic and anionic surfactants in altering wettability of shale gas rocks is investigated. Contact angle measurements and surface tension for pure cationic surfactant, n-octadecyl trimethyl ammonium chloride (OTAC), anionic surfactant, ammonium dodecyl sulfate (ADS), and their 1:1 mixtures were assessed on shale gas reservoir rock samples taken from the Marcellus and Collingwood formations. We have chosen this combination of surfactants (cationic/anionic) to help evaluate the role of surface charge heterogeneity in producing a mixed wetting condition within the shale matrix. These particular surfactants are commonly used in tandem during hydraulic fracturing completions and their mixing parameters are well described (Kang et al., 2001). Moreover, this study characterizes the mineralogy of the Marcellus and Collingwood samples to help reveal the mechanism behind interaction of surfactants and different mineral components of gas shale reservoirs. Both formations had a mixed surface charge that allows for the adsorption of both anionic and cationic surfactants. This mixed charge provided for strong surfactant headgroup–rock surface electrostatic interactions that served to alter shale wettability from water-wet toward more oil-wet conditions at low surfactant concentrations.
Materials and Methods
Surfactants
Cationic surfactant, n-octadecyl trimethyl ammonium chloride (OTAC, C21H46NCl), and anionic surfactant, ammonium dodecyl sulfate (ADS, C12H29NO4S), were purchased from Alfa Aesar and ALDRICH Chemistry. OTAC was purchased as a solid with a reported purity of 95%. ADS was in the form of a 30% (by mass) aqueous solution. The hydrophilic heads of OTAC and ADS comprise cationic ammonium and anionic sulfate groups, respectively (Supplementary Fig. SI-1). The surfactant concentrations used in this study were 0.1, 0.2, 0.3, 0.45, 0.9, 8, and 10 mM. In addition to investigating the alteration of shale wettability attributed to each individual surfactant, 1:1 mixtures of OTAC and ADS were also investigated. The concentrations were designed according to the critical micelle concentrations (CMCs). The CMCs of pure ADS and OTAC, and ADS/OTAC mixture are 6.258, 0.392, and 0.426 mM (Kang et al., 2001). The 0.1, 0.2, and 0.3 mM concentrations are below all CMCs. The 0.45 and 0.9 mM concentrations are below the OTAC and ADS/OTAC mixture CMCs and above ADS CMC. The 8 and 10 mM concentrations are above all CMCs. Another set of ADS/OTAC mixture concentrations (0.05, 0.1, 0.15, 0.45, and 4 mM) was also evaluated to examine the impact of low surfactant concentrations on shale wettability alteration.
Shale samples
Two formations were examined in this study, the Marcellus shale and the Collingwood limestone. The Marcellus shale sample was gathered from a fresh outcrop near Bedford, Pennsylvania, and two subsamples (Marcellus-1 and Marcellus-2) were examined. The Marcellus-1 sample was used for measurements of surfactant concentrations of 0.1, 0.2, 0.3, 0.45, 0.9, and 8 mM, and the Marcellus-2 sample was used for ADS/OTAC mixture concentrations of 0.05, 0.1, 0.15, 0.45, and 4 mM. Collingwood is an organic-rich limestone that is targeted in conjunction with the Utica Shale for shale gas production in Michigan. Since these formations collectively represent the shale gas reservoir and the Collingwood sample contains ∼34 wt.% clay minerals, the Collingwood sample is referred to as the Collingwood shale throughout this article. The Collinwood samples were taken from rock core collected at a depth of 2720 m from the State Excelsior 1–24 well. Quartz slides (Fisher Scientific) and calcite (Ward's Science) were selected as examples of pure minerals for comparison with the results of Marcellus and Collingwood samples. Rock samples were cut into slices by a water-cooled diamond saw. The saw blade was washed with tap water between samples to minimize contamination of cutting surfaces. Samples were hand-polished using successively finer sandpaper (400, 600, 800, 1,000, and 2,000 grit) under running tap water. The polished surfaces were rinsed with ultrapure deionized water (DI water) and then air-dried before conducting the contact angle measurements.
Contact angle measurements
Various experimental techniques have been developed to measure the wettability of a surface. Measurement of the contact angle (θ) is the least ambiguous and perhaps the most definitive measure of wettability (Melrose, 1974). The contact angle quantifies wettability of a surface through Young's equation:
where
Contact angle measured through the aqueous phase indicates water-wetting character if it is less than 90° or oil-wetting character if larger than 90°. Young's contact angle at thermodynamic equilibrium has to be derived from the experiment on an ideally smooth, homogeneous, and rigid solid (Mittal, 2006). The polishing procedure used in this study produced a smooth surface for conducting the contact angle measurements. The degree to which the samples are homogeneous will be discussed later in the Discussion section. To limit the impact of droplet size, PB600-1 dispenser (Hamilton)-controlled syringes were used to place 10 μL sessile drops on a slide. All reported contact angle measurements are an average of five recorded drops where three images of each drop are taken using a high-resolution DSLR camera. Sessile drop contact angles were measured by ImageJ drop analysis software for each image and an average of the three contact angles is recorded for each droplet.
Surface tension measurements
Surface tension of the liquid–air interface was measured through Axisymmetric Drop Shape Analysis (ADSA), as described by Hoorfar and Neumann (2004) using the pendant drop method. These drops were suspended from a 22-gauge stainless steel needle. Approximately 1 min was allowed for the drop to stabilize before the image was taken. An average from five drops was used to estimate surface tension, with each drop imaged three times.
Results
In this study, contact angle measurements of ADS, OTAC, and ADS/OTAC mixed solutions were conducted on three shale samples. Surface tension measurements of the surfactant solutions were also completed. Petrophysical characterization of Marcellus and Collingwood samples was carried out through X-ray diffraction (XRD) and scanning electron microscopy (SEM) (Supplementary Information SI-2 and SI-3 and related discussion). Zeta potential measurements of the shale surface charges were also conducted and it was confirmed that both samples had a net negative charge between that expected of pure quartz and calcite (Supplementary Information SI-4 and related discussion).
For the Marcellus samples, the most abundant mineral is calcite (49 wt.%), followed by montmorillonite (23 wt.%), and quartz (12 wt.%). The Collingwood sample contained primarily calcite (48 wt.%), illite (34 wt.%), and quartz (13 wt.%). Both shale samples contained a minor amount of pyrite (<2 wt.%). The major compositional difference between the Marcellus and Collingwood samples is the dominant clay mineral (montmorillonite vs. illite) and relative percent weight in the rock (23% vs. 34%), respectively. Even though both illite and montmorillonite are 2:1 clays, illite is defined as a nonexpanding clay because its primary interlayer cation is poorly hydrated potassium ion (Poppe et al., 2001). Montmorillonite is a swelling clay and can alter shale properties (e.g., reduced fracture permeability) after imbibing water. However, Chenevert (1970) observed that illitic shales can also show significant physical alteration as a result of water adsorption. SEM analysis confirms the mineralogy results of the XRD analysis (Supplementary Information SI-3 and Supplementary Fig. SI-3).
Surface tension
For all ADS, OTAC, and mixed ADS/OTAC surfactant solutions, the surface tension decreases with increase in total surfactant concentration from 0.1 to 10 mM (Table 1). Reduction of surface tension may lead to reduced capillary blocking (in the case of gas) and improved sweep efficiency (in the case of oil) during production, which is one of the main functions of surfactants added to oil and gas completion fluids (Kuru et al., 2013; Sharma and Agrawal, 2013).
ADS, ammonium dodecyl sulfate; OTAC, n-octadecyl trimethyl ammonium chloride.
Contact angle
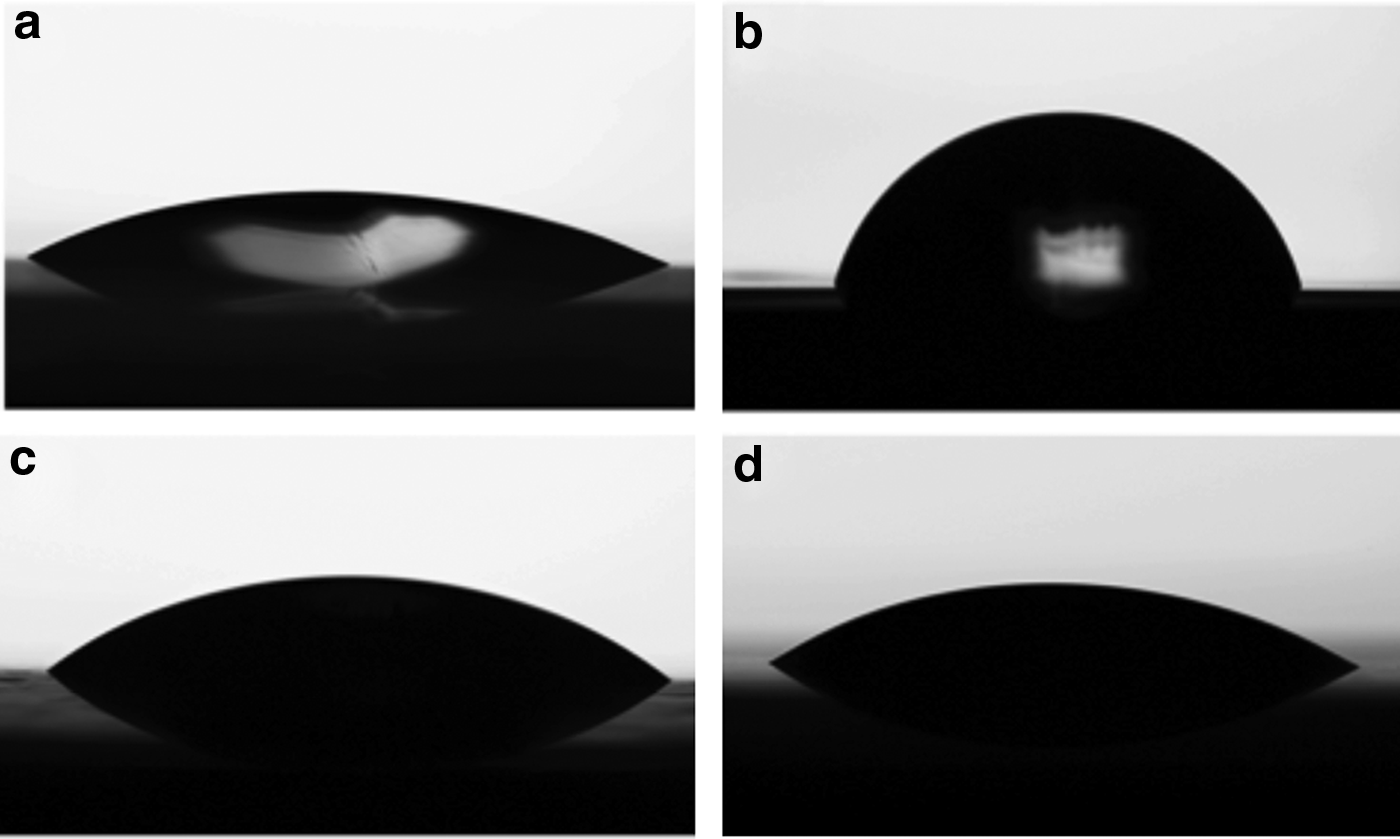
Water droplets on the various surfaces examined in this study are shown in Fig. 1. Figure 1a and b shows a DI water droplet on pure quartz and calcite surfaces, respectively. The contact angle for quartz was measured to be 26.9° ± 2.4°, which is consistent with previously reported values of water on a quartz surface (Jańczuk et al., 1986). For calcite, a contact angle of 63.8° ± 4.2° was measured. This value is also consistent with previously reported data (Mittal, 2006; Bikkina, 2011). Figure 1c and d shows the image of a water droplet on Marcellus-1 and Collingwood shale samples, with measured contact angles of 33.4° ± 2.2° and 24.7° ± 1.2°, respectively.
Wettability of
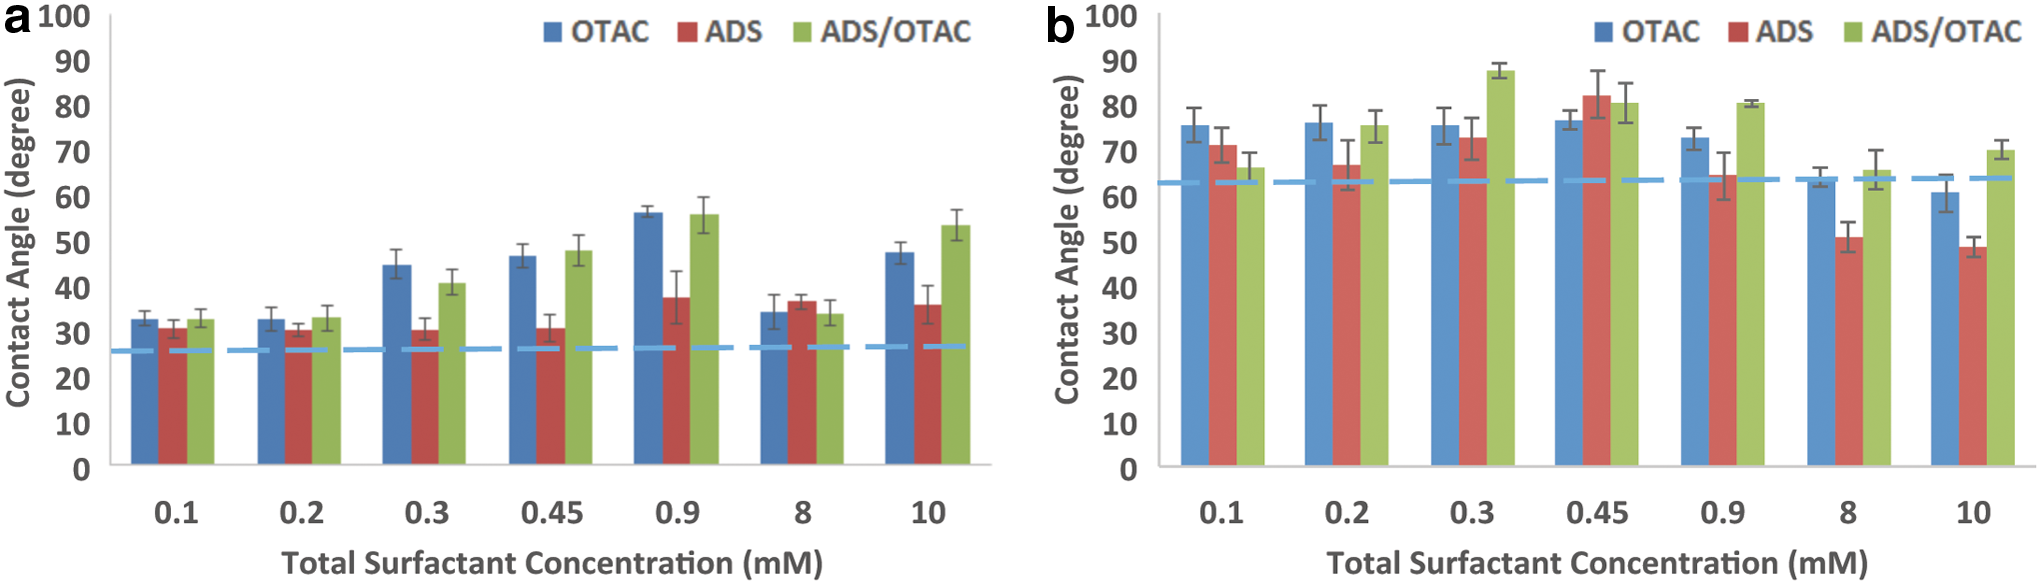
To understand the effect of surfactant adsorption on the pure mineral samples of quartz and calcite, contact angle measurements were performed for the anionic (ADS) and cationic (OTAC) surfactants and a 1:1 mixture of ADS/OTAC over a range of total surfactant concentrations varying from 0.1 to 10 mM. Figure 2 shows the comparison between contact angle values for ADS, OTAC, and 1:1 ADS/OTAC solutions on polished quartz and calcite surfaces. From Fig. 2a, it is evident that on quartz the contact angle was unchanged for all mixtures with total surfactant concentrations of less than 0.2 mM. As the total surfactant concentration is increased above 0.2 mM, the contact angle for pure OTAC and ADS/OTAC mixture increased up to 0.9 mM, after which it decreases at higher surfactant loading. For pure ADS solution, the contact angle remained nearly unchanged up to 0.45 mM, after which it increased slightly for higher ADS concentrations. In contrast to the measured contact angles on quartz, the contact angle for OTAC solutions on calcite remained unchanged for all surfactant concentrations, whereas the general trend for change in contact angle for pure ADS and ADS/OTAC mixture first increased up to 0.45 mM total surfactant concentration and then deceased with further increase in surfactant concentration.
Change in wettability of
Although the contact angle measurements on pure minerals such as quartz and calcite can provide an overall understanding of the surfactant adsorption mechanism for −/+ surface charges, surfactant-driven changes in measured contact angles for shales may vary due to nonuniform distributions of charged minerals on the shale surface or due to the presence of other components (e.g., organics). To understand the actual effect of different surfactant adsorptions on shale, contact angle experiments were also completed for ADS, OTAC, and 1:1 ADS/OTAC solutions on polished shale surfaces. Figure 3 shows the comparison of contact angles measured for ADS, OTAC, and 1:1 ADS/OTAC surfactant solutions on polished Marcellus-1 shale. The dotted line represents the contact angle for pure water on the Marcellus-1 sample (∼33.4°). Measured contact angles on the Marcellus-1 sample for all surfactant solutions were well above the pure water contact angle (at least up to 0.9 mM), which indicates a change in shale wettability due to surfactant adsorption. The shale surface is altered from highly water-wet to moderately water-wet (more oil-wet). Addition of ADS up to concentrations of 0.45 mM increased the measured contact angle on the Marcellus-1 sample. Further increases in concentration of ADS beyond 0.45 mM then led to a decrease in contact angle. In the case of OTAC, the highest oil-wet state was achieved at the lowest surfactant concentration (0.1 mM), after which the contact angle decreases with increasing total surfactant concentration. The opposite trend in contact angle change for ADS and OTAC can be explained by how quickly a bilayer is formed during surfactant adsorption on the shale surface. Bilayer development is dependent on the CMC of individual surfactants. Given that OTAC has a lower CMC than ADS, bilayer formation for OTAC occurs at lower surfactant concentration than for ADS. For the ADS/OTAC 1:1 mixture, a synergistic effect of the anionic and cationic surfactant adsorption behavior is observed. There was no significant change in the contact angle up to 0.45 mM total surfactant loading; however, at concentrations above 0.45 mM, the contact angle was slightly decreased.

Change in wettability of Marcellus shale due to different surfactant adsorption (dashed line shows the contact angle value of DI water on the Marcellus shale).
An additional set of experiments was performed on a second Marcellus sample (Marcellus-2) to better understand the synergistic effect of the mixed surfactants in altering surface wettability. This second sample, Marcellus-2, was evaluated with lower concentrations of ADS/OTAC 1:1 mixtures (0.05, 0.1, 0.15, 0.45, and 4 mM) compared with the previous experiment. Figure 4 shows the change in contact angle of ADS/OTAC 1:1 mixture on the Marcellus-2 sample for the five different total surfactant concentrations. The data are plotted on a semilog scale to better visualize the changes in contact angle with respect to surfactant concentrations. It should be noted that for the Marcellus-2 sample, a higher contact angle (51.3° ± 6.5°) was measured for a pure water droplet, indicating intersample variability in initial wetting state even though these two Marcellus samples were taken from the same rock slab.

Change in Marcellus shale wettability due to adsorption of 1:1 ADS/OTAC mixed surfactant. ADS, ammonium dodecyl sulfate; OTAC, n-octadecyl trimethyl ammonium chloride.
The 1:1 ADS/OTAC mixture initially increases the measured contact angle up to a total surfactant concentration of 0.15 mM and then serves to decrease the contact angle as surfactant concentrations are increased beyond 0.15 mM (Fig. 4). The contact angle for pure ADS and OTAC surfactant solutions was also measured for 0.1 and 0.15 mM total surfactant concentrations. Water with an ADS concentration of 0.1 mM showed a nearly identical contact angle (65.6° ± 3.4°) as the ADS/OTAC mixture (65.3° ± 2.4°), whereas the 0.1 mM OTAC solution resulted in a much lower contact angle (48.8° ± 7.6°) compared with the ADS/OTAC mixed solution. The synergistic effect of the mixed surfactants was most evident at a concentration of 0.15 mM where the contact angle for the ADS/OTAC 1:1 mixture (80.7° ± 1.6°) was much higher than of pure ADS (51.8° ± 1.7°) and pure OTAC (45.8° ± 1.7°) solutions of equal total surfactant concentration. At 0.15 mM total surfactant concentration for the Marcellus-2 sample, the 1:1 ADS/OTAC mixture demonstrated an enhanced ability to tune shale wettability from less water-wet (∼50°) to weakly water-wet (∼80°) compared with the individual ADS or OTAC solutions.
Contact angle measurements were also conducted on a sample of the Collingwood shale. Figure 5 shows the comparison of contact angle measured for ADS, OTAC, and 1:1 ADS/OTAC surfactant solutions on polished Collingwood shale. The dotted line in Fig. 5 shows the contact angle for pure water on this sample (∼24.7°). As is evident from Fig. 5, at the lowest concentration (0.1 mM) for all surfactant solutions, the contact angle was well above that of pure water, demonstrating the alteration of shale wettability from highly water-wet (∼25°) to less water-wet (∼38°). Increasing concentration of OTAC in solution resulted in a sharp decrease of the measured contact angle, and after 8 mM, the surface became totally water-wet (∼0°). In the case of ADS, the rate at which the contact angle decreased was much slower than for OTAC solutions of equal surfactant concentration, and even after addition of 8 mM ADS, the surface was not completely water-wet (∼20°). For the ADS/OTAC mixture, the contact angle also initially decreased with increasing surfactant concentration up to 0.3 mM, followed by an increase at surfactant concentrations of 0.45 mM and 0.9 mM. However, above 8 mM total surfactant concentration for the ADS/OTAC mixed solution, the contact angle again started to decrease. After 0.45 mM total surfactant concentration, the contact angle for ADS/OTAC was comparatively higher than either of the pure ADS or OTAC solutions, which suggests that the ADS/OTAC mixture was better able to alter the surface toward a less water-wet state compared with either individual surfactant.

Change in wettability of Collingwood shale due to different surfactant adsorption (dashed line shows the contact angle value of DI water on the Collingwood shale).
Wettability: spreading, immersional, and adhesional wetting
Wettability is an important three-phase property affecting two-phase flow in porous media. The wetting phase displaces the nonwetting phase by occupying solid surfaces and smaller pore spaces. There are three types of wetting that may exist depending on the way of displacement: spreading, immersional, and adhesional wetting. The driving force for each type can be measured by a different thermodynamic property: spreading coefficient (SL/S), immersional free energy (IL/S), and the work of adhesion (WA) (Cambiella et al., 2007).
In spreading wetting, a fluid in contact with a solid surface spreads over the surface and displaces another fluid. The spreading coefficient for the air–liquid–solid system is defined as follows:
By combining Equation (3) with Equation (2), S L/S can be expressed as follows:
If the contact angle (θ) is zero, the liquid will completely spread over the solid. If the contact angle is greater than zero, spontaneous spreading will not occur. The spreading coefficients for different surfactant solutions and shales systems are shown in Table 2. The changes of spreading coefficients follow the trend of changes in contact angles. Larger contact angle will result in a more negative spreading coefficient, which is indicative of the greater surface free energy required for liquid spreading.
Equation (5) demonstrates how capillary pressure is proportional to interfacial tension and the cosine of contact angle and inversely proportional to pore radius. Ignoring the impact of pore radius, capillary force is proportional to interfacial tension times the cosine of the contact angle, which is immersional free energy (IL/S) [shown in Eq. (5)].
Immersional free energy of the different surfactant concentrations used in the contact angle experiments is provided in Table 3. The immersional free energy for DI water/air/Marcellus-1 is 60.78 mN/m and 66.14 mN/m for DI water/air/Collingwood. Overall, ADS, OTAC, and ADS/OTAC solutions reduce immersional free energy of Marcellus-1 further than Collingwood. The changes of immersional free energy of the Collingwood sample for the three different surfactant solutions are consistent, where all increase from 0.1 to 0.2 M and then decrease with continued increase in surfactant concentration. The immersional free energy for Marcellus-1 and ADS also decreases with the increasing surfactant concentration. However, the immersional free energy of Marcellus-1 remains low for all concentrations of OTAC compared with DI water and increases and then decreases with the increase of concentrations of ADS/OTAC solutions.
Another index of wettability is the work of adhesion (WA), which measures the strength of adhesion of a liquid to a solid surface. The work of adhesion, WA, is defined as the amount of work needed to separate a unit area of liquid from adhesive contact with a substrate (Clint, 2001):
By combining Equation (6) with Equation (2), WA can be defined as follows:
Work of adhesion calculated according to Equation (7) for all experiments in this study is given in Table 4. Overall, the work of adhesion for Marcellus-1 is reduced further than for Collingwood. ADS and OTAC solutions reduce the work of adhesion further as the surfactant concentration is increased. However, as the total concentration of ADS/OTAC in solution increases, the change in work of adhesion varies by decreasing and then slightly increasing.
Discussion
Relative percentages of dominant nonclay minerals, calcite and quartz, are similar for the two shales. The major difference in wettability behavior of the Marcellus and Collingwood samples in this study could be a result of different mineral distributions or clay mineral content of the rocks. The connectivity of inorganic or organic pore networks could also affect the wettability of shales (Xu and Dehghanpour, 2014). SEM energy dispersive spectroscopy (EDS) was used to map element and mineral distribution within each of the two shale samples. EDS mapping confirmed a homogeneous distribution of minerals in Collingwood (Supplementary Fig. SI-3). Although less homogeneous than Collingwood, the mineral distribution in the Marcellus samples is approaching a uniform distribution at the scale of 1.2 mm (Supplementary Fig. SI-3). Therefore, at the scale of 4 mm (average diameter of a droplet in the experiments), it is reasonable to consider a uniform mineral distribution in contact with water droplets in the shale contact angle measurements of this study.
Based on contact angle measurements, any surface can be categorized into different wettability states, including totally water-wet (∼0°), highly water-wet (20°–30°), moderately water-wet (50°–60°), weakly water-wet (80°–90°), and oil-wet (>90°) (Johnson and Dettre, 1969; Anderson, 1987). From the measured contact angle values for DI water, it is clear that the pure quartz and pure calcite surfaces are highly water-wet and moderately water-wet, respectively. For both the Marcellus and Collingwood shales, XRD data demonstrate that calcite (∼48%) and quartz (∼12%) comprise a significant portion of the rock. SEM imaging also confirms that these two minerals are dominant along the shale surfaces (Supplementary Fig. SI-3) and it is hypothesized that they dictate shale wettability. The contact angle for pure water droplets on Marcellus-1 and Collingwood shale was measured to be 33.4° ± 2.2° and 24.7° ± 1.2°, respectively, which implies that initially both the shales were water-wet. Although bulk composition of the two shales was similar, spatial distribution of calcite and quartz on the shale surface is observed to be different between the two samples (Supplementary Fig. SI-3). Variability in surface coverage of calcite and quartz across different rocks may control the adsorption mechanisms after surfactant loading and thereby influence overall shale wettability changes after exposure to mixed surfactant solutions. For example, the contact angle for pure water on the two Marcellus shale samples varied from 33.4° to 51.3°. Although the contact angles were different between the two samples, the initial wetting state of both rocks was in the moderately water-wet state. The Collingwood was found to be more water-wet than the Marcellus, which may be due to the higher clay content of the Collingwood (34%) than the Marcellus (23%). The wettability changes significantly when surfactant adsorption occurs on the shale surface. Due to the complex mineralogy of shale surfaces analyzed in this study, it was preferred to study the effect of surfactant adsorption on pure minerals such as quartz and calcite first as these are two of the main mineral components of shales.
In Fig. 2a, different trends in the change of contact angle values for pure ADS, pure OTAC, and the ADS/OTAC 1:1 mixture with increasing surfactant concentration are observed. Contact angle increased with increasing surfactant loading for OTAC and ADS/OTAC solutions and remained unchanged for all ADS solutions on the quartz surface. These different contact angle trends imply different adsorption behavior of each surfactant solution. The driving forces for adsorption of ionic surfactants on oppositely charged surfaces are the coulombic attractions between surfactant ions and charged surface groups for head-on adsorption and hydrophobic interactions between hydrocarbon moieties for bilayer formation (Goloub et al., 1996). The cationic surfactant, OTAC, has a strong electrostatic interaction between its positively charged surfactant headgroup and the negatively charged quartz surface that results in strong adsorption of the headgroups on the quartz surface. Such an adsorption mechanism leads to the hydrophobic tails of OTAC being oriented upward at low surfactant concentrations and serves to make the surface more hydrophobic (Chaudhuri and Paria, 2014). As the adsorption density of OTAC on the surface increases with higher surfactant concentrations, more hydrophobic tails are oriented away from the quartz surface, resulting in higher contact angles. This trend toward less water-wetting conditions continues up to an OTAC concentration of 0.9 mM. Further increase in OTAC surfactant concentration leads to a decrease in contact angle (Fig. 2a) due to the formation of a surfactant bilayer on the quartz surface. This bilayer develops as the hydrophobic surfactant tails begin to interact and the hydrophilic headgroups of the second layer are oriented outward, increasing the hydrophilicity of the surface.
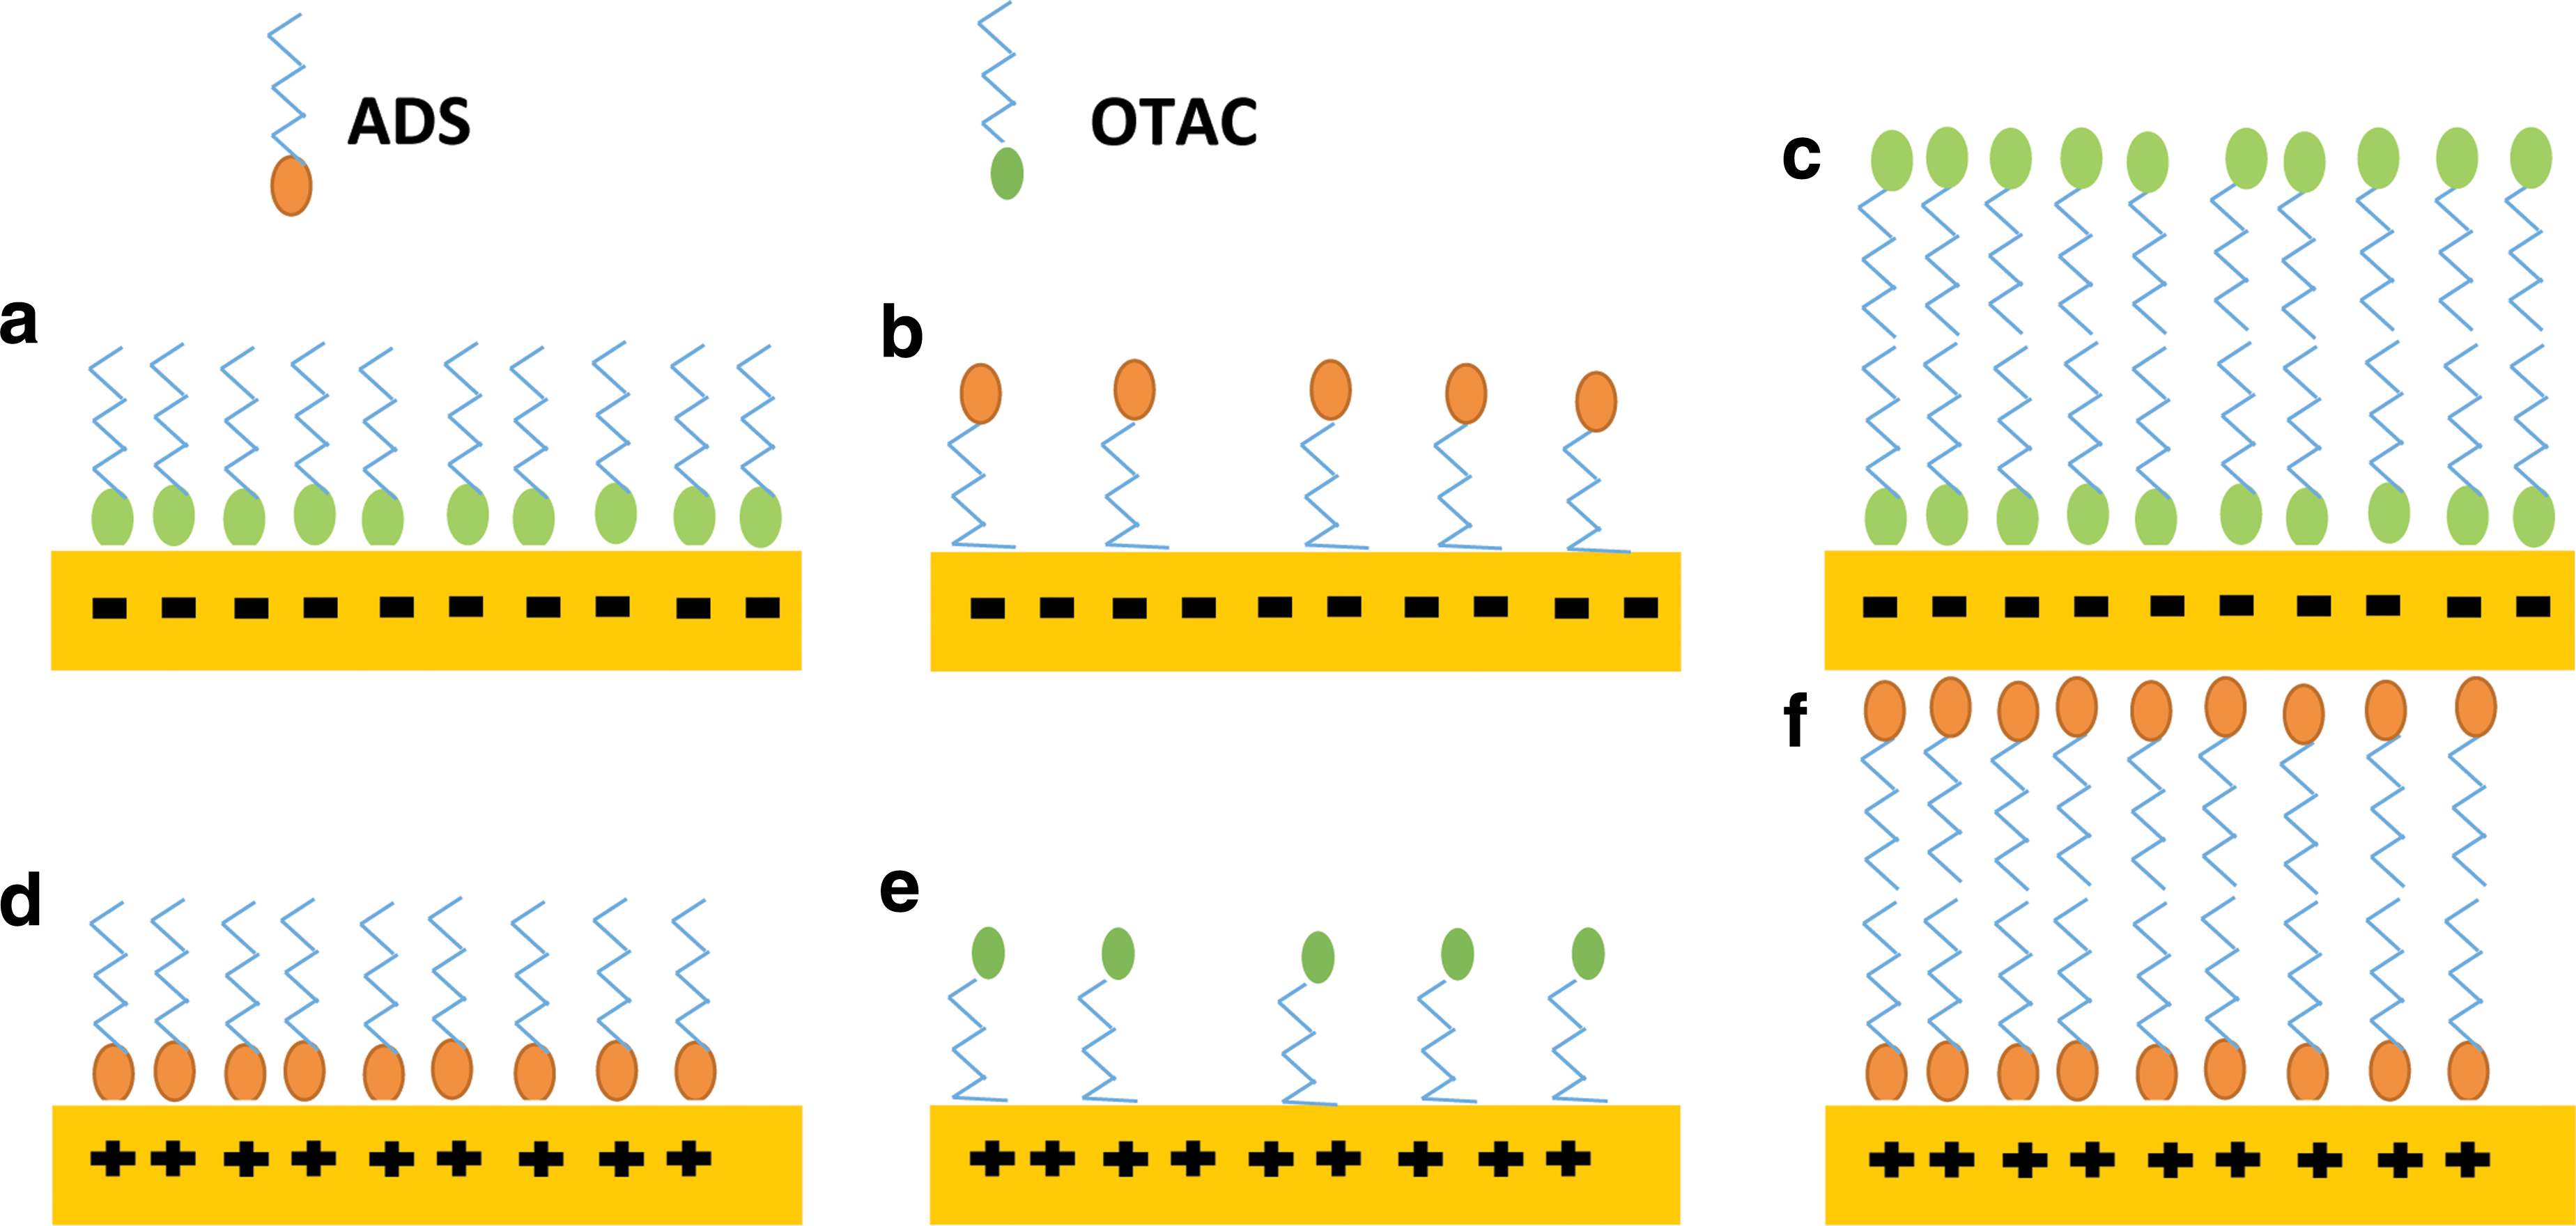
The situation is completely different for anionic surfactants such as ADS where the negatively charged headgroups are repelled by the similarly charged quartz surface. For uncharged surfaces or surfaces with the same charge sign as the surfactant, adsorption still could occur due to nonelectrostatic interaction between the head group and surface. A bilayer is immediately formed during the initial surfactant adsorption (Bohmer and Koopal, 1992). This repulsion results in low adsorption density of ADS on the quartz surface. Any small amount of ADS surfactant that does adsorb on the quartz surface occurs through weak hydrogen bond interactions between the surfactant tails and the surface with the surfactant headgroup oriented upward away from the surface (Fig. 6b) (Chaudhuri and Paria, 2014). Due to the low surfactant adsorption density, the contact angles for ADS solutions remain effectively unchanged up to 0.9 mM total surfactant concentration. A small increase in contact angle values occurs at higher surfactant concentrations (>8 mM) and may be attributed to surfactant bilayer formation where the tails in the second layer point outward. For the ADS/OTAC 1:1 mixture, the contact angle trends shown in Fig. 2a are similar to those of the OTAC solutions. This similarity is ascribed to the dominance of OTAC being adsorbed on the negatively charged mineral surface. Detailed schematics of both ADS and OTAC adsorption on the quartz surface are presented in Fig. 6.
Schematic diagram of adsorption mechanism of
Given that the surface charge on calcite is positive (Amankonah and Somasundaran, 1985), anionic surfactants such as ADS will be strongly adsorbed on the surface through headgroup–surface electrostatic interactions (Fig. 6d) in a similar manner to OTAC adsorption on quartz and will increase the hydrophobicity of the surface. The ADS solutions led to an increase in the measured contact angle for surfactant concentrations up to 0.3 mM. When the ADS concentrations were greater than 0.3 mM, the contact angle began to decrease with increasing surfactant loading due to bilayer formation. The OTAC solutions did not result in significant alteration of calcite surface wettability as the contact angle values remained unchanged up to 0.9 mM due to very low surfactant adsorption density. The observed decrease in contact angle at higher surfactant concentrations (>8 mM) represents a new trend toward more hydrophilic conditions and may be due to a sufficient amount of surfactant adsorption on the surface (surfactant heads oriented upward). For the ADS/OTAC mixture, the contact angle trend was similar to that of ADS as, in contrast to quartz, the majority of surfactant adsorbed on the calcite surface from the ADS/OTAC mixture is ADS.
The coexistence of both positive and negative charges in shale rocks is due to the presence of a combination of minerals with negative or positive charges (e.g., quartz and calcite). This mineral heterogeneity makes the surfactant adsorption behavior on shales more complex. Charged surfactants, such as ADS and OTAC, can be adsorbed on the surface either by strong headgroup–surface electrostatic interactions (at locations with oppositely charged minerals) or by weak tail–surface hydrogen bonding interactions (at locations with similarly charged minerals). A mixed orientation of surfactant tails on the surface may develop as a result of this mixed surface charge. This mixed orientation will thus dictate how contact angles and shale wettability will evolve after contact with surfactant-laden fluids (e.g., hydraulic fracturing fluids). Figure 7 presents a depiction of such proposed adsorption mechanics for ADS and OTAC on a mixed-charge shale surface.

Schematic diagram of adsorption of
Due to the interaction force mismatch along mixed-charge surfaces, the strong headgroup–surface interactions will dominate over the weak tail–surface interactions at initial low surfactant concentrations (Chang and Franses, 1995; Paria and Khilar, 2004). At low OTAC concentrations, the positively charged headgroup will be adsorbed first at negatively charged mineral surface sites, followed by sorption of the hydrophobic tail at positively charged surface sites. It will be exactly similar, but opposite, for negatively charged surfactant headgroups. Therefore, highest contact angle increase for a single charged surfactant on shales will be expected at very low concentration. As the surfactant concentration increases, the surfactant adsorption density will also increase and will result in some degree of tail–surfactant adsorption on the surface (Fig. 7a, b). The net impact on surface wettability will be balanced by the mixed orientation of surfactant tails and headgroups and one would expect less of a change in contact angle with increasing surfactant concentration. It is also possible for the increase in total surfactant concentrations to lead to bilayer formation at the surface, and depending on the orientation of tails in the first layer, the second layer could either decease or increase the contact angle for pure surfactants on shales. So, based on the total surfactant concentration and distribution of different charges on the surface, one could see different trends in contact angle change for pure surfactants on shales. For OTAC adsorption on both Marcellus-1 (Fig. 3) and Collingwood (Fig. 5), the contact angle was highest at the first tested concentration (0.1 mM) and then began to decrease with increasing surfactant concentration. This trend follows the previous explanation of increase in mixed orientation of tails with increase in total surfactant concentration. Concentrations of OTAC above 8 mM caused the Collingwood surface to become totally water wet. This suggests that the surface was completely covered by the surfactants and that at the outermost layer of the surfactant bilayer most of the headgroups were oriented outward, making the surface totally hydrophilic.
ADS adsorption on the Marcellus-1 shale (Fig. 3), in contrast to that of OTAC, resulted in an increase in contact angle up to surfactant concentrations of 0.45 mM, beyond which the contact angle started to decrease. This experimental observation can be explained by the XRD data where a relatively higher calcite content (∼49%) compared to quartz (∼12%) is observed for both the shales. So, there were more positions on the shale surface where the negative headgroups of the anionic surfactant could adsorb by headgroup–surface electrostatic interactions, thereby increasing the hydrophobicity of the surface. A higher surfactant concentration is needed to see the significant effect of mixed orientation of tails. Consequently, an initial increase in contact angle is observed up to 0.45 mM ADS concentrations and after that the mixed orientation sorption mechanism begins to show its effect by decreasing the contact angle. A similar trend in contact angle evolution with successively higher ADS concentrations was demonstrated for ADS adsorption on the Collingwood shale sample, but with a lower rate of contact angle decrease at higher concentrations compared with that associated with OTAC adsorption.
In the ADS/OTAC 1:1 mixture, both of the charged surfactant headgroups could find respective oppositely charged positions on the rock surface, as is depicted in Fig. 7c. This mixed surfactant adsorption results in an increase in surfactant adsorption density at lower total surfactant concentrations and faster surface coverage compared with the pure ADS and OTAC solutions. Minimal tail–surface interactions would be expected due to the preferential headgroup–surface interactions being the dominant surfactant sorption mechanism. This means that most of the tails would be oriented upward for low total surfactant concentrations of the ADS/OTAC mixture, which supports the hypothesis that larger contact angles would be measured at lower surfactant concentrations of the mixed surfactant solution compared with pure ADS or OTAC surfactant solutions. This synergistic adsorption also leads to faster bilayer formation for the ADS/OTAC mixture than for the ADS or OTAC solutions. Development of a surfactant bilayer eventually causes a decrease in the contact angle as the second layer of sorbed surfactants face outward with their charged headgroups (Fig. 8d, e).

Schematic representation of change in Marcellus shale wettability due to adsorption of 1:1 ADS/OTAC mixture at different concentrations:
For mixed ADS/OTAC adsorption on the Marcellus-1 shale (Fig. 3), the highest contact angle is observed at the lowest measured total surfactant concentration (0.1 mM). The contact angle values at 0.1 mM ADS/OTAC concentration were almost twofold higher than the contact angle of pure water on the Marcellus-2 sample. Then, with further increase in the total surfactant concentration, the contact angle started to decrease due to surfactant bilayer formation. The highest contact angle for ADS/OTAC adsorption on the Collingwood shale (Fig. 5) was also measured at the lowest total surfactant concentration (0.1 mM) and was well above the contact angle for pure water on that sample. The trend in changing contact angle with increasing surfactant loading of ADS/OTAC solution on the Collingwood sample was similar to that of Marcellus-1 and is also attributed to bilayer development on the rock surface. One notable observation for ADS/OTAC adsorption on Collingwood shale was the sudden increase in contact angle at 0.45 mM and 0.9 mM that might be due to some mixed orientation of surfactants at the topmost layer of the bilayer at these concentrations.
The results in Fig. 4 show the change in shale wettability due to ADS/OTAC adsorption on the Marcellus-2 shale at lower total surfactant concentrations. The trend of increasing contact angle from 0.05 to 0.15 mM represents the phase where both of the surfactants are adsorbed on the shale surface by strong headgroup–surface electrostatic interactions. The lower contact angle values for pure ADS and pure OTAC surfactant solution compared with ADS/OTAC mixture at those total surfactant concentrations implies a synergistic effect of mixed surfactants on shale wettability alteration. Figure 8 explains the mixed surfactant adsorption mechanism of ADS/OTAC on Marcellus shale. At very low total surfactant concentration (0.05 mM), the overall surfactant adsorption density is too low to cover the whole surface. As a result of this low surfactant sorption density, a contact angle similar to pure water is measured (Fig. 8a). Then, with further increase in surfactant concentration, the surface coverage increases due to increase in surfactant adsorption density (Fig. 8b, c). The contact angle values were largest at 0.15 mM total surfactant concentration where the entire surface is covered with surfactants and all surfactant tails are oriented outward (Fig. 8c). Further increases in surfactant concentration lead to the development of a surfactant bilayer and continued decrease in measured contact angles (Fig. 8d, e). The work of adhesion (WA) decreases with increasing concentration of surfactants, sharply in the low concentration, and then increases slightly by formation of bilayer adsorption (Chaudhuri and Paria, 2014). For ADS/OTAC mixtures on both Marcellus and Collingwood, WA decreases when increasing concentration to 0.1 mM and then slightly increases at 0.2 mM. This confirms that the bilayer forms near 0.2 mM.
All ADS, OTAC, and ADS/OTAC surfactant solutions sufficiently reduce immersional free energy, which indicates decreasing capillary force effects. The overall reduction of work of adhesion agrees with the results from Kuru et al. (2013) who found that surfactants could improve water drainage and postfracture well cleanup.
Conclusion
A detailed study on the effect of surfactant adsorption on Marcellus and Collingwood shale wettability was performed using contact angle and surface tension measurements. Complimentary mineralogical and surface characterization of the shales was also carried out in an effort to correlate the shale properties with the surfactant adsorption mechanism. The effect of surfactant adsorption in altering the wettability of pure quartz and calcite was also studied as these minerals have opposite surface charges (negative and positive, respectively) and represent two of the dominant mineralogical components of the shale samples. The results suggest that due to the adsorption of surfactants having oppositely charged headgroups (ADS/calcite and OTAC/quartz), the wettability of the mineral changes from water-wet to more oil-wet at surfactant concentrations below the CMCs of each surfactant (<0.9 mM). This is due to the strong headgroup–surface electrostatic interactions that make most of the hydrophobic tails of each surfactant orient outward away from the rock surface. This results in an increase in contact angle compared with that of pure DI water and creates a more oil-wet state at low surfactant concentrations. Further increase in total surfactant concentration leads to mixed orientation of surfactant tails or bilayer formation, which decreases the contact angle and makes the surface more water-wet. In the case of adsorption of surfactants with similarly charged headgroups to that of the mineral surface (OTAC/calcite and ADS/quartz), no significant change in wettability alteration was observed at low surfactant concentrations due to very weak tail–surface hydrogen bond interactions that result in limited surfactant adsorption. Increasing surfactant concentration under this scenario leads to little change in the wetting state of the rock (i.e., it remained water-wet) due to outward orientation of surfactant headgroups.
The presence of both positive (calcite) and negative (quartz) charges on the shale surfaces facilitates faster surface loading for cationic–anionic surfactant mixtures compared with that of individual surfactant solutions. This synergistic adsorption of cationic–anionic surfactants on the mixed-charge shale surfaces promotes greater alteration of shale wettability at very low concentrations (<0.2 mM) compared with that of either of the pure surfactants. Thus, wettability alteration was more prominent for the ADS/OTAC 1:1 mixture compared with that of either of the pure surfactants with rock wettability altered from highly water-wet to more oil-wet at concentrations of <0.45 mM for the mixed surfactant solution. Although the exact surfactant concentration where this wettability alteration occurs may depend on shale mineralogy and initial shale wettability, the use of a combination of cationic and anionic surfactants in hydraulic fracturing fluids may promote alteration of shale wettability toward more oil-wet conditions and serve to reduce capillary trapping from imbibed treatment water in shale gas reservoirs.
Footnotes
Acknowledgments
The authors would like to acknowledge the donors of The American Chemical Society Petroleum Research Fund for support of this research. The authors would also like to thank Wenjia Fan and Megan Bushlow for their assistance with the XRD and SEM data collection and analysis.
Author Disclosure Statement
No competing financial interests exist.
References
Supplementary Material
Please find the following supplemental material available below.
For Open Access articles published under a Creative Commons License, all supplemental material carries the same license as the article it is associated with.
For non-Open Access articles published, all supplemental material carries a non-exclusive license, and permission requests for re-use of supplemental material or any part of supplemental material shall be sent directly to the copyright owner as specified in the copyright notice associated with the article.