
Abstract
Abstract
The most common technology currently used for restoring groundwater at In Situ Recovery (ISR) uranium mining sites is reverse osmosis (RO) and reinjection of the permeate. However, this practice does not restore the formation to its original reduced state, and in many cases groundwater uranium concentrations are not restored to premining baseline levels. Natural attenuation based methods are rarely field tested as a small number available sites and a lack of economic interest in the mining community have historically limited their usage. This study was performed to evaluate effectiveness of introducing dissolved hydrogen into a postmined formation at an ISR mining site to stimulate reduction and immobilization of residual soluble uranium to premining baseline levels. The main objectives of this research project were (1) to develop and optimize a system for minimizing air entrainment during water injection when employing a membrane gas-transfer device for down-hole hydrogen infusion; (2) to assess whether injecting dissolved hydrogen using the membrane gas-transfer device can promote immobilization of dissolved uranium in groundwater to near or below premining concentrations. Approximately 30,000 gallons of groundwater were pumped to the surface and then reinjected into the subsurface while being supplied with dissolved hydrogen using the down-hole membrane gas infusion device. Groundwater was pumped back to the surface after several months to evaluate the extent to which dissolved uranium had been removed. Results of this study indicate an ∼83% reduction in soluble uranium concentration was achieved, while significant increases in indigenous microbial populations were observed and the hydrologic permeability of the aquifer remained in the range of clean sand. These results show enough promise to rate future exploration into the development of bio-remediation and/or membrane gas diffusion techniques as a cost effective method for post ISR mining restoration as an alternative to RO.
Introduction
I
Baseline Well I-11A in Permit Authorization Area (PAA) No. 1 at the Uranium Resources, Inc. (URI) Kingsville Dome ISR uranium mine (location shown below in Fig. 1) had residual dissolved uranium at higher concentrations than measured in 1985 before mining [i.e., 0.021 mg/L as U3O8 (URI, 1984) vs. 8.1 mg/L as U3O8 in 2013 (recorded as part of the initial site survey for this experiment]. The mining site at the time of this experiment had been closed for further production and 13.5 pore volumes of the aquifer had been treated with RO as part of the recovery process to move the site into an inactive status and proceed with closure procedures. The continued high restoration uranium concentrations at Well I-11A presented particular issues when attempting to close the site in conjunction with state and federal governing agencies (URI, 2011).
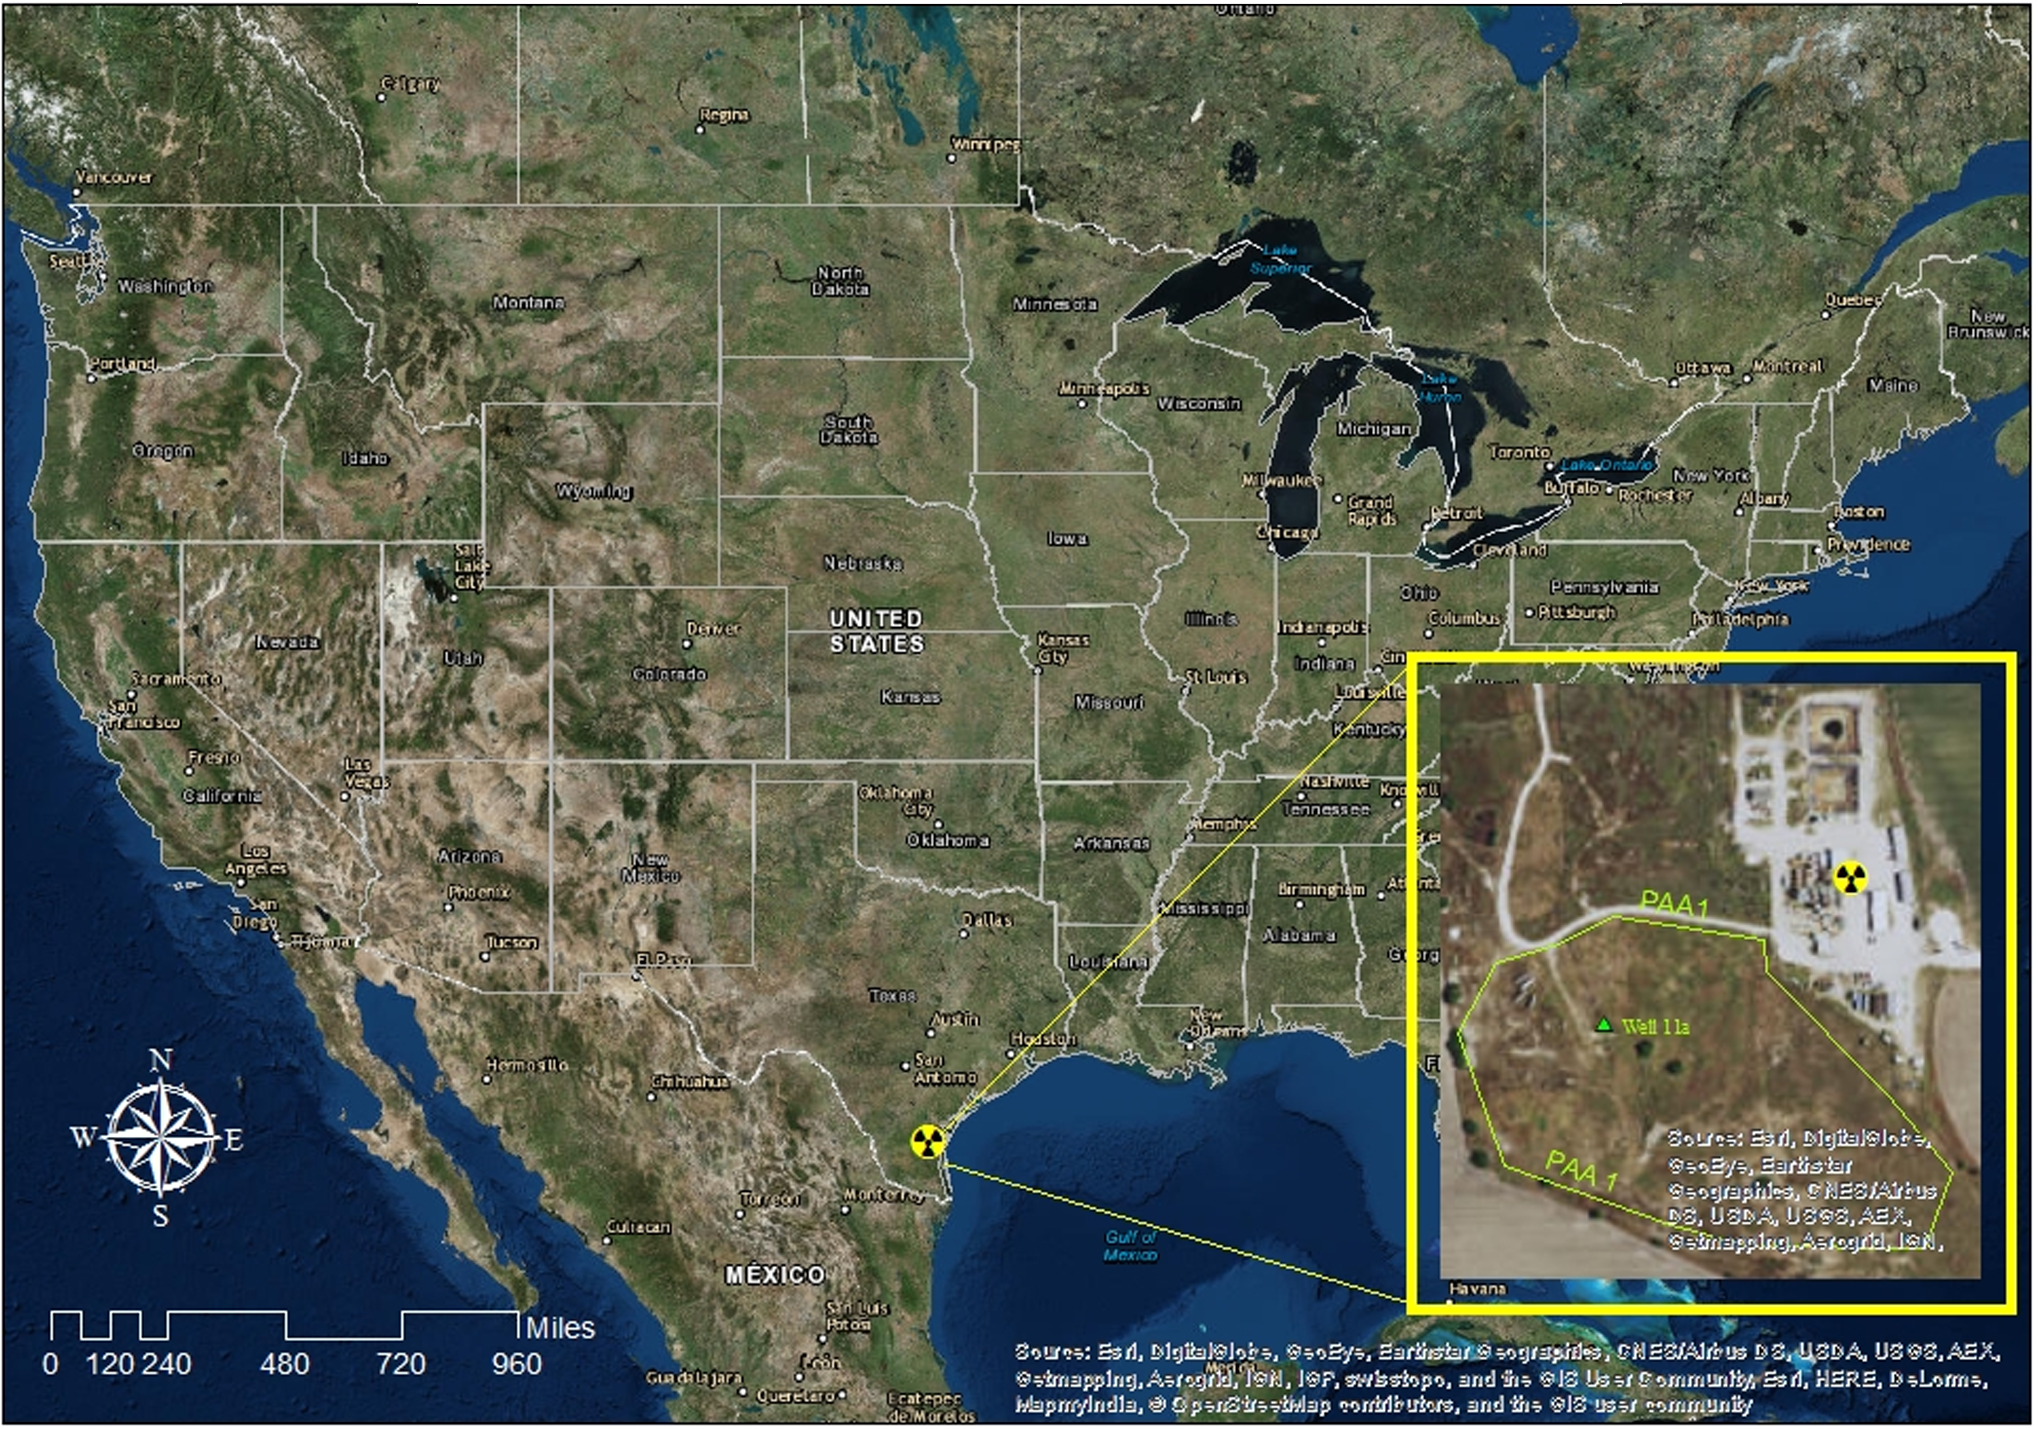
URI Kingsville Dome ISR Mining Site, Ricardo, Texas, Map completed utilizing ArcGIS. ISR, in situ recovery.
This led URI to look for a low cost alternative to treat a so-called “hot spot” without having to continue treatment using RO. Based on positive results achieved using down-hole H2 sparging coupled with groundwater recirculation to reduce uranium concentrations at a nearby location, (Baseline Well I-9) during a field trial conducted from 2009 to 2011 (Cabezas, 2012), URI was amendable to the continued use of hydrogen-based methods on site. In the previous field study (Cabezas, 2012), H2 gas was sparged into Well I-9 (at 400 to 500 ft bgs) for 66 days while groundwater was recirculated at about 40 gpm. Dissolved uranium concentrations near Well I-9 decreased from ∼4.3 to 0.04 mg/L (>99% decrease). These results suggested that the injected H2 reduced ferric iron and sulfate near the injection well, resulting in a zone of highly reduced groundwater of limited area. When this reduced groundwater was subsequently extracted and pumped into the extraction well it remained in a reduced state, preventing residual tetravalent uranium from oxidizing and going into solution.
Before injecting H2 during the study described above, groundwater was recirculated at ∼45 gpm between Well I-9 and Well 41 for 74 days with no H2 injection. It was estimated that the injected groundwater fell 43 ft from the top of the well to the dynamic water table elevation. The resulting turbulence at the water surface undoubtedly resulted in entrainment of air bubbles, which could have resulted in an “effective” dissolved oxygen concentration above saturation (i.e., above ∼9 mg/L). The injected dissolved oxygen was likely at least partly responsible for the dissolved uranium concentrations in the recirculation flow line increasing from 1.95 to ∼4.3 mg/L over the initial 74-day groundwater recirculation period (Cabezas, 2012). This result underscored the potential importance of minimizing entrainment of dissolved oxygen during any restoration activity involving injection of groundwater into the formation. Additional Issues, including the high cost of the sparging technique, coupled with safety concerns about large amounts of off-gassed hydrogen gas, and a dramatic decrease in the localized hydraulic conductivity led URI in conjunction with Texas A&M-Kingsville to pursue another technique.
Observations made during the previous study revealed large increases in indigenous populations of iron-reducing bacterial (FeRB) and sulfur-reducing bacterial (SRB) populations (Cabezas, 2012). Both FeRB and SRB strains have been found to mediate the reduction of U(VI) to its less soluble U(IV) form (Abdelous, 1998). Field research at other uranium contaminated sites at both the Rifle, CO and Oak Ridge, TN have shown that if SRB strains are allowed to out compete FeRB strains that U(VI) reduction is inhibited (Anderson, 2003; Vrionis, 2005; Yabusaki, 2007). The following equation shows the theoretical overall microbial growth reaction coupled to the reduction of soluble uranium using hydrogen as the electron donor.
This equation shows that stoichiometrically 1 mg/L of hydrogen is required to precipitate 128 mg/L of aqueous uranium. However, injection of hydrogen will also promote reduction of ferric iron and sulfate by FeRB and SRB. These reactions significantly increase the demand for hydrogen. The overall growth reactions, for FeRB and SRB coupled to the H2 shown below illustrate the theoretical stoichiometry for iron reduction and sulfate reduction (note that both reactions increase pH):
Results from previous column experiments conducted indicated that the theoretical benefit of lowering Total Inorganic Carbon on U solubility is only gained when pH is held below 9 (Heuston, 2012). These experiments also described an optimal window of U solubility reduction exists between pH 6.5 and 8. This is further verified by the reoxidation of U(IV) by ferrihydrite that is most frequently observed in iron-rich environments at a pH above 8 (Ginder-Vogel, 2010). This finding led us to believe that the initial pH of the site should be tested and if found to be above a pH of 6, then the addition of a buffer to counter the effect of the reduction process on the pH should be introduced.
A new method for injecting hydrogen infused solution was theorized that would allow for the direct introduction of gaseous hydrogen into the formation while controlling both the increase in pH and the inclusion of dissolved oxygen as part of the injection process. The use of an in situ membrane injection system, in this case a BIOFLO gas-transfer device, was theorized to solve these issues. First, it served as a small orifice flow constrictor that minimized the distance that water falls through the air, thus reducing the amount of dissolved oxygen entrapped by the water during injection. Reducing the injection flow to less than 2 gpm restricted the turbulence experienced at higher flow rates and thus also lowered the amount of dissolved oxygen entrained during the pumping process. Second, it allowed the absorption of hydrogen gas at a higher pressure as it would be dissolved into injected fluid at depth in the aquifer thus increasing the carrying capacity of hydrogen gas by the water as a function of the depth of the water.
Objectives
This experiment evaluated the effectiveness of injecting hydrogen into the subsurface at a uranium mining site to promote in situ reduction and immobilization of uranium. This was conducted using two injections of hydrogen-infused ground water and evaluating the results to assess the following: (1) the feasibility of injecting dissolved hydrogen using the membrane gas-transfer device; (2) whether injecting dissolved hydrogen can promote immobilization of dissolved uranium down to premining concentrations; (3) whether injecting dissolved hydrogen can promote the growth of microbial populations that will aid in the remediation process; (4) to assess the effectiveness of multiple injections and increased residence time on the reduction/immobilization of dissolved uranium and the growth of microbial populations; (5) and to assess the short-term longevity of hydrogen injection to evaluate the its effectiveness as a remediation technology.
Methods
Before any work beginning on site the well was tested for pre-experiment ion concentrations, pH, conductivity, and dissolved oxygen levels. Biological Activity Reaction Tests (BARTs) were used to test the presence and relative concentration of both FeRB and SRB, both were found to be ∼10 Colony Forming Units (CFU). The pre-experimentation water level was 111.36 ft below the surface and the hydraulic conductivity was tested using the back fill method (and confirmed utilizing infinite difference modeling via MODFLOW), and found to be 0.0144 ft/min or clean sand. The system pH was found to be 6.76.
To reduce costs materials present on site were used whenever possible. The reverse flow system (see Fig. 2) consisted of a 30 gpm submersible pump (provided by URI) connected to an extraction hose provided solely for this experiment. As seen in the figure below the system was connected to an available 25,000 gallon storage tank that had been previously used for the storage of potable water on site.
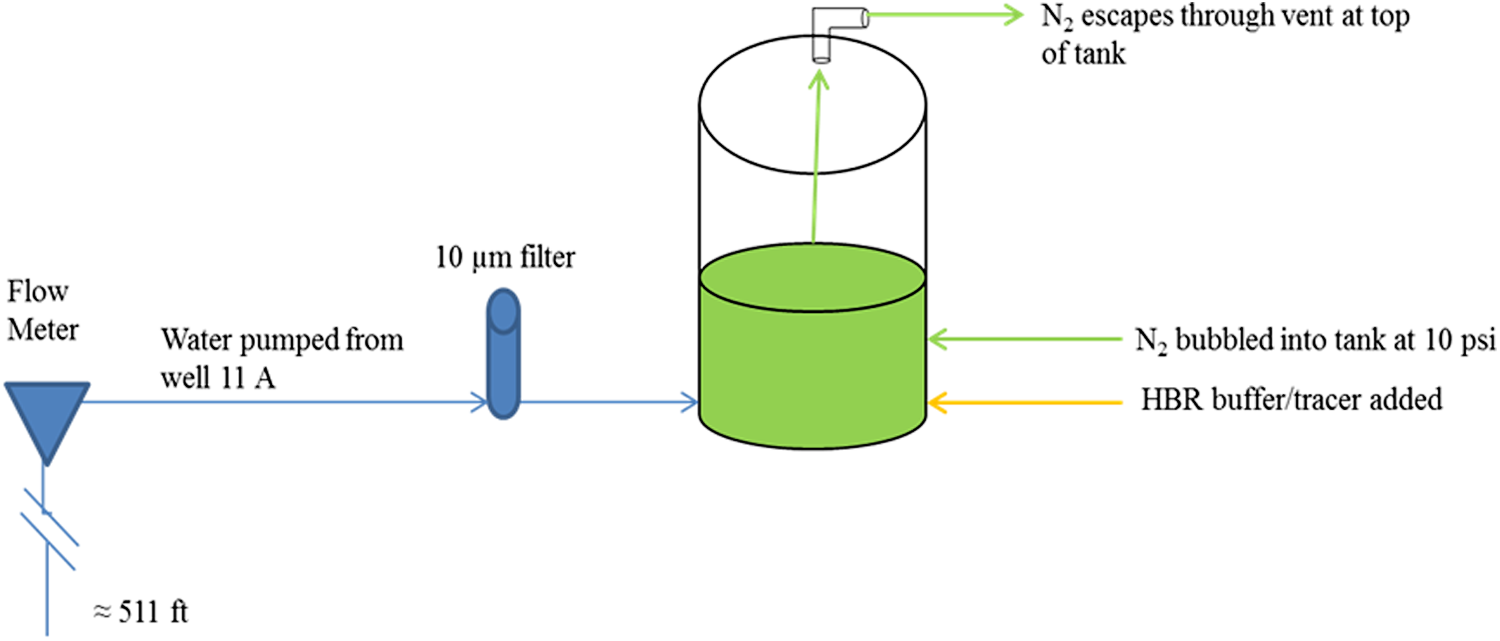
Reverse flow system diagram.
The pumped ground water was passed through a 10 μm filter to remove large particles and HBr was added during the initial filling process. The HBr was added to counter the inevitable increase in pH that the Fe3+/SO4− reduction would impose on the system and to serve as a concentration tracer for later system analysis. This was also one of the few additions we were allowed to make to the system as URI limited what was added to the aquifer as they were attempting to finalize site closure and other suggested buffers (i.e., Sodium Phosphate) were rejected due to a fear of trace amounts left in the system post process. A water sampling station was added to the top of the well head to allow the collection of samples at the closest possible point to the aquifer. Nitrogen gas was bubbled into the storage at a rate of 15 L/min to reduce the amount of oxygen dissolved into the water while it was stored on the surface during the injection process, dissolved oxygen levels of 9% to 24% were observed during the injection process as tested at the system sample port.
As seen in the Figs. 3 and 4, the injection system used the same storage tank with a reciprocating pump used to draw water from the tank through a 1 μm filter (to avoid clogging the system with colloidal iron during reverse flow) and out to the well site at ∼1 gpm where it will be injected into the aquifer by passing through the BIOFLO membrane system, manufactured by Tersus Environmental, where it absorbed hydrogen and passed into the aquifer (Tersus Environmental, 2012). The injection of ∼20,000 gallons of water took ∼14 days. The same sampling station was used to sample the water being injected and to monitor the pressure at the well head during injection.

Injection system diagram.

Photos of reverse flow/injection system.
The Henry's law constant for H2 at 30°C is ∼1318 atm/M (Sander, 1999). At water depth of 399 ft below the water table, the water pressure is ∼12 atm, or a total pressure of 13 atm. Applying Henry's law, the saturation concentration for H2 at 399 ft of water depth and 30°C was calculated as:
Since 1 mg/L of H2 is stoichiometrically equivalent to 8 mg/L of O2 (on an electron equivalent basis), the saturation H2 concentration of 19.96 mg/L was equivalent to 160 mg/L of dissolved oxygen. This would also theoretically allow the reduction of up to 21 mg/L of the aqueous uranyl complex (forgoing the inevitable loss of hydrogen to iron and sulfate reduction). Assuming H2 was transferred to the injected water at a concentration of 19.96 mg/L, and that the water injection rate is 1 gpm (3.76 L/min), the H2 consumption rate was calculated as follows:
Large compressed gas cylinders were purchased that had a useable H2 volume of ∼400 scf, so one cylinder lasted at least 9 days allowing the placement of two cylinders to complete the injection process (Fig. 5).
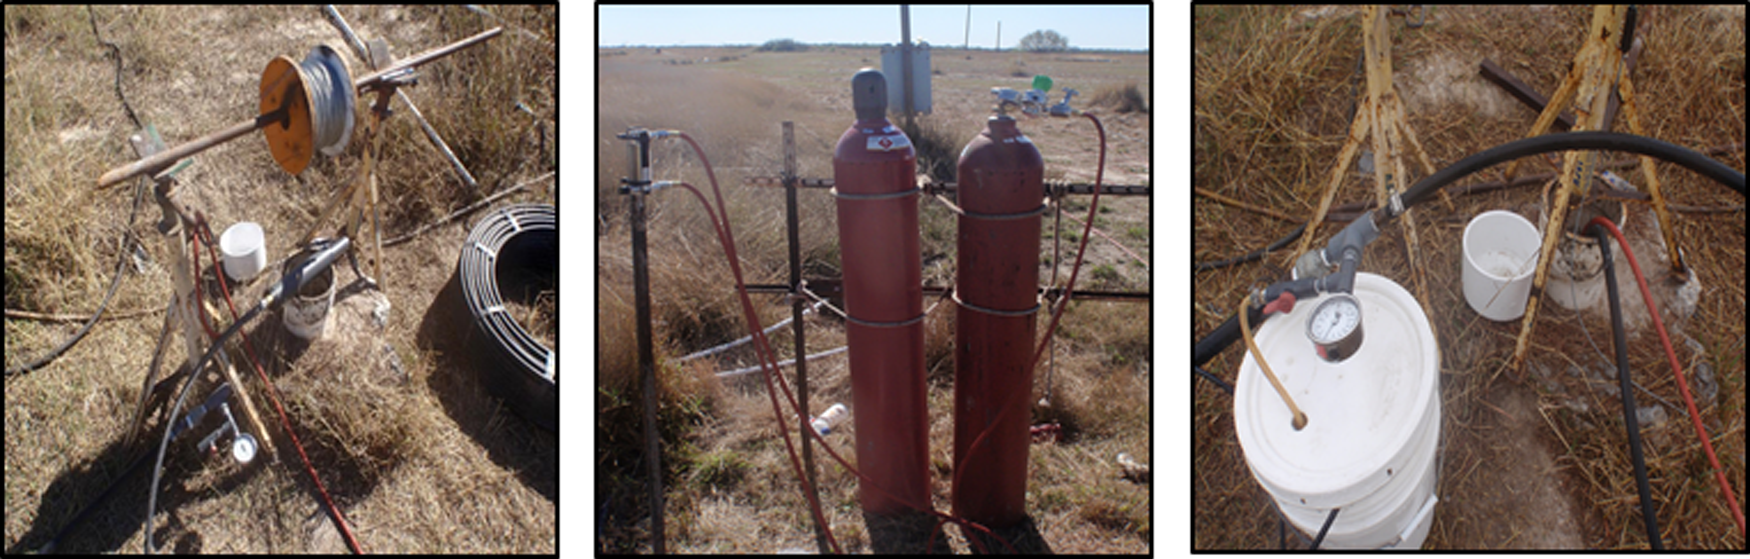
Photos of BIOFLO, hydrogen gas tanks, and sample station taken January 14.
This is the point where the first design flaw in our system was recognized, after the initial 2 days of the injection a total lack of hydrogen infusion was observed, this was believed to be caused by the membrane system collapsing under the pressure at that depth. Since the system previously had never been used above a pressure of 5 atm, this issue was anticipated. So the BIOFLO was raised to ∼5 atm of pressure or 165 ft below the waterline, reinflated, and resubmerged to 360 ft below the water table or 11.9 atm reducing the saturation concentration to 19 mg/L of hydrogen, where it worked well for the rest of the experiment. This allowed a 10-fold saturation of hydrogen gas subsurface that could have been achieved at the surface (∼1.53 mg/L).
The experimental injection process was conducted as follows: Groundwater from the ISR site was pumped into a storage tank from the bottom (to reduce oxidation of the water at the surface) and the water was sampled to determine the concentration of aqueous uranium (Phase 1). Water in the storage tank was amended with hydrogen bromide, which served as a nonreactive tracer to characterize solution transport in the aquifer. The amended water was then reinjected into the aquifer at the rate of 1 gpm to allow the absorption of hydrogen into the water stream from the BIOFLO membrane, which took ∼12 days to inject to 19,748 gallons (Phase 2). The injected amended groundwater was left in place for 30 days to allow in situ redox reactions to take place (Phase 3). Approximately 30,473 gallons was then pumped from the aquifer over 2 days and sampled every thousand gallons to determine the uranium removal efficiency and the hydraulic zone of influence. Subsequently, a second tank volume was drawn to the storage tank (Phase 4). Then 10,244 gallons of water were reinjected into the aquifer using the same down-hole hydrogen infusion system to allow the absorption of hydrogen into the injection fluid (Phase 5). This solution was left in place for 120 days to test the effect of a second injection and increased exposure time on the reduction process (Phase 6). Finally 44,978 gallons was pumped from the aquifer and again sampled every thousand gallons and analyzed for the presence of aqueous uranium and bromide (Phase 7). The well was then tested every 30 days at a volume of 1500 gallons to better assess the longevity of the treatment (Phase 8).
All samples were collected at the sample collection point located at the well head. Collected samples were tested for conductivity, total dissolved solids, temperature, pH, and percentage of dissolved oxygen (% DO). The monitor was calibrated both in the lab and on site before use. The samples extracted from this experiment were in four forms. The first was a 1 L sample tested for the alkalinity of the well site at different phases of the experiment. The second was 250 mL sample taken in nitrile bottles from the same collection bucket as a QA/QC of the collection process and allow half of the samples to be fixed using nitric acid on site to reduce the sample's pH to less than 2. The third was samples taken and directly introduced to BART kits where they were monitored for FeRB and SRB. The fourth was taken in bottles provided by URI for concurrent testing by URI personnel during the experiment. Samples were tested for alkalinity, the presence of cations and anions using inductively coupled plasma-mass spectrometry (ICPMS) and ion chromotography (IC), and for the presence of the bromide tracer using ion chromatography and spectrophotometric bromide analysis.
Methods to test for the presence of ions using, ICPMS, IC, and spectrophotometric analysis were used for multiple samples at multiple dilutions from each sampling point (American Public Health Association, 2002) to ascertain a median concentration point for the sample point. This was completed by taking two samples for IC that were tested at 1:250 and 1:10 dilutions and two samples for Visible Light Photometry at each sampling point. Three additional samples were taken and tested at dilutions of 1:50, 1:250, 1:500 to achieve readings inside the standard calibration curve for each element. The given ion concentrations are the median concentration of these samples if the resulting samples were tested within a variance of ±5%.
Results
The saturation concentration of hydrogen during the first injection period or Phase 2 was 13.1 mg/L or 69% of the theoretical maximum. During Phase 5, the saturation concentration was raised to 13.4 mg/L or 71% of the theoretical maximum. The overall reduction of uranium in 2014 (Fig. 6) shows an overall reduction in aqueous uranium concentration from 8.1 to 1.41 ppm or roughly 83%. The attempt to control the pH during the process proved successful as it remained in the target range between 6 and 8. The lowest recorded concentration for uranium of 0.38 ppm occurred at the beginning of Phase 6, ∼30 days after the second injection.
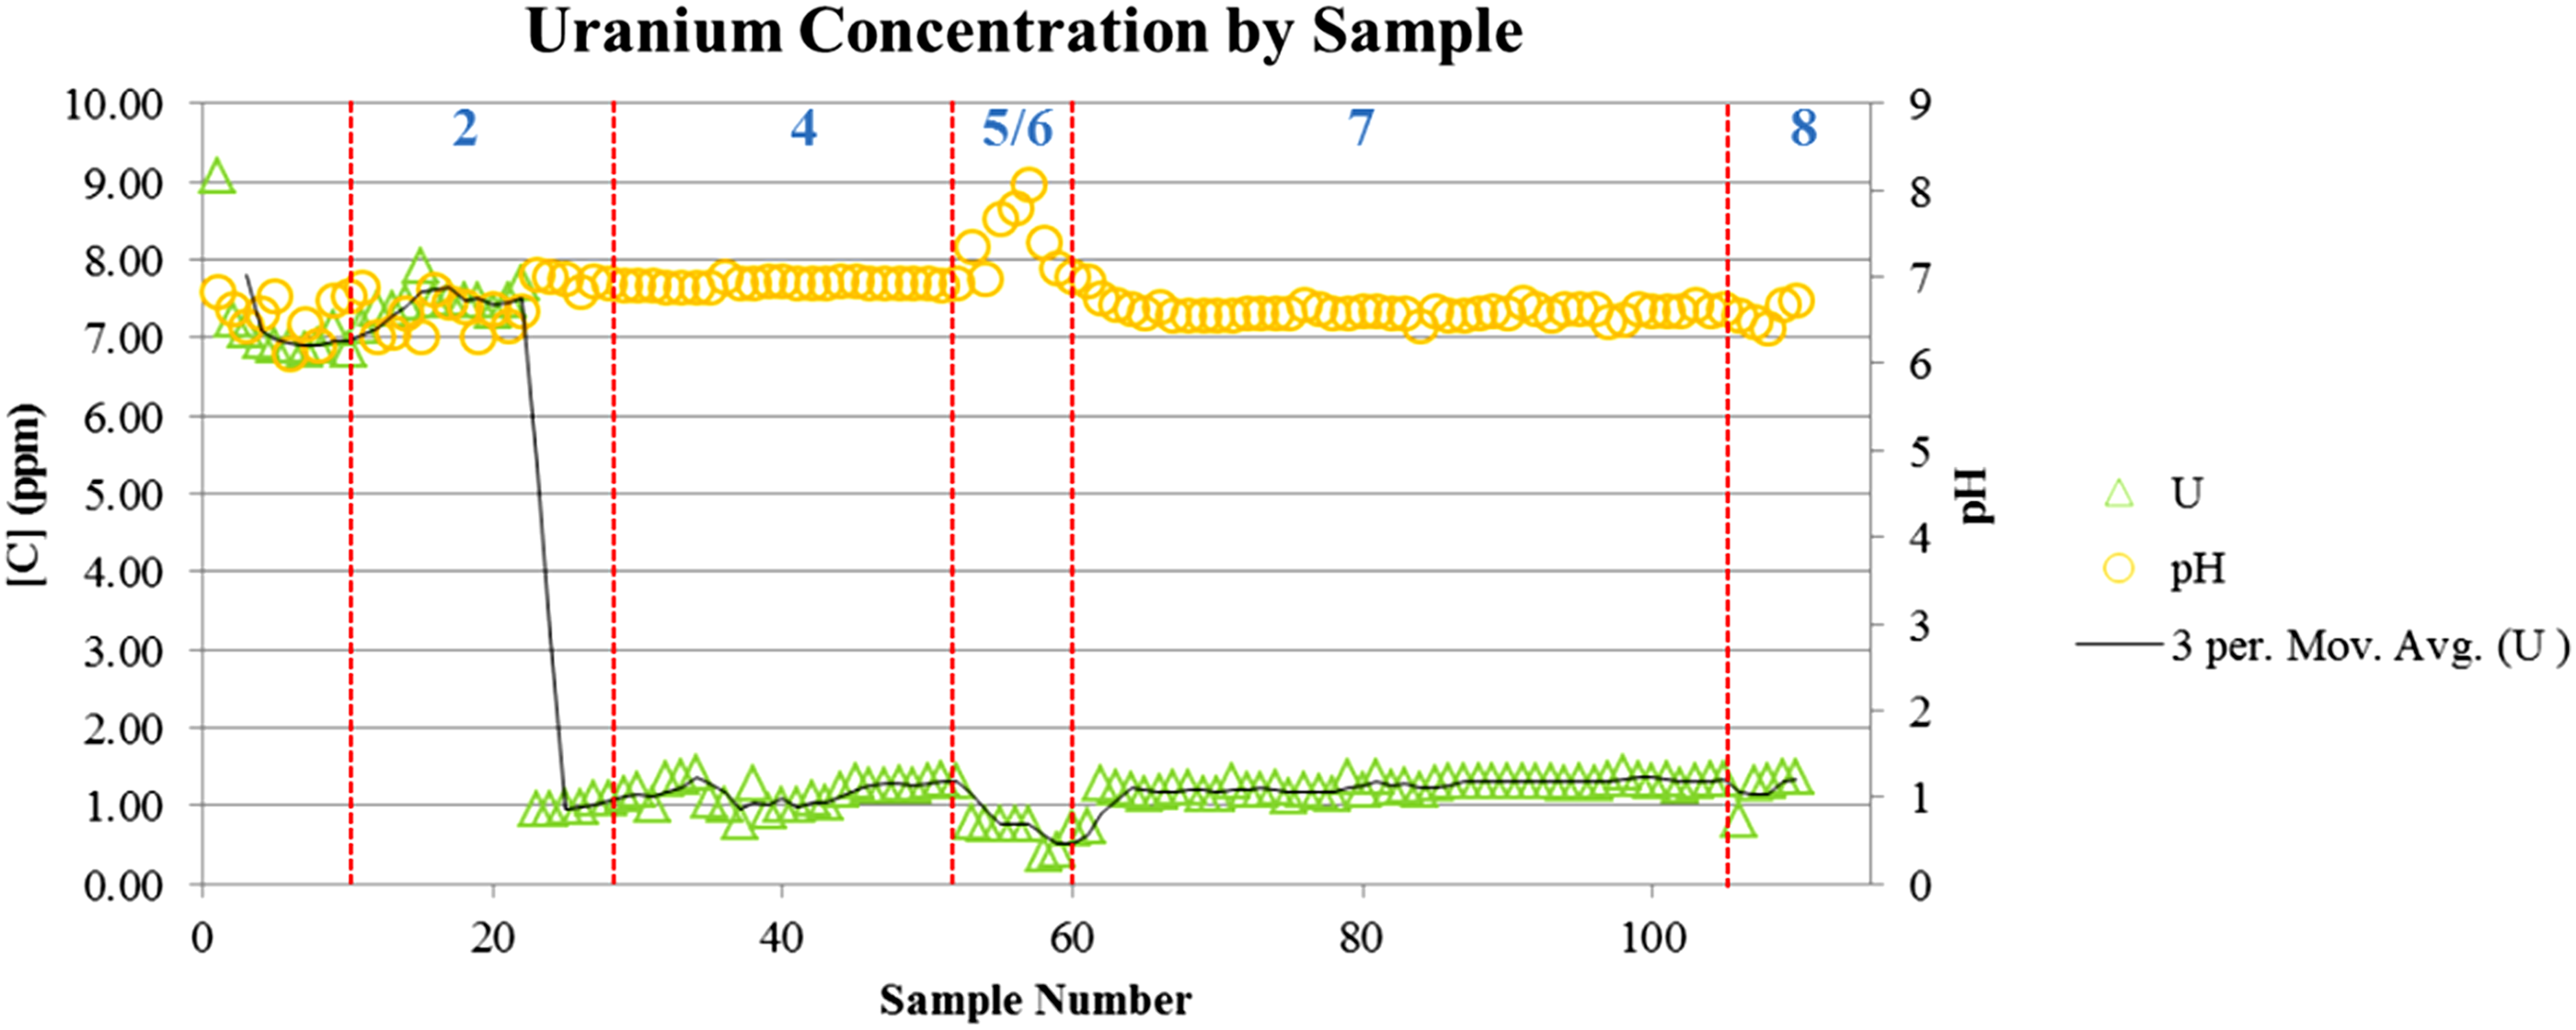
Average concentration of dissolved uranium by date completed in Excel.
Results of the Phase 4 reverse flow (Fig. 7) show 85% reduction in the average amount dissolved uranium across 30,000 gallons (from 8.1 to 1.2 ppm). The population of FeRB went from 10 CFU/mL before the experiment to 1000 CFU/mL during Phase 4, while the population of SRB stayed at approximately the same concentration of 10 CFU/mL.

Average concentration of dissolved uranium, iron, and sulfate by reverse flow volume.
Results of the Phase 7 reverse flow (Fig. 8) show an average reduction of dissolved hydrogen across 45,000 gallons of 1.41 ppm, 83% reduction from pre-experiment concentrations. The population of FeRB increased to 3000 CFU/mL, while SRB populations also increased to 500 CFU/mL during Phase 8. As seen in the figure below this phase also saw a marked decrease in the concentration of sulfate as an average concentration across the reverse flow dropped to 360 ppm, down nearly 100 ppm from Phase 4 and nearly 150 ppm from the pre-experimental survey.

Average concentration of dissolved uranium, iron, and sulfate by reverse flow volume completed in Excel.
As part of this experiment, the changes in hydraulic conductivity and dispersivity were tested and measured before and after hydrogen injection was completed. Pump tests were performed before and after hydrogen injection to determine whether there had been a significant decrease in the formation's hydraulic conductivity as a result of induced precipitation reactions. In addition, a bromide tracer study was performed to estimate the effective dispersivity of the formation (Fig. 9).
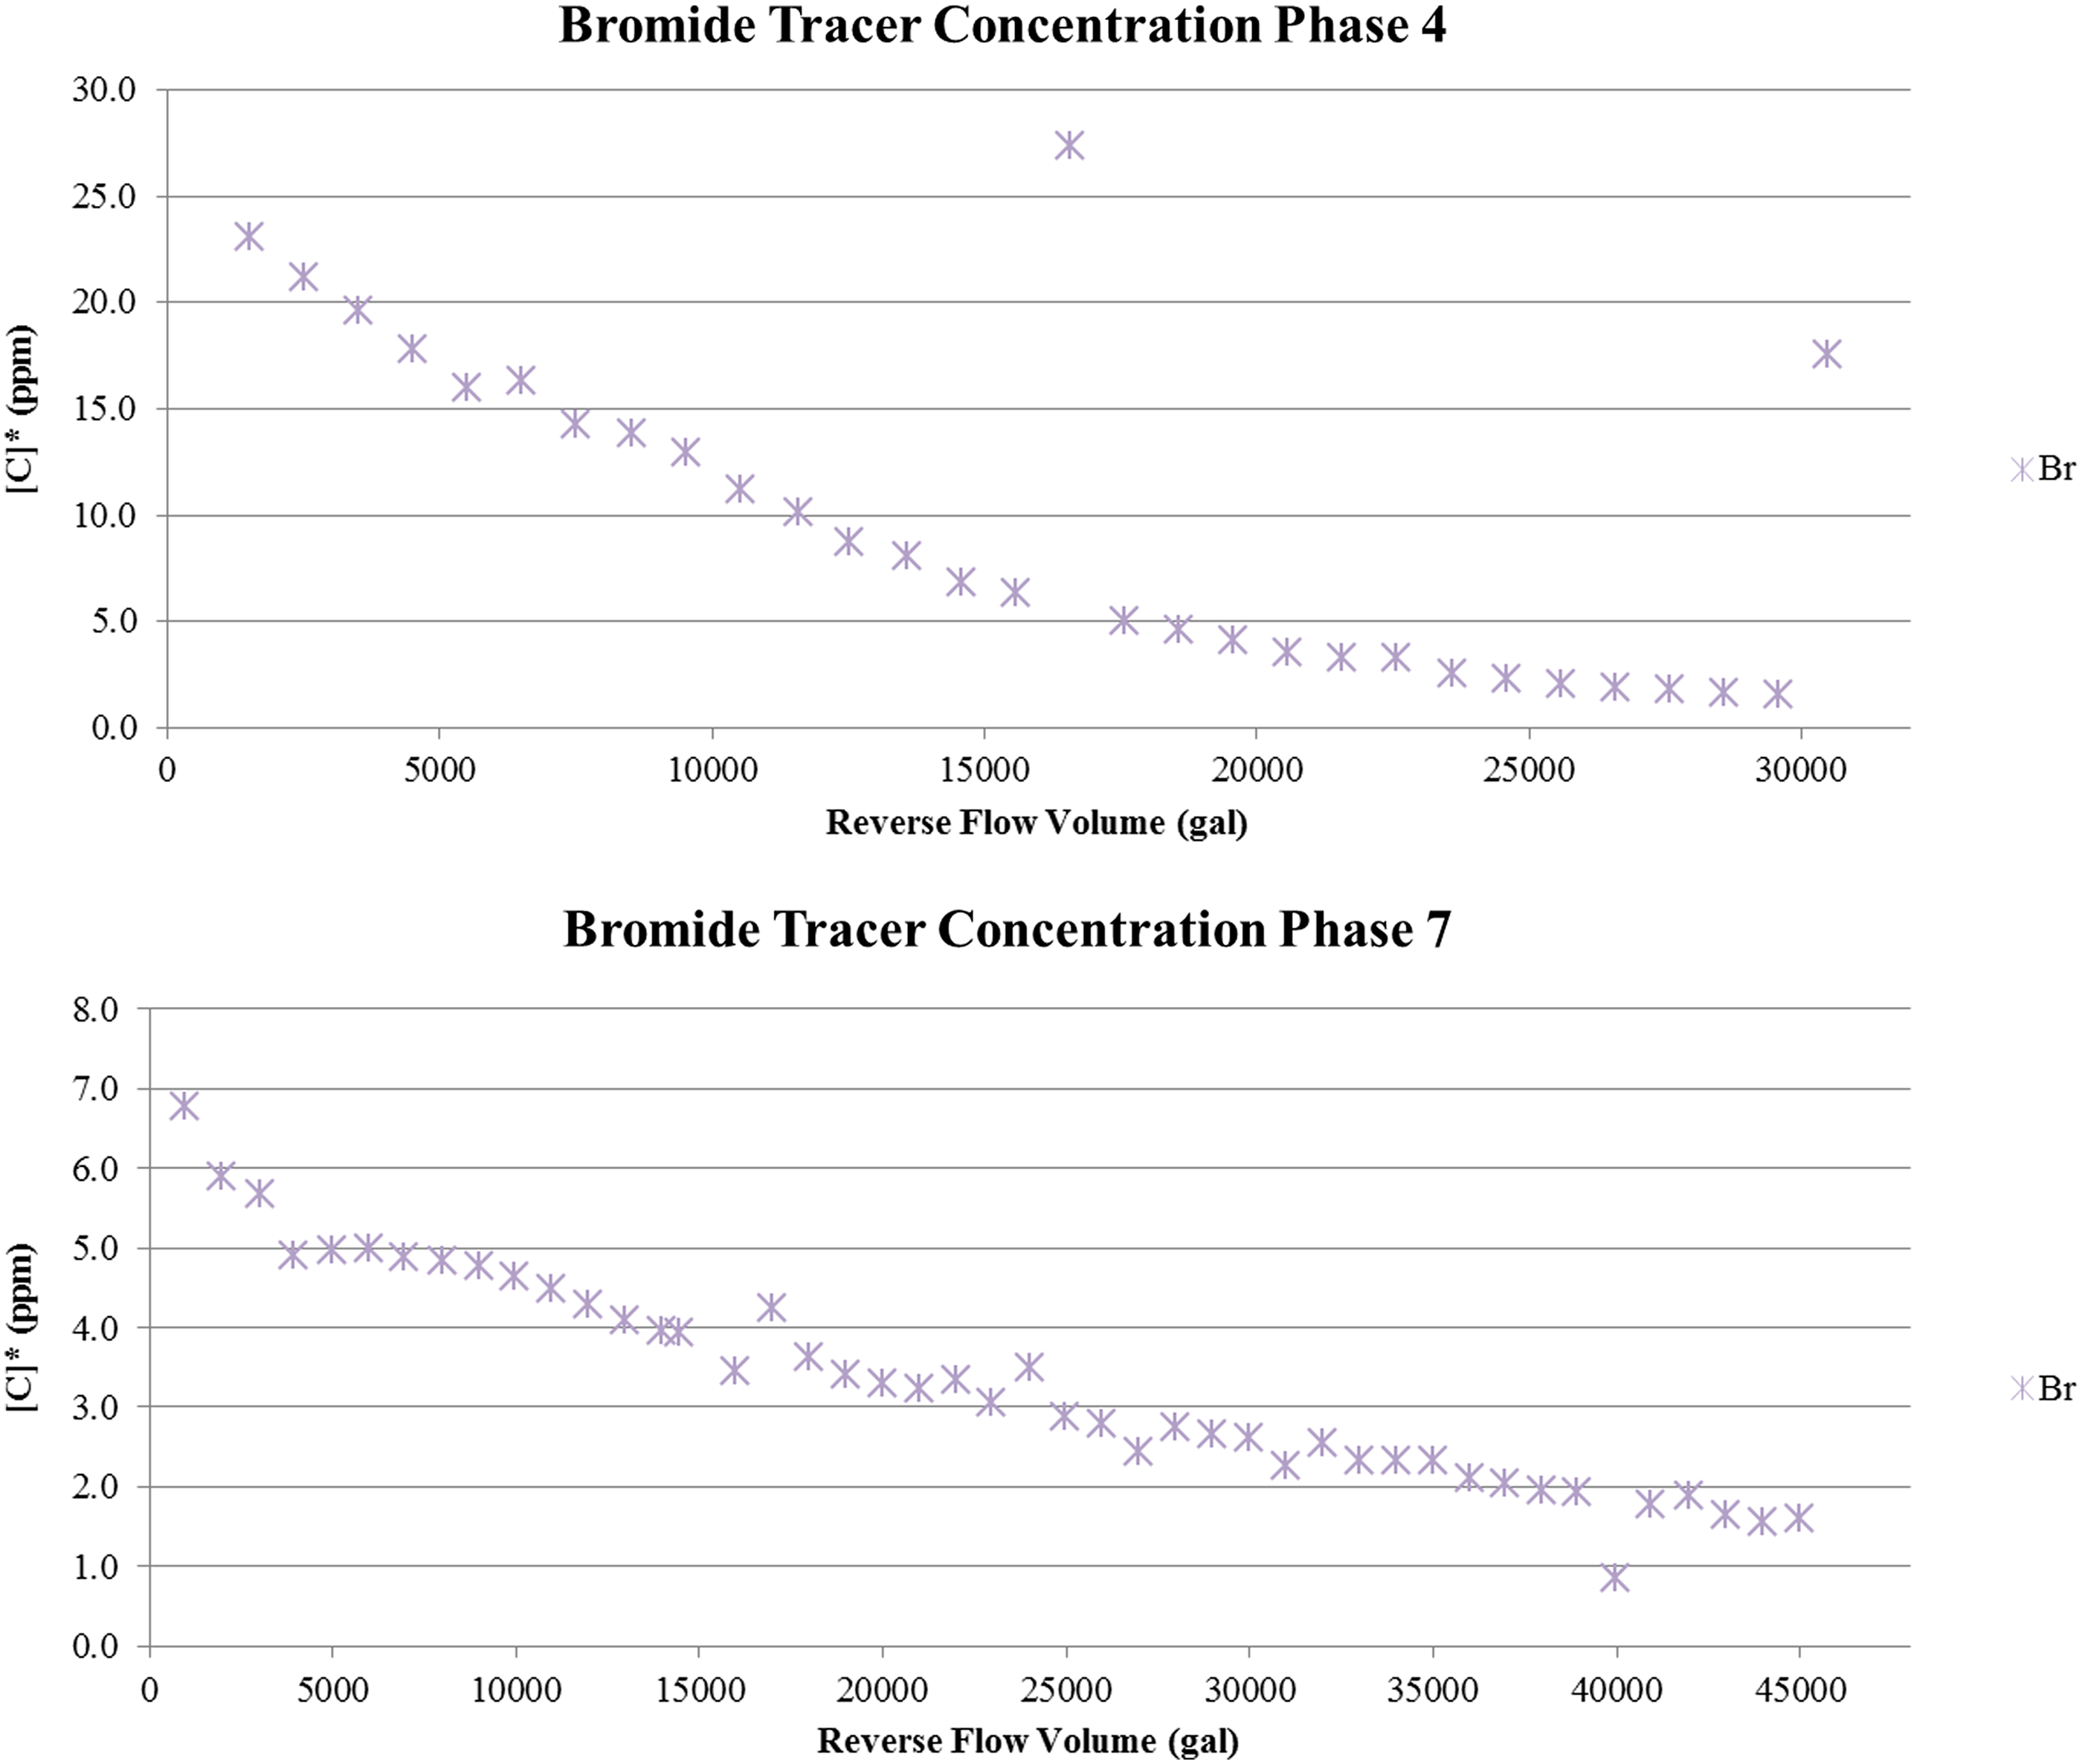
Bromide tracer concentration by reverse flow volume completed in Excel.
Best-fit hydraulic conductivity values before and after the hydrogen injection periods were determined to be 0.0144 and 0.0051 ft/min by a hydraulic model developed in MODFLOW, indicating that the formation permeability had decreased by 65% after both hydrogen injections. However, the hydraulic conductivity values before and after the hydrogen injections were in the range cited for clean sand. The best-fit longitudinal dispersivity value was determined at 10 ft utilizing MT3DMS, a MODFLOW process. This value was used to estimate that the effective zone of influence for the bromide injection—accounting for hydrodynamic dispersion—had a radius of 25 ft. This was 5.69 times greater than when considering advection alone (Yang, 2014). Note that the higher concentrations of bromide seen at 15,000 and 30,000 gallons during Phase 4 are not outliers, but believed to possibly be the product of the tracer solution escaping into the formation as it was added to solution.
Discussion
A significant relationship between the temperature of the injected water and the assumption rate of hydrogen was observed during the first injection as the second half of the injection period was marked by a sudden drop in ambient temperature, this affected the injection fluid by lowering its temperature from 19°C to 4°C. The result was an absorption rate of 18.1 mg/L during this period, some 95% of the theoretical maximum. This would lead one to believe that the scheduling of such open air remediation projects could benefit from being conducted during the region's colder months, allowing a maximum saturation concentration for hydrogen at a little or no increase in project cost.
The relationship between the reduction of uranium and changes in pH can be better seen below (Fig. 10), utilizing a standard log based nonlinear regression analysis to show the general trend in observed values during Phases 4 and 7. One can see that marked reductions in uranium in the beginning of Phases 4 and 7 both coincide with a higher pH than later samples taken during that phase.

The log-based nonlinear regression trend of aqueous uranium and pH by phase completed in Excel.
The relationship can be better seen in Phases 6 (Fig. 11) where the lowest concentration of uranium is 0.37 ppm and was shown to have the phase's highest pH of 7.4. It is also worthy to note that this temporary increase in pH above 7 is followed by a 200% increase in the concentration of soluble uranium in solution over the 90 days.

The average concentration of dissolved uranium by date completed in Excel.
As seen in the diagram above (Fig. 11), the limited return the second injection in Phase 5 had on the system as 90% of the total reduction occurred with the first injection is clearly depicted. This process theoretically could be improved for commercial use by using a higher volume injection all at once as opposed to two separate injections. But as to whether the second injection aided in the longevity of the reduction is inconclusive without further geochemical modeling.
One of the major drawbacks of using hydrogen as an electron donor in this type of remediation as stated previously is the reduction of both iron and sulfate as seen in photos above the oxidized iron present in the well in large concentrations as a rust brown solid is reduced and becomes aqueous giving us the clear solution a year later (Fig. 12). Looking at Fig. 13, one can see that aqueous or reduced iron becomes more prevalent, going from a trace amount before the treatment up to 10 ppm during the treatment process. While the concentration of sulfate in solution becomes significantly lower, ∼150 ppm, over the course of the experiment. One can also note a significant reduction in the amount of sulfate in solution after the second injection in Phase 5 and the significant increase SRB noted by Phase 8 also show the limited return provided by the second injection. Therefore, it is assumed that both of these processes had an effect on the amount of uranium reduced/immobilized by this method.
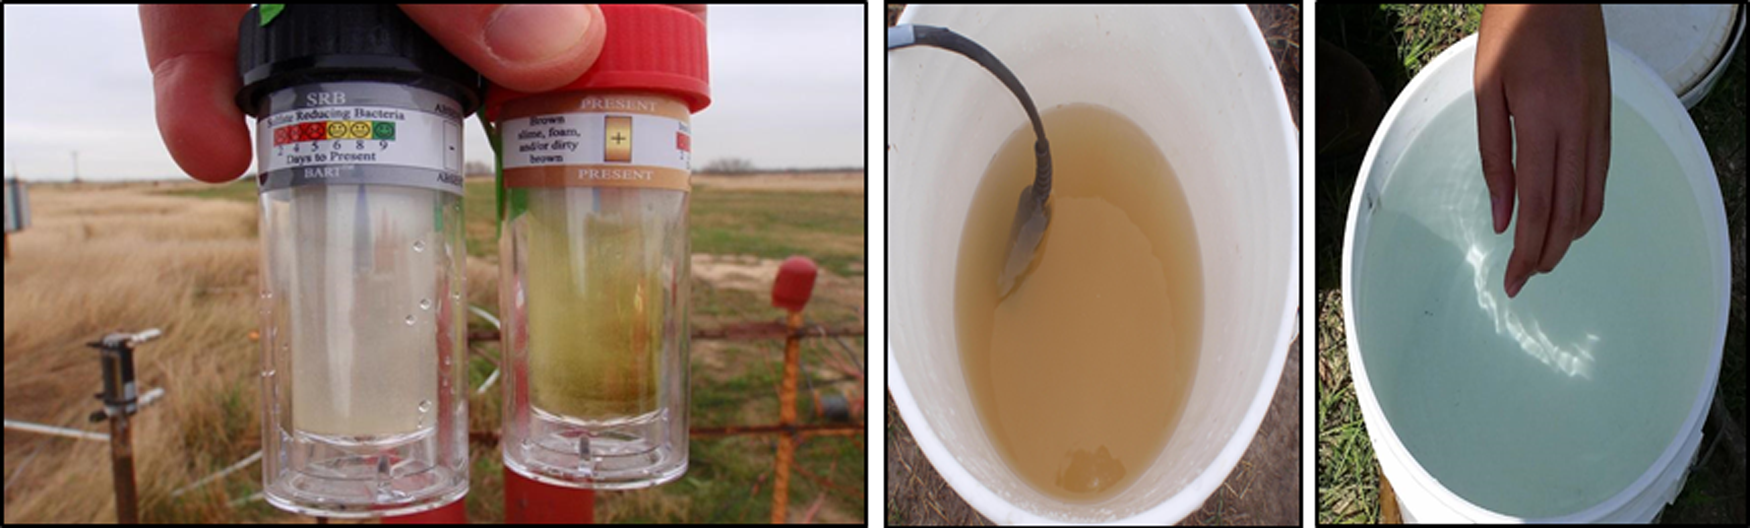
Photos of BARTs taken 45 min after exposure July 14, sample bucket taken January 14, and a sample bucket taken November 14.

Average concentration of iron and sulfate by date and phase completed in Excel by Lewis Haynes.
This relationship can also be seen in the reverse flows in March and July where the movement of water through the reduction zone increases the amount of iron present in solution and decreases the presence of sulfate. It should also be noted as predicted the zones that marked large decreases in sulfate concentration such as Phase 6, or during the beginning of the reverse flows during Phases 4 and 7 showed a lower sulfate concentration coinciding with a lower iron concentration that could indicate the creation of iron (II) sulfide. In the case of the reverse flows (Phases 4 and 7) this phenomenon was only seen for ∼3500 gallons, this data combined with future modeling efforts could show a zone of influence for SRB.
Conclusion
Use of hydrogen as an electron donor for In Situ bio-remediation is plausible for the reduction and immobilization of uranium as seen by a 85% reduction in the amount of aqueous uranium in Well 11A, further testing and/or geochemical modeling of the well past the first year will be have to be conducted to verify the longevity of such a procedure. It should be noted that the downhole infusion membrane used for this experiment was not particularly designed for the depths in question and this could have affected the results. Yet, the observed infusion rates six to nine times higher than the levels theoretically achievable at the surface (1 atm) during this experiment, does lend significant credence to the use of subsurface gas exchange membranes in the future, though continued study and/or modeling of the system to predict the volume of the remediation zone may be needed to judge the overall effectiveness of this method. The use of HBr as both a tracer and buffer proved to be successful at the pH stayed with the target range of 6 to 8 for the vast majority the experiment.
As a restoration technology the limited distribution of hydrogen across the formation, assumed to be inside of the 25 ft hydrodynamic dispersion of the bromide tracer, would make restoring the entire mining zone to its premining reduced state a difficult proposition. Again more modeling will have to be done to find an estimated radius of the reduction zone and the full reduction potential for water moving across it, to study the effectiveness and longevity of this method. As such, this process could be used for commercial application in the ISR mining industry as a conditioning technology to reduce so-called “hot spots” or areas of high uranium concentration in the formation that would in turn reduce the amount of RO required to return the zone to previously seen concentrations and could therefore lower the overall cost of restoration, subsequently proving the use restorative or enhanced attenuation techniques in such cases should be explored as a more cost-effective method of post mining remediation than traditional RO driven pump and treat techniques.
Footnotes
Acknowledgments
We would like to thank the following donors and sponsors for their support during this experiment: Uranium Research, Inc. (URI); The Center for Research Excellence in Science and Technology–Research on Environmental Sustainability in Semi-Arid Coastal Areas (CREST-RESSACA); The National Science Foundation; The Water Project; The Alliance for Graduate Education and the Professoriate (AGEP); The Energy Research ACRS Discipline Fund; and the U.S. Veterans Administration. We would also like to acknowledge the work of Texas A&M University-Kingsville Graduate Students Daniel Heuston, and Wei Yang for their work on this project.
Author Disclosure Statement
No competing financial interests exist.