
Abstract
Abstract
One of the environmental risks associated with use of hydraulic fracturing stimulation technologies for oil and natural gas recovery is the potential release of used fluids into surface waters, soils, and groundwater that could contaminate drinking water resources. To better characterize biodegradability of organic additives, we developed a synthetic fracturing fluid (SFF) based on industry-disclosed formulas, compared its organic carbon composition to fluids used in Pennsylvania's Marcellus shale, and amended agricultural soil–groundwater microcosms with three different SFF concentrations to determine organic carbon degradation rates, changes in system biogeochemistry, and microbial community dynamics under aerobic and anaerobic conditions. Microorganisms indigenous to soils and groundwater were able to degrade between 70% and 92% of the amended dissolved organic carbon within 39 days, suggesting significant mineralization, transformation, or biomass assimilation of organic additives across anaerobic and aerobic redox conditions. Sequencing analysis of the 16S rRNA gene revealed a greater abundance of Pseudomonas in aerobic treatments and a higher relative portion of Desulfovibrio in anaerobic treatments amended with SFF, indicating that these taxa may be involved in SFF biodegradation processes under specific redox conditions. Results provide insight into biodegradability of hydraulic fracturing fluid organic additives in shallow agricultural soils and groundwater and biogeochemical processes that may attenuate their migration if accidentally released or spilled at the surface during hydraulic fracturing activities.
Introduction
U
On the contrary, the wide-spread application of hydraulic fracturing in shale gas formations has triggered intense concerns over potential environmental impacts, including the possible contamination of water supplies from chemical additives used in the hydraulic fracturing process (Rahm, 2011; Schnoor, 2012; Soeder et al., 2014; Vengosh et al., 2014). Fluids injected during hydraulic fracturing can contain up to 2% chemical additives to improve the stimulation and natural gas recovery process (e.g., acids, pH adjusters, friction reducers, gelling agents, crosslinkers, breakers, and surfactants) and help sustain the integrity of the wellbore throughout production (e.g., iron control, biocides, oxygen scavengers, scale inhibitors) (Arthur et al., 2008; NYSDEC, 2011; Vidic et al., 2013; Stringfellow et al., 2014; U.S. Environmental Protection Agency [USEPA], 2015).
Chemical additives generally fall within a dozen categories (Gregory et al., 2011; Vidic et al., 2013), with mixtures varying by formation and hydraulic fracturing company (Arthur et al., 2009; Waxman et al., 2011). Most disclosed chemicals in hydraulic fracturing fluids are organic (Stringfellow et al., 2014), with reported dissolved organic carbon (DOC) concentrations between 290 and 970 mg/L for the Marcellus shale (Cluff et al., 2014; Strong et al., 2014). About half of all organic compounds in fracturing fluids are considered readily biodegradable (OECD, 1994; Stringfellow et al., 2014). However, this inherent degradability is based on individual compound properties rather than the fracturing fluid matrix. Chemical interactions and inhibition by other components of the mixture may lower biodegradability (Lester et al., 2014; Kekacs et al., 2015), influencing chemical fate and longevity in the environment (Kahrilas et al., 2014).
Although many of the chemical additives used in fracturing fluid formulations are voluntarily disclosed by some companies, the organic compounds of individual additives and that of residual waste fluids returning from the shale are complex (Abualfaraj et al., 2014; Cluff et al., 2014; Orem et al., 2014; Strong et al., 2014; Getzinger et al., 2015), presenting challenges for assessing compound fate (Kekacs et al., 2015; Llewellyn et al., 2015). As a result, the development of standard analytical methods for the detection and quantification of novel compounds is ongoing (DeArmond and DiGoregorio, 2013; Thurman et al., 2014; USEPA, 2015). Nonetheless, organic derivatives in injected or produced fluids from New Albany shale (Schlegel et al., 2013), Marcellus shale (Cluff et al., 2014; Orem et al., 2014; Akob et al., 2015), and central waste treatment facilities accepting shale waste fluids in Pennsylvania (Getzinger et al., 2015) have identified many biodegradable compounds (e.g., ethylene glycols, C2–C32 alkanes/alkenes, and ethoxylated alcohols) in addition to intermediate microbial metabolites such as acetone (Kekacs et al., 2015; Lester et al., 2015). This suggests that under conditions conducive to biological growth, a portion of organic additives may be readily attenuated in the environment.
In their study on the potential risks of hydraulic fracturing to drinking water resources, the USEPA (2012) considered several pathways for fluid release, concluding that, along with others, on-site spills to surface waters and soils were the most likely routes of contamination from used chemicals, fracturing fluids, and produced wastewaters (Drollette et al., 2015; Llewellyn et al., 2015; USEPA, 2015). Although only a few documented cases currently tie hydraulic fracturing activities to surface water (Entrekin et al., 2011; Papoulias and Velasco, 2013), soil (Adams, 2011), or groundwater (GW) contamination (DiGiulio et al., 2011; Drollette et al., 2015; Llewellyn et al., 2015), there are many reported surface spills in states with active shale gas drilling (NYSDEC, 2011; Gross et al., 2013), generally coinciding with higher well densities and drilling activities (Vengosh et al., 2014). Knowledge of how organic additives attenuate in shallow soils and GW (Gross et al., 2013) after surface spills is therefore needed to predict plume fate and develop remediation technologies that protect water resources.
In this study, we used batch microcosm experiments and measurement of organic carbon to evaluate how additives in hydraulic fracturing fluids attenuate in a soil-GW system with an overarching goal of determining biodegradation rate constants and providing insight into expected biogeochemical processes for surface spills. We hypothesized that an increased concentration of fracturing fluid containing a variety of xenobiotic compounds would cause an inhibition effect on the natural microbiota, decreasing both the rate and extent of organic carbon mineralization. We further anticipated that exposure to fracturing fluids would reduce microbial biodiversity and, based on disclosed organic compounds, result in a community dominated by members known for organic carbon degradation pathways. Our results help to constrain biodegradation rates for bulk organic compounds in hydraulic fracturing fluids under conditions typical of shallow soils and GW and highlight the microorganisms attenuating these compounds to enable better prediction of the fate of additives in the natural environment.
Experimental Protocols
Synthetic hydraulic fracturing fluid
Hydraulic fracturing fluid composition, including the concentration of specific additives used during the completion of wells drilled and hydraulically fractured in Pennsylvania and Ohio Marcellus shale, was downloaded from the Fracfocus Chemical Disclosure Registry (Fracfocus, 2012). Formulations were chosen from several of the most active service companies drilling Marcellus wells in the region during 2010 and 2011. Water, sand proppant, and eleven chemical additives (acid, iron controls, corrosion inhibitors, friction reducers, clay stabilizers, gelling agents, biocides, crosslinkers, breakers, pH adjustors, and scale inhibitors) comprised >99% by volume of the components disclosed for these wells. Additives not available in our laboratory were obtained from two chemical manufacturers serving the Marcellus shale gas industry. Weatherford provided samples of corrosion inhibitor (AI600), friction reducer (WFR-61LA), surfactant (Revert Flow), clay stabilizer (CC-120), and a gelling agent (WGA 15L), while NALCO provided the biocide (EC6110A). A 100-mesh sand (Unimin Corporation) was used as a proppant.
Fresh water for use in a synthetic fracturing fluid (SFF) was collected from Atwood Lake in Mineral City, OH, which serves as a water source for hydraulic fracturing operations in southeast Ohio. Atwood Lake samples were collected from the south end using a peristaltic pump, then placed immediately on ice, and stored at 4°C until use. As only concentration ranges of specific additives within formulations were disclosed on FracFocus in the wells we surveyed, the SFF was made for low, middle, and high range concentrations (Supplementary Table S1). Our experiments assume a “bulk” accidental fluid release; therefore, additives and proppants used throughout the well completion process were combined to represent a mixed fluid release scenario. Field-used hydraulic fracturing fluid samples were provided by the Department of Energy National Energy Technology Laboratory (DOE NETL) in June 2012 and used as a comparison to the chemistry of our SFF. These field samples were collected before use in three Marcellus shale wells drilled to a depth of 2,517 ± 12 m in Carmichaels, PA.
Microcosm experimental setup
Aerobic and anaerobic batch microcosms were used to evaluate the biodegradation potential of SFF across differing fracturing fluid concentrations. Since the majority of shale gas development is occurring in rural areas of Pennsylvania, West Virginia, and Ohio, agricultural soils are a representative medium for spills at these sites. Soil cores were obtained from agricultural fields on the Ohio State University Waterman Center. Samples were collected from the top 0.6 m of soil using a handheld corer, placed into autoclave-sterilized mason jars, covered, and stored at 4°C until use. GW samples were obtained from the Parsons Avenue Water Treatment Facility, which derives its water from regional GW aquifers around Columbus, OH. Untreated water samples were collected into a 15 L low-density polyethylene (LDPE) carboy and transported to Ohio State University, where they were stored at 4°C.
Soil, GW, and SFFs were added together to achieve a final solid:liquid ratio of 1 g soil:5 mL fluid (8 g soil to 40 mL total liquids in 60 mL bottles, 20 g soil to 100 mL total liquids in 125 mL serum bottles). The low-range SFF was added to GW in four different dilutions on a volume per volume basis: ambient control (background conditions containing all GW, no added SFF), 25% SFF (1 mL SFF to 3 mL GW), 50% SFF (1 mL SFF to 1 mL GW), and 100% SFF (no GW dilution).
Experiments were conducted under aerobic and anaerobic redox conditions. Aerobic treatments were covered with sterile aluminum foil to maintain oxygen transfer to the system while limiting the introduction of airborne bacteria. After soil, GW, and SFF were combined, anaerobic treatments were gassed with 80%:20% N2:CO2 for 25 min (15 min in soil solution phase and 10 min in the headspace) before sealing with sterile rubber septa, and crimping closed. Abiotic controls contained soil, GW, and SFF at all amendment concentrations. These were crimp sealed and autoclaved twice prior the start of the experiment. Aerobic abiotic samples were then uncrimped and covered with sterile foil, while anaerobic samples remained sealed and gassed. All bottles (abiotic and biotic) were held at 20°C in the dark while rotating at 150 rpm.
Geochemical parameters were evaluated for duplicate bottles across seven time points (0, 4, 7, 12, 15, 25, and 39 days), with microbial community dynamics assessed for a subset of biotic samples (0%, 25%, 100% SFF amendment) at four time points (0, 4, 12, 39). In total, 224 bottles were sampled during the experiment, representing the following experimental factors: two duplicates, four SSF concentrations, two redox conditions, two biotic/abiotic, and seven time points.
Chemical analyses
Solution pH, dissolved oxygen (DO), and conductivity were measured during sampling on unfiltered samples using Orion Star probes (ThermoFisher Scientific) calibrated before use. Changes in solution geochemistry were assessed for total dissolved carbon (TDC), DOC, total dissolved nitrogen (TDN), dissolved anions (SO42−, Cl−, NO3−), and dissolved elements (Al, Ba, Ca, Fe, K, Mg, Mn, Na, P, S, Si, Sr) after filtration (0.22 μm PES membrane filters; EMD Millipore).
Samples for TDC and DOC (acidified to pH <2 using HCl) along with TDN were measured by combustion at 625°C using a TOC-V CSN Carbon Analyzer (Shimadzu) following the EPA Method 415.1. Dissolved anions were analyzed with a Dionex ICS-2100 ion chromatograph (Dionex Corporation) using an AS-11HC column at 30°C with a flow rate of 1.5 mL/min for 40 min per sample eluted in a 1–60 mM gradient of KOH. Samples for elemental analysis were first acidified with 5% (v/v) ultrapure concentrated nitric acid (HNO3−) and then analyzed following the EPA method 6010C on a Varian Vista AX ICP-AES (Agilent) with a flow rate of 1.5 mL/min, a nebulizer rate of 0.8 L/min, and argon coolant rate of 15 L/min.
DNA extraction, amplification, and sequencing
Total nucleic acids were extracted from 1 g sediment using the PowerSoil DNA Isolation Kit (MoBio). Extracted DNA purity and quantity were measured on a Nanodrop 2000 Spectrophotometer (ThermoFisher Scientific) after visualization on 1.5% agarose gel. DNA was amplified for sequencing using primer pair 515F (5′-GTG CCA GCM GCC GCG GTA A-3′) and 806R (5′-GGA CTA CVS GGG TAT CTA AT-3′) covering the V4 region of the 16S rRNA gene targeting both Bacteria and Archaea (Liu et al., 2007; Berry et al., 2011). The 515F primer included a Roche Lib-L adapter and sample-specific barcode (Roche Applied Science).
Polymerase chain reactions were carried out in duplicate on a S1000 Bio-Rad Thermal Cycler using the amplification protocols and cycles described elsewhere (Cluff et al., 2014). After pooling duplicate polymerase chain reactions, unidirectional pyrosequencing was conducted on a Roche Genome Sequencer FLX Titanium System (Roche Diagnostics) at the Ohio State University Plant Microbe Genomics Facility with amplicon purification, quality assessment, and quantity assessment before sequencing.
Statistical analyses of geochemical and sequence data
Degradation rate constants, k (day−1), were calculated using a first-order kinetic rate model for the first 12 days of incubation and between 12 and 25 days incubation. Maximum rate constants, calculated along the linear portion of the DOC degradation curve, are also reported. These periods were chosen so that a lag period observed in anaerobic bottles did not skew rate constant comparisons between treatments. Statistical analyses were conducted using JMP version 9.0 (SAS Institute, Inc.). Significant influences of the treatment factors as well as the interactions among those factors were analyzed using analysis of variance, two-sample student t-test (at the α = 0.05 level), and Tukey's honest significance difference (HSD) tests (at the α = 0.01 level).
Raw sequence processing was done using Mothur following standard operating procedures (Schloss, 2009; Schloss et al., 2011). Raw sequence data were quality filtered, trimmed, and aligned to a SILVA database containing bacterial and archaeal sequences, and chimeras identified using UCHIME (Edgar et al., 2011) were removed. For the 186,089 postprocessed sequences, those with greater than 97% identity were clustered into operational taxonomic units (OTUs) using the average neighbor joining algorithm based on uncorrected pairwise distance matrix in Mothur. Ecological and statistical analyses were computed using 2,257 randomly subsampled sequences per sample. Statistical testing was completed in R version 3.0.2 using Vegan, Phylseq, Labsv, Cluster, and Indicspecies packages (De Caceres and Legendre, 2009; McMurdie and Holmes, 2013; Oksanen et al., 2013; Roberts, 2013; Maechler et al., 2016).
Bray–Curtis dissimilarity indices were used to conduct nonparametric multidimensional scaling (NMDS) analysis with ordinations rotated to principal component axes in MetaMDS. Environmental data were fit to NMDS scores using Envfit with projections scaling the ordinations by the square root of R2. Ward's method was used to determine clusters on Bray–Curtis dissimilarity indices, with indicator species identified from 999 permutations at a significance level of p < 0.05. Sequences are available from the National Center for Biotechnology Information under Bioproject #PRJNA254742.
Results
Comparison between synthetic and field-used hydraulic fracturing fluids
The three field-used hydraulic fracturing fluids had TDC, DOC, TDN, and P concentrations that generally fell within the range of low to medium SFF concentrations (Table 1). The average pH of field-used fluids was significantly higher than the pH values of our SFFs. Differences in pH were expected, as acid injection for wellbore cleaning occurs separate from and before the injection of fluids containing proppants and other additives (Arthur et al., 2008).
Values represent the mean concentration ± standard deviation for the listed parameters in milligrams per liter (mg/L), with the exception of pH, which is reported as a standard log activity value.
Statistical comparisons were between field-used samples and SFF samples using Tukey–Kramer HSD method at an α = 0.01 level. Means having statistically similar distributions are shown with the same numerical superscript.
Total dissolved carbon (TDC).
Total dissolved organic carbon (DOC).
Total dissolved nitrogen (TDN).
HFF, hydraulic fracturing fluid; HSD, honest significant difference; SFF, synthetic fracturing fluid.
Rate and extent of organic carbon degradation
Low-range SFFs contained DOC concentrations that were statistically similar to field-used samples (Table 1). With the assumption that industry is disclosing accurate fluid additive recipes, we chose the low-range SFF recipe as the representative amendment in the degradation experiments. Microcosms amended with SFF had higher initial levels of DOC than ambient (3.6 mg/L DOC) and abiotic controls (36 mg/L DOC), with concentrations ranging between 48, 110, and 250 mg/L for 25%, 50%, and 100% SFF treatments, respectively (see average day 0 values for aerobic and anaerobic samples shown in Supplementary Table S2). All abiotic controls had higher DOC concentrations resulting from autoclave sterilization of soils and GW. During the first 4 days of incubation, 60% to 80% of the DOC was removed from solution in biotic aerobic treatments amended with SFF compared with 10% to 15% in abiotic controls (Fig. 1A and Table 2A). After 39 days of incubation, the percent DOC removed in aerobic treatments was substantial, ranging between 80% and 92% across our SFF treatments (Fig. 1A).

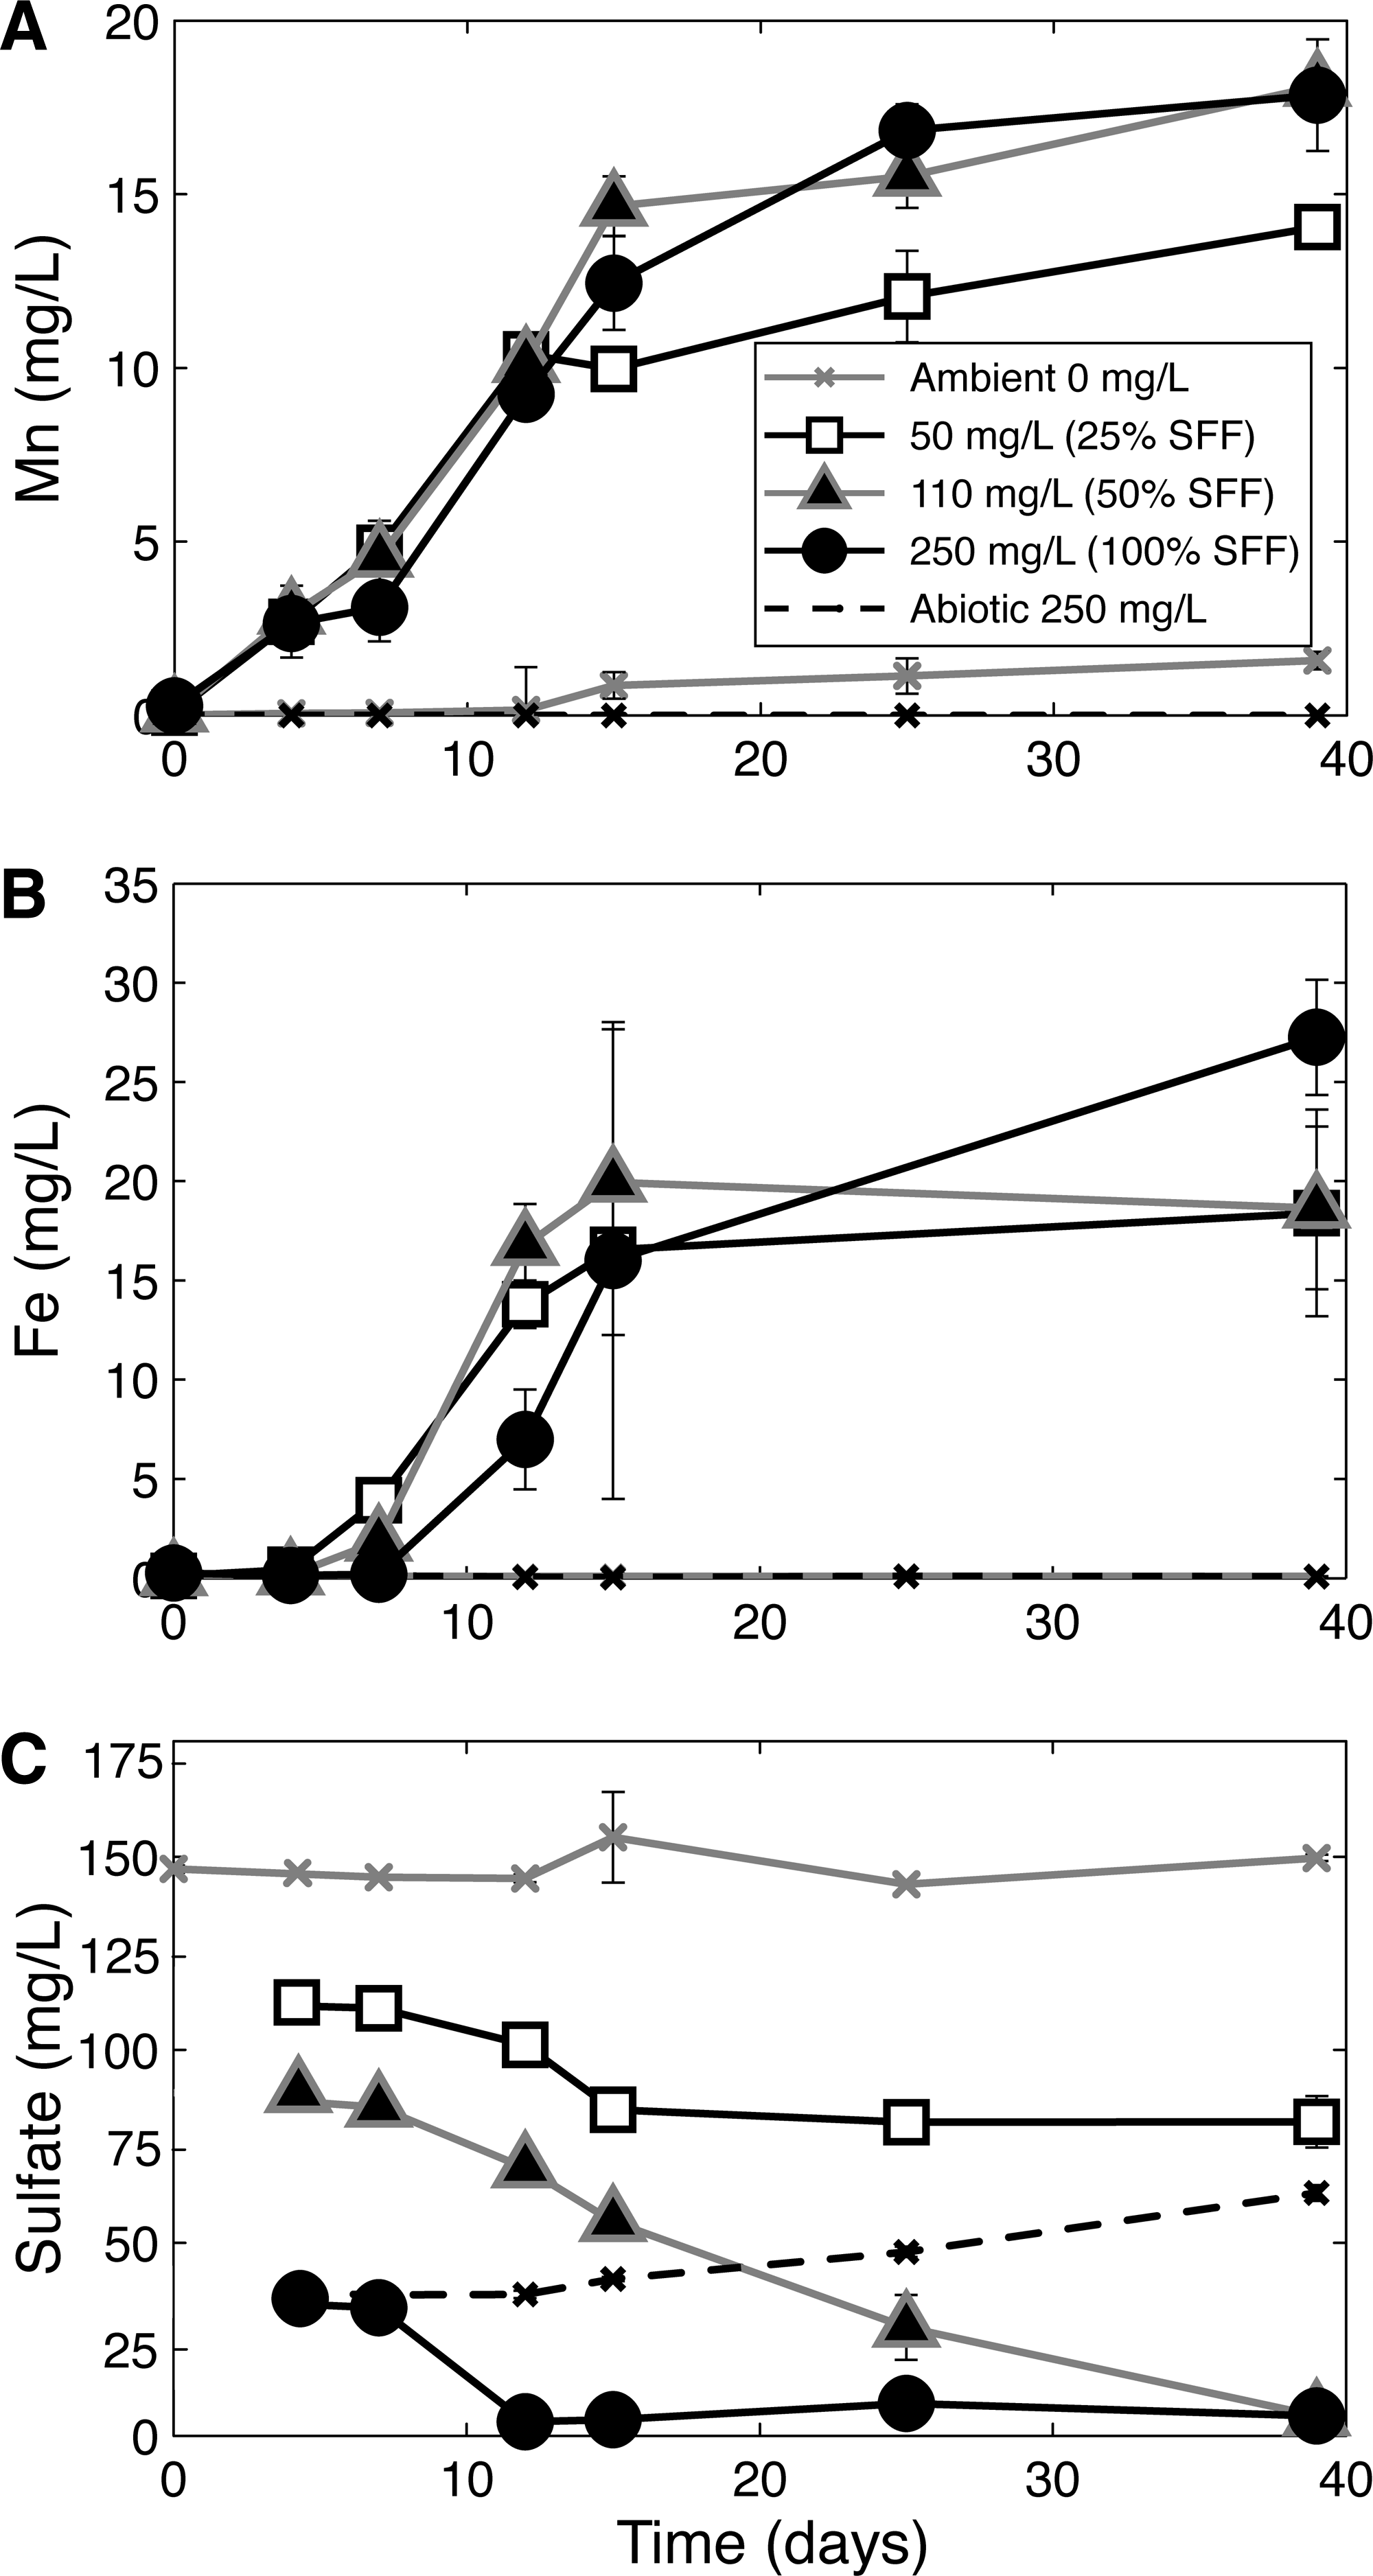
Change in total dissolved organic carbon concentrations over time in
Degradation extents are also shown for autoclave sterilized (abiotic) treatments.
DOC, dissolved organic carbon.
Overall decreases in DOC for biotic anaerobic treatments ranged from 70% to 82% of the initial concentration. Degradation was slower under anaerobic conditions, and a lag period of up to 2 weeks was observed for higher amendment concentrations (Fig. 1B and Table 2A). By comparison, DOC concentrations in aerobic and anaerobic ambient controls increased through time from 3.6 to 4 mg/L (average 11%), while the abiotic controls decreased by 19% ± 8% and 9% ± 7% in aerobic and anaerobic treatments, respectively (average across 25%, 50% and 100% SFF for 0 to 39 days, shown in Table 2A). DOC attenuation in the abiotic treatments can be attributed to nonbiological processes (e.g., soil sorption). After 39 days, treatments amended with 100% SFF showed a higher overall degradation extent than those amended with lower SFF concentrations for both aerobic and anaerobic conditions (Fig. 1 and Table 2A).
Differences were observed between aerobic and anaerobic degradation rate constants, as well as for constants determined from early versus later sampling points (Table 2B). When degradation was compared between redox conditions, maximum observed degradation rate constants were higher in aerobic treatments than anaerobic treatments (p = 0.038, t-test). Rate constants for biotic treatments were substantially above those calculated for abiotic controls, which averaged 0.01 day−1 or below. Aerobic treatments had significantly higher degradation rate constants during the first 12 days of incubation (Table 2B) compared with rate constants between 12 and 25 days (p = 0.003, t-test). In contrast, degradation of DOC under anaerobic conditions was negligible during the first 12 days, increasing substantially between day 12 and 25 (p = 0.02, t-test). In both aerobic and anaerobic treatments, DOC concentrations began to approach an asymptote after 25 days incubation (Fig. 1), with associated rate constants <0.03 day−1 after this time.
Changes in microcosm system geochemistry
Mean conductivity of microcosm solutions differed between ambient and amended samples, increasing with higher SFF percent for both aerobic and anaerobic treatments, regardless of whether they were biotic or abiotic systems (Tukey HSD, p < 0.0001) (Supplementary Table S2). Conductivity and Cl− values changed little over time, with the exception of coming into equilibrium during the first 4 days (Supplementary Table S2). Conductivity was higher with increased SFF because of the addition of hydrochloric acid and pH adjustors in amended chemical additives (Supplementary Table S1). The pH values ranged between 6.1 and 8.1, increasing in all microcosms until levels stabilized at pH 7.0 ± 0.7 around day 12 (Supplementary Table S2). Mean DO concentrations in aerobic treatments were 4.2 ± 0.8 mg/L, while anaerobic treatments remained at 1.1 ± 0.2 mg/L throughout their duration (Supplementary Table S2), near the lower limit of our probe (0.5 mg/L).
Aerobic and anaerobic treatments containing 25% or 100% SFF showed loss in total nitrogen and nitrate from solution through time, suggesting microbial assimilation of nitrogen and/or denitrification. SFF amendment in anaerobic biotic treatments also resulted in considerable reduction of manganese (Mn) and iron (Fe), while abiotic and ambient controls showed minimal concentration change (Fig. 2A, B). Mn reduction commenced near the start of the experiment for all anaerobic treatments containing SFF and continued for 39 days. Higher SFF amendments (50%, 100%) drew more Mn into solution than the lower SFF amendment (25%) and microcosms without SFF (ambient; Fig. 2A). Fe reduction started after 4 days in SFF-containing treatments and increased to levels of 15 mg/L or more (Fig. 2B). Higher SFF amendment (100%) resulted in the greatest concentration of aqueous Fe at the end of the experiment. Microcosms kept under ambient and abiotic conditions showed little detectable aqueous Fe increase through time (Fig. 2B).
Changes in total dissolved
GW used in our microcosm study contained higher sulfate concentrations than Atwood lake water used for making the SFF. As a result, initial sulfate concentrations differed by treatment, with ambient and low SFF amendment having higher levels than high SFF treatments (Fig. 2C). After only 12 days, sulfate concentrations decreased rapidly to <5 mg/L in 100% SFF treatments. Similar final sulfate concentrations were reached in 50% SFF treatments after 39 days or less, even though initial levels were more than twice as high (Fig. 2C). Microcosms amended with 25% SFF showed a decrease in sulfate, but levels plateaued after about 15 days corresponding to the time when DOC change levels off (Figs. 1B and 2C). Ambient controls changed little through the duration of the experiment, while abiotic controls showed a small release of sulfate after about 15 days (Fig. 2C). At this time, the color of the suspensions visibly darkened. This observation, combined with the concomitant decrease in sulfate, suggested sulfate was reduced to sulfide, which precipitated from the solution.
Microbial community dynamics
Between 2,300 and 21,000 16S rRNA gene sequences were obtained for each sample after quality filtering pyrosequencing reads, resulting in a total of 186,089 sequences for OTU classification and diversity measures (Table 3). After subsampling to an equal number of sequences per sample (2,257), higher richness was observed in aerobic microcosm treatments amended with SFFs (1,455 OTUs) compared with SFF-amended microcosms incubated under anaerobic conditions (1,095 OTUs). Aerobic treatments amended with SFF also had higher average Chao's diversity measures (2,749) than anaerobic treatments (1,916). When we evaluated the effect of SFF amendment on biodiversity in aerobic microcosms, richness and diversity decreased substantially through time in 100% SFF treatments, while treatments held ambient showed little change (Table 3). No significant temporal trends in richness and diversity estimates were observed in anaerobic microcosms.
OTU, operational taxonomic unit.
Eighteen taxa comprised >44% of the sequences in our samples, while 61 OTUs were necessary to describe the majority (74–87%) of microbial community members (Supplementary Table S3). Unclassified bacteria were one of the most abundant OTU classifications, representing between 2% and 30% of the subsampled sequences (Fig. 3). In microcosms kept aerobic, sequences associated with Proteobacteria (Alpha-, Beta-, and Gamma-) were high in abundance for treatments stimulated by SFF compared to the ambient system. Within Gammaproteobacteria, Pseudomonadaceae and Xanthomonadales were particularly enriched in dilute (25%) and high (100%) SFF amendments (Supplementary Table S3). This included the genera Pseudomonas and Cellvibrio and other unclassified Pseudomonadaceae. Bacteroidetes, including Chitinophagaceae, Ohtaekwangia, and other unclassified Bacteroidetes, were detected across aerobic treatments at relatively high abundance. Sequences closely related to Clostridiales were particularly common in aerobic treatments stimulated with 100% SFF amendments.
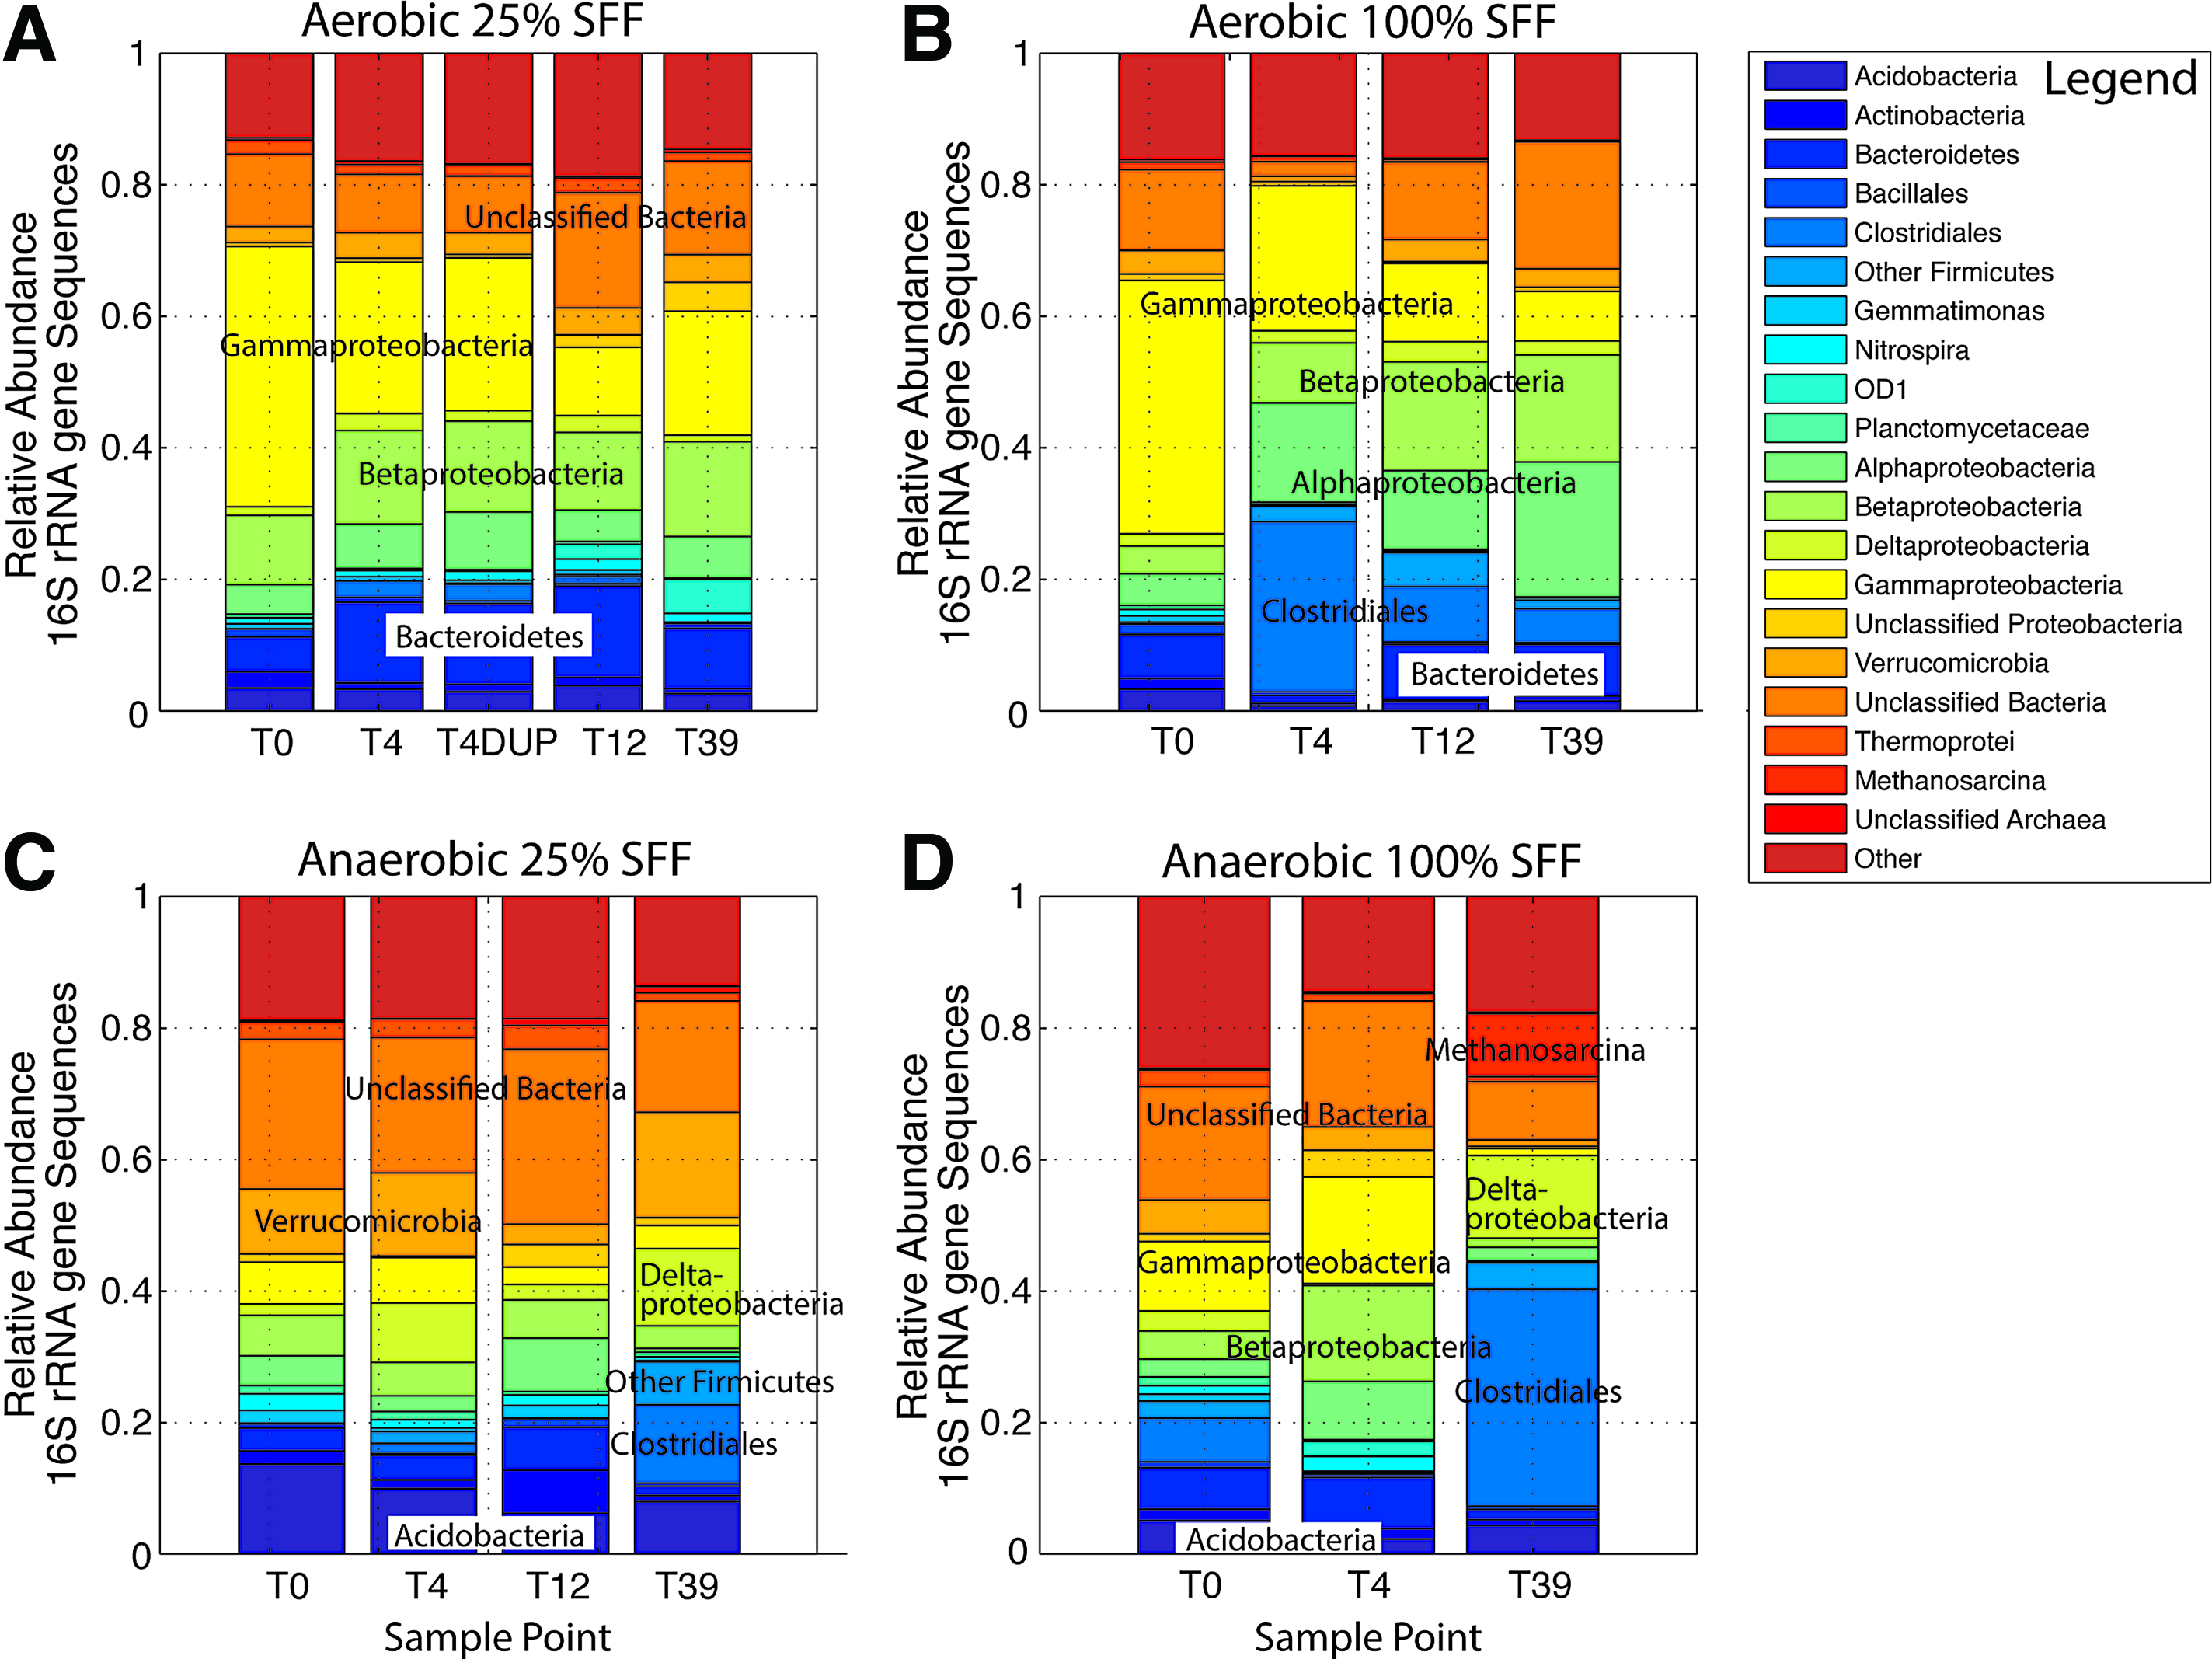
Changes in relative abundance of dominant microbial taxa observed in sediment microcosms maintained under aerobic conditions with
Microcosms held under anaerobic conditions also showed high abundance of unclassified bacteria, Gammaproteobacteria, and Betaproteobacteria, but differed from aerobic treatments by having a higher abundance of Acidobacteria, Clostridiales, Deltaproteobacteria, and Verrucomicrobia. Noted Gammaproteobacteria in anaerobic treatments included Pseudomonas during earlier time points (T4), while abundant Deltaproteobacteria included Geobacter in the later time points (T39) of SFF-amended treatments. Particularly common Betaproteobacteria under anaerobic conditions included Comamonadaceae, Dechloromonas, and Azoarcus.
Although the 16S rRNA primer set used is capable of amplifying from the Archaeal domain (Brooker et al., 2014; Cluff et al., 2014), very few Archaeal sequences were detected in our treatments. Exceptions include (1) the Euryarchaeota methanogenic genus Methanosarcina in the later time point (T39) of anaerobic samples amended with SFF (25% and 100%), (2) unclassified Thermoprotei within Crenarchaeota (<4%) detected across all treatments throughout the experiment, and (3) five unclassified Archaeal taxa present at low abundance (≤1%) with no obvious temporal trend (Supplementary Table S3).
NMDS analysis of microbial community dynamics showed that initial communities for the aerobic and anaerobic treatments clustered together (Fig. 4), separating through time and by treatment across NMDS 1 and NMDS 2 axes. The initial and final ambient controls clustered together in multivariate space, as did duplicates for the aerobic SFF 25% amendment. Aerobic treatments (enclosed within blue drawn area) with low and high SFF amendments separated across NMDS 1, with higher amendment concentrations resulting in larger early (T4) and final (T39) distance from starting communities. While aerobic communities grouped by concentration, anaerobic treatments (enclosed within red drawn area) separated from other communities across both NMDS 1 and NMDS 2 based on both time and SFF concentration, with the furthest distance associated with higher SFF amendments (25%, 100%) after 39 days (Fig. 4).
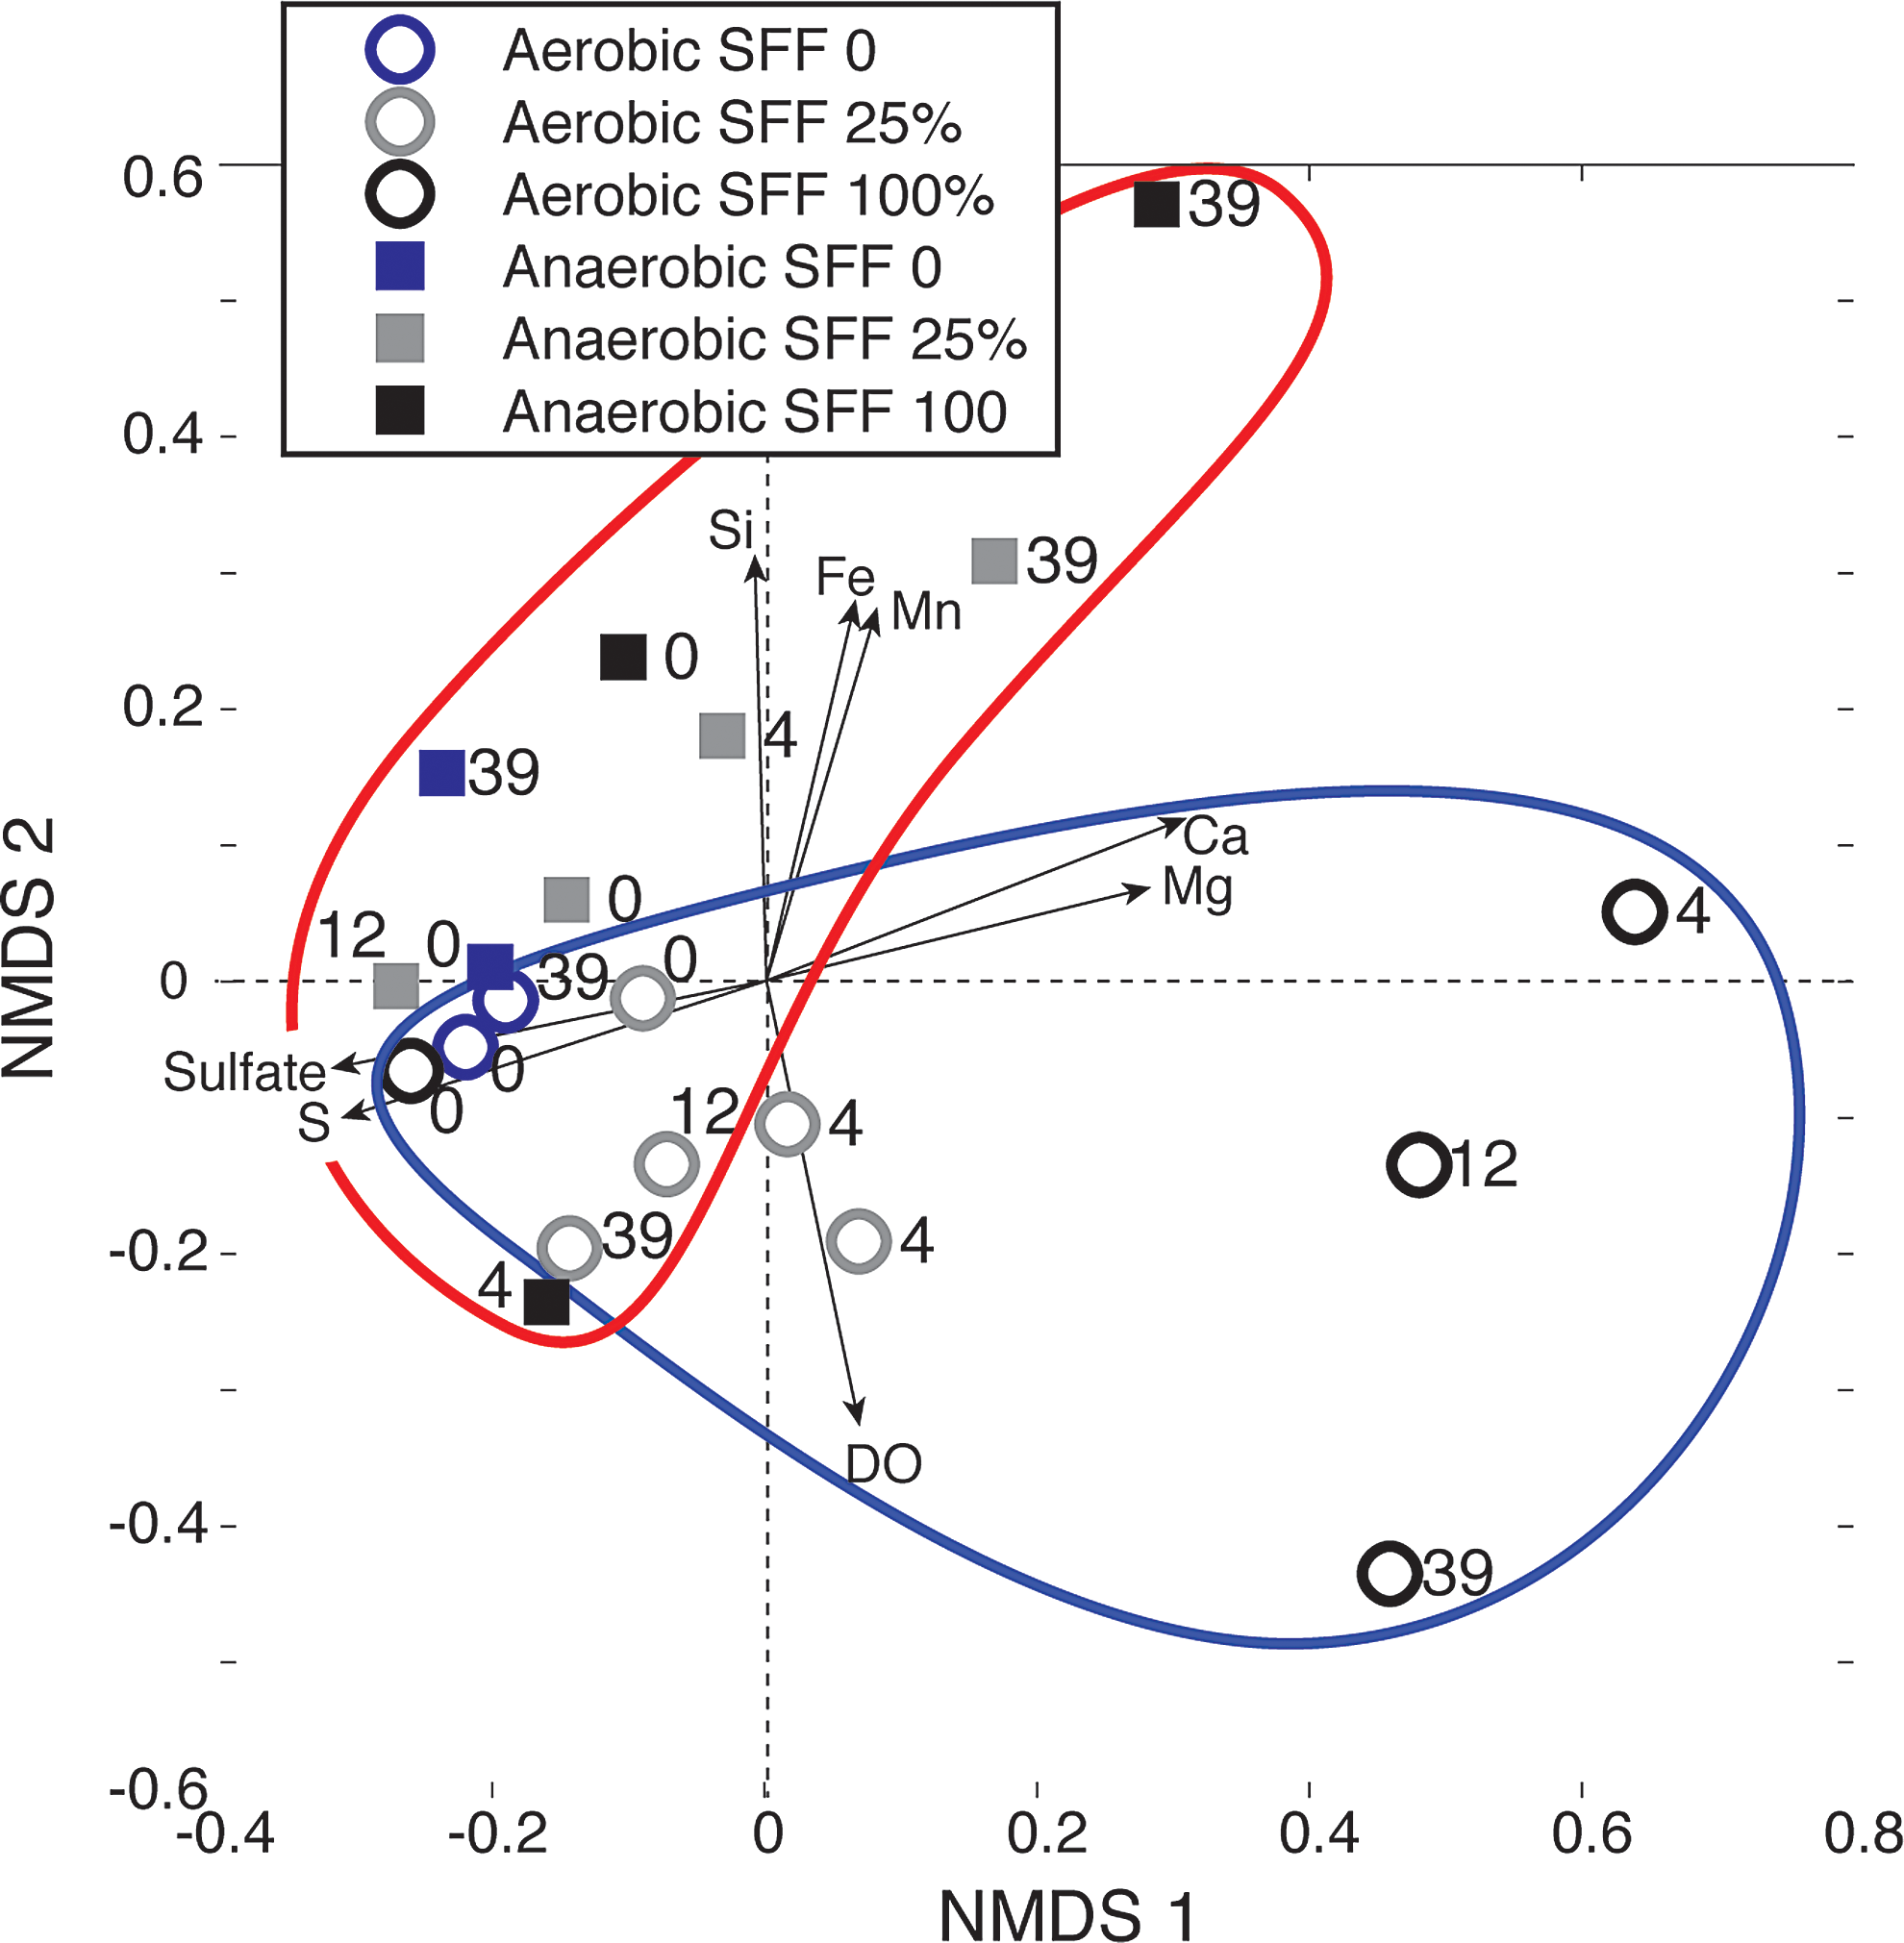
NMDS analysis of microbial community in samples incubated under different conditions, and geochemical vectors plotted on the same axes. NMDS, nonparametric multidimensional scaling.
Of the 20 parameters tested as possible geochemical drivers for these patterns, microbial community differences were significantly correlated to eight (p < 0.05), including several electron acceptors (Table 4 and Fig. 4). For example, DO was correlated to aerobic communities, while Fe and Mn were correlated to anaerobic communities across opposite directions of NMDS 2. Higher SFF amendment was correlated to Ca and Mg concentrations, while lower amendment to total S and sulfate levels across NMDS 1 (Fig. 4). Higher Si was also associated with anaerobic treatments containing SFF amendment.
BDL, below detection limit; Cond, conductivity; DO, dissolved oxygen; NA, data not available; TDN, total dissolved nitrogen.
Hierarchical cluster analysis showed the microbial data could be separated into four distinct communities at 80% dissimilarity level, corresponding to the redox condition and SFF treatments through time (Fig. 5). Group 1 contained all of the aerobic and anaerobic samples with no SFF amendment as well as anaerobic samples amended with 25% SFF for up to 12 days and the initial anaerobic time point for the 100% SFF amendment. Group 2 contained all of the aerobic samples amended with 25% SFF plus the initial aerobic 100% SFF amended sample and the day 4 100% SFF anaerobic sample. Group 3 contained aerobic treatments with 100% SFF amendment after the initial time point. Finally, anaerobic treatments at day 39 (T39) containing low or high SFF amendments clustered into Group 4. Indicator analysis identified 23 taxa significantly associated with each of these clusters. The most readily interpretable species were for Group 4, where indicator taxa could be identified to genus level and had high similarity to the methanogens Methanosarcina and sulfate reducing bacteria Desulfovibrio.
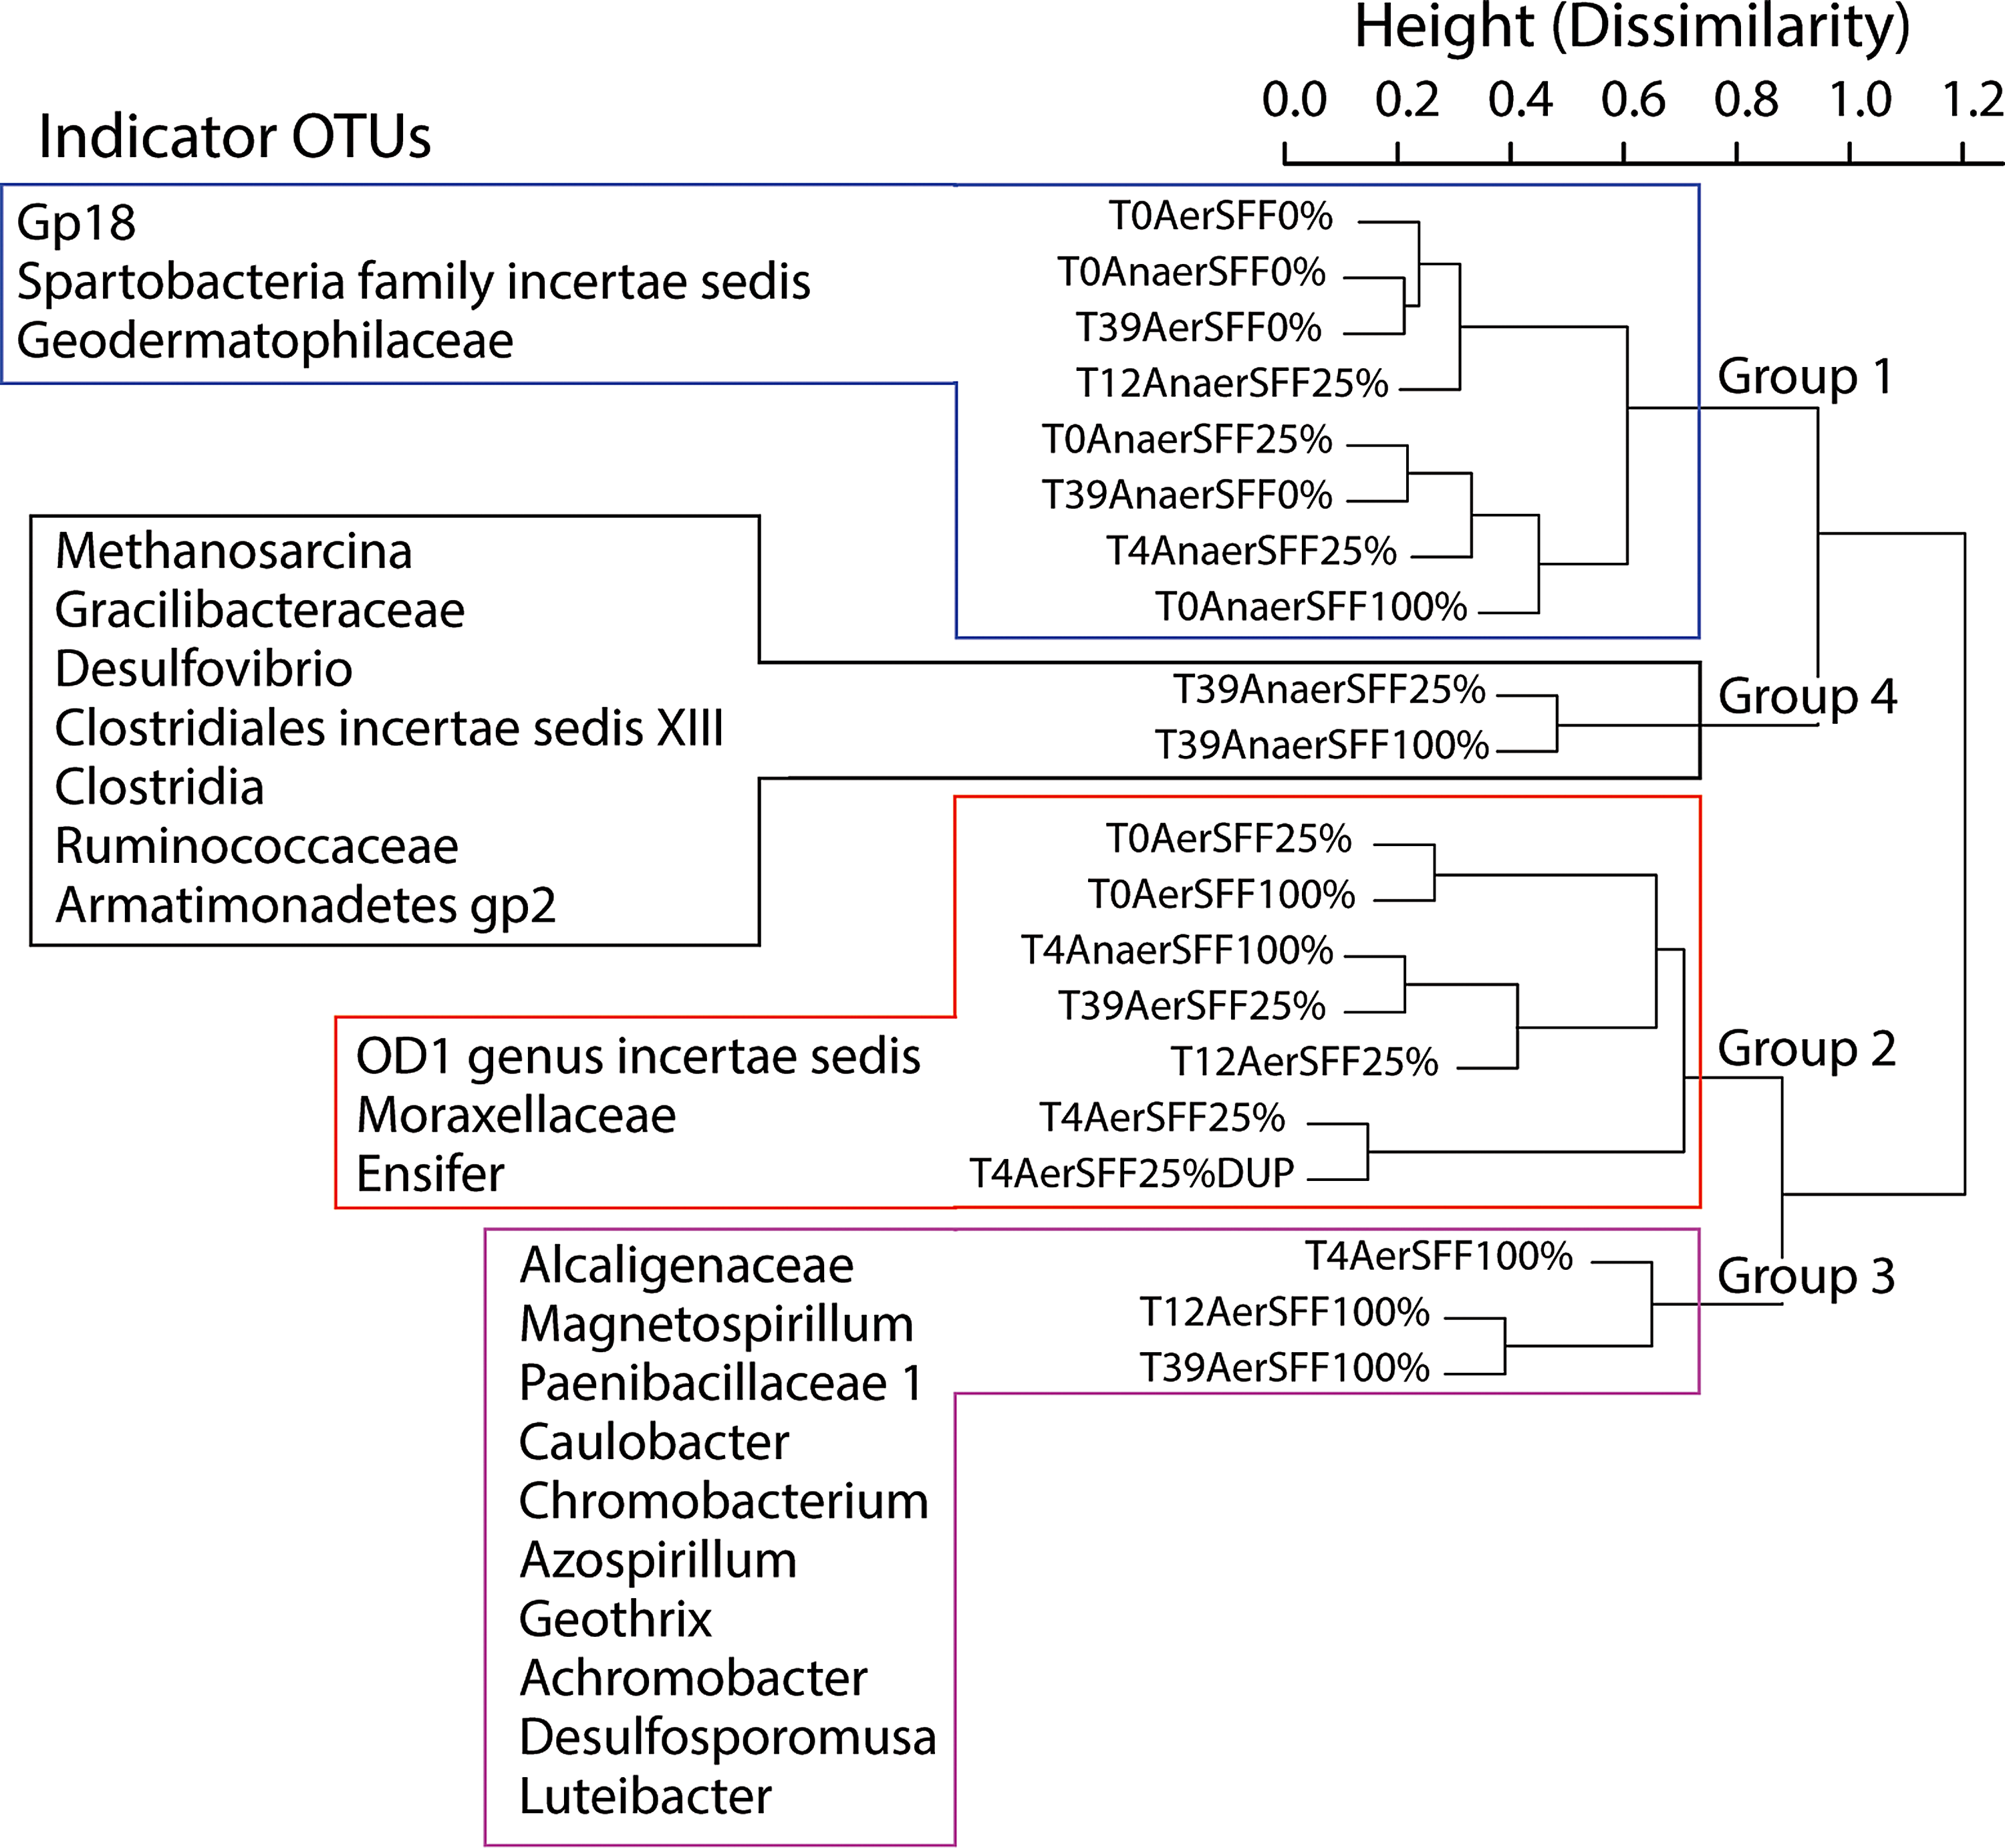
Dendrogram showing sample groupings based on hierarchical cluster analysis of Bray–Curtis dissimilarity matrix and indicator species identified in each group. Sample IDs represent sample time (T0, T4, T12, T39), redox condition (Aer, Aerobic; Anaer, Anaerobic), and SFF amendment (0%, 25%, or 100%).
Discussion
Using recipes voluntarily disclosed by industry working in the Marcellus shale, we developed a SFF that was similar in concentration for C, N, and P to fluids used for well stimulation in the Pennsylvania Marcellus shale. The SFF was amended to soil-GW microcosms to test the effect of increasing concentrations and redox conditions on degradation, geochemistry, and microbial community dynamics. Regardless of SFF concentration, a rapid attenuation of amended organic carbon in aerobic treatments occurred during the first 2 weeks of incubation, with concentrations approaching an asymptote after 25 days primarily through mineralization to CO2 or conversion to biomass.
Although there was lower microbial diversity with higher SFF in aerobic treatments, there was no obvious effect from specific chemical additives, such as increased biocide concentrations present in SFF on degradation rate constants or degradation extent. On the contrary, microcosms held anaerobic approached asymptotic concentrations over a period twice as long as aerobic treatments due to slower degradation kinetics, a longer lag phase, and possible limitations on the biodegradability of some organic constituents. Considering average rates of soil infiltration and GW flow, a 2-week acclimation phase would have little long-term effect on overall attenuation.
Changes in amended carbon concentrations indicate biodegradation of bulk DOC occurs within several weeks at ambient temperatures and pressures, regardless of amended concentration or redox condition. As expected, DOC degradation rate constants were faster and degradation occurred to a greater overall extent in the presence of oxygen than when other electron accepters were used. When we compared bulk degradation rates of SFFs to those determined for DOC from other complex carbon waste fluids, such as petroleum hydrocarbons, landfill leachate, and coal-tars, half-lives were similar, or on the order of 2–4 weeks (Kjeldsen and Christensen, 1984; Chapelle et al., 1996; Zamfirescu and Grathwohl, 2001). Like other high carbon wastewaters (e.g., crude oil, landfill leachate), SFF surface spills will likely create discrete zones of terminal electron accepting processes and microbial populations, with differing attenuation pathways depending upon the age and spatial extent of the release (Beeman and Suflita, 1987; Ludvigsen et al., 1997; Cozzarelli et al., 2000; Christensen et al., 2001; Röling et al., 2001; Mouser et al., 2010).
Carbon remaining in microcosm systems after 3 weeks (8–30%) represents SFF additives that are initially resistant to biodegradation, form new transformation products, or represent microbial metabolites. Unfortunately, identifying and quantifying these compounds are not trivial. Ongoing studies are addressing residual compounds in a soil-GW system through targeted compound and metabolite analysis. The continued development of analytical methods for characterizing novel chemicals or residual compounds (Thurman et al., 2014; Getzinger et al., 2015; Llewellyn et al., 2015) is critical for assessing compound fate and persistence in the environment.
Microorganisms are responsible for attenuating the majority of SFF organic additives, and communities responded quickly to its amendment, with lower biodiversity in SFF-amended aerobic microcosm treatments, including an abundance of Alpha-, Beta-, and Gammaproteobacteria. In particular, the gram-negative Gammaproteobacteria genus Pseudomonas is capable of thriving across a range of aerobic and suboxic niches, with several species known to degrade aliphatic or aromatic hydrocarbons (Anderson and Lovley, 1997; Van Beilen et al., 2002; Lalucat et al., 2006; Garcia-Valdes et al., 2010).
Interestingly, Pseudomonas and other Pseudomonadaceae have been noted as important members in recent studies of microbial dynamics in hydraulic fracturing fluids and produced wastewaters from shale gas wells (Davis et al., 2012; Fichter et al., 2012; Cluff et al., 2014), supporting their role in the oxidation of simple or complex organic carbon compounds from hydraulic fracturing fluid (HFF) organic additives or shale-derived hydrocarbons. With SFF amendment, communities shift to taxa associated with the degradation of complex organic substances in contaminated subsurface environments (Lovley, 1993; Heider et al., 1999; Röling et al., 2001), such as the Betaproteobacteria genus Azoarcus and Deltaproteobacteria genera Geobacter and Desulfovibrio (Lovley et al., 1993; Zhou et al., 1995; Heidelberg et al., 2004). We can, therefore, draw from what is already known about their metabolisms in developing bioremediation strategies in the case of hydraulic fracturing fluid spills.
Summary
Indigenous soil microorganisms were able to aerobically or anaerobically degrade between 70% and 92% of the added DOC in a SFF within 39 days. A portion of amended DOC (10–25%) remained in solution after this time, while a comparable portion (10–20%) was lost through sorption or volatilization under abiotic conditions. The presence of residual DOC indicates that some DOC mass may persist for several months or more within a shallow soil or GW system. Calculated degradation rate constants and extents were greater in aerobic microcosms for concentration similar to those measured in field-used HFFs. Like other high strength wastewaters and hydrocarbon sources, the addition of SFF under anaerobic conditions resulted in a stepwise terminal electron acceptor shift, as evidenced by increased Mn and Fe in solution, decreased sulfate, and the increased abundance of the sulfate reducing bacterial genus Desulfovibrio and the methanogenic genus Methanosarcina. Microbial communities associated with these activities are critical for attenuating organic additives in these fluids, and how they accomplish these transformations in the presence of other organics within the subsurface warrants further study.
Footnotes
Acknowledgments
This research was funded by the Ohio Water Development Authority award #5983 to P.J.M. and J.J.L and NSF Award #1336326 to P.J.M. The ADVANCE Rising Tide Center at UMaine through NSF Award #1008498 supported J.D.M. The authors thank Angela Hartsock and Richard W. Hammack with the U.S. Department of Energy National Energy Technology Laboratory and Elizabeth L. Rowan with the U.S. Geological Survey for assistance with hydraulic fracturing fluid sample acquisition. We also thank Parson's Water Treatment Facility for groundwater samples and Jonathan D. Witter for field equipment and assistance during soil coring.
Author Disclosure Statement
No competing financial interests exist.
References
Supplementary Material
Please find the following supplemental material available below.
For Open Access articles published under a Creative Commons License, all supplemental material carries the same license as the article it is associated with.
For non-Open Access articles published, all supplemental material carries a non-exclusive license, and permission requests for re-use of supplemental material or any part of supplemental material shall be sent directly to the copyright owner as specified in the copyright notice associated with the article.