
Abstract
Abstract
Sunlight irradiation is known to contribute to microbial inactivation in natural treatment systems (NTS) and surface waters via both direct and indirect processes. This study investigated the influence of various types of organic matter (OM) on endogenous and exogenous photoinactivation of Enterococcus faecalis. Solar simulator exposure experiments were conducted in surface waters and wastewater and in the presence of natural OM isolates and a singlet oxygen (1O2) sensitizer, methylene blue. Presence of both natural and anthropogenic OM resulted in increases in inactivation rates of 17–67% compared to sensitizer-free experiments. This suggests that, while direct and endogenous photoinactivation is hindered with increasing depth due to light screening by OM, its role as a photosensitizer in the formation of reactive intermediates (predominantly involving 1O2) is greater than its negative impact due to light screening at levels typically found in NTS. Specifically, increases in light absorbance (particularly at shorter wavelengths) are estimated to reduce direct and endogenous processes by up to 41% under our experimental conditions; however, presence of external photosensitizers enhances exogenous inactivation processes to a greater degree. A novel approach is presented to help estimate endogenous and exogenous inactivation rates of E. faecalis as a function of depth in the presence of OM based on common optical measurements. Implications of this knowledge in informing design parameters (e.g., depth and retention time) of NTS are discussed, thus contributing to both fundamental understanding of photoinactivation processes in surface waters and improvement of treatment unit design.
Introduction
A
Photoinduced processes include both exogenous and endogenous mechanisms, and the latter can be further classified as direct and indirect (sensitized) processes (Davies-Colley et al., 2000). In the case of direct processes, solar irradiance is absorbed by the target compound in the microbe, and causing (or contributing to) damage that leads to inactivation, as in the case of DNA damage upon ultraviolet (UV) exposure (Calkins et al., 1976). Indirect endogenous processes involve light absorption by microbial structures or chromophores that are not necessarily damaged but that act as internal photosensitizers in the formation of reactive species that lead to inactivating damage (Davies-Colley et al., 2000). Previous research (conducted in seawater samples under oxic conditions) has pointed to oxidative stress, rather than membrane or direct DNA damage, as a dominant mechanism in indirect endogenous damage under simulated sunlight (Sassoubre et al., 2012).
Light absorbance or scattering by different water constituents would generally reduce the inactivation efficiency by preventing the direct interaction between the incoming light and the target microbes, thus creating a shielding effect. Such shielding effect would become more important with increasing distance from the light source or depth (in the case of solar irradiation). This shielding effect is expected to be more prevalent in NTS than within engineered systems or water undergoing SODIS for drinking purposes since higher loadings of organic matter (OM) present in NTS will increase light absorbance. While such light absorbance is likely to have a negative effect upon direct and endogenous microbe inactivation, light absorbance by chromophoric OM can lead to the formation of reactive intermediates (RI) (Zepp et al., 1981; Cooper and Zika, 1983; Mopper and Zhou, 1990; Canonica et al., 1995), including singlet oxygen (1O2), hydroxyl radical (HO•), and excited triplet states (3OM), among others. Such RI can then come in contact with either suspended or particle-associated microbes, leading to indirect exogenous photoinactivation (Silverman et al., 2015).
Several studies have reported enhanced inactivation of bacteria (Curtis et al., 1992; Davies-Colley et al., 1999, 2000; Kadir and Nelson, 2014; Nguyen et al., 2015) and viruses (Davies-Colley et al., 1999; Kohn and Nelson, 2007; Rule Wigginton et al., 2010; Romero et al., 2011; Silverman et al., 2015) due to indirect exogenous photochemical processes, with 1O2 playing a key role in microbe inactivation (Dahl et al., 1987, 1989; Curtis et al., 1992; Kohn and Nelson, 2007; Rule Wigginton et al., 2010; Romero et al., 2011). Given that lower wavelengths typically responsible for direct inactivation (i.e., below ∼320 nm) (Davies-Colley et al., 2000) penetrate shorter depths relative to longer wavelengths, their contribution to microbe inactivation is expected to decrease with depth. In contrast, longer wavelengths, although relatively unimportant in the direct inactivation of microbes, are expected to travel to greater depths, and their relative contribution to disinfection via indirect photoinactivation is expected to increase with depth. As a result, knowledge regarding exogenous photochemical processes becomes increasingly relevant for the design of NTS.
In this work, inactivation of Enterococcus faecalis was studied under simulated sunlight. This microbe was chosen due to its importance as an indicator of fecal contamination and treatment efficacy, ease of use, and gaps of knowledge found in the literature regarding endogenous and exogenous inactivation kinetics. While both processes are known to take place, the relative contribution of each to overall inactivation in the presence of OM from various distinct and relevant sources has not been fully established for E. faecalis. This study examines the impacts of a variety of important OM types, including wastewater OM, environmental surface waters OM, and OM isolates, as well as a 1O2-specific photosensitizer (methylene blue [MB]), on the photoinactivation kinetics of E. faecalis. As such, these results are relevant in understanding inactivation kinetics in different contexts, such as natural systems, including those impacted by wastewater effluent, treatment ponds and wetlands, and reservoirs used as a source for drinking water facilities. The contribution of endogenous and exogenous inactivation for each sample is presented along with their relationship to optical and photochemical characteristics. Inactivation kinetics as a function of depth are modeled, and their implications in the design of NTS are discussed.
Materials and Methods
Sample preparation and characterization
Four natural water samples were collected to represent a range of water quality characteristics of surface waters or NTS. Two wastewater samples were collected (Boulder Wastewater Treatment Facility, Boulder, CO): primary clarification effluent (BWW-1C) and final effluent (BWW-eff). Surface water samples were collected from Boulder Creek (BC) and Greeley Reservoir (Res) (both in Colorado, USA). These samples were filtered upon arrival to the laboratory using a 0.7-μm glass fiber filter and stored at 4°C until use. OM isolate samples included Suwannee River humic acid (SRHA) and Suwannee River fulvic acid, obtained from the International Humic Substances Society (catalog numbers 2S101H and 1S101F, respectively), prepared at concentrations of 20 ppm as carbon. For the MB samples, a stock solution was diluted into phosphate-buffered saline (PBS) to concentrations of 0.3 and 1 ppm.
UV–Vis absorption was measured from 200 to 600 nm in 1-nm increments in a 1-cm pathlength quartz cuvette (Cary 100; Agilent Technologies, Santa Clara, CA), and dissolved organic carbon (DOC) measurements were conducted using a TOC-VCSH analyzer (Shimadzu Corp., Kyoto, Japan). Measurements were conducted for all samples before adding microbes or exposing them to the solar simulator. For the purposes of this analysis, PBS was assumed to be a nonabsorbing solution due to the relatively low absorbance in the 290–600 nm range. Furfuryl alcohol (FFA) was used as a probe to measure 1O2 concentrations in the samples under simulated solar irradiation, as previously described (Dong and Rosario-Ortiz, 2012; Mostafa and Rosario-Ortiz, 2013). Briefly, FFA was added to the samples at an initial concentration of 22.5 μM along with methanol (0.1 M) to quench HO•, which may be formed during light exposure. Methanol addition may, however, lead to a small overestimation of the singlet oxygen concentrations found during the inactivation experiments since reaction with HO• would slightly decrease [1O2]SS. FFA degradation was monitored in 30-min increments by extracting 1-mL aliquots in duplicate and using liquid chromatography (1200 LC; Agilent Technologies) to measure concentration. Analysis of the decrease in FFA concentration over time along with knowledge of the second-order reaction rate constant between 1O2 and FFA (1.2 × 10⁸ M−1 s−1) allows for the calculation of singlet oxygen steady-state concentration ([1O2]SS) (Haag et al., 1984a; Haag and Hoigne, 1986).
E. faecalis inactivation
Bacteria were grown overnight from a frozen culture in trypticase soy broth at 37°C to a concentration of ∼108 CFU/mL. To remove the growth media, this broth was centrifuged (Eppendorf Centrifuge 5424) at 12,000 RPM (∼13,500 g) for 2 min and then resuspended in PBS after removing the supernatant. This procedure was repeated three times, and 1 mL of the washed solution containing E. faecalis was added to 99 mL of each of the water matrices studied (including PBS), resulting in a concentration of ∼106 CFU/mL at the beginning of the exposure experiments.
Samples were placed in a 100-mL stirred beaker under a solar simulator Oriel Sol1A (Oriel Instruments, Stratford, CT) equipped with a 1,000-W Xe lamp and a 1.5 air mass filter. The solar simulator irradiance spectrum was measured using an Ocean Optics spectrometer. Temperature was controlled for the duration of the experiment at 20°C ± 3°C by placing the beaker within a custom-designed water bath with recirculating water from a cooling device. Total exposure times were 3–4 h as necessary to achieve inactivation levels greater than 3 log10 for all samples. Samples taken every 30 min (1-mL aliquots) were diluted and plated using a spread plate method. E. faecalis procedures were conducted according to USEPA-approved Standard Methods #9230 (APHA et al., 2005), with incubation at 34°C for 24 h immediately following plating on trypticase soy agar. The accuracy of plate counts was warranted by duplicate plating for each time step sample as well as the plating of numerous dilutions for each sample. Experiments for each sample were repeated at least two times, and results shown represent the average of those runs.
Inactivation data analysis
Experiments conducted in PBS represent sensitizer-free conditions; thus, the inactivation rate observed is considered to involve direct and/or indirect endogenous (hereafter “endogenous”) processes alone. It is assumed that endogenous inactivation in PBS remains constant regardless of depth, which would be the case for a completely nonabsorbing solution. In the presence of light-absorbing matter, average irradiation will decrease with depth as established by Morowitz (1950) based on the Beer–Lambert law. While the original calculation deals with a single wavelength, the screening factor (SF) used here is calculated as the fraction of the incoming light in the wavelength range most relevant for solar simulator experiments, that is, 290–600 nm, that is present through the water column and is calculated as such
where I0 and IL are the incoming radiation and the average radiation in a cell of depth L, respectively, α is the decadic absorption coefficient, and
In addition, an action spectrum is used to account for the fact that photoinactivation efficiency varies with wavelength. Considering both the decrease in the average irradiance for different wavelengths and the action spectrum for E. faecalis, a weighted screening factor (WSF) representing the fraction of endogenous inactivation expected to take place within a well-mixed sample of a given depth compared to that at the surface or within a clear medium is calculated as follows:
where P = 60 × e(−0.02 × λ) + 0.0025 (Kadir, 2010) is the wavelength-dependent sensitivity coefficient (photoaction spectrum) for E. faecalis in deionized water. While the accuracies of the P values were not independently confirmed in this study, they were used here since they represent the most reliable estimates currently found in the literature and they reflect the established notion that microbial inactivation generally decreases with increasing wavelength.
In addition, as RI formation decreases with depth (due to light screening), exogenous processes are expected to decrease to the same degree. The wavelength dependence of exogenous inactivation is more difficult to account for because 1O2 quantum yields appear to be only weakly dependent on wavelength (or at least difficult to generalize across diverse OM types) (Haag et al., 1984b; Zepp et al., 1985; Paul et al., 2004; Sharpless, 2012; Marchisio et al., 2015) and because other species may also play a role in inactivation. Therefore, it is assumed that all wavelengths (290–600 nm) contribute equally to exogenous inactivation. Following this assumption, the rate of exogenous inactivation decreases to the same extent as the average light irradiance (described by SF) due to screening of photosensitizing irradiance with depth.
Results and Discussion
Sample characteristics
Absorbance spectra for all OM samples and the irradiance spectrum from the solar simulator are shown in Fig. 1. The absorbance spectra display typical shapes for this type of sample, that is, relatively featureless curves with monotonically decreasing absorbance with increasing wavelength. OM isolates display significantly higher absorbance, while the wastewater and surface water samples fall within a narrower range, with the reservoir samples being the lowest. PBS and MB spectra are omitted from this figure due to their absorbance being very low compared to the range displayed here.
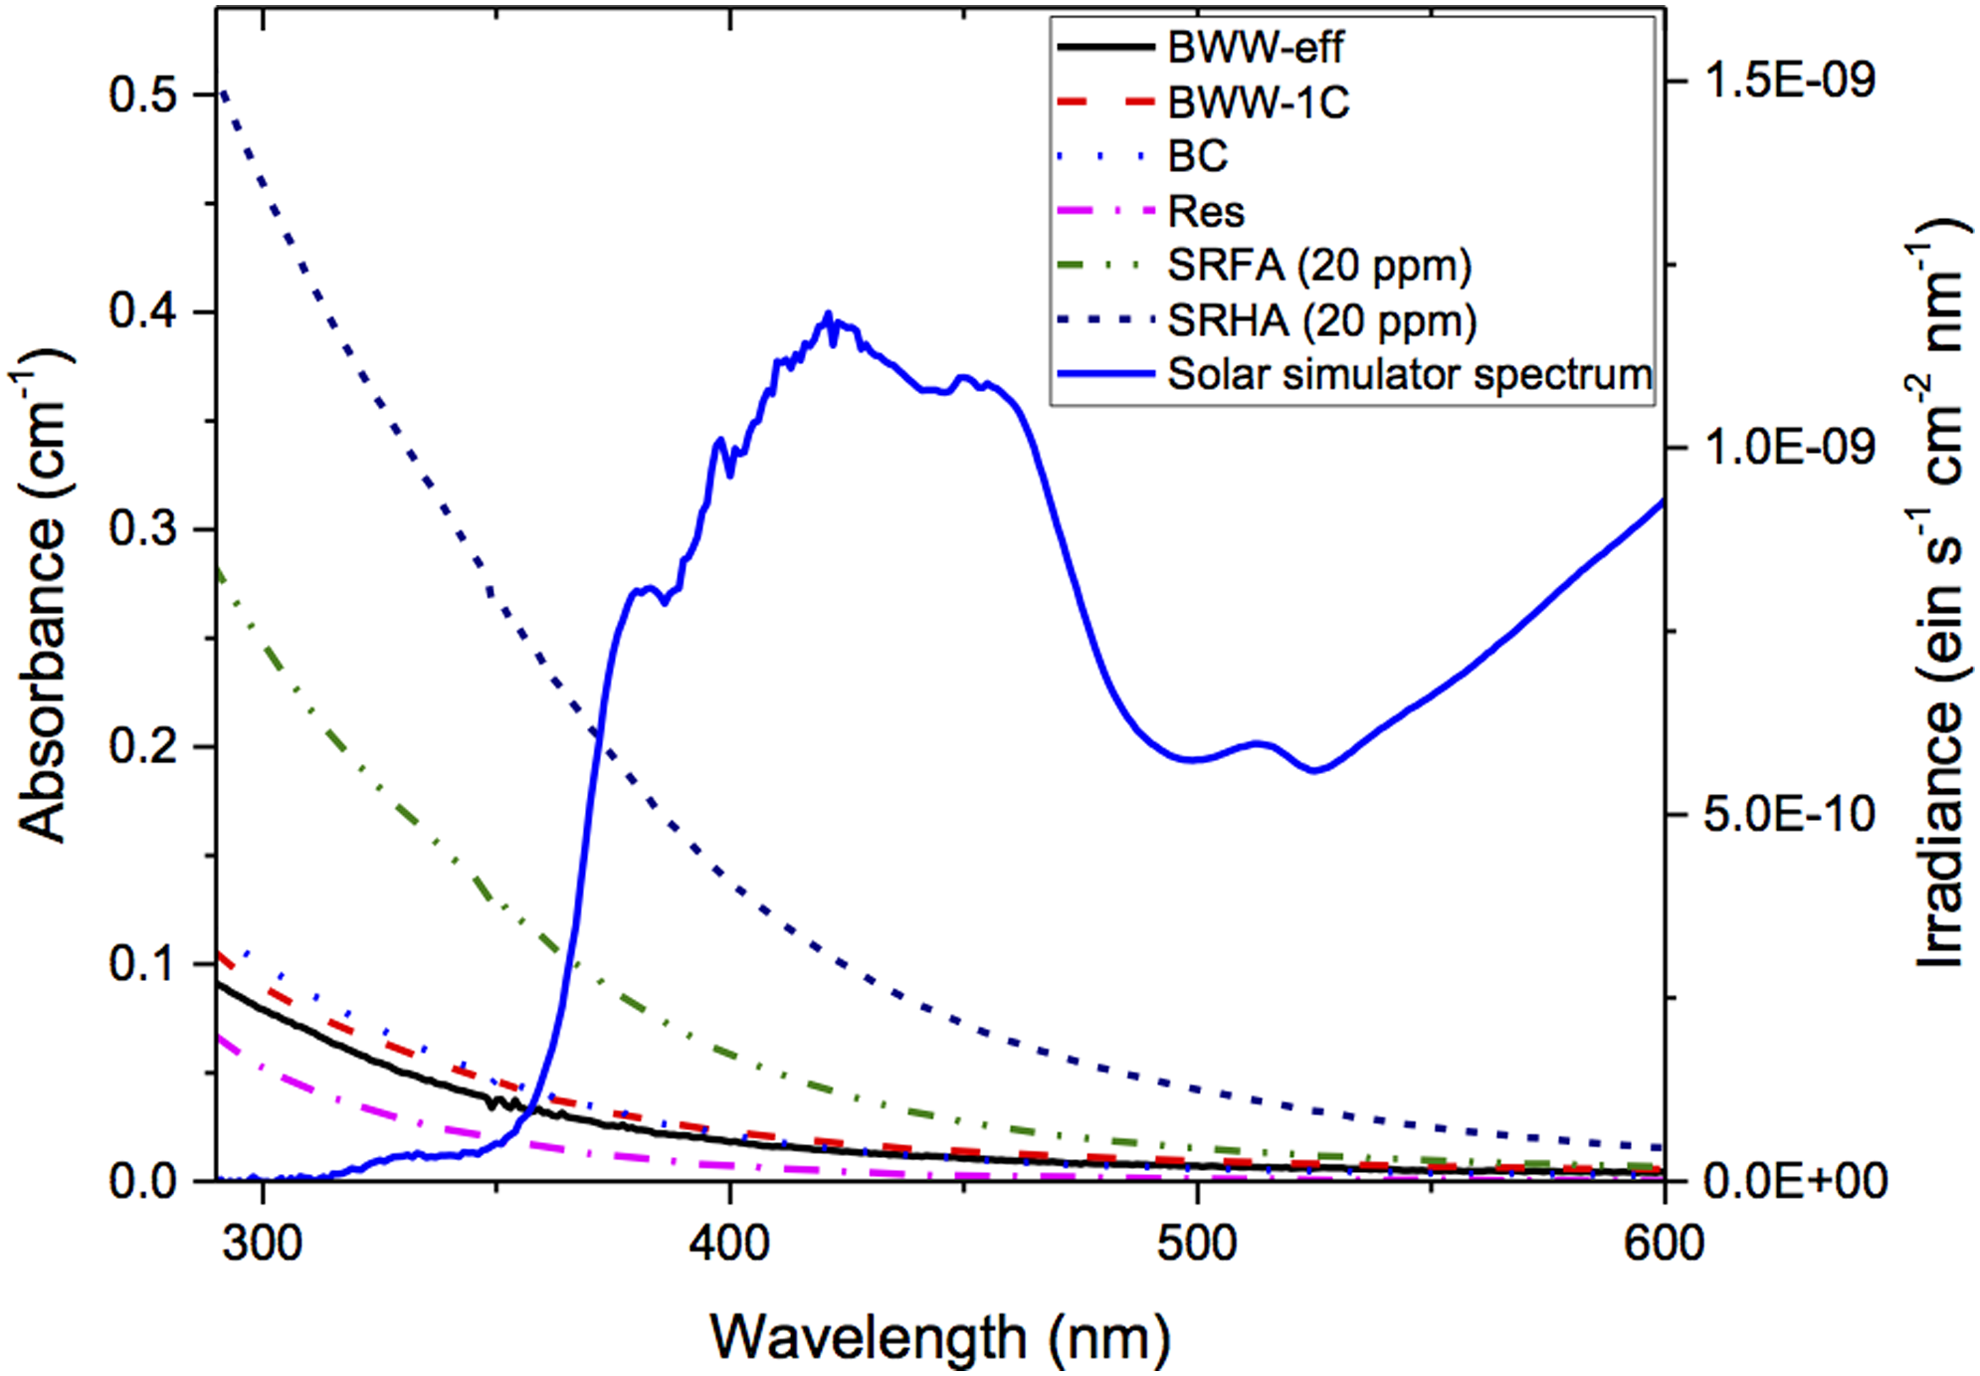
Absorbance spectrum of organic matter samples studied and solar simulator irradiance spectrum (model Sol1A, Oriel Instruments with 1,000-W Xe lamp and 1.5 air mass filter).
The DOC concentrations for all samples are shown in Table 1. As expected, PBS and the MB samples have very low concentrations (0–0.1 mgC/L), while the rest of the samples fall within a range of 4.7–8.6 mgC/L. Table 1 also shows the [1O2]SS values generated for all samples with a range of 0.88–4.77 × 10⁻¹³ M (excluding PBS). It should be noted that the MB samples are particularly susceptible to photobleaching, causing the concentration of 1O2 to decrease with time. Thus, the concentration shown here corresponds to the average 1O2 concentration over the course of the experiment.
Error limits correspond to the 95% confidence interval from linear regressions to Equation (3).
Assumed due to negligible light absorbance over wavelengths of 290–600 nm.
DOC, dissolved organic carbon; n.a., not applicable; WSF, weighted screening factor.
The WSF represents the fraction of endogenous inactivation expected to be present within a well-mixed sample of a given depth (compared to that at the surface), and the values calculated for specific experimental conditions are presented in Table 1. In water matrices where absorbance is very low (i.e., PBS and MB), endogenous inactivation is not expected to decrease significantly, thus having a WSF of 1. Other values range from 0.59 (for SRHA) to 0.96 (for the reservoir sample).
E. faecalis inactivation rates
The results of the inactivation experiments in each water sample are presented in Fig. 2 as the log10 inactivation of E. faecalis as a function of irradiation time under simulated sunlight. The figure also shows these results as a function of dose or fluence (in MJ/m2), accounting for all wavelengths from 290 to 600 nm (unweighted) based on the irradiance of the solar simulator. All samples studied exhibit a lag before any inactivation is observed. To account for this behavior, the data were fitted using the equation (Wegelin et al., 1994)
where N0 and N represent, respectively, the concentration of culturable bacteria in CFU/mL at the beginning of the experiment and at time t, k represents the first-order inactivation rate, and m is a fitting parameter (further discussed below). The k values calculated from these fits are reported in Table 1, and the error reported represents the 95% confidence interval for these fitted k values. The lag time for each sample, also shown in Table 1, is calculated as follows (Wegelin et al., 1994):
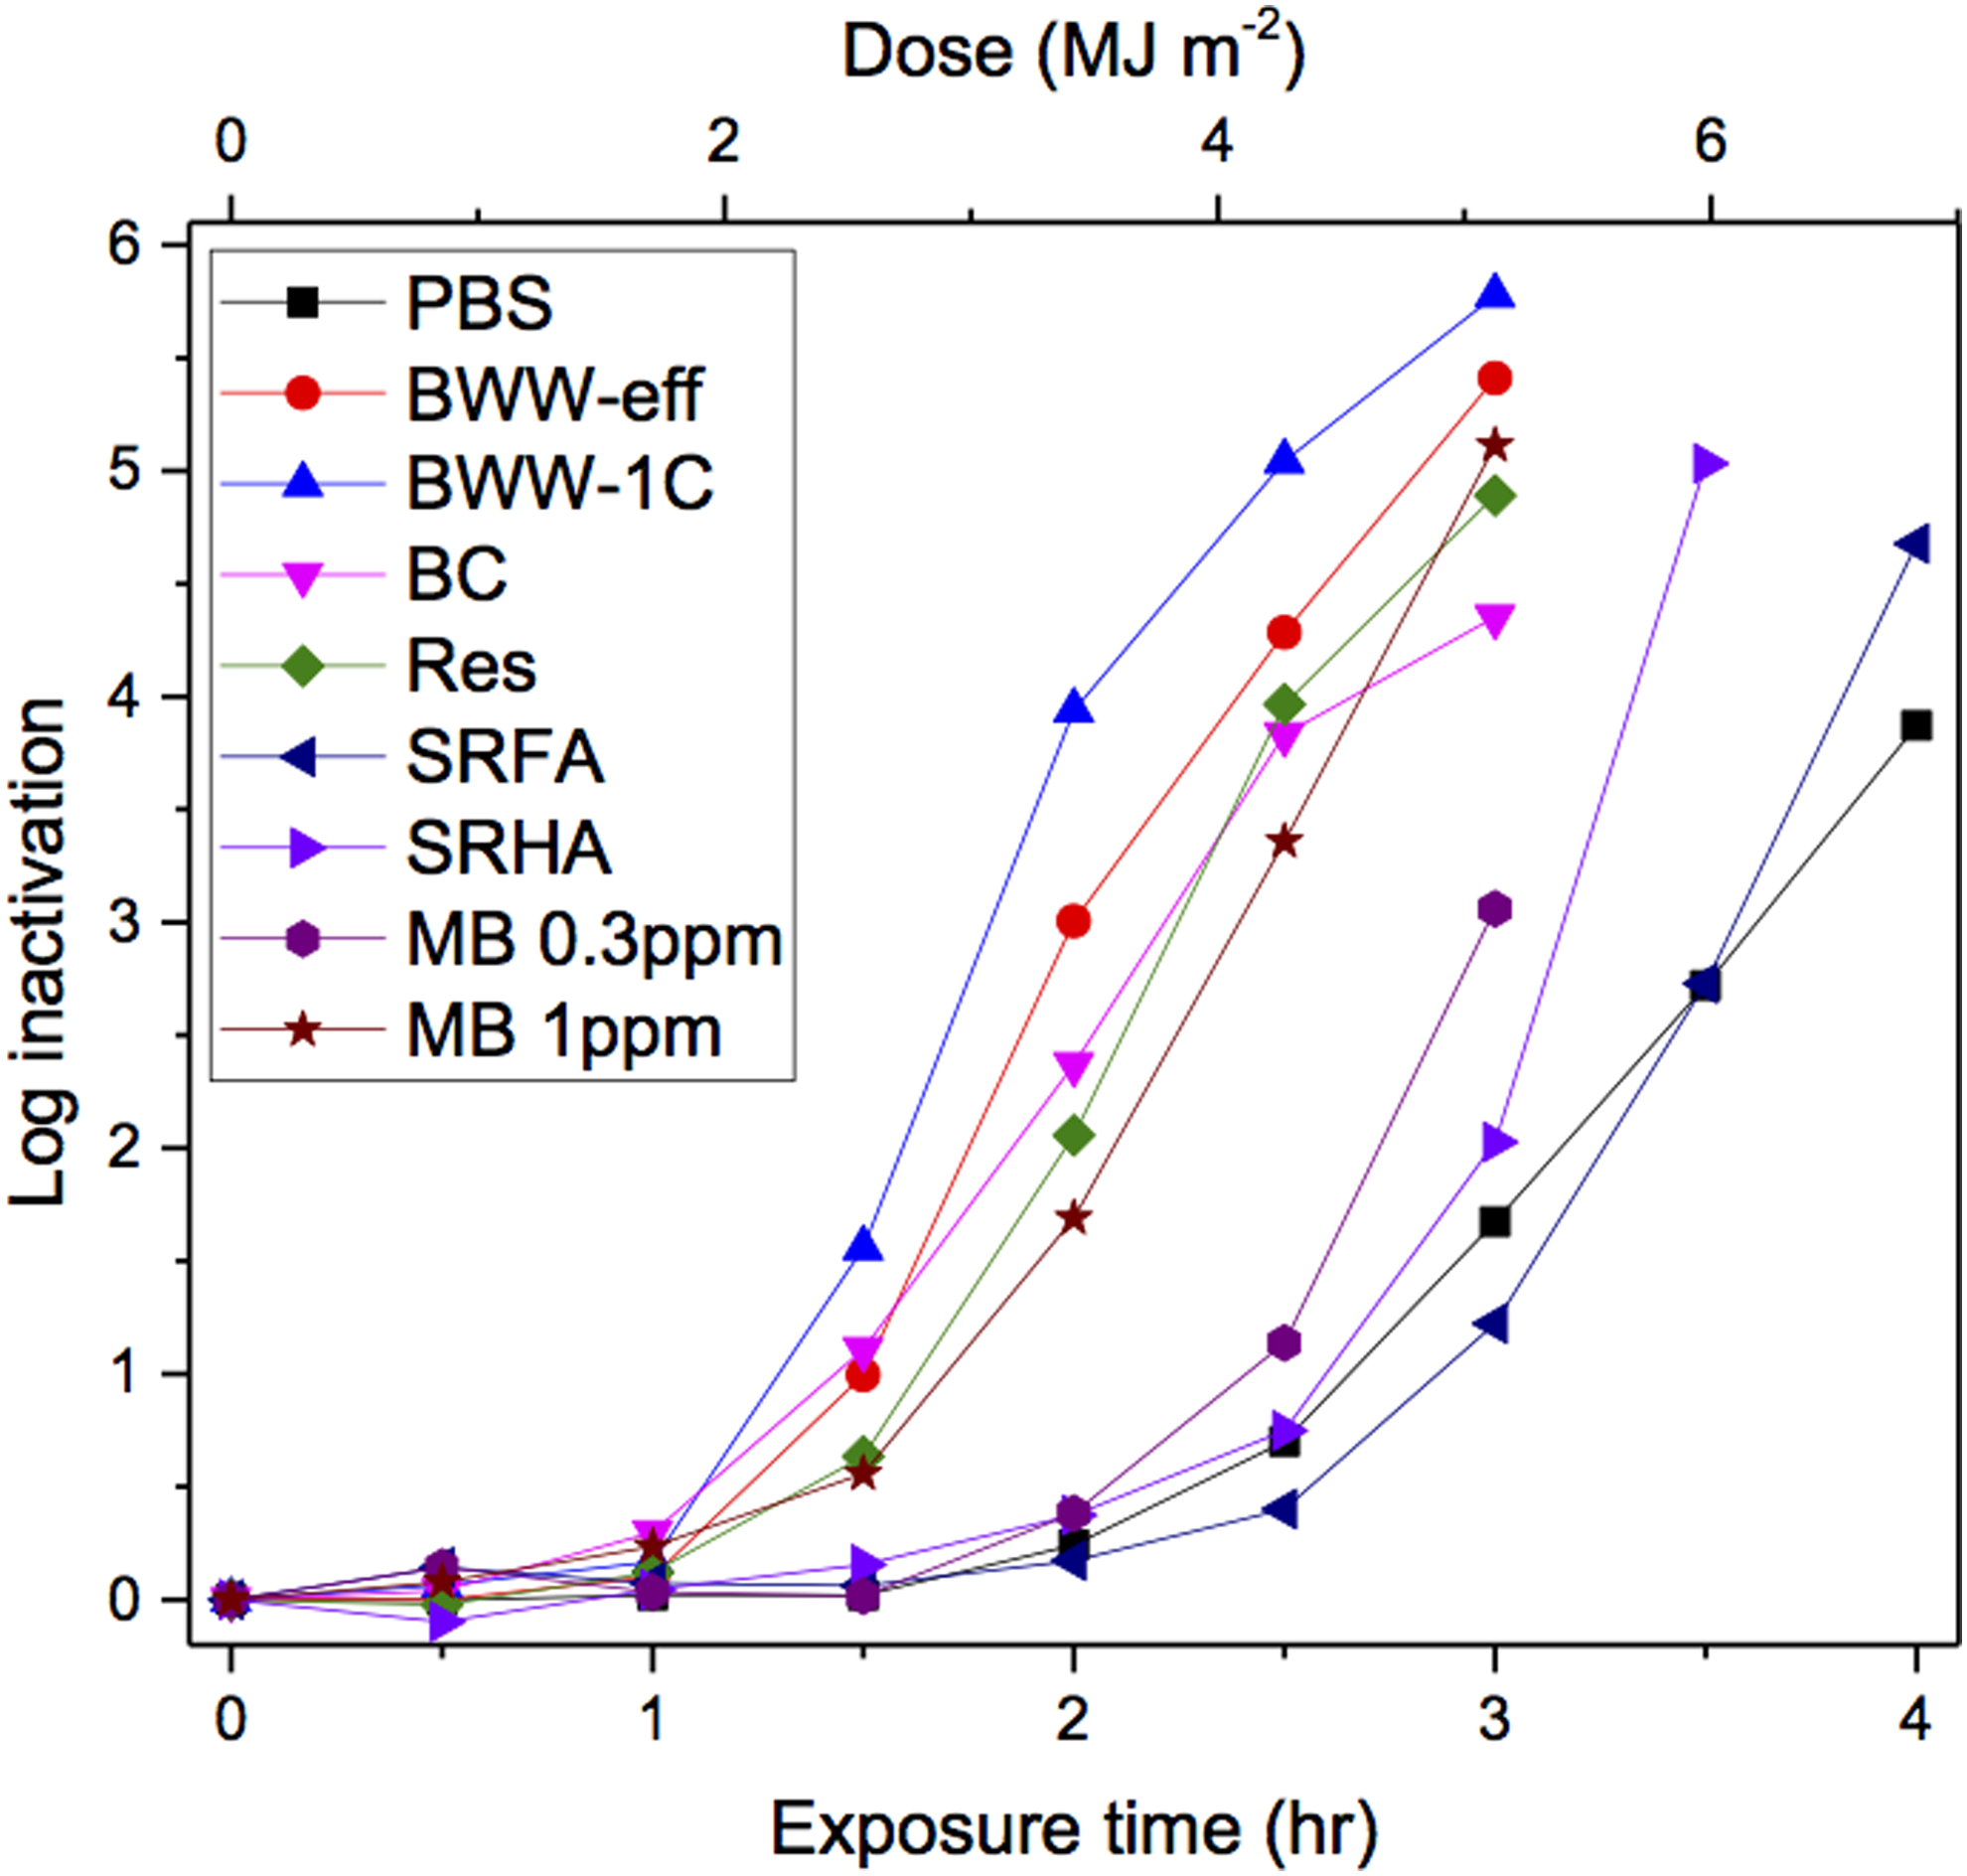
Enterococcus faecalis log10 inactivation as a function of simulated solar irradiation time and unweighted dose (fluence) calculated over wavelengths 290–600 nm.
Inactivation rate observed for the experiments conducted in PBS is assumed to be representative of endogenous processes, that is, not involving exogenous photosensitizers. The inactivation rate constant measured in these experiments (4.81 h−1) was higher than that reported for E. faecalis in PBS (2.15 h−1) (Kadir and Nelson, 2014). This difference is likely due in part to their use of an atmospheric attenuation filter, which blocks the shorter wavelengths in the solar simulator irradiance spectrum to a greater degree than the air mass filter alone used here.
Because the distinction between direct and indirect endogenous processes is not possible from the data obtained here and the environmental implications of such knowledge are limited (i.e., conditions affecting these processes can be difficult to assess or modify in NTS), the subsequent discussion is focused on the distinction between the endogenous (direct and/or indirect endogenous) processes on the one hand and exogenous processes on the other hand.
Under these experimental conditions, the presence of OM yields higher inactivation rates than PBS. In the presence of OM, the inactivation rates are 17–67% higher and the lag times up to 54% lower than those observed in PBS (Table 1). These results can be explained by the fact that OM serves as an exogenous photosensitizer in the formation of RI. Although OM can hinder endogenous processes by shielding microbes from irradiation, particularly in the short-wavelength range most critical for inactivation (Davies-Colley et al., 2000), the role of OM as a photosensitizer increases inactivation to a greater degree than it hinders it. This difference in inactivation rates would be even more pronounced if inactivation rates were calculated as a function of how many photons reach the microbes (i.e., applying the SF), which strengthens the notion that other processes are playing a role in inactivation, namely photosensitized exogenous processes. Interestingly, inactivation in samples containing OM isolates was enhanced to a lesser degree compared to the wastewater and surface water samples or MB. This behavior may be due to relatively high absorbance by OM isolates (lower WSF) compared to their RI formation rates (e.g., [1O2]SS in Table 1) as further discussed below.
While investigating the mechanisms resulting in the lag was outside the study scope, it may be indicative of one or more phenomena having an effect, including repair mechanisms, various inactivation pathways taking place simultaneously, or a multitarget inactivation behavior, where more than one “hit” may be needed to inactivate a microbe (Wegelin et al., 1994; Karschau et al., 2011). All these explanations would be consistent with the observed behavior, that is, a decrease in lag time in the presence of OM, as the presence of RI would introduce new inactivation pathways and/or hit more targets compared to PBS alone.
Relative contribution of exogenous inactivation
Knowing the overall inactivation rates [k, from Eq. (3)] and calculating the contribution of endogenous processes under our experimental conditions (kend), the balance of the inactivation can be assumed to be the result of exogenous processes (kexo), calculated as such
Results of this analysis are shown in Fig. 3, which presents the overall inactivation rate of each sample as well as the contribution of both endogenous and exogenous mechanisms, with the assumption that inactivation taking place in PBS (kPBS) is due to endogenous processes alone. All the other samples display a decrease in the endogenous contribution compared to PBS due to light screening. At the same time, the contribution of exogenous processes is shown to be greater than the corresponding decrease in endogenous activity for each sample, thus leading to overall inactivation rates that are higher than those in non-RI producing samples.
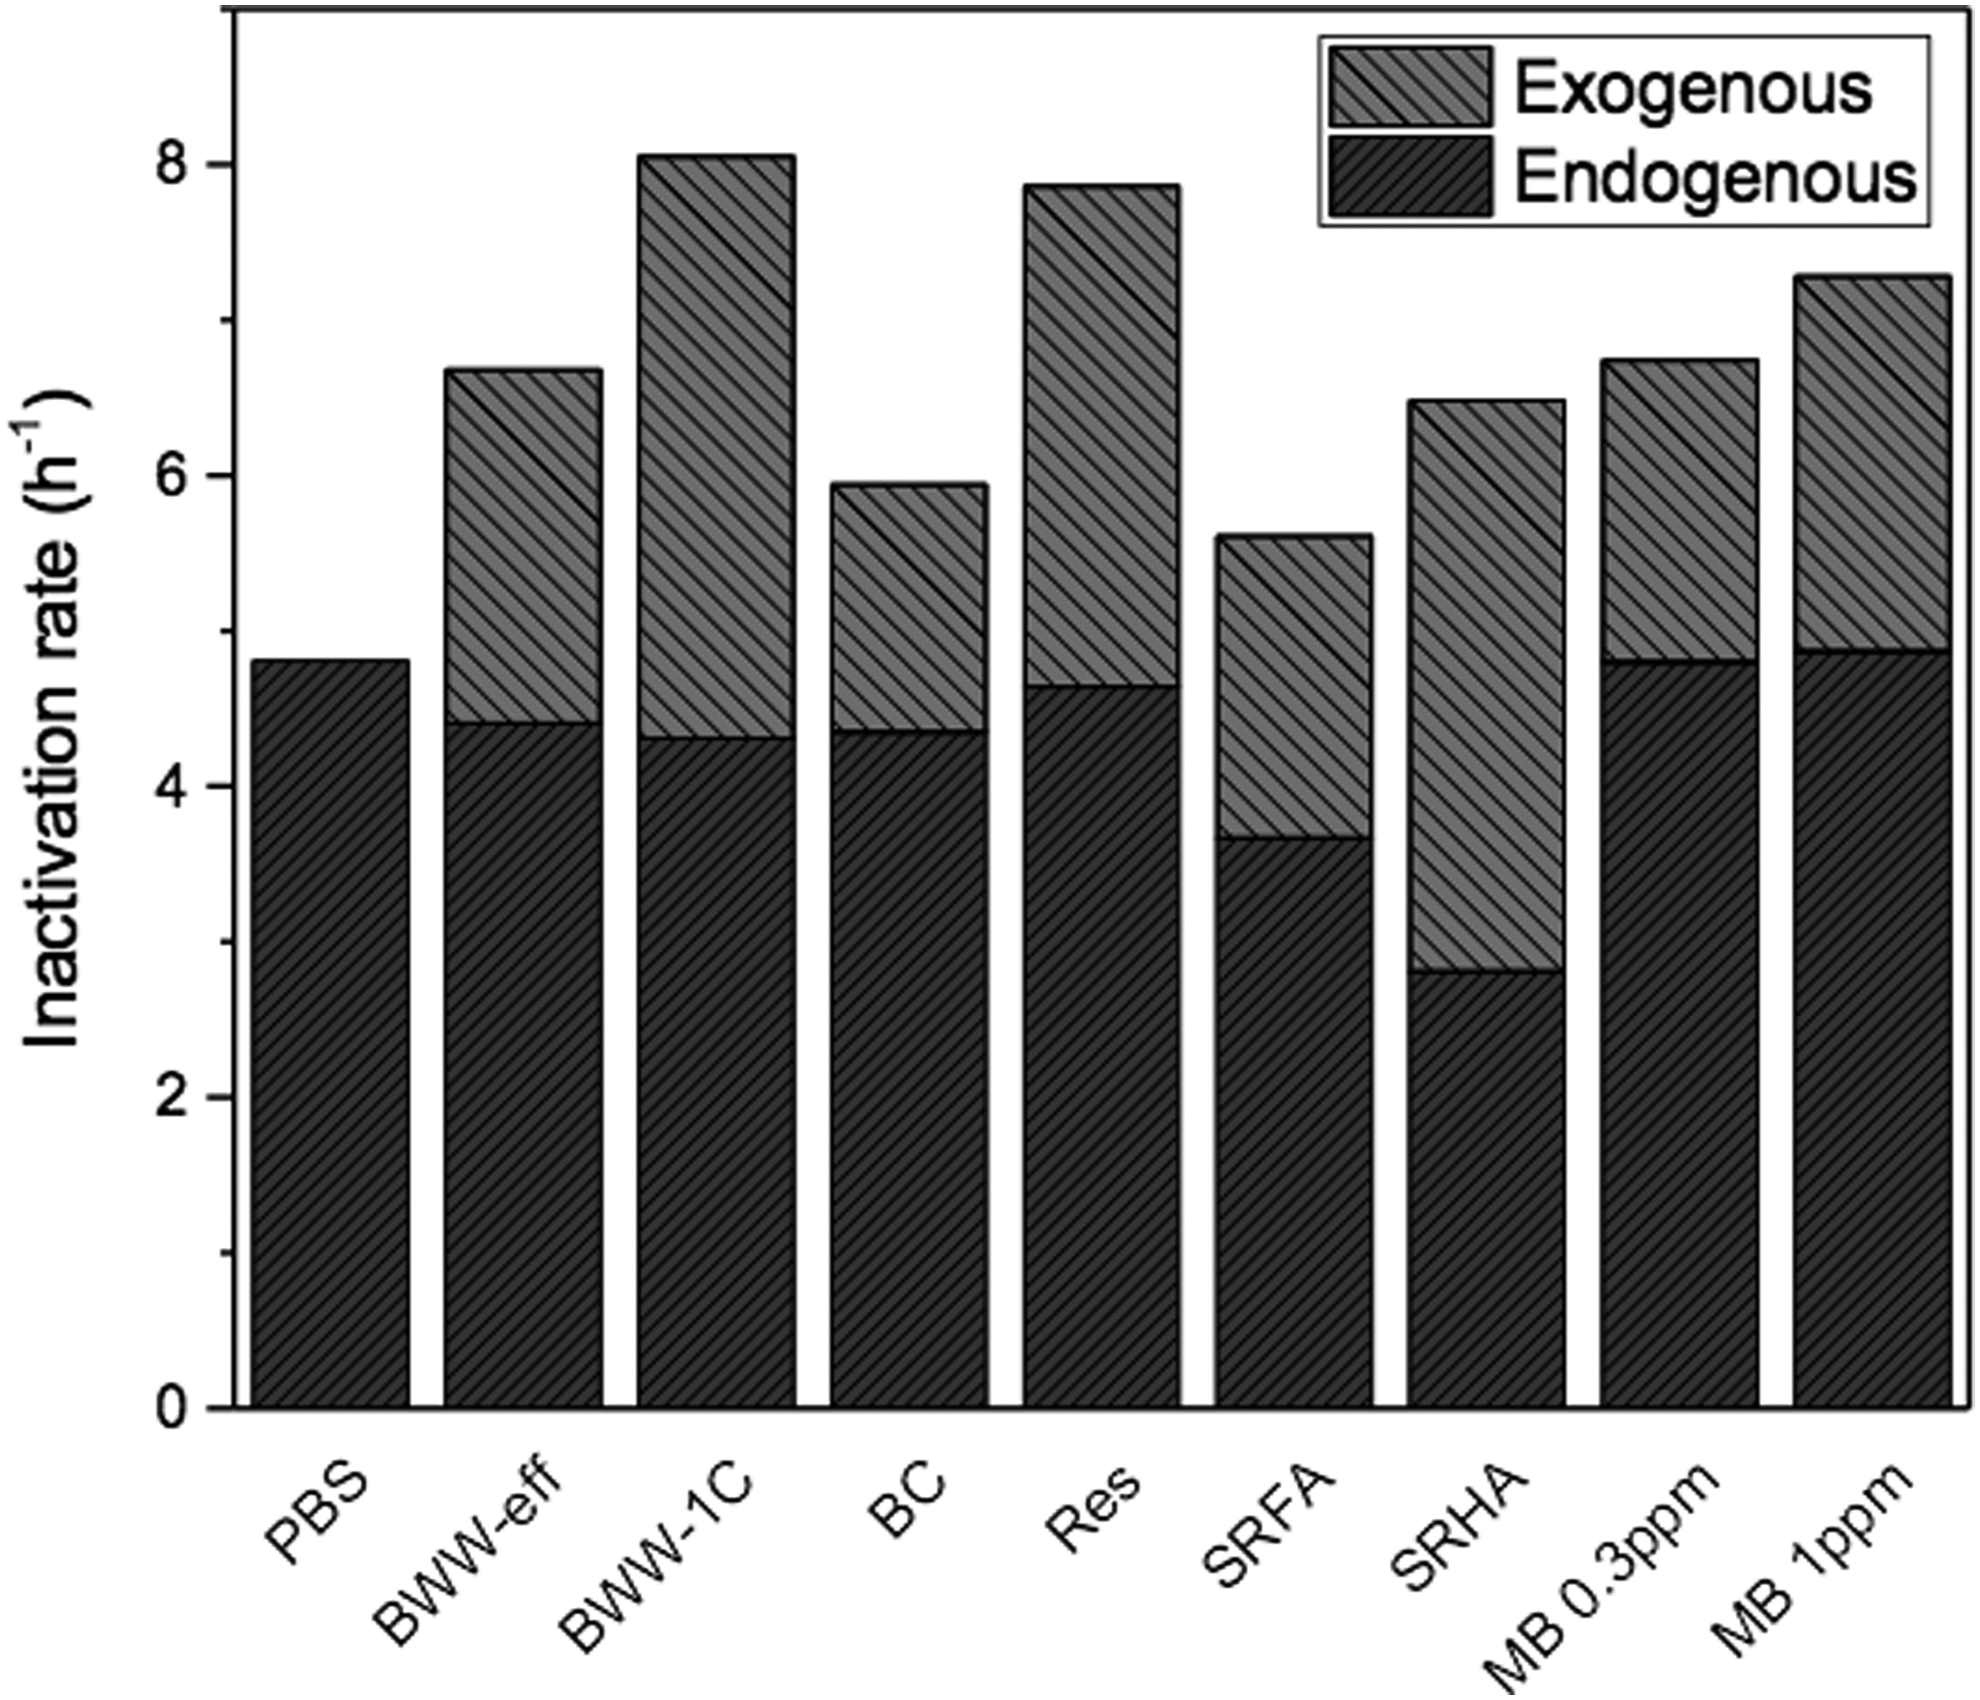
Inactivation in phosphate-buffered saline (PBS) is assumed to represent endogenous processes alone, which decrease for all the other samples shown due to light screening.
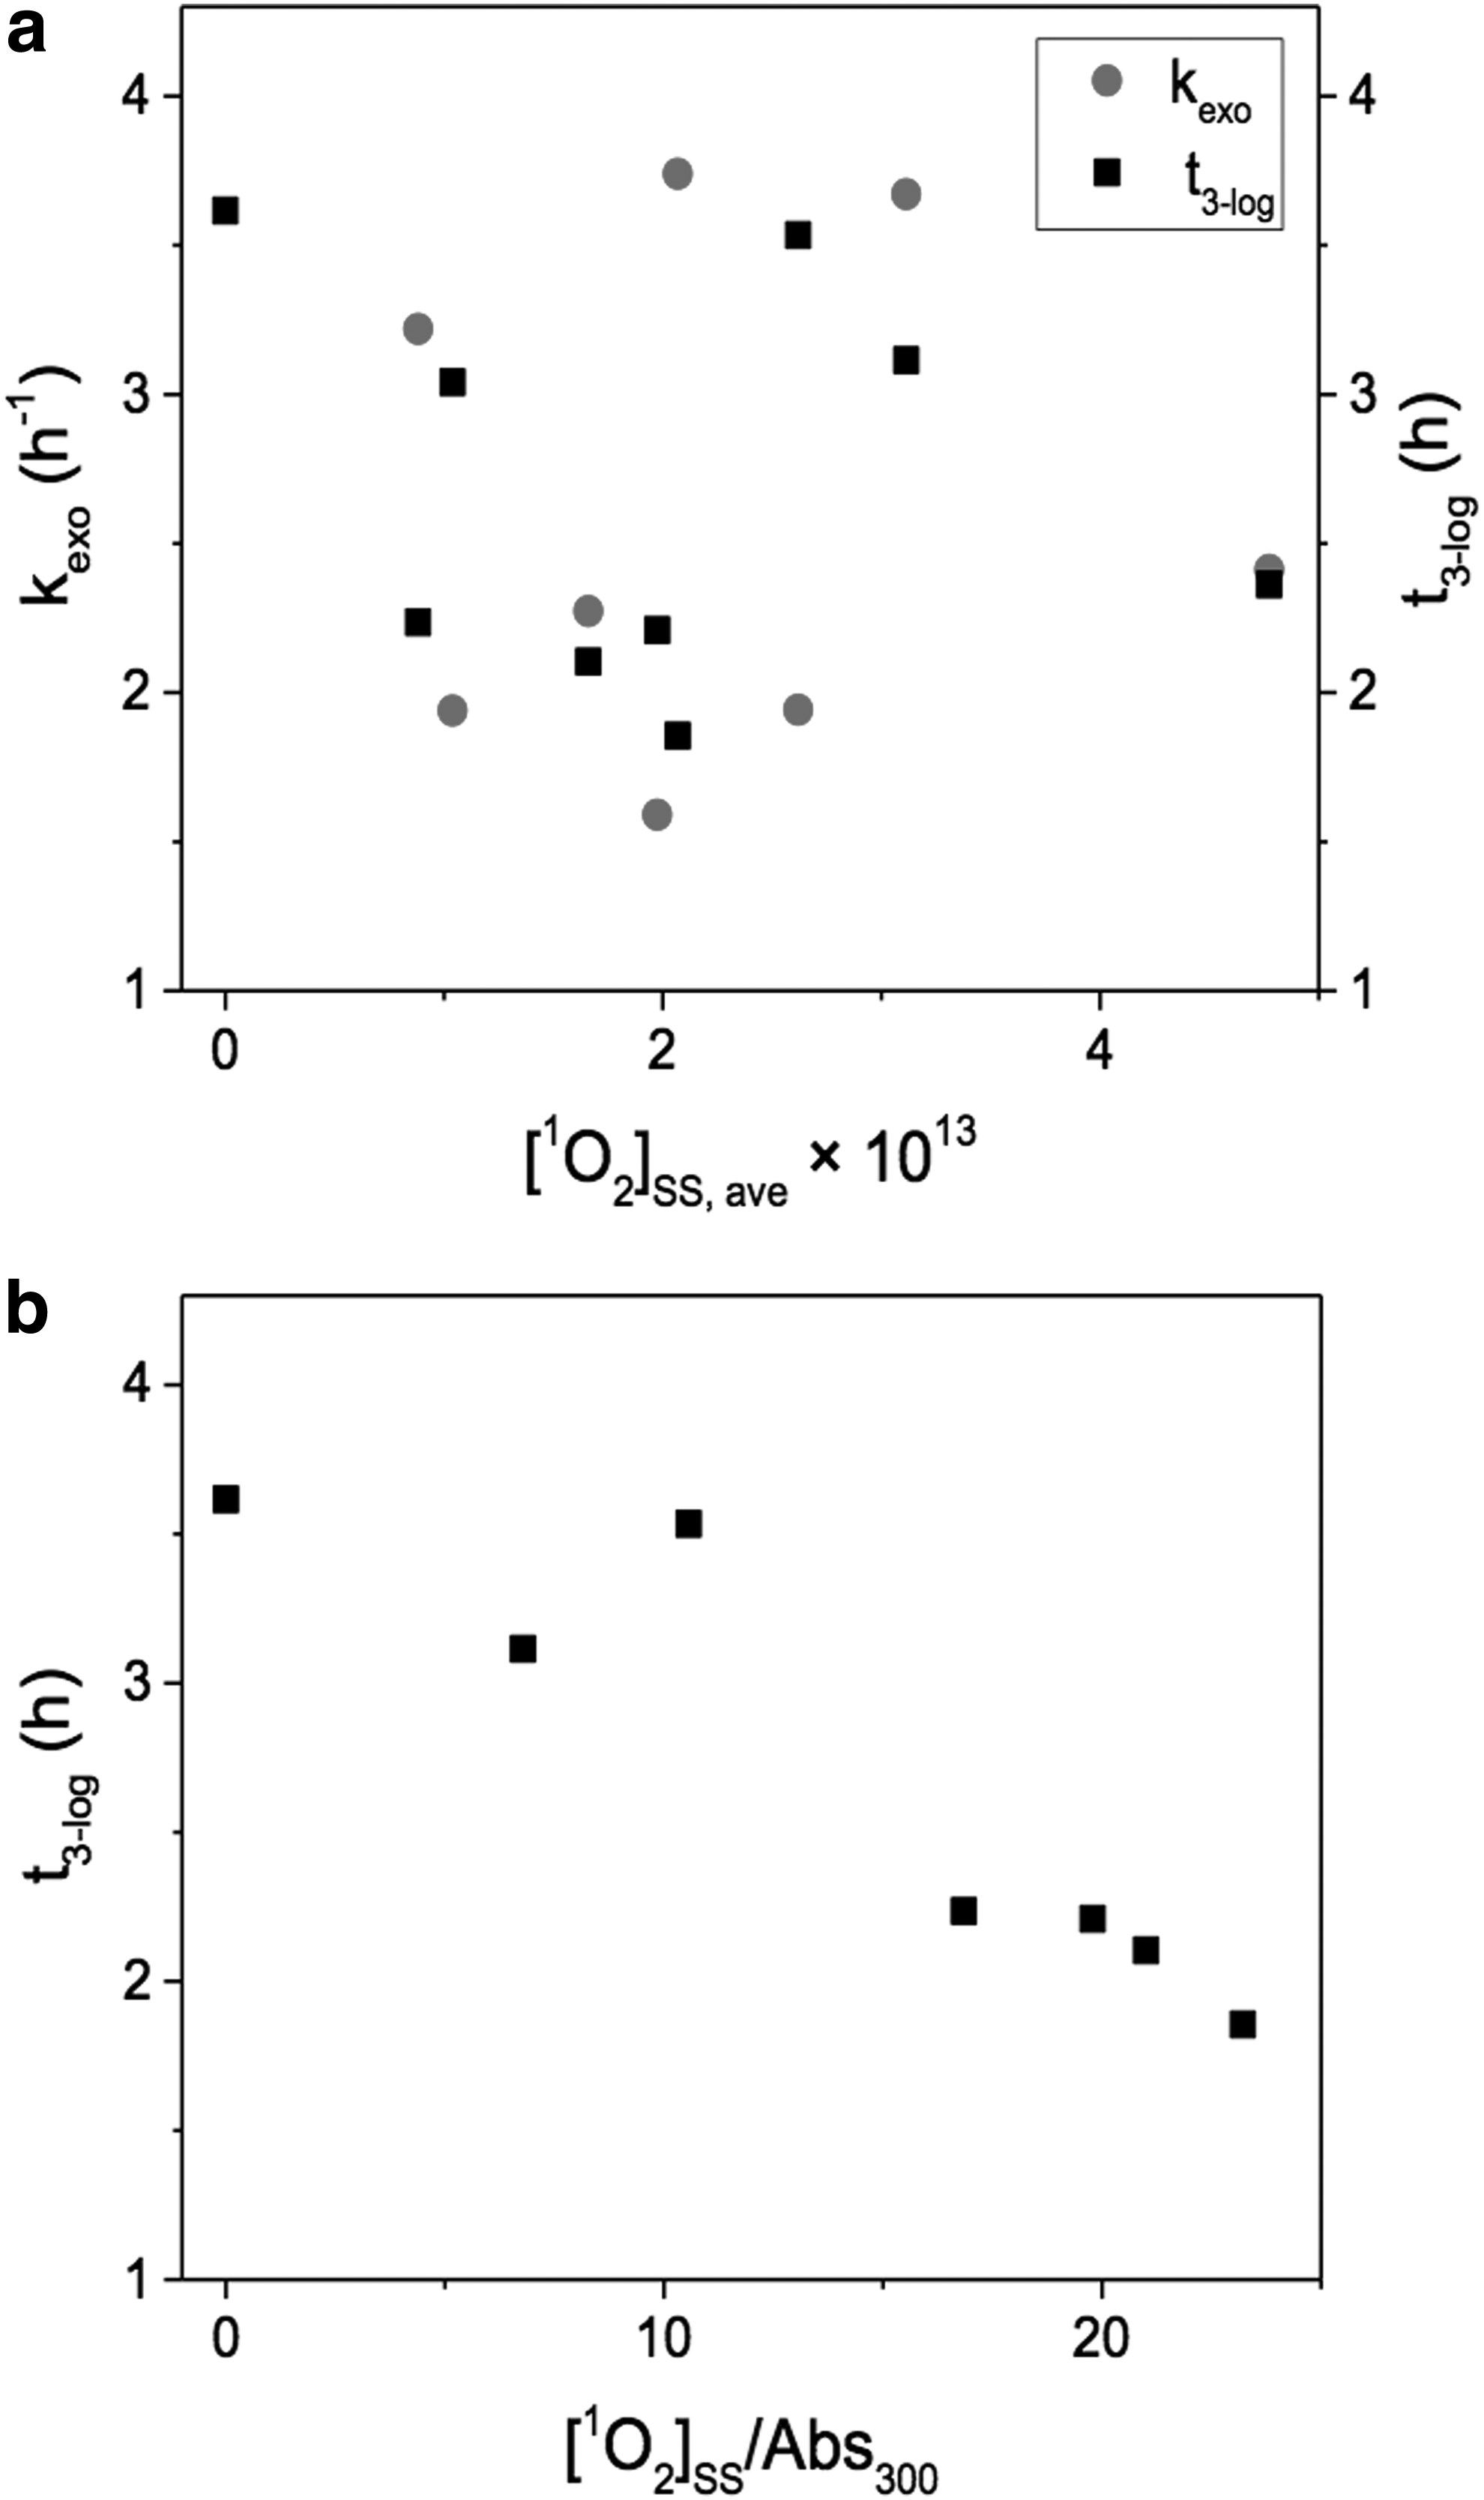
Interestingly, neither the rate of exogenous inactivation nor the time required to reach 3-log10 inactivation (t3-log) seems to correlate with [1O2]SS, as shown in Fig 4a. This is somewhat surprising since previous reports had pointed to this molecule as being very important in the inactivation of microbes (Dahl et al., 1987, 1989; Curtis et al., 1992; Kohn and Nelson, 2007; Rule Wigginton et al., 2010; Romero et al., 2011), and an increase in inactivation rates is observed in the presence of MB (an efficient 1O2 sensitizer), as shown in Table 1 and Fig. 2. Thus, while these results do not rule out the role of 1O2 as an important species in microbial inactivation, they do indicate that [1O2]SS alone may be a poor predictor of inactivation kinetics. Reasons for such lack of correlation may point to the complexity of exogenous inactivation processes for E. faecalis. For example, previous reports have shown that increased particle association between OM and viruses increased inactivation rates (Kohn et al., 2007). Membrane permeability could also play a role, where smaller sensitizers (that could potentially further penetrate the target microbe membrane) would enhance inactivation. Both these phenomena, particle association and membrane permeability, are also affected by surface charges, which further complicate the interactions between RI and the target microorganisms. Different degrees of quenching/scavenging of RI by different types of OM will also impact the concentration of 1O2 that the microbes are actually exposed to, and such variability would not be fully captured by the 1O2 probe used here (i.e., FFA) (Latch and McNeill, 2006).
In addition, other RI, for example, HO• and OM excited triplet states, could potentially play a role (Romero-Maraccini et al., 2013); however, their behavior would be similarly affected by the complexities mentioned above. The role of HO• was specifically assessed here by measuring inactivation in the presence of environmentally relevant concentrations (1 mM) of NO3− (a selective HO• sensitizer), and no difference was observed compared to inactivation rates in PBS (data not shown). Under these conditions, HO• concentrations would be on the order of 10−14 M (Brezonik and Fulkerson-Brekken, 1998), which is one to two orders of magnitude higher than it would be in the environment due to the presence of scavengers, such as OM (Zepp et al., 1987; Dong and Rosario-Ortiz, 2012). Therefore, while HO• may act as an intermediate in the formation of other RI, it is unlikely to play a significant role in directly inactivating E. faecalis under environmentally relevant conditions, at least compared to other known processes. Finally, synergistic effects between the various processes (i.e., endogenous and exogenous) could also play a role (Sinton et al., 2002) but are yet to be fully elucidated. As a result of these complexities, attempts to estimate inactivation rates using second-order reaction rate constants between 1O2 and E. faecalis or 1O2 CT values (assuming Chick's law behavior) are likely to yield erroneous estimations.
In contrast, further examination of the data provides a better understanding of the role of OM as both an RI source and direct irradiation shield for microbes. As such, a negative correlation exists (p < 0.05) between the t3-log values and the ratio of [1O2]SS/ABS300, as shown in Fig 4b. This ratio captures two of the major factors affecting inactivation: the bulk steady-state 1O2 concentration and the absorbance at 300 nm, which is indicative of the decrease in UV penetration in the water column (similar to what other authors interpreted with absorbance at 340 nm) (Davies-Colley et al., 1999; Craggs et al., 2004). The leftmost point on the graph represents PBS and is included here to reflect the behavior of a sample with very low absorbance and [1O2]SS and being representative of a system dominated by endogenous processes. OM isolates presented lower ratios and longer t3-log values compared to the surface and wastewater samples studied. Since increasing RI will tend to enhance inactivation while light screening would generally decrease it, it makes sense that the irradiation time required for inactivation would decrease (due to higher inactivation rates) as this ratio increases.
One interesting observation derived from this analysis is that the most environmentally relevant samples (i.e., surface and wastewaters) display a relatively narrow range of inactivation rates and t3-log values. Samples derived from surface and wastewaters all require solar exposure doses of 3–4 MJ/m2 to reach 3-log inactivation under the conditions tested. While this observation needs to be tested in full-scale systems, it indicates that the hydraulic retention times (HRT) necessary to reach the desired treatment level in NTS will not change dramatically as a function of influent water characteristics. As such, it provides some confidence that models for predicting sunlight-induced inactivation rates developed from experiments using a specific type of OM (Davies-Colley et al., 2000; Craggs et al., 2004; Nguyen et al., 2015; Silverman et al., 2015) can probably be expanded to other systems receiving waters of distinct origin as long as certain relevant water parameters, for example, optical properties and dissolved oxygen, are known and accounted for in those models.
Inactivation as a function of depth
Both the light absorption spectrum of OM and the action spectrum of E. faecalis show an increase with decreasing wavelength, which results in the most effective inactivating wavelengths being preferentially blocked. As a result, the WSF decreases more sharply as a function of depth than the overall SF. As described in the “Materials and Methods” section, endogenous processes are assumed to decrease with depth as described by the WSF, while the exogenous processes are expected to decrease as defined by the SF. The fitting value m [as calculated in Eq. (3)] is assumed to remain constant irrespective of depth for a given sample. This is justified on the basis that m is a factor used to fit the inactivation curves (Fig. 2) based on a multitarget model (Wegelin et al., 1994), and the factors it describes (e.g., number of targets) are not expected to vary with depth. Following these assumptions and based on the dose–response kinetics of endogenous and exogenous inactivation processes (kend and kexo), rates at different depths can be estimated.
Figure 5 illustrates the decrease in the overall inactivation rates as a function of depth, as well as the relative contributions of endogenous and exogenous processes. The data in this figure model the behavior of two samples, displaying the lowest (BC) and highest (BWW-1C) inactivation rates among the natural water samples studied here. For both samples, rates decrease to half of that at the surface, at a depth of 40–50 cm. As expected, the endogenous processes decrease more sharply with depth, leading to an increase in the relative contribution of exogenous processes, even as the overall rate decreases. In the case of BWW-1C, exogenous processes would be responsible for 46–55% of the total inactivation but only account for 26–35% of inactivation in the BC sample within 1 m of the water surface.

Calculated overall inactivation rate and relative contribution of endogenous and exogenous processes as a function of depth for BC and primary clarifier effluent (BWW-1C) samples. Contribution of exogenous processes to overall inactivation plotted on secondary axis. BC, Boulder Creek.
Concluding Remarks
Inactivation of E. faecalis was measured in sensitizer-free experiments (PBS) as well as in the presence of various types of OM under simulated sunlight, providing an estimation of inactivation kinetics as well as an approach for estimating the contribution of different mechanisms, that is, endogenous and exogenous. The sensitizer-free experiments displayed the lowest inactivation rates, pointing to the importance of the photochemical formation of RI in the presence of various types of OM as enhancing inactivation. While a portion of the light is absorbed by the OM in the samples (and thus prevented from reaching the microbes), the net effect is an increase in inactivation due to enhanced exogenous processes. Since the lower wavelengths are preferentially absorbed by OM and they are also the most effective in the endogenous inactivation, the relative contribution of exogenous processes increases with depth even as the overall rate decreases.
These bench-scale experiments provide useful information that can be complemented by field studies to gain a wider understanding of the factors affecting microbial inactivation. For example, while the times required to reach a certain degree of inactivation in the natural samples fall within a relatively narrow range (i.e., 1.9–2.2 h to achieve 3-log10 removal under our experimental conditions), this may not be the case in full-scale systems due to variability in flow/mixing or seasonal/diurnal fluctuations in environmental conditions that may affect inactivation kinetics. In addition, natural sunlight, which has a slightly different irradiance spectrum compared to that of the solar simulator (higher in the UVB range), would yield somewhat different results. Furthermore, indigenous bacteria are more resistant to sunlight disinfection than pure strains grown in the laboratory (Nguyen et al., 2015). Thus, further research that uses indigenous and pathogenic microorganisms (as opposed to laboratory-cultured indicators) would improve our estimations of disinfection kinetics under environmental conditions.
During NTS design, the microorganisms and conditions that require the greatest exposure times to achieve a given goal of treatment would dictate the required HRT. However, it is important to acknowledge that the necessary exposure times will increase with increasing depth due to decreasing photoinactivation rates. This points to the notion that HRT should not be increased by increasing depth alone but that a maximum or optimal depth should be established based on optimizing the mechanisms of solar inactivation given the absorbance conditions in the NTS (Silverman et al., 2015). Furthermore, the NTS design geometry must take into account not only the desired treatment level (influenced by HRT and depth) but also land availability/cost (Sarikaya and Arabia, 1988). While this is an optimization question that is beyond the present scope, improved knowledge of the relative contribution of endogenous versus exogenous processes in the presence of diverse types of OM can provide more reliable inputs for the calculation of NTS design parameters. Furthermore, the modeling presented herein provides a framework to integrate this knowledge into other models considering factors such as depth and flow.
Footnotes
Acknowledgments
The authors gratefully acknowledge support from the USEPA (STAR Fellowship No. FP 91748801) and the National Science Foundation (CBET awards 1235288 and 1344382).
Author Disclosure Statement
No competing financial interests exist.