
Abstract
Abstract
Shortcut nitrification can be successfully achieved by dosing methanoic acid in the sequencing batch reactor (SBR) system. While processing stable shortcut nitrification, influent pH value was kept at 7.5–8.5. However, dissolved oxygen and temperature were not controlled in the SBR. When influent NH4+−N was 50 mg/L, NH4+−N removal efficiency reached 98.77% and 98.92% in the reactor when we dosed 0.25 and 0.35 mL/L methanoic acid. Moreover, when we dosed 0.25 and 0.35 mL/L methanoic acid in the reactor, NO2−−N removal reached 77.88% and 79.63% of the NO2−−N/(NO2−−N + NO3−−N) in the effluent, respectively. We also discovered that when we dosed 0.35 mL/L methanoic acid, effluent NH4+−N was more volatile. Scanning electron microscopy showed that the main composition of the activated sludge was bacilli and coccus bacteria. High throughput sequencing analysis revealed that after methanoic acid was dosed, the dominant bacteria were Blastocatella, Brevundimonas, Ferruginibacter, Paracoccus, Pseudoxanthomonas, and Thermomonas. Methanoic acid can be used to control the development and maintenance for shortcut nitrification.
Introduction
N
In recent years, nitrification and denitrification using nitrite technology (also called as the shortcut nitrification or partial nitrification) have received much attention because of its excellent features (Peng and Zhu, 2006; Peng et al., 2012). Since the shortcut nitrification nitrogen just needs to be oxidized into nitrite, the process is followed by denitrification (Wang et al., 2007). Shortcut nitrification process is based on the fact that nitrite is an intermediary compound in both nitrification and denitrification steps (Peng and Zhu, 2006). Compared with the traditional biological nitrogen removal process using nitrate, the shortcut nitrification process could reduce energy consumption for aeration, require less organic carbon and alkalinity for denitrification, shorten reaction time, and reduce the amount of excess sludge produced (Gao et al., 2011, 2014). Shortcut nitrification process was reported to be technically feasible and economically favorable, especially when wastewater with high ammonium concentration or low C/N ratio is treated (Yang et al., 2007).
Nitrifying bacteria are composed of distinct phylogenetic groups of chemolithotrophic bacteria, the ammonia-oxidizing bacteria (AOB), and the nitrite-oxidizing bacteria (NOB) (Fortunato et al., 2009; Wang et al., 2014). The key of maintaining shortcut nitrification is to accumulate AOB and inhibit or washout NOB (Wang et al., 2015). Several process control parameters, such as low DO, high free ammonia and free nitrous acid, short sludge retention time, high temperature, real-time control (Vadivelu et al., 2007; Contreras et al., 2008; Guo et al., 2008; Peng et al., 2012), and inhibitors, have been used to achieve shortcut nitrification. However, the effect of methanoic acid on shortcut nitrification is not well understood (Eilersen et al., 1994).
The objective of this study was to characterize nitrogen removal through nitrite by way of dosing methanoic acid and identifying the effectiveness of methanoic acid for shortcut nitrification and the composition of microbial community in the activated sludge.
Materials and Methods
Configuration of sequencing batch reactor
A bench-scale sequencing batch reactor (SBR) made of organic glass was used for the study shown in Fig. 1. The effective volume of the reactor was 14 L, internal diameter of 18 cm, and height of 56 cm. The reactor has double layers, and through water bath circulation in the interlayer, the temperature could be controlled. Air for the reactor was provided by a blower pump through an aeration diffuser placed at the bottom of the reactor. The variation of air flux was controlled by an air flow meter. The different phases of the SBR were, respectively, filled, aerated, quiescenced, and drained, which were controlled by time switches.
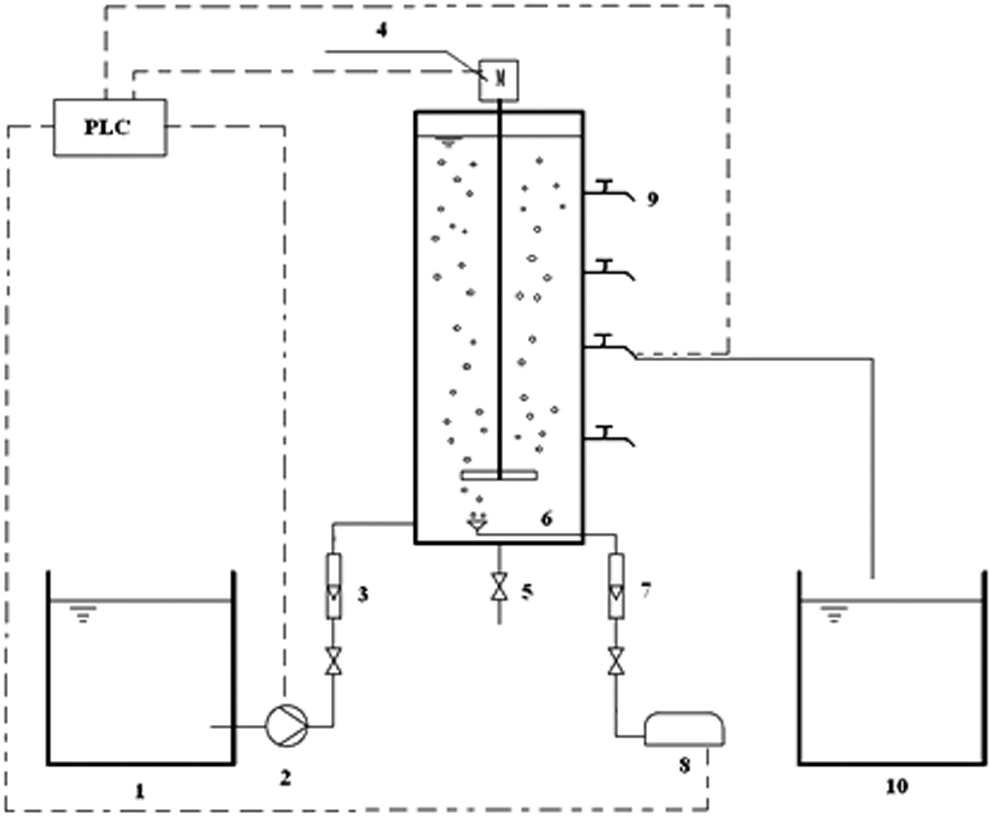
Schematic diagram of SBR. 1, influent tank; 2, influent pump; 3, liquid flow meter; 4, stirrer; 5, discharge valve; 6, aeration diffuser; 7, air flow meter; 8, blower pump; 9, sample point; 10, effluent tank. SBR, sequencing batch reactor.
Synthetic wastewater
NH4Cl and glucose were, respectively, used as nitrogen and carbon source in the synthetic wastewater. The synthetic wastewater also contained NaHCO3 (400 mg/L), CaCl2 (4 mg/L), KH2PO4 (40 mg/L), and MgSO4·7H2O (40 mg/L) and trace elements: FeCl3 (375 mg/L), H3BO3 (37.5 mg/L), CuSO4·5H2O (7.5 mg/L), KI (45 mg/L), MnSO4·H2O (25.69 mg/L), ZnSO4·7H2O (30 mg/L), EDTA (2,500 mg/L), CoCl2·6H2O (50 mg/L), and Na2MoO4·2H2O (20 mg/L) (Wei et al., 2014; Kong et al., 2016).
Inoculated sludge characteristics
Inoculated sludge was taken from Shenyang Southern Sewage Treatment Plant (China). Sludge volume index, mixed liquor suspended solids (MLSS), and volatile suspended solids (VSS) of inoculated sludge were 67.72 mL/g, 4,430 mg/L, and 3,340 mg/L, respectively.
Contrast test
To examine the effect of different methanoic acid concentrations on the shortcut nitrification, contrast experiments were performed in the same beakers. The experimental conditions in the four beakers were kept nearly the same: MLSS was ∼4,000 mg/L, DO was above 8 mg/L, room temperature was around 25°C, and retention time was 7 h for one cycle. In the four beakers, the methanoic acid concentration was, respectively, 0, 0.15, 0.25, and 0.35 mL/L. Aeration was performed from the bottom of the bottles by small diffusers.
Analytical methods
MLSS and VSS were determined by the gravimetric method according to the standard protocol of State Environmental Protection Administration of China (S.E.P.A. Chinese, 2002). pH was measured with a METTLER TOLEDO pH meter-FE20. DO was detected with a Hach HQ30d Dissolved Oxygen Meter. Chemical oxygen demand (COD) was detected with a DR3900 COD meter (Hach Company). Five-day biochemical oxygen demand (BOD5) was detected with BODTrak™ (Hach Company). Concentrations of the effluent nitrogen compounds were also determined by the protocol of S.E.P.A. Chinese (2002). Methanoic acid was analyzed with VARIAN ProStar HPLC (Eilersen et al., 1994).
Microbial morphology and structure of activated sludge were observed by way of scanning electron microscopy (SEM). The activated sludge samples were fixed with 2.5% glutaraldehyde at 4°C for 3 h and rinsed in 0.2 M phosphate buffer (pH 7.4) thrice. Then, the samples were dehydrated with series of ethanol (50%, 70%, 80%, 90%, and 100%). After being rinsed with the mixture of anhydrous ethanol and tert-butyl alcohol (1:1) one time and rinsed with tert-butyl alcohol one time, the dewatered samples were dried in vacuum drying cabinet and then the samples were gold-coated by a sputter and then observed with SEM (ULTRA PLUS) (Zheng et al., 2007; Luo et al., 2014).
During the experiment, the activated sludge samples were taken for high throughput sequencing analysis, which can obtain microbial community structure with different methanoic acid dosing. And different community structures were compared to discuss the effects of different methanoic acid dosing on activated sludge microbial community.
Bacterial 16S rRNA genes were amplified from activated sludge samples by polymerase chain reactions (PCRs) using TransGen AP221-02 reaction system (TransStart FastPfu DNA Polymerase). PCR primer pairs were 338F (ACTCCTACGGGAGGCAGCAG) and 806R (GGACTACHVGGGTWTCTAAT) (Dennis et al., 2013). PCR conditions were set as follows: 95°C for 3 min, then 27 cycles of 95°C for 30 s, 55°C for 30 s, and 72°C for 45 s, finally 10 min at 72°C and 10°C until halted by user. The PCR products were visualized in a 2% agarose gel after electrophoresis (Biswas et al., 2014; Huang et al., 2014). Then, the products were purified with a PCR Production Purification Kit. PCR amplicons were then quantitatively checked by QuantiFluor™-ST (Promega) and sequenced on the platform of MiSeq.
Results and Discussion
Effect of methanoic acid on shortcut nitrification in contrast test
When methanoic acid was dosed once a day, as Fig. 2 shows, the ammonium removal rate in the beakers with 0, 0.15, and 0.25 mL/L methanoic acid was similar, which were, respectively, 99.00%, 98.65%, and 99.90%. In the beaker with 0.35 mL/L methanoic acid, the ammonium removal rate was only 32.25%. Figure 3 shows that we got the highest effluent nitrite in the four beakers when HRT was 6 h. The effluent nitrite in the beakers with 0 and 0.15 mL/L methanoic acid was similar. The nitrite accumulation achieved its top level in the beaker dosed with 0.25 mL/L methanoic acid. Whereas in the beaker with 0.35 mL/L methanoic acid, the effluent nitrite was close to 0 mL/L, almost all the ammonium converted to nitrate. The above results showed that shortcut nitrification could occur with suitable methanoic acid (Eilersen et al., 1994). 0.15–0.25 mL/L methanoic acid additions almost had no impact on ammonium oxidation, but when the dosage of methanoic acid was 0.35 mL/L, the ammonium oxidation was apparently inhibited. Therefore, it is possible to achieve shortcut nitrification successfully by suitable methanoic acid dosage.
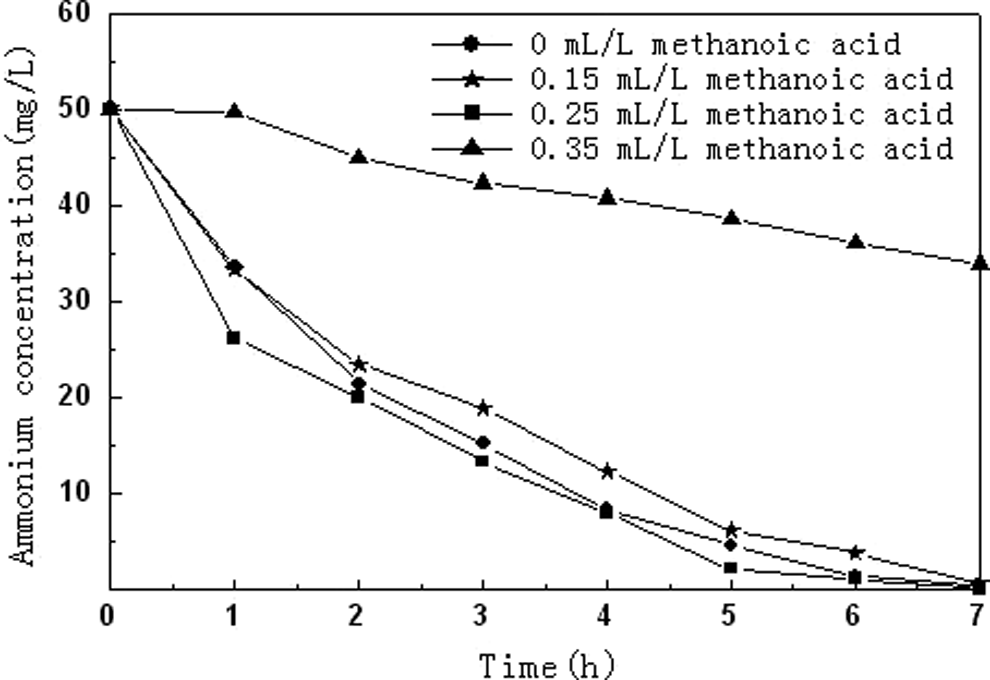
Variations of effluent NH4+−N during one cycle in the contrast experiment when methanoic acid was dosed.

Variations of effluent NO2−−N during one cycle in the contrast experiment when methanoic acid was dosed.
When dosing methanoic acid was stopped for a period of time, there was no effect on the beaker with 0.15 mL/L methanoic acid. The changes of nitrogen and pH in the beakers with 0.25 and 0.35 mL/L methanoic acid are shown in Figs. 4 and 5, respectively. Since there were few effects on the effluent when 0.15 mL/L methanoic acid was dosed, the behavior of 0.15 mL/L methanoic acid was not included in the figures. As shown in Fig. 4, when dosing methanoic acid was stopped for a while, the effluent nitrite decreased in the beaker with 0.25 mL/L methanoic acid; the effluent nitrite and nitrate were 18.87 and 19.42 mg/L, respectively, when the ammonium removal rate was 100%. However, the nitrite accumulation increased apparently in the beaker with 0.35 mL/L methanoic acid, and when the ammonium removal rate was 100%, the effluent nitrite and nitrate were 30.16 and 10.27 mg/L, respectively. As shown in Fig. 5, the variation tendency of pH was similar in the beakers with 0.25 and 0.35 mL/L methanoic acid, but the pH in the beaker with 0.25 mL/L methanoic acid was lower than that in the beaker with 0.35 mL/L methanoic acid. The reason for the changing of pH may be due to the alkalinity, which was consumed by nitrification. The beaker, which was dosed with 0.35 mL/L methanoic acid, consumed less alkalinity than that dosed with 0.25 mL/L methanoic acid (Li et al., 2008). There was no methanoic acid in the effluent, so it would not bring any side effect to the environment or the bacteria in the subsequent wastewater treatment processes.
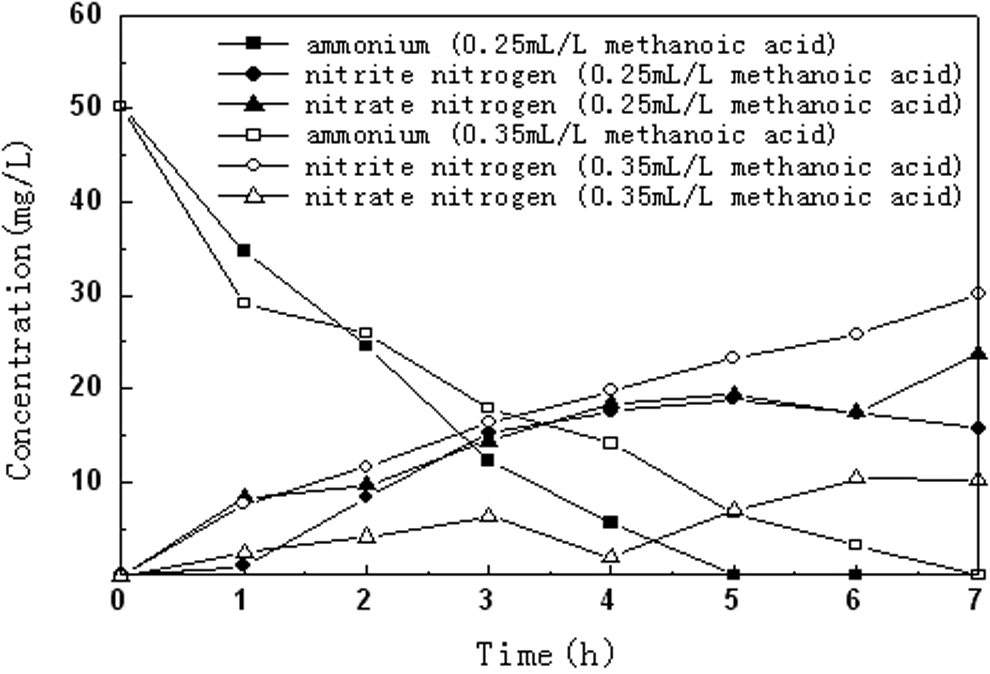
Variations of nitrogen compounds during one cycle when dosing methanoic acid was stopped.
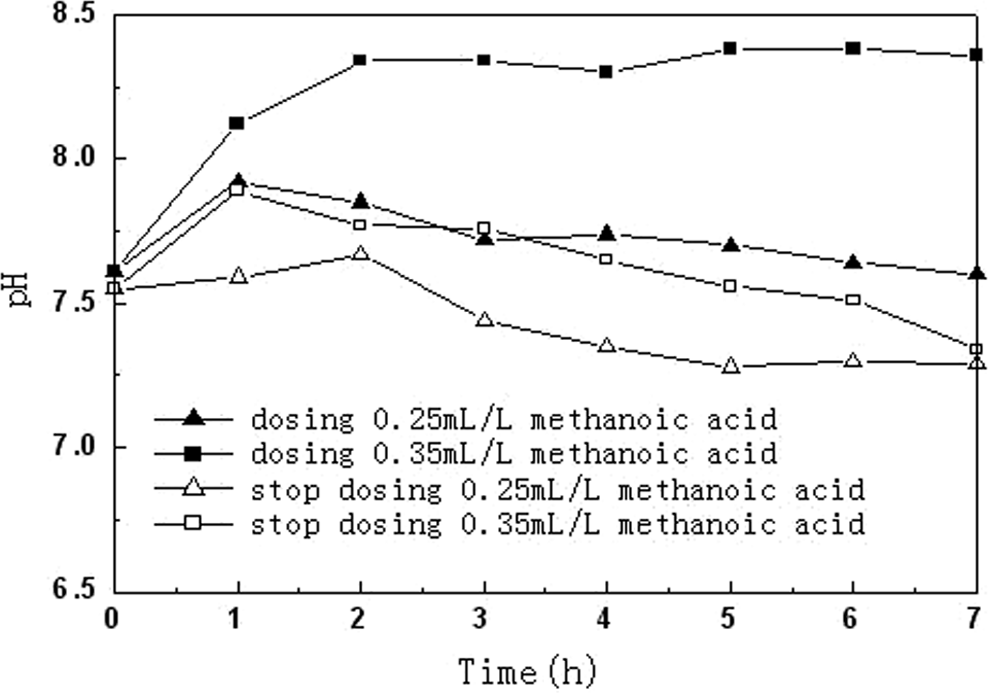
Variations of pH during one cycle.
Continuous effect of methanoic acid on shortcut nitrification in SBR
Based on results of the contrast test, 0.25 and 0.35 mL/L methanoic acid were chosen in SBR as shown in Fig. 1 for shortcut nitrification. The results are shown in Figs. 6 and 7. Before the methanoic acid dosing, experiments were implemented within a pH range of 7.5–8.5, at room temperature and without any DO (above 7 mg/L) control. Nitrate was the main product in the effluent. No parameters were changed in the following experiment except for the dosage of methanoic acid.

Nitrogen compounds changed with time when 0.25 mL/L methanoic acid was dosed.

Nitrogen compounds changed with time when 0.35 mL/L methanoic acid was dosed.
When the dosage of methanoic acid was 0.25 mL/L, the results are shown in Fig. 6. During the first 20 days, 0.25 mL/L methanoic acid was added into the reactor directly once a day. On day 10, the effluent nitrite and nitrate reached 21.35 and 12.58 mg/L, respectively. Nitrite accumulation was observed stable after day 10. On day 21, methanoic acid dosing was stopped, and from then on, the effluent nitrite was reduced day by day. On day 30, the effluent nitrite and nitrate reached 16.25 and 19.10 mg/L, respectively. From day 31, methanoic acid was dosed every 3 days. On day 41, the effluent nitrite and nitrate reached 26.66 and 9.24 mg/L, respectively. From then on, the nitrite accumulation was fixed.
When the dosage of methanoic acid was 0.35 mL/L, the results are shown in Fig. 7. During the first 10 days of the experiment, 0.35 mL/L methanoic acid was dosed once a day, and in this period, the effluent ammonium was high, but the nitrite accumulation was almost zero. On day 11 dosing methanoic acid was stopped. From then on, the effluent ammonium decreased day by day and the nitrite accumulation increased apparently. On day 38 nitrite accumulation reached highest level, the effluent nitrite and nitrate reached 26.94 and 6.98 mg/L, respectively. After day 38 the effluent nitrite decreased gradually. On day 46 we began dosing 0.35 mL/L methanoic acid every 3 days. The effluent ammonium increased immediately because of the methanoic acid dosing. On day 55 we stopped dosing methanoic acid, and from then on, the effluent ammonium decreased day by day and the nitrite accumulation increased gradually.
Based on these results, because of the dosing of methanoic acid, the activity of NOB was inhibited due to the accumulation of nitrite. Methanoic acid dosing was beneficial for nitrite accumulation. Dosing 0.25 mL/L methanoic acid almost had no effect on ammonium oxidation, but 0.35 mL/L dosage of methanoic acid made the ammonium oxidation at a low level.
Effect of methanoic acid on sludge morphology and community
SEM examination was conducted on day 65 to observe the morphology and microstructure of sludge in the reactor with 0.25 mL/L methanoic acid. The sludge had a very compact structure. As shown in Fig. 8, the sludge mainly consisted of bacilli and cocci.

Scanning electron microscopy images of activated sludge samples.
Sludge samples were taken for high throughput sequencing analysis, respectively, on the 10th day and the 65th day. The microbial community structure has been examined through the amplification of 16S rRNA genes (in the NCBI Sequence Read Archive database). Previous studies used PCR amplification to assess the operational taxonomic unit diversity of bacteria. As shown in Fig. 9 (Oberauner et al., 2013), column 1–5, respectively, showed the microbial community structure before dosing methanoic acid, on the 10th day, and the 65th day when dosing 0.25 mL/L methanoic acid and on the 10th day and the 65th day when dosing 0.35 mL/L methanoic acid. The results showed that when methanoic acid was dosed, the microbial community diversity was different with the one that was not dosed with methanoic acid. In addition the biological community was more diverse without methanoic acid, and the dominant bacteria were Acidaminococcaceae_uncultured, Aeromonas, Bacteroides, Ferribacterium, Flexibacter, Peptostreptococcaceae_incertae_sedis, Nitrospira, Gemmatimonadaceae_uncultured, and Candidate_division_WS3_norank. After we dosed methanoic acid, Blastocatella, Brevundimonas, Ferruginibacter, Paracoccus, Pseudoxanthomonas, and Thermomonas became the dominant bacteria.
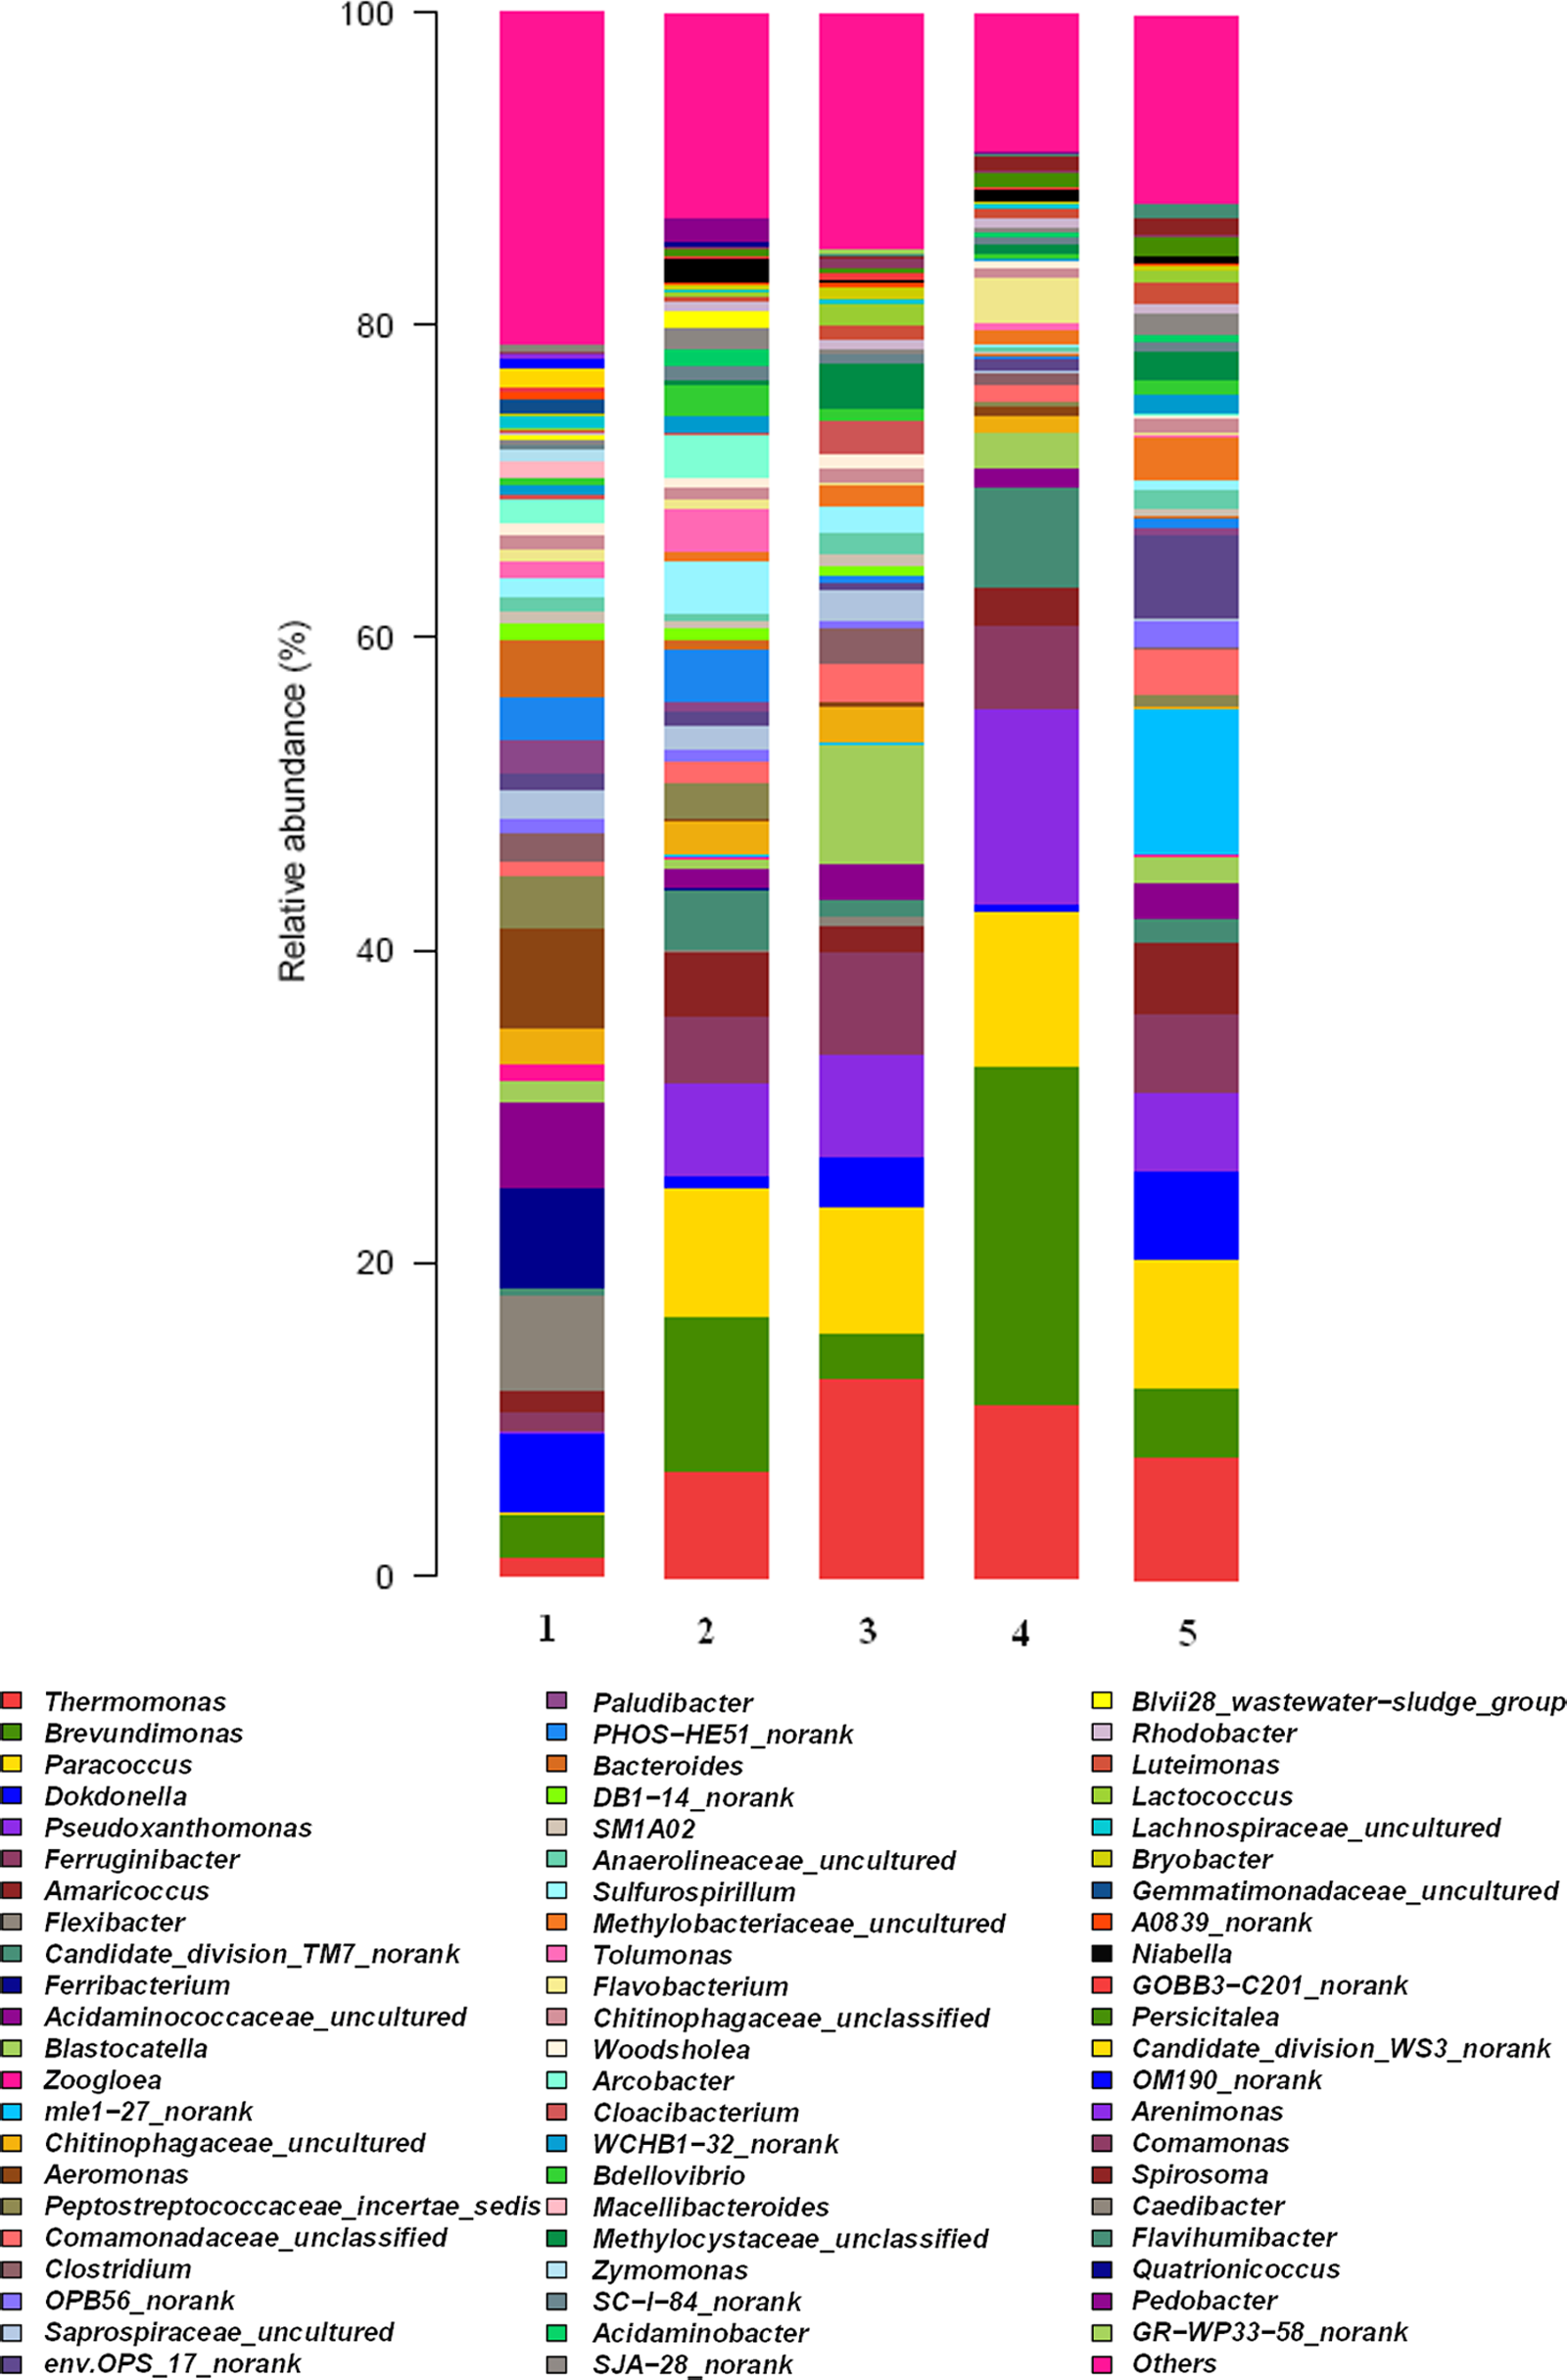
Analysis of microorganism community structure.
Conclusions
In this study, shortcut nitrification and denitrification were successfully achieved and maintained by methanoic acid dosing in SBR. Both 0.25 mL/L methanoic acid and 0.35 mL/L methanoic acid could achieve and maintain shortcut nitrification, but when 0.35 mL/L methanoic acid was being dosed, the ammonium oxidation had big fluctuations. Dosing 0.25 mL/L methanoic acid is the best way to get the shortcut nitrification. By dosing 0.25 mL/L methanoic acid, nitrite became the dominant product. Shortcut nitrification was also developed and maintained for a long period. Moreover, dosing 0.25 mL/L methanoic acid almost had no effect on ammonium oxidation. However, nitrite oxidation would gradually revive in the absence of methanoic acid.
Footnotes
Acknowledgments
This research was financially supported by the Major Science and Technology Program for Water Pollution Control and Treatment (Project No. 2013ZX07202-010); Department of Education project of Liaoning provincial, China (Project No. L2014437); Shenyang Science and Technology Project, China (Project No. F15-199-1-21); Foundation Project of Large Equipments of Liaoning Province (2015); National Training Program of Innovation and Entrepreneurship for Undergraduates, China (Project No. 201610166075), and National Training Program of Innovation and Entrepreneurship for Undergraduates, China (Project No. 201610166077).
Author Disclosure Statement
No competing financial interests exist.