
Abstract
Abstract
Although modern environmental engineering was established in the mid 1900s, the field has arguably evolved into its own professional discipline only in the past 3–4 decades. During this time, the number of environmental engineering students, faculty, and practitioners has grown dramatically, and many environmental engineering BS degree programs were established. To better assess this growth, we have conducted an analysis of the demographics of environmental engineering students and faculty using the American Society for Engineering Education (ASEE) Engineering Data Management System. One limitation of the ASEE database is that only students and faculty primarily associated with environmental engineering degrees and programs, respectively, are counted; therefore, students and faculty related to environmental engineering tracks within civil and chemical engineering programs are excluded from this analysis. From 2005 to 2013, the number of BS, MS, and PhD degrees awarded rose by 90%, 27%, and 39%, respectively; furthermore, these growth rates exceeded those of civil and chemical engineering at all levels. As a consequence, the BS student-to-faculty ratio rose from 8 in 2005 to 35 in 2013. Hispanic American, African American, and Native American students are underrepresented in environmental engineering programs at all levels. Representation and retention of African American students is particularly concerning, since this group exhibited negative retention trends from the 2006 to 2010 BS cohorts. Gender demographics were reasonably representative with 46% of all environmental engineering degrees awarded to women in 2013. Some gains were found in representation of ethnic and racial minorities and women in environmental engineering faculty at the associate professor level. Minimal gains were observed at the assistant professor rank. However, 88% of full professors are Caucasian, and 85% are men. These findings suggest that increased efforts are needed to recruit and retain students from underrepresented groups to environmental engineering and encourage them to pursue careers in academia.
Introduction
A
Environmental engineering has developed into a professional discipline (Aitken et al., 2004) that is truly interdisciplinary with respect to the breadth of the profession and the diverse educational training of its members. For that same reason, environmental engineering degrees and faculty are housed in a variety of programs, including civil engineering, chemical engineering, geography and environmental sciences, and public health. In 2005, Jones et al. (2005) reported the first census of environmental engineering students, faculty, and practitioners across the United States. At the time, the 2004 graduating class comprised 496 BS, 590 MS, and 119 PhD degrees. Approximately 100 environmental engineering faculty were identified using the American Society for Engineering Education (ASEE) database, but the authors estimated as many as 1,100 environmental engineering and science faculty from membership in the Association of Environmental Engineering and Science Professors (AEESP) (Jones et al., 2005). Since 2005, the environmental engineering discipline has continued to grow in number and scope. For that reason, this report seeks to update the Jones et al. census on student enrollments, degrees, and faculty in environmental engineering disciplines. In particular, we have focused on identifying changes in the magnitude of student enrollments, degrees awarded, and faculty numbers for the period of 2005–2013.
This timeframe also aligns with the National Science Foundation (NSF) emphasis on broadening participation of students from underrepresented groups in science, technology, engineering, and math (STEM) fields (NSF, 2008). A diverse population of engineers is necessary for the United States to remain competitive in the rapidly changing global economy (National Academy of Sciences, and others 2010). Engineering disciplines must recruit and retain more students from underrepresented groups to meet this future demand and retain these students in the academic pipeline to produce a more diverse faculty. NSF reporting of graduate student enrollments does not include an environmental engineering category (Kang, 2015), and so it is difficult to use NSF statistics for understanding changes in the magnitude and demographics of environmental engineering programs. Regardless, NSF reported +25.8%, −16.0%, and +8.4% changes in graduate student enrollments for Hispanic American, American Indian, and African American graduate student enrollments for all science and engineering fields over the 2008–2013 timeframe (Kang, 2015). The magnitude of these enrollments is, however, still below US demographic levels (US Census Bureau, 2002; 2015). In particular, Hispanic American, American Indian, and African American graduate students comprised 5.8%, 0.4%, and 5.4%, respectively, of the total graduate student body in STEM fields for 2013.
Others have assessed the influence of the broader impacts review criterion for NSF proposals on the science–society relationship (Holbrook, 2005; 2012; Intemann, 2009). Nadkarni and Stasch (2013) found that 65% of 2000–2010 NSF abstracts in ecosystem sciences included a broader impacts statement; furthermore, only 11% addressed underrepresented groups. Similarly, Watts et al. (2013) reported that “broadening participation of underrepresented groups” is the least addressed NSF broader impact. Intemann (2009) presented three distinct rationales for inclusion of the diversity component of the NSF broader impacts criterion: (1) social justice; (2) talented workforce; and (3) increased objectivity. These rationales extend beyond proposal writing and evaluation, as increased diversity has distinct social, economic, and scientific benefits. An increased emphasis on assessment and evaluation of broader impacts activities, as suggested by the National Science Board, may help enhance diversity in science and engineering (National Science Board, 2011).
The importance of diversity is further highlighted by evidence suggesting that gender, ethnically, and racially diverse groups perform better across a range of output measures in the social sciences, business, healthcare, technology, and natural sciences (Valantine and Collins, 2015) and that exposure to racial diversity can positively impact student learning and educational outcomes (Denson and Chang, 2009). For these reasons, the ASEE Engineering Deans Council has a specific objective to “promote diversity and inclusiveness in all aspects of engineering education, research, and engagement” (American Society for Engineering Education, 2015). Bhandari et al. (2006) provided a brief discussion of environmental engineering demographics pre-2005. Those authors concluded that women and minorities are not attaining environmental engineering degrees at rates commensurate with levels acceptable for society's long-term welfare (Bhandari et al., 2006). Despite the demonstrated importance of diversity among engineering students and faculty, no research studies, to date, have fully investigated gender, ethnic, and racial diversity across the environmental engineering profession.
The objectives of this study were to: (1) evaluate growth within all academic levels of environmental engineering; (2) identify changes in student/faculty gender demographics in environmental engineering; and (3) assess ethnic and racial diversity of environmental engineering students and faculty. All three of these objectives are focused on the 2005–2013 period, building on earlier work by Jones et al. (2005, 2006), and Bhandari et al. (2006). Student and faculty diversity in STEM fields is a broad issue. Analysis of the available demographics data for environmental engineering highlights the progress of the field compared with related disciplines, such as civil and chemical engineering; however, these data also stress the need for continued improvement. The results of this study provide improved understanding of the growth and demographics of the environmental engineering discipline and, thereby, enable efforts to not only increase inclusiveness in our degree programs and faculty bodies, but also improve outreach efforts for students from underrepresented groups.
Materials and Methods
Demographics data sources
As discussed above, documentation of the growth and demographics of the environmental engineering academic discipline was the focus of this study. For that reason, data were collected from ASEE and the Engineering Workforce Commission (EWC), which report demographics information for engineering fields. These two sources provide the most extensive demographics data for students (ASEE, EWC) and faculty (ASEE); however, it should be noted that the American Academy of Environmental Engineers and Scientists (AAEES), ASCE, the American Water Works Association (AWWA), and the Bureau of Labor Statistics (BLS) also report demographics of practitioners in environmental engineering (Jones et al., 2005). The Association of Environmental Engineering and Science Professors (AEESP) membership database was analyzed with respect to the number of faculty and graduate student members. These datasets, along with aggregate data from other professional and governmental organizations (e.g., NSF), are helpful in understanding the overall demographic makeup of the environmental engineering field.
The data reported by ASEE and EWC stem from ABET, the accreditation board for engineering. Jones et al. (2005) described the ASEE and EWC data collection methods, which are not repeated here. Regardless, it is important to note that these two datasets are based on information supplied by university registrars. For that reason, the degree name is important, as it impacts the program where student enrollments and degrees are binned. Faculty are counted by department, regardless of specialty area. While “environmental engineering” degrees are becoming more common, many of these programs are still housed within civil engineering, chemical engineering, or environmental science degrees, especially at the BS level. Therefore, the environmental engineering enrollment, degree, and faculty numbers described below are likely underestimated since many environmental engineering students and faculty are included in the civil engineering and chemical engineering reports. The students and faculty missed in this regard affect the magnitude of enrollments, degrees, and faculty; however, this issue is not expected to alter gender, ethnicity, and race demographics data. On average, 115 institutions per year supplied environmental engineering demographics data to ASEE; however, a total of 135 schools contributed environmental engineering data (Supplementary Table S1 in the Supplementary Information) during the 2005–2013 period. Because data were collected from engineering organizations, no information on environmental science programs was considered in this study.
Data collection
Previous demographics studies (Lord et al., 2013; 2014; 2015) for other engineering fields have employed a number of datasets, including the ASEE Engineering Data Management System (ASEE, 2015), Multiple-Institution Database for Investigating Engineering Longitudinal Development (MIDFIELD, 2010), and Integrated Postsecondary Education Data System (IPEDS; US Department of Education, 2007), among others. Because the EWC (2015) and ASEE data were similar (not shown), the analyses that follow were conducted using only ASEE data, which were pulled directly from the Engineering Data Management System (http://edms.asee.org/) for environmental engineering, chemical engineering, and civil engineering (ASEE, 2015). In each case, data were collected for the parameters shown in Table 1; note that the faculty ethnicity dataset does not include a foreign national category. The US census, and other survey tools, have recently updated their definitions of ethnicity and race. Ethnicity refers to “Hispanic or Latino” and “Not Hispanic or Latino,” while race includes African American, Asian American, White, etc. ASEE reports demographics as ethnicity. While we do not want to misrepresent the ASEE data, the discussion below refers to ethnic and racial demographics for clarity. Demographics data were aggregated, compiled, and analyzed in Microsoft Excel.
Note that in the narrative, we use “international” in place of “foreign national.”
Results and Discussion
Environmental engineering degrees and enrollments
Since 2005, the number of environmental engineering degrees awarded has markedly grown. This growth has been observed across all degree levels with steady increases in PhDs, and sharp increases in BS and MS degrees after 2009 (Table 2). Note that the number of reporting schools was similar from 2005 to 2013, indicating that the increased number of degrees does not stem from increased reporting; regardless, the degree and enrollment data have been normalized to the number of reporting schools (see values in parentheses in Table 2). In 2013, approximately 8.4, 6.8, and 1.3 BS, MS, and PhD degrees, respectively, were conferred per reporting school. Student enrollments for the same period were 43.4, 10.5, and 7.8 BS, MS, and PhD students/school, respectively.
The growth calculation is based on 2005 and 2013 values. Values in parentheses are normalized to the number of reporting schools.
A comparison of student enrollments and degrees awarded indicates that environmental engineering is growing much faster than civil and chemical engineering, although those programs are larger in magnitude (Table 2). Growth in BS enrollments for environmental, civil, and chemical engineering from 2005 to 2013 were 155%, 23%, and 98%, respectively. This increased growth rate is apparent for all three degree levels. However, for many categories, fewer degrees were awarded in 2009 compared with 2005, indicating that much of the growth in this period occurred between 2009 and 2013. These findings suggest increased student interest in environmental engineering compared with related disciplines; moreover, such conclusions align with millennials' increased concern for the environment (Henrichs, 2008; Smith, 2010).
Another important statistic contained in the data from Table 2 is the percent of MS and PhD degrees relative to BS degrees. The ratio of MS to BS degrees in environmental engineering has decreased from 1.22 to 0.81 over the 2005–2013 period. This decrease mostly stems from the disproportionate increase in BS degrees/enrollments (Table 2). In comparison, the MS to BS degree ratios in the civil and chemical engineering fields were 0.44–0.49 and 0.28–0.32, respectively, for 2005–2013. The ratio of PhD to BS degrees in environmental, civil, and chemical engineering disciplines over the same period was 0.16–0.28, 0.08–0.09, and 0.17–0.25, respectively. These data suggest that the fraction of environmental engineering BS graduates pursuing advanced degrees is higher than civil engineering and similar to chemical engineering.
Interestingly, the number of faculty associated with environmental engineering departments has seemingly dropped from 2005 to 2013 (Fig. 1). The reason for the decreasing number of environmental engineering faculty is not immediately obvious, as anecdotal evidence suggests growth in faculty numbers. The underlying cause of the lower faculty numbers likely stems from environmental engineering faculty being primarily associated with civil or chemical engineering departments, even when environmental engineering degrees are offered. Furthermore, the number of environmental engineering faculty (from the ASEE database) is relatively small as evidenced by the approximately 150 faculty counted in 2013. Indeed, Jones et al. (2005) raised similar issues in the 2005 census. From 2004 to 2015, the number of faculty members of AEESP grew from approximately 600 (Jones et al., 2005) to 682 (lifetime members and regular assistant, associate, and full professors). The 2015 membership database includes 233 assistant, 121 associate, and 224 full professors. Jones et al. (2005) called for discreet counting of environmental students/faculty housed in civil and chemical engineering programs. Unfortunately, such information is not yet available in national databases, such as NSF or ASEE.
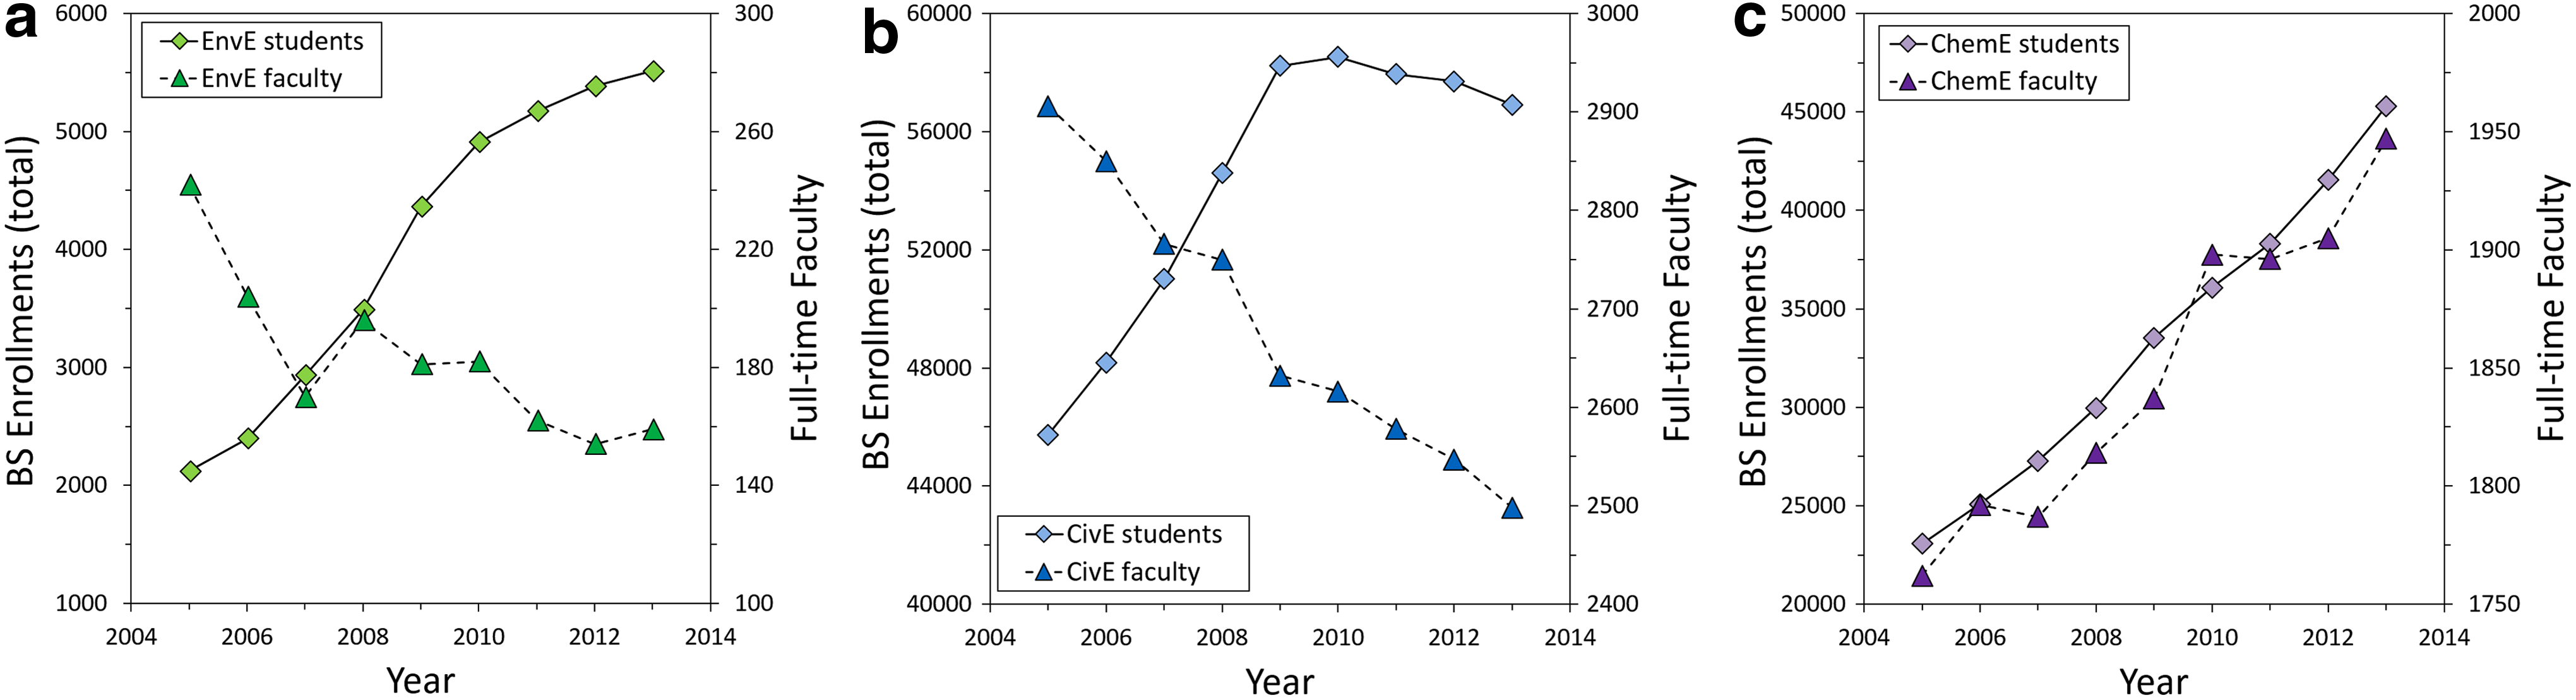
Number of student enrollments and faculty in
The decrease in faculty number, along with increased enrollments, has caused the apparent student-to-faculty ratio to increase from 8 in 2005 to 35 in 2013; this growth in the student-to-faculty ratio has been almost linear, with annual increases of approximately 3.5 students/faculty since 2005. For comparison, the 2013 student-to-faculty ratio in civil and chemical engineering programs was 23. It should be noted that the student-to-faculty ratio for environmental engineering is likely inflated by the differences in how students (by degree) and faculty (by department) are counted. Nevertheless, as the environmental engineering discipline continues to grow and expand, investment in new faculty is critical. In this regard, assessment of the ability of future PhD graduates to contribute to the teaching load required to lower the student-to-faculty ratio is an important consideration with respect to the workforce. Ultimately, achieving a similar ratio as that observed for civil and chemical engineering is necessary to ensure reasonable class sizes and attention to individual students; however, it is important to note that teaching loads vary between engineering programs and these differences affect the overall class size.
Ethnicity, race, and gender demographics in environmental engineering
ASEE data have been compiled, analyzed, and interpreted to better understand the demographics of environmental engineering, and how those demographics have changed from 2005 to 2013. This analysis includes discussion of student enrollments, degrees awarded, and faculty. Below, we discuss some of the trends observed in these datasets with comparison to US demographics levels (US Census Bureau, 2002; 2015). It should be noted that recent trends in ethnicity and race reporting may influence some changes observed across this period. For example, between 2000 and 2010, 2.5 million Americans of Hispanic origin changed their race from the “some other race” category to “white” on the US census, whereas 1.3 million Americans changed their race in the other direction (Cohn, 2014).
Diversity of students enrolled in environmental engineering
Ethnicity and race demographics
From Fig. 2, the largest demographic groups enrolled in Environmental Engineering BS programs are Caucasian, Hispanic American, and Asian American. Caucasians and Asian Americans are not underrepresented and, therefore, discussion on these groups is limited here. In 2013, the following groups were underrepresented: Hispanic American (12.6%), African American (2.9%), and Native American (0.5%). These trends are also apparent for MS and PhD degrees, although the larger presence of international students in environmental engineering graduate programs decreases the overall percentage of degrees awarded to domestic demographic groups. To better compare student diversity to the US population, we adjusted demographics data to the total number of domestic students. These “domestic-adjusted” data for BS, MS, and PhD enrollments are as follows: BS–Hispanic American (13.4%), African American (3.1%), and Native American (0.5%); MS–Hispanic American (8.3%), African American (4.2%), and Native American (0.6%); PhD–Hispanic American (11.5%), African American (4.8%), and Native American (0.5%). These data suggest that African Americans are more represented in MS and PhD (4.2%, 4.8%) programs compared with BS programs (3.1%). Alternatively, the representation of Hispanic Americans in graduate programs is lower than in undergraduate programs. No apparent difference in the demographics data exists for Native American undergraduate and graduate students.

Full ethnicity and race demographics for
While Fig. 2 provides a snapshot for 2013, Fig. 3 shows the domestic-adjusted enrollments for the three major underrepresented groups (i.e., African American, Hispanic American, and Native American) for 2005–2013. Over this timeframe, minimal gains have been observed for ethnic and racial diversity of environmental engineering students. Two exceptions are African American and Hispanic American PhD students, which are trending positive, but are still below US demographics levels (US Census Bureau, 2015). This underrepresentation has important impacts on students. For example, Concannon and Barrow (2009) have shown that African American engineering students have significantly lower career outcome expectations compared with Caucasian students. These findings indicate the need for increasing representation in both student and faculty populations.
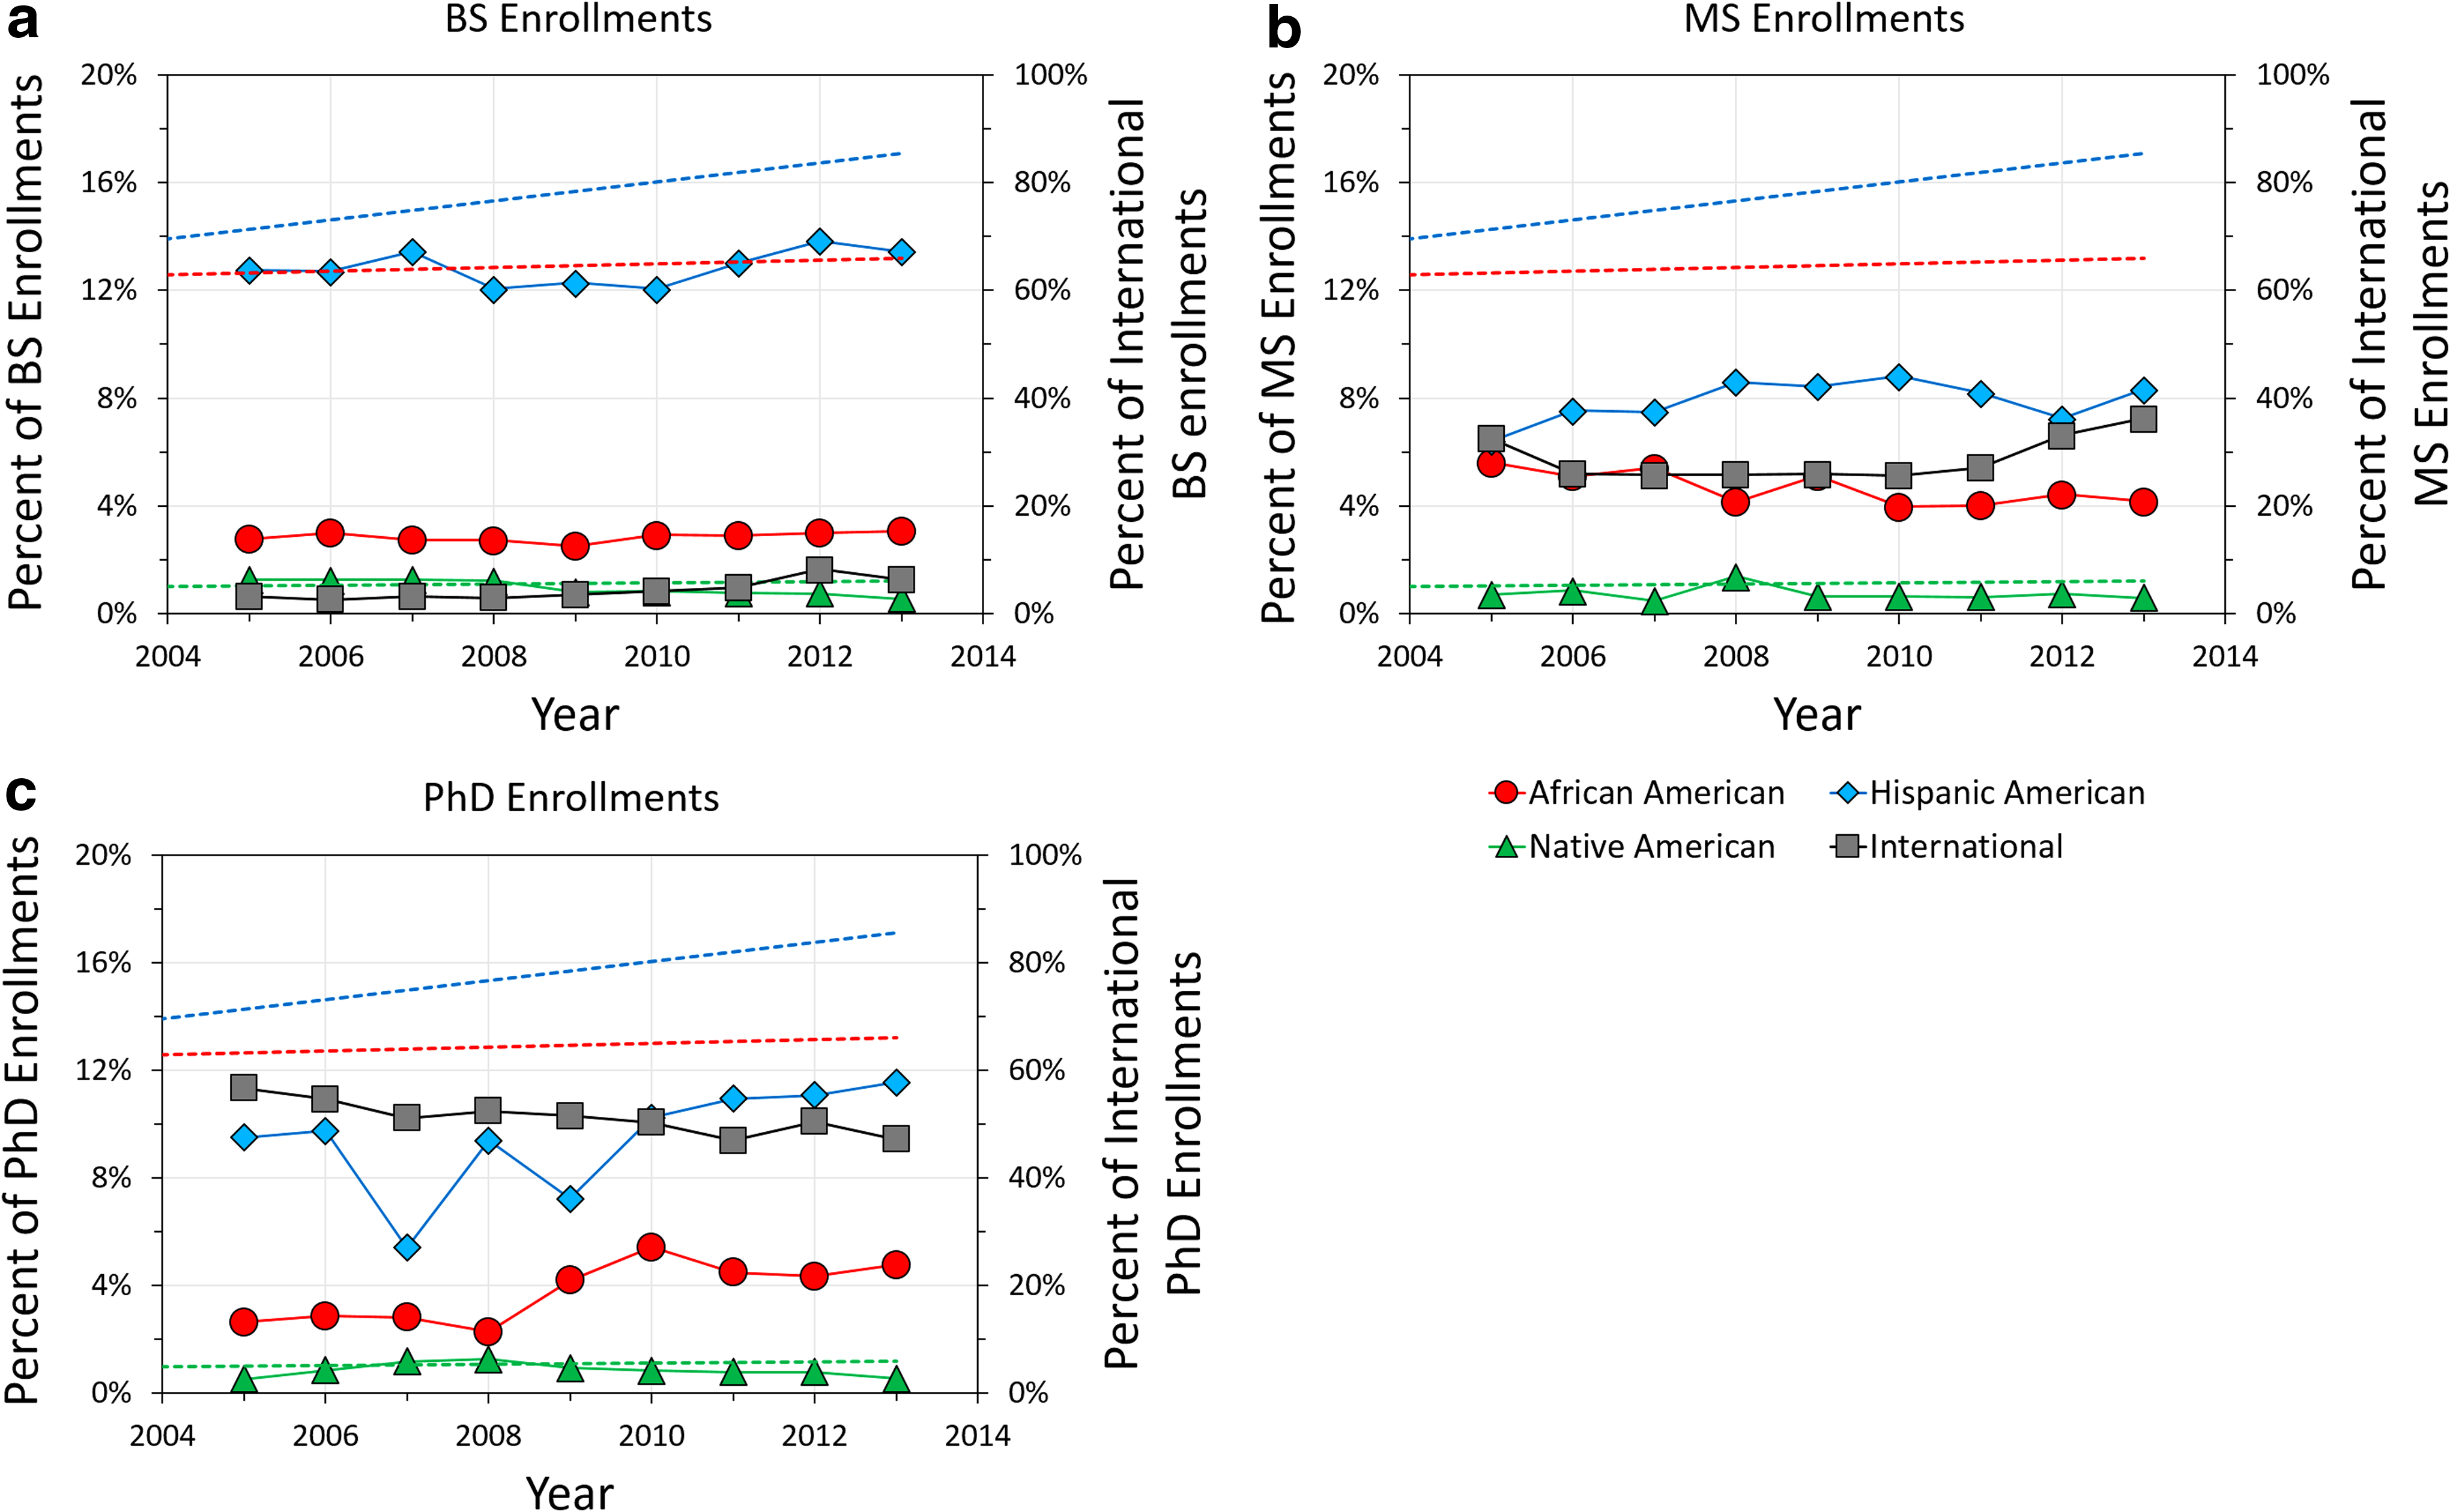
Ethnicity and race demographics for environmental engineering enrollments from 2005 to 2013 for
The percent of international enrollments in BS, MS, and PhD programs is overlaid on the secondary axes of Fig. 3. The number of international students in environmental engineering programs appears to be increasing at the BS and MS levels; however, the fraction of international students enrolled in environmental engineering PhD programs has been steadily decreasing since 2005.
Gender diversity
From 2005 to 2013, gender demographics for environmental engineering enrollments have increased for BS and PhD programs, whereas the percent of female MS students has been relatively consistent. In 2013, 42% to 45% of students in BS, MS, and PhD degrees were women. PhD enrollments, in particular, have improved from 35% in 2005 to 43% in 2013. While these numbers are below US demographics (US Census Bureau, 2015), it is important to note that women are much more represented in environmental engineering compared with civil and chemical engineering (Fig. 4). For 2013, the representation of women enrolled in these disciplines is as follows: civil engineering–23% BS, 27% MS, 28% PhD; chemical engineering–33% BS, 33% MS, 32% PhD. No apparent changes have been observed in gender demographics for these related fields over the 2005–2013 timeframe.
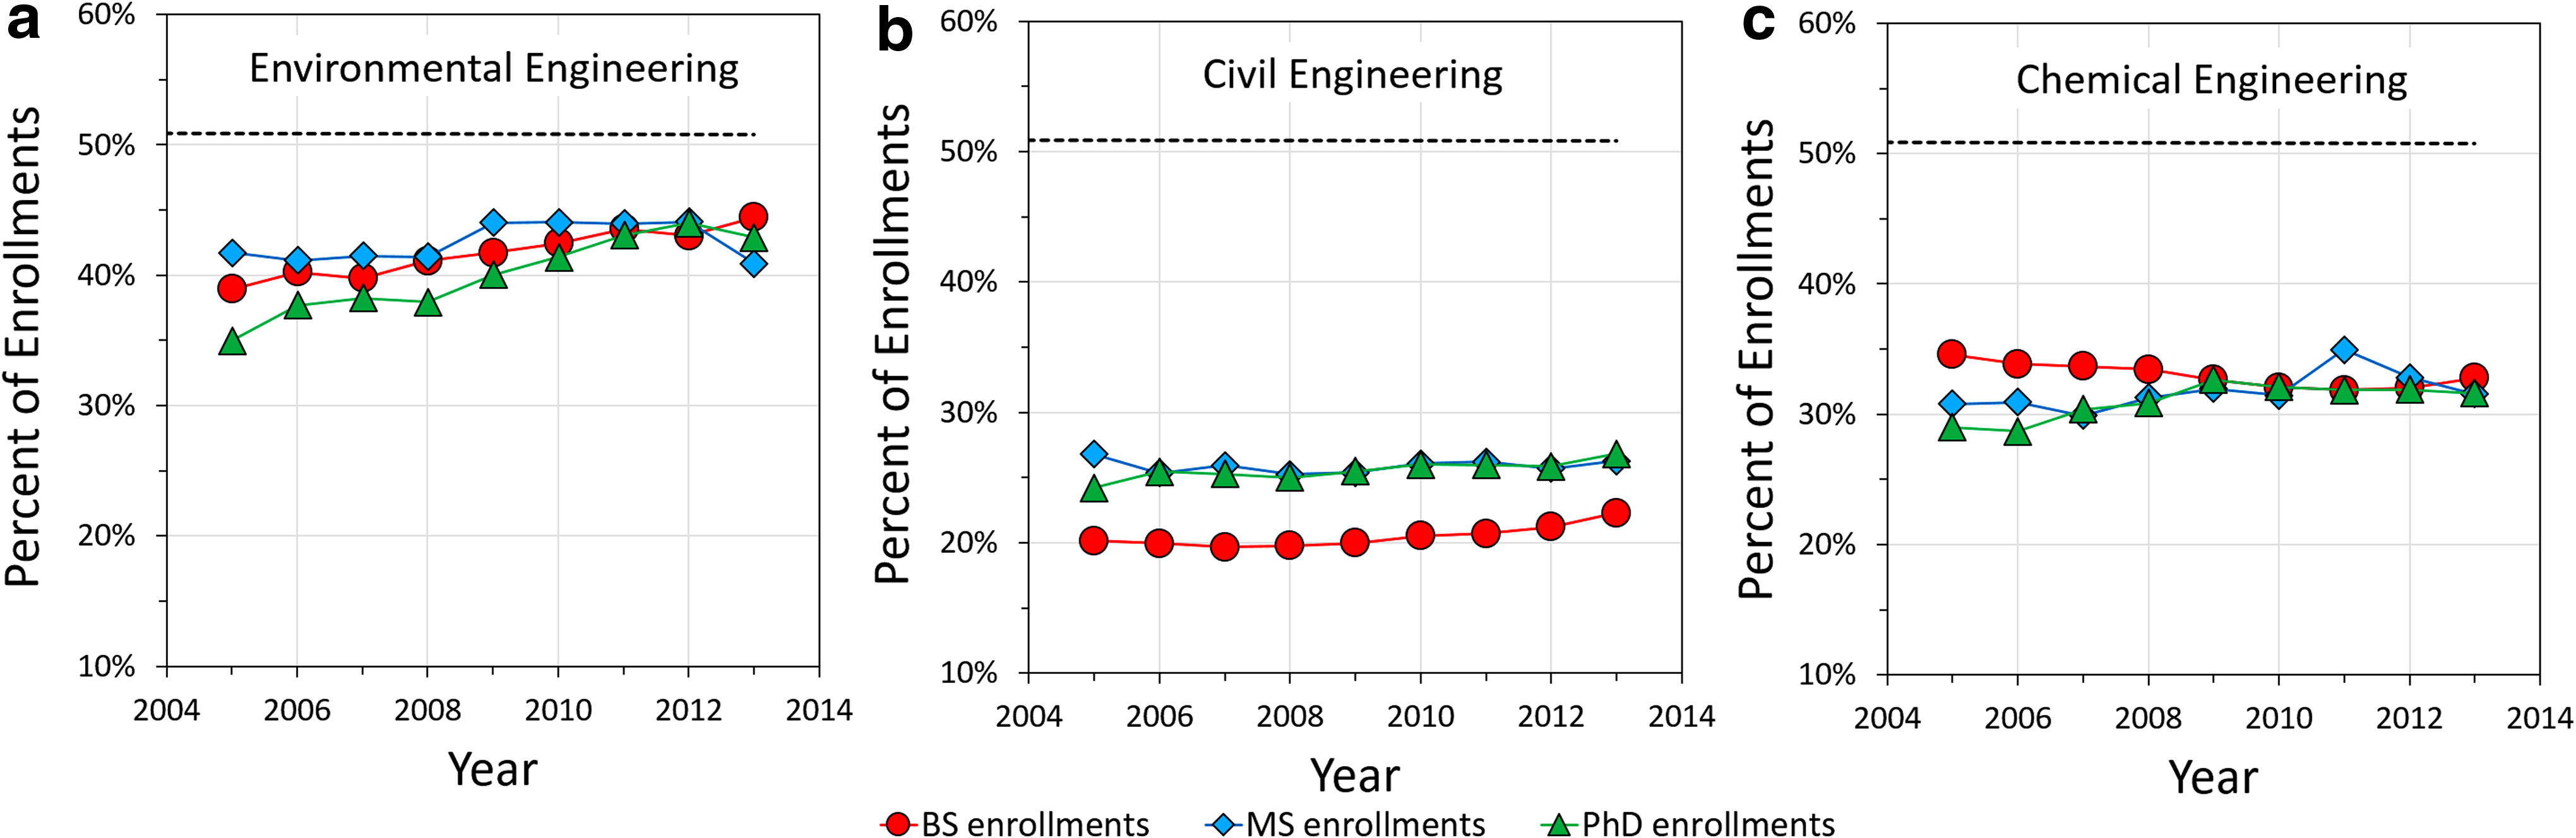
Percent of women enrolled in BS, MS, and PhD programs for
Cohort analysis
Using ASEE data, we tracked the 2006–2010 cohorts by assuming a 4-year degree plan (Table 3). Note that the cohorts tended to grow from Year 1 to 4; the 2006 and 2010 cohorts grew by 617 and 444 students, respectively. This growth may stem from students declaring their major after the first year or from students in related disciplines, such as civil and chemical engineering, transferring into environmental engineering programs in later years. The changing cohort size may also result from students not progressing along the presumed 4-year timeline; given the large increases in cohort size in year 4, this cause seems reasonable. Nevertheless, negative trends were observed for men and African Americans in environmental engineering programs. Given the changes in the total cohort size, this discussion focuses on trends in student growth across the three cohorts. The 2006 cohort saw the addition of 348 men from year 1 to 4; however, the 2010 cohort only grew by 192. On the other hand, the net growth in women enrolled in environmental engineering programs was reasonably consistent from the 2006 to 2010 cohorts. These changes have contributed to the increasing representation of women in environmental engineering (Fig. 4). Similar trends in gender-based enrollments were not observed for civil and chemical engineering.
Note that, in general, cohorts grew from Year 1 to Year 4.
Interesting trends were observed for the net change in the number of African American and Hispanic American students in environmental engineering. In particular, African Americans were the only group that showed a net decrease for the 2010 cohort; furthermore, the change in the number of students has dropped consistently from the 2006 cohort to that of 2010. On the contrary, the net change in Hispanic American enrollments has consistently increased from 2006 to 2010. Nevertheless, as indicated in Fig. 3 and Table 3, representation of African American and Hispanic American students enrolled in the environmental engineering discipline still falls below US demographics levels (US Census Bureau, 2015). Low retention of African American students was also observed in civil engineering; however, Hispanic American enrollments were relatively steady. On the other hand, chemical engineering exhibited larger cohorts for both African Americans and Hispanic Americans in 2010 compared with 2006.
Student diversity according to degrees awarded
Demographics data for environmental engineering degrees (Fig. 5) show similar trends as student enrollments for the 2005–2013 timeframe. The number of degrees awarded to African American, Hispanic American, and Native American students was below US demographics levels, as expected from the disproportionately lower enrollments. At the BS and MS levels, no apparent trends were observed. PhD enrollments of African American and Native American students have fluctuated over the past decade; however, no clear gains in representation are apparent. The percent of PhDs awarded to Hispanic Americans shows a positive trend with time, including large gains from 2010 to 2013. Interestingly, the degrees awarded to Hispanic Americans in 2013 (Fig. 5) outpaces the enrollment demographics (Fig. 3), so this rapid increase will likely slow down in the coming years. These data are important, because no real gains in ethnic or racial diversity of environmental engineering degrees can be achieved without first increasing representation in student enrollments. These findings align with Watson and Froyd's (2007) suggestion that a new analogical model is needed to guide future interventions that increase diversity in engineering. Similarly, Busch-Vishniac and Jarozsz (2003) argue that work from stakeholder groups only offer marginal and unsustainable gains, and that engineering curricula need to be revised to promote diversity. In Whistling Vivaldi, Claude Steele offers similar suggestions to reduce stereotype threat (Steele, 2011).
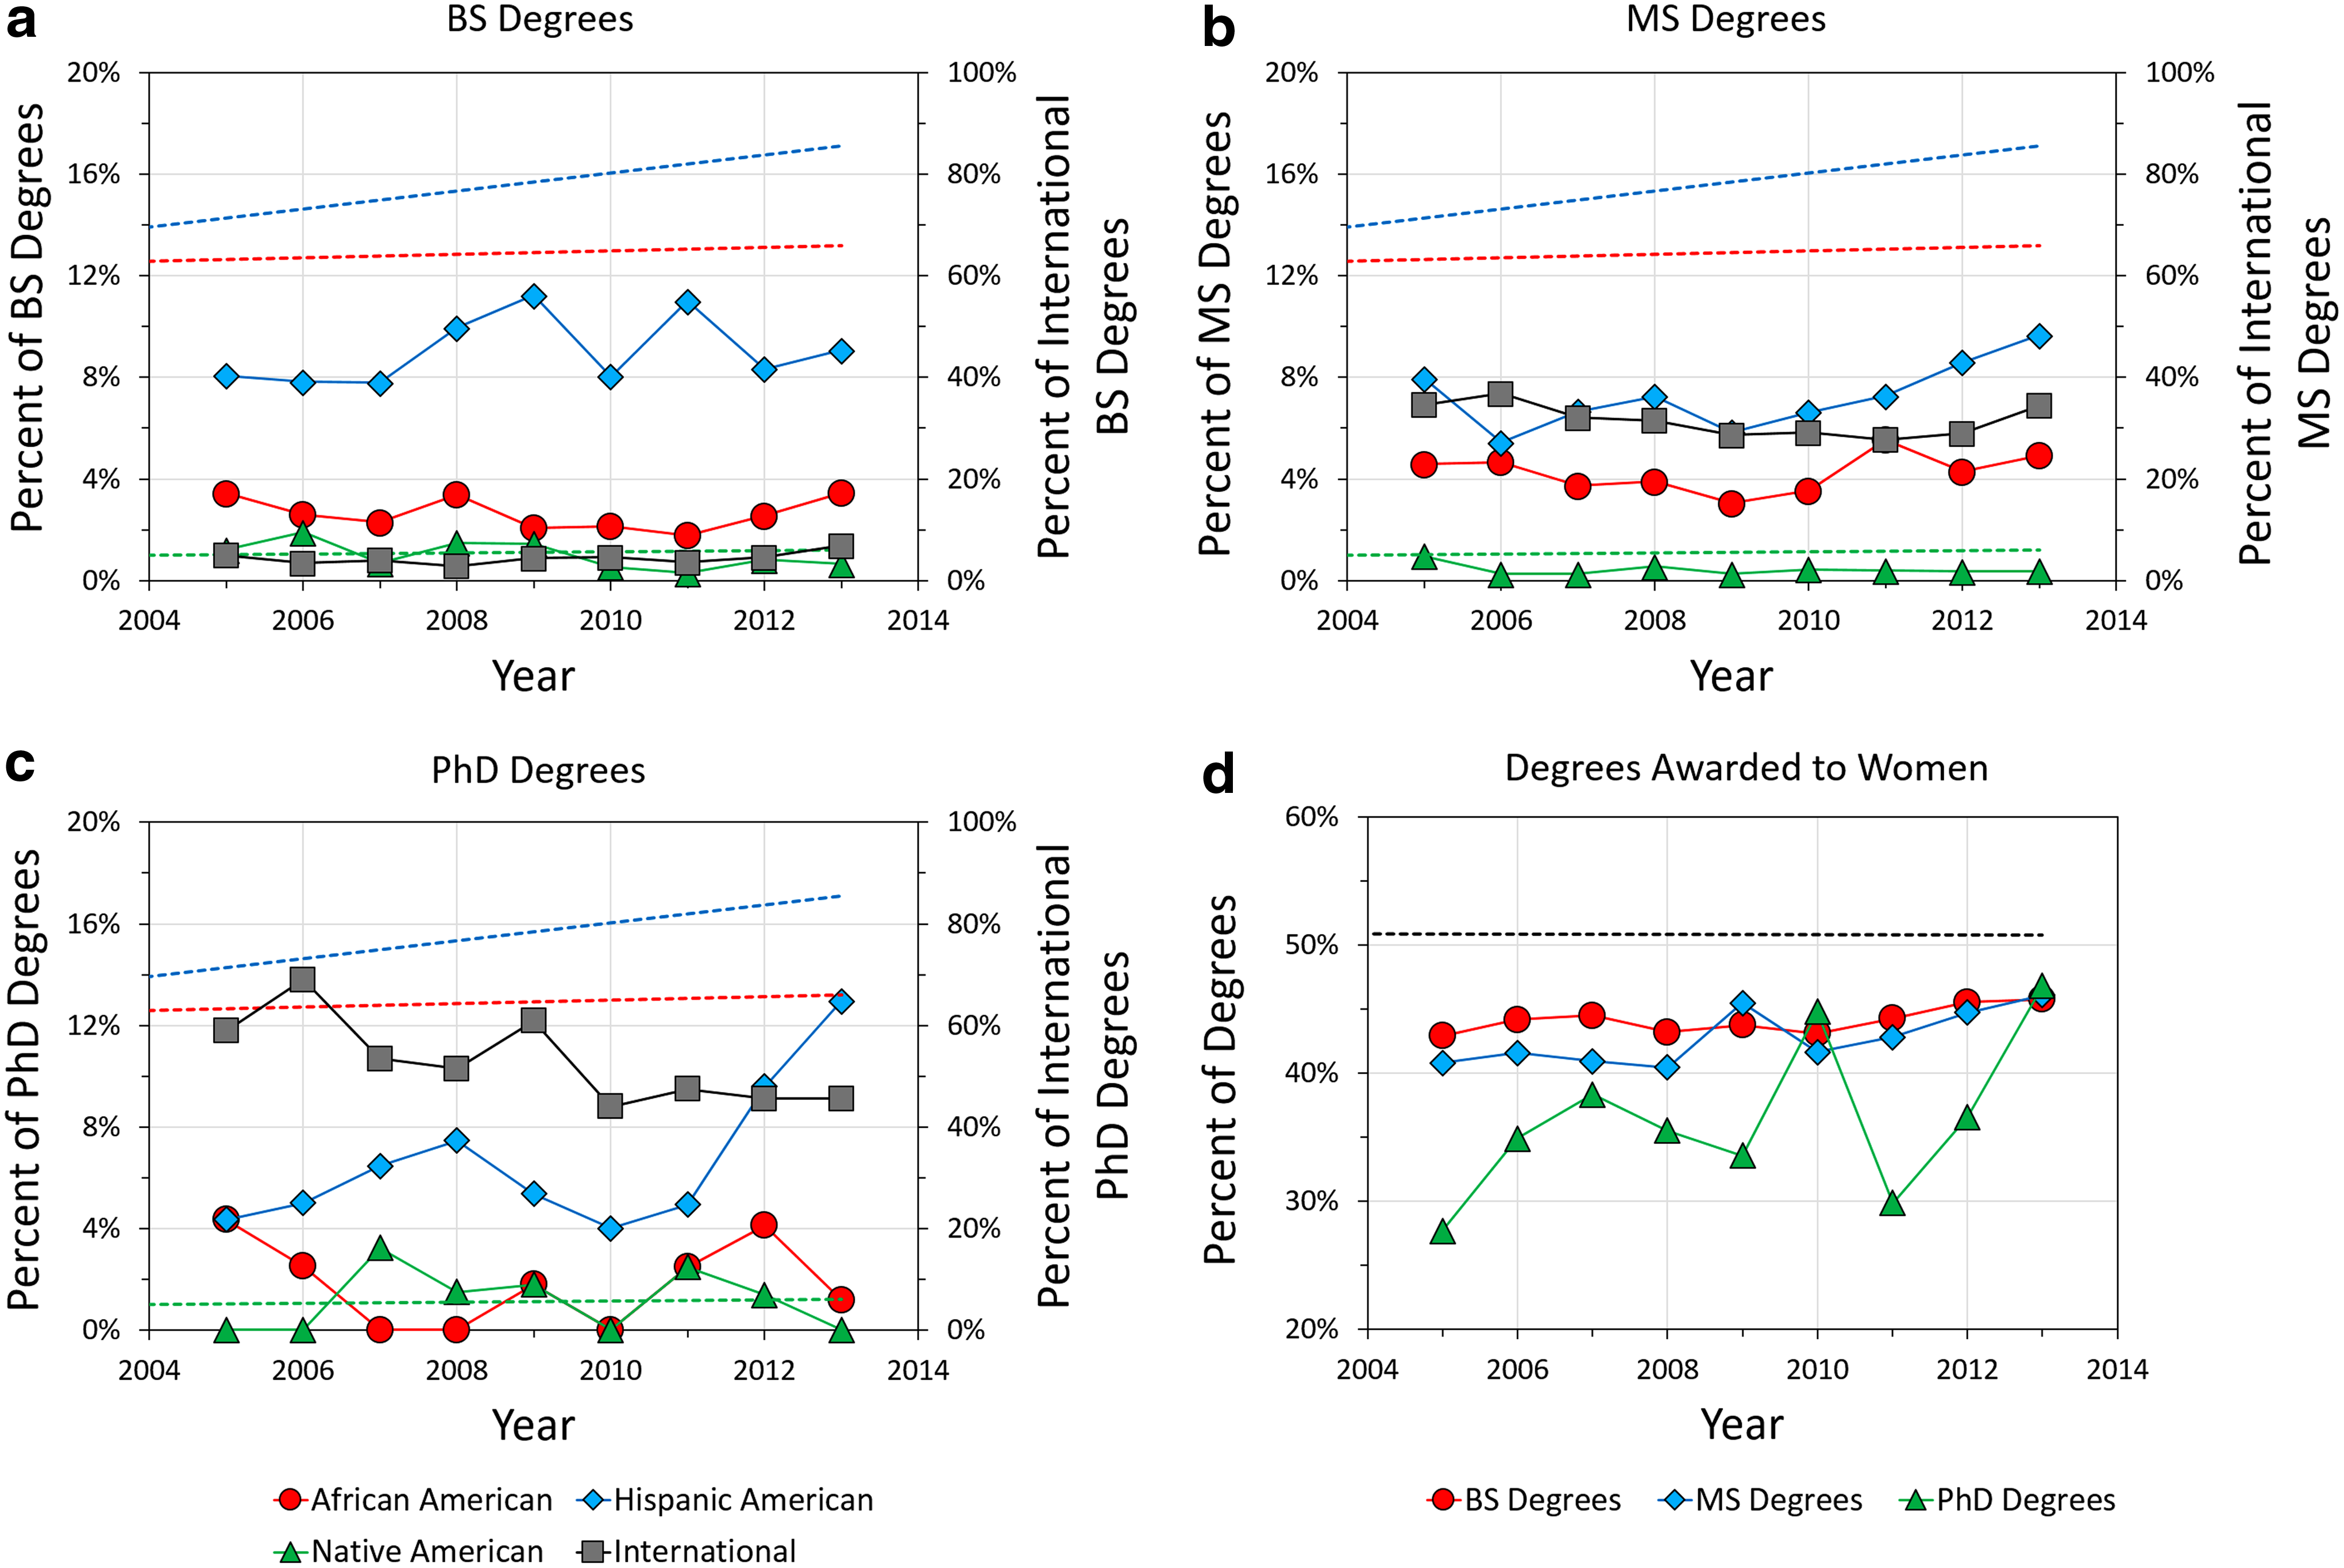
Environmental engineering degrees awarded for
Overall, the trends in degrees awarded to international students and women were comparable to those identified above for enrollments. The percent of BS degrees awarded to international students is increasing, but the proportion of PhDs granted to international students is decreasing. In 2013, the percentage of degrees awarded to women was 46–47% for all three levels. Unlike enrollments, the number of PhDs awarded to women has been somewhat volatile over the 2005–2013 timeframe.
Diversity of environmental engineering faculty
Faculty demographics are notably different than student enrollments and degrees. The majority of faculty across all ranks are Caucasian and men. In 2005, 76.4%, 75.9%, and 87.9% of assistant, associate, and full professors, respectively, were men. Similarly, the percentage of Caucasian faculty at the three ranks was 76.4%, 77.8%, and 90.5%, respectively. Some gains in ethnic and racial diversity can be observed in the 2013 data (Fig. 6); however, these gains have mostly come from Asian Americans and the “unknown” category. Unlike student enrollments and degrees, no “foreign national” category is included for faculty demographics, so non-American faculty are most likely to be represented by the “unknown” category. The lack of African American, Hispanic American, and Native American faculty members is clear.
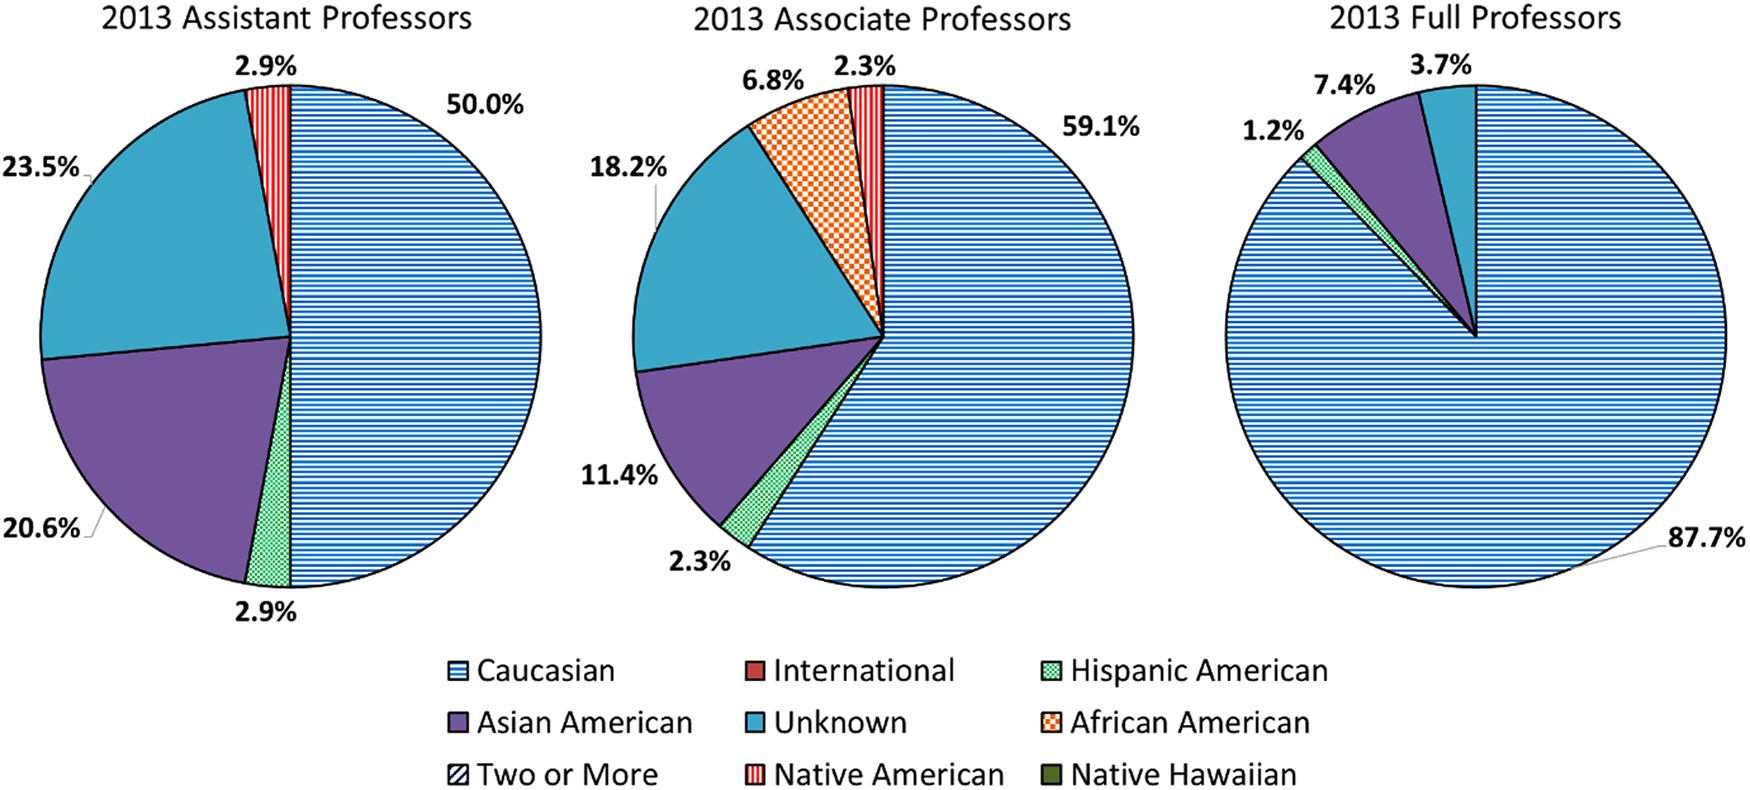
Ethnicity and race demographics of environmental engineering faculty reported in ASEE database for 2013.
To better understand the composition of environmental engineering faculty, consider the 2005–2013 data shown in Fig. 7. Inherent in these data is the prescribed tenure and promotion timeline; however, the data cannot be deconvoluted to specific faculty cohorts. Regardless, promotion of African American assistant professors (2005–2009) seems to be captured at the associate professor rank (2007–2010). After 2010, the percent of African American associate professors remained relatively steady, and no new assistant professors were reported. As of 2013, the promotion of African Americans to full professor has not been observed. In fact, no African American or Native American full professors were documented in the 2013 ASEE dataset; note that only one Hispanic American full professor was present. Again, it is important to note that these figures stem from 135 schools that reported environmental engineering data to ASEE between 2005 and 2013. Conventional knowledge and associations indicate that more faculty from underrepresented groups are active in the field; however, those faculty may be primarily associated with civil/chemical engineering programs and, therefore, are not captured in the national databases for environmental engineering. The apparent low reporting of environmental engineering faculty discussed in Section 3.1, and previously identified by Jones et al. (2005), may also contribute to these observations.
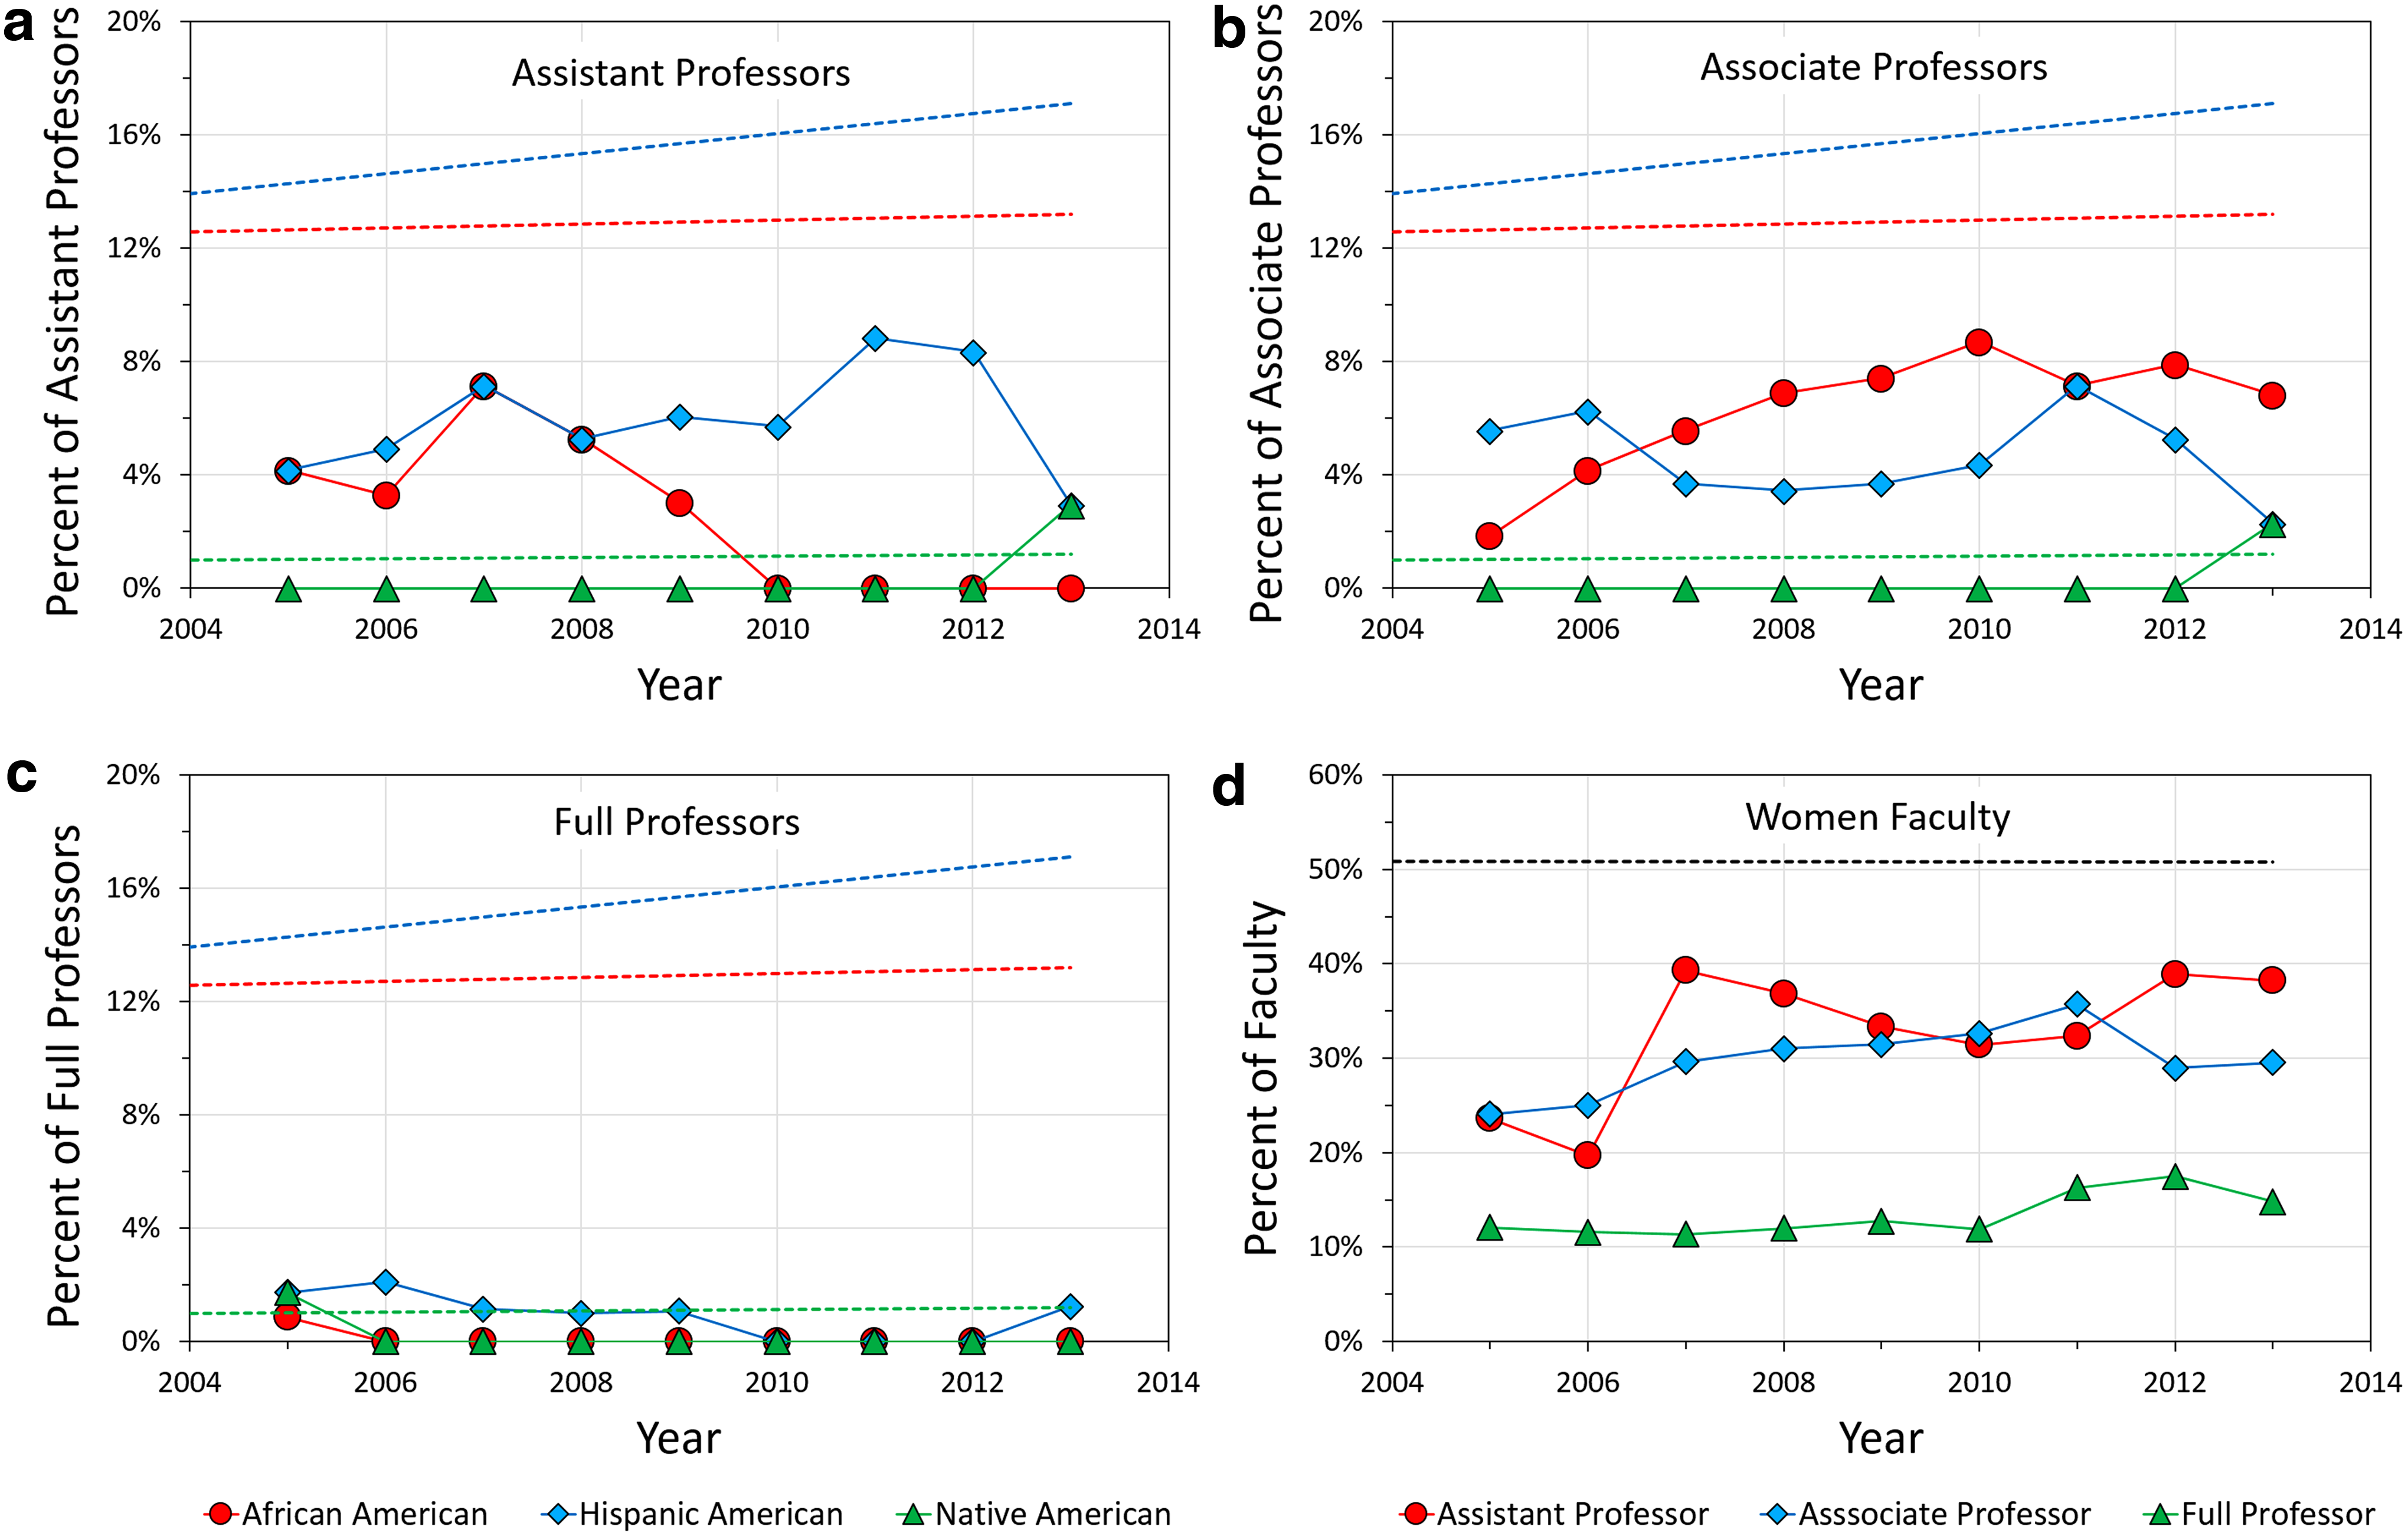
Ethnicity and race
The percent of women assistant professors has increased from 24% to 38% over the 2005–2013 period; furthermore, these effects can also be observed at the associate level, which grew from 24% to 30% women over the same timeframe. Promotion of women assistant professors to associate professors can be observed in the 2007–2011 window in Fig. 7. Regardless, no major impact has been observed at the full professor rank, where women only represented 15% of faculty members in 2013. The percentage of women earning PhDs and joining the faculty has consistently increased from 2001 (Table 4). Regardless of this improvement, these percentages are below national demographics (i.e., women comprised 50.8% of the US population in 2013; US Census Bureau, 2015). To better understand these trends, 4-year averages were calculated across 2001–2013. For the 2001–2004 period, women were awarded 27% of PhD degrees, and comprised 32%, 15%, and 7% of assistant, associate, and full professors, respectively; on the contrary, 40% of PhD degrees were awarded to women in 2010–2013 and 35%, 32%, and 15% of assistant, associate, and full professors, respectively, were women. The data on female assistant professors indicate that women are either less likely to apply for academic positions or to be hired into academia. Data from a variety of STEM disciplines align with these conclusions (Kaminski and Geisler, 2012; Moss-Racusin et al., 2012; Sheltzer and Smith, 2014).
Gender balance in underrepresented groups at student and faculty levels
While the discussion above has separately focused on the ethnicity, race, and gender demographics data, we also explored the intersection of gender, race, and ethnicity. The data for Caucasian women largely follow the trends described above for degrees awarded (Fig. 5) and faculty composition (Table 4). In other key demographic groups, such as African Americans, Hispanic Americans, and Native Americans, a clear decrease in the percentage of BS degrees awarded to women was observed compared with those earning PhDs (Table 5). Furthermore, the number of women faculty from underrepresented ethnic and racial groups is low. No reports of female African American or Native American faculty members were found in the ASEE database. Only one of the nine reported Hispanic American assistant professors was a woman. The absence of women full professors from underrepresented ethnic and racial groups in STEM is an issue that requires attention. In fact, similar data were found for civil engineering and chemical engineering faculty. Since the magnitude of faculty numbers reported for these related fields is greater than that of environmental engineering, the corresponding trends may be more meaningful. In particular, the chemical engineering dataset shows that women from underrepresented ethnic and racial groups are less present at the associate and full professor ranks compared with men from the same groups. Moving forward, these data indicate that we should not only encourage participation of students from underrepresented groups in environmental engineering programs, but also support increased opportunities for these students to enter, and succeed in, academia.
Note that a value of 50% indicates an equal number of women and men present at that rank for a particular ethnicity or race.
No entries in that category.
Data not reported.
Summary and Conclusions
From the above analysis, several major conclusions are presented:
• The number of environmental engineering BS, MS, and PhD degrees awarded has increased from 2005 to 2013. These rates have outpaced growth in the related disciplines of civil and chemical engineering. Over the 2005–2013 timeframe, 9593, 9801, and 1795 BS, MS, and PhD degrees were awarded in environmental engineering. Furthermore, the fraction of environmental engineering students that pursue advanced degrees is greater than the corresponding values in civil and chemical engineering. In particular, an average of 1.09 MS degrees and 0.24 PhDs were awarded for every BS degree over the 2005–2013 timeframe. • With increasing student enrollments, the apparent student-to-faculty ratio in environmental engineering programs has risen from 8 in 2005 to 35 in 2013, although this number may be artificially inflated due to differences in how students and faculty are counted in the ASEE database. These findings indicate the need for increased investment in the environmental engineering discipline and improved counting of environmental engineering faculty. • Hispanic American, African American, and Native American students are underrepresented in environmental engineering programs at all levels (i.e., BS, MS, and PhD). African Americans have particularly low representation, comprising only 3.1%, 4.2%, and 4.8% of BS, MS, and PhD enrollments (domestic-adjusted data) in 2013. On the other hand, of the underrepresented groups, Hispanic Americans exhibit the highest representation at the BS level (13.4%) compared with MS (8.3%) and PhD (11.5%) programs. Native American representation was relatively consistent at 0.5–0.6% of enrollments. In all cases, representation is below 2013 US demographics levels: Hispanic American (17.1%), African American (13.2%), and Native American (1.2%). • Retention of African American students in environmental engineering programs has shown a negative trend, especially in comparison with other demographics groups. These data suggest that targeted recruitment and retention activities should be undertaken to encourage and support African American students in environmental engineering. Based on the literature, efforts to actively promote diversity in the engineering curriculum may provide the most benefits. • The gender demographics of environmental engineering students have improved from 2005 to 2013. The percentage of environmental engineering BS, MS, and PhD degrees awarded to women was 46–47% for 2013. While these levels are still below US demographics (i.e., 50.8% women in 2013), representation of women in environmental engineering is much higher than in related disciplines. • Regardless of gains in gender diversity of students, environmental engineering faculty members are mostly Caucasian men. In 2013, 88% of full professors were Caucasian, and 85% were men. The 2005–2013 data suggest that African American assistant professors have been promoted to the associate level, but the pipeline of assistant professors has not been maintained. Advancement of women professors can be observed at the assistant and associate levels, although women comprise only 15% of full professors. These data indicate that more effort at increasing opportunities for underrepresented students, including women, to pursue academic positions is warranted to create a faculty more representative of the student body and country.
ASEE and EWC provide the most comprehensive databases for student, faculty, and practitioner demographics; however, these organizations only count students by degree name and faculty by department. Although NSF offers distinct programs in the environmental engineering arena, demographics data are not collected for the environmental engineering discipline. For all of these reasons, we, like Jones et al. (2005), call for more reporting of environmental engineering students and faculty as distinct categories in nationwide databases. These data could also provide insight into the demographics and growth of other subcategories of civil and chemical engineering, including structural, transportation, biochemical, and petrochemical, among others. Withstanding changes in ASEE reporting, environmental engineering organizations could also fill this pivotal knowledge gap by surveying degree programs. As environmental engineering continues to evolve into its own professional discipline, increased effort at data collection will prove helpful in improving outreach efforts and highlighting the field's contributions to society.
Footnotes
Acknowledgments
The authors acknowledge support from Mr. Brian Schorr from the AEESP Business Office for his assistance in collecting AEESP data. Our thanks for helpful discussions and feedback on draft articles are extended to the AEESP Board of Directors and the AEESP Membership and Demographics Committee. We also acknowledge the anonymous reviewers, whose comments helped to strengthen this article.
Author Disclosure Statement
No competing financial interests exist.
References
Supplementary Material
Please find the following supplemental material available below.
For Open Access articles published under a Creative Commons License, all supplemental material carries the same license as the article it is associated with.
For non-Open Access articles published, all supplemental material carries a non-exclusive license, and permission requests for re-use of supplemental material or any part of supplemental material shall be sent directly to the copyright owner as specified in the copyright notice associated with the article.