
Abstract
Abstract
Expanded granular sludge bed (EGSB) reactors are classified as third-generation anaerobic systems. They operate using a fluidized bed, which allows an increase in organic load, a decrease in hydraulic retention times, an increase in cell retention times, and higher treatment efficiencies compared with upflow anaerobic sludge blanket reactors. In this research, two EGSB reactors were employed and the upflow velocity, temperature, and organic load were varied. Reactors were operated with synthetic wastewater using a biodegradable substrate (dextrose). The residence time distribution of the reactor was analyzed using tracer tests. A temperature of 35°C influenced bacterial degradation kinetics, allowing an increase in the percentage of organic matter removal. At ambient temperature, a removal of 89.49% was obtained with an organic loading rate (OLR) of 3.39 kg/m3·day, while at 35°C the best removal was 93.98% with a higher OLR (4.23 kg/m3·day). Recirculation in reactors improved fluidization of the bed and mixing, favoring granulation of biomass and allowing operation of reactors under a fully mixed tank model. Biomass granulation improved settleability and made the process more efficient. It was found that an upflow velocity of 6 m/h at ambient temperature produced a high removal of chemical oxygen demand (96.83%).
Introduction
U
To improve contact between the sludge and the wastewater and use the entire volume of the reactor efficiently, expanded granular sludge bed (EGSB) reactors were developed. EGSB reactors have improved performance compared with UASB reactors due to their high height/diameter ratio (Van der Last and Lettinga, 1992) and recirculation. The significant height to diameter ratio of about 25 allows EGSB to withstand high organic loads (up to 30 kg chemical oxygen demand [COD]/m3·day) (Valdés, 2008) and independently manage hydraulic retention time (HRT) with respect to cell retention time due to the granular form in which the microorganisms are arranged and the recirculation of a large portion of the effluent. Unlike the case of UASB reactors, this recirculation causes the reactor to operate at a faster surface speed of between 4 and 10 m/h (Seghezzo et al., 1998; Valdés, 2008). The expanded sludge bed uses sludge that is granular, very active, and with good settleability. The mixing pattern is different to UASB reactors due to the greater upflow velocity (Vup) and increased gas production (m3 of gas/m2 of reactor area), which leads to more efficient contact between the sludge and the wastewater.
Due to the improved interaction between the granules and the nutrients, the reactor can operate at lower temperatures (below 35°C) than conventional reactors. Biomass or consortia of bacteria are available in granular form from 1 to 5 mm in diameter, making it possible to keep them suspended in the reactor bed without a separation phase. Furthermore, due to the formation of granules, the diffusion of nutrients limits the rate of consumption or degradation of the system, a situation which is improved due to the high surface velocity in these reactors (Van Haandel et al., 2006; Gaete, 2007).
The conversion of organic matter in any kind of reactor is governed not only by the performance of microbiological processes, but also by the reactor hydrodynamics. The mixture in the system influences the contact between the biomass and the substrate, and therefore improves or decreases the efficiency (Zeng et al., 2005). The piston flow reactor is characterized by the fact that the substrate flows through the reactor without mixing with any other element, whether at the front or the back. In other words, there is no diffusion of particles along the flow path, meaning that the HRT for each element is the same throughout the reactor. In the complete mix reactor, the influent is well stirred and consequently the effluent has the same composition both inside and outside the reactor (Levenspiel, 1999).
In this article, optimization and evaluation of the operating conditions of two EGSB anaerobic reactors for the removal of organic matter was carried out by varying the organic loads, Vup, and operating temperature of the reactor.
Materials and Methods
EGSB reactors
Two acrylic EGSB reactors with a working volume of 15.2 L each were used, in accordance with studies carried out by Londoño et al. (2012) and López-Fernández et al. (2011). Each reactor was composed of 2 U: an upper portion with a diameter of 23.5 cm, which had a gas-collecting bell to promote gas–liquid–solid separation (Fig. 1a), and a thin cylinder with a diameter of 6.4 cm and a height of 152 cm (height/diameter ratio of 24), where the fluidization of the granular sludge took place. The total height of each system was 191 cm. Each reactor had two Masterflex System model No. 7553-70 (6–600 rpm) peristaltic pumps, responsible for controlling the feed rate and recirculation (Londoño et al., 2012) and two tedlar bags with a capacity of 5 L for methane storage (Fig. 1b). In the 6.4-cm diameter reactor cylinder, five sampling points were installed with 3/8″ valves (Fig. 1b) to extract different samples and carry out sludge profiling. The influent entered the reactor at the bottom (controlled by a peristaltic pump) and was uniformly distributed through a perforated plate. At the top the reactor had two output devices; one responsible for recirculating part of the effluent (connected to a peristaltic pump, which regulated the recirculation flow rate) and another one, for the effluent stream.

Diagram of EGSB reactor used in this study.
For the tests at 35°C, a bath was connected to a thermocouple that allowed the water temperature to be kept constant. Hot water was then recirculated around the reactors in the form of an external coil. This system was built by the Alternative Energy group at the University of Antioquia (Faculty of Engineering—Mechanical Engineering Department).
Characterization of biomass
Two EGSB reactors were each inoculated with a 4 g/Lreactor concentration of volatile suspended solid (VSS) anaerobic sludge from the UASB reactor of a wastewater treatment plant of the Colanta dairy company, located in the municipality of San Pedro, Antioquia (Colombia). The physicochemical characteristics of the sludge were: total suspended solid (TSS) 50.97 g/L; VSS 45.76 g/L; a VSS/TSS ratio of 0.90; a sludge volume index (SVI) of 69 mL/g; a sedimentation velocity (Vs) of 44.3 m/h; a density of 38.78 g/L, and an average granule diameter of 0.74 mm.
Preparation of synthetic water
For the monitoring of the reactors, synthetic wastewater was used to evaluate their performance under different loads of organic matter, without taking into account variables that can be added by the wastewater. As such, 20 L of synthetic water was prepared daily, composed of 20 g of sodium bicarbonate, 1 g of urea, 20 mL of macronutrients, and 20 mL of micronutrients. The amount of dextrose added depended on the experimental design, since at each stage the organic load of the reactor (Table 1) was increased. The preparation of macronutrients was: 50 mg/L H3BO3; 2,000 mg/L FeCl2·4H2O; 50 mg/L ZnCl2; 500 mg/L MnCl2·4H2O; 30 mg/L CuCl2·2H2O; 50 mg/L (NH4)6Mo7O24·4H2O; 90 mg/L Al2(SO4)3; 2,000 mg/L CoCl2·6H2O; 100 mg/L NaSeO3·5H2O; 100 mg/L EDTA; 0.1 g of Resazurin; 1 mL HCl (37%); and 50 mg/L NiCl2·6H2O.
Average ambient temperature.
Value rounded to 0.255 m/h.
COD, chemical oxygen demand; EGSB, expanded granular sludge bed; OLR, organic loading rate; VSS, volatile suspended solid; Vup, upflow velocity.
Variation of organic load and temperature
Tests were divided into five stages in which the organic loading rate (OLR) was progressively increased in each reactor from 0.85 to 4.23 kg COD/m3·day (Table 1). The EGSB 1 (E1) reactor was left at room temperature (average 24°C ± 3°C) and EGSB 2 (E2) was left at 35°C ± 2°C. During the start-up phase, both reactors operated without recirculation with an average flow in the influent of 13.65 mL/min, giving rise to an average Vup of 0.255 m/h.
Variation in upflow velocity
For the second stage, after selecting an OLR of 3.39 kg COD/m3·day (see results and analysis) and an average ambient temperature of 24°C ± 3°C, the Vup was varied by increasing the recirculation flow. E1 operated with two lower velocities and E2 operated with higher velocities. Both reactors started from a Vup of 0.255 m/h (Table 2).
Value rounded to 0.255 m/h.
Tracer tests
A test using potassium bromide (KBr) as a tracer was performed to determine the hydraulics of the EGSB reactors. The procedure involved adding an instant dose of 4 mg/L of KBr to the reactor. The tests were carried out for 3 days to comply with the minimum ratio of two times the theoretical HRT. Synthetic water was constantly fed into the flow. This corresponded to the following experimental design; in the E1 reactor the Vup was 0.255 m/h and in the E2 reactor the Vup was 6.0 m/h.
Physiochemical analysis
The following information was determined from the experiments: COD, ammonium (NH4+), total phosphorus, partial alkalinity, total alkalinity (TA), intermediate alkalinity (IA), pH, and volatile fatty acids (VFAs) (acetic, propionic, and butyric acid), following the protocols established in the Standard Methods (APHA, 2012). Methane was determined using an Agilent gas chromatograph (model 6890) with a flame ionization detector. An HP-PLOT Q column with a 30 m × 0.32 mm internal diameter was used. The furnace temperature was maintained at 40°C, the detector temperature at 300°C, and the nozzle at 250°C. The carrier gas was helium at a flow rate of 54 mL/min. The injection was performed in split mode. The retention time of methane during the chromatographic analysis was 2.43 min.
Analysis of biomass
The following parameters were evaluated: TSS and VSS according to protocols established in the Standard Methods (APHA, 2012). SVI, particle size, and bulk wet density of the granules using Reactive Blue Dextran were evaluated according to Molina et al. (2008). The samples for determining TSS and VSS were collected at different levels along the reactor length to determine the respective sludge concentration profiles. These measurements were made at each experimental phase.
COD mass balance
The COD balance was calculated following Equations (1) to (4) (von Sperling and Chernicharo, 2005), where CODcel is the fraction of COD in the influent, which is converted into new cells (mg/L), CODCH4 is the fraction of COD in the influent converted into methane (mg/L), CODVFA is the fraction of COD still present as VFAs in the effluent (mg/L), CODrec is the fraction of COD that cannot be degraded by the microorganisms (mg/L), and CODbd is the biodegradable fraction of COD.
Analysis and Discussion
Variation of OLR
Influent COD (CODi) was the same for both reactors (Fig. 2) as the feed was prepared in the same container and subsequently divided between both reactors.
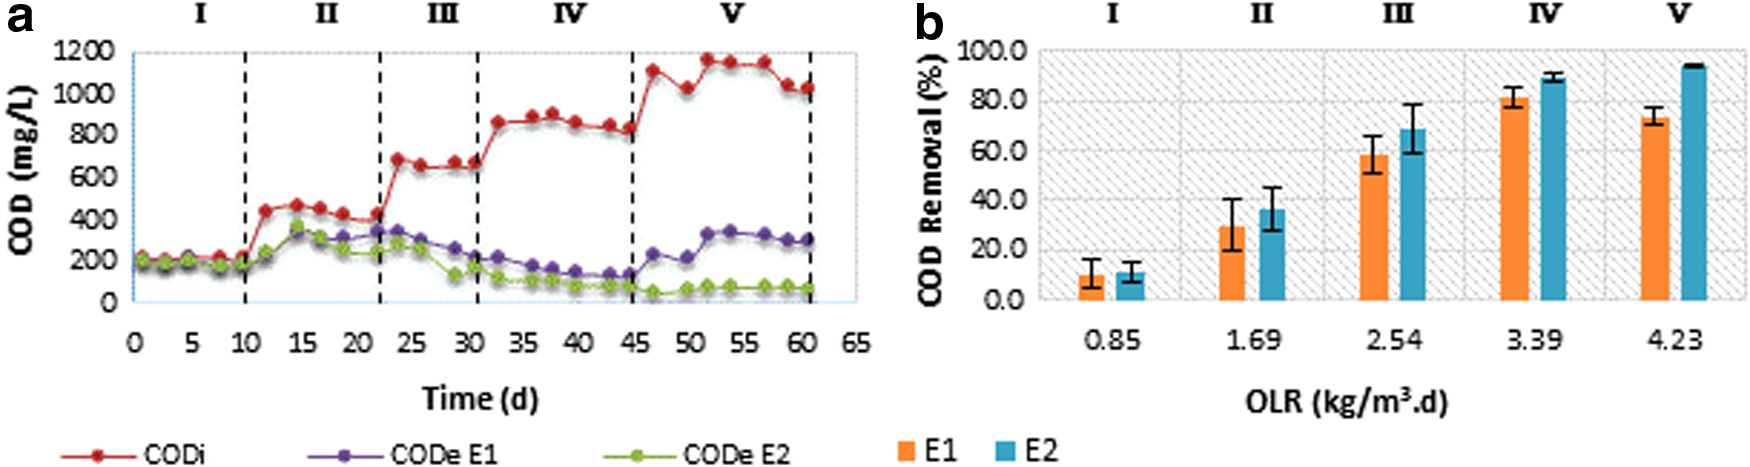
Variation of COD in E1 (ambient temperature) and E2 (35°C).
Reactors in stage I had very similar COD concentrations in the effluent (CODe) and in the influent for both reactors; E1 and E2, indicating similar start-up conditions for both reactors. In stage I, the removal was 10.60% for E1 and 10.95% for E2. There was no significant difference between reactor E1 at room temperature and E2 at 35°C (p < 0.05) in this first stage. During stage II, there was increased removal of COD relative to the first stage, and a difference in COD removal between the two reactors: 30.02% for E1 and 36.42% for E2, indicating that the bacteria had begun to increase the quantities of biomass present in the reactor. Although the removal in E2 was slightly higher than in E1, there was no statistically significant difference between the results (p < 0.05). In other words, the change in temperature had no influence for an OLR of 1.68 kg/m3·day. Stage III shows an increase in the removal of COD and also an increase in the difference in removal between both reactors. Removal percentages of 58.31% and 68.98% were achieved for E1 and E2, respectively (Fig. 2b). Statistically, the removal percentages are not significantly different (p < 0.05). In stage IV (OLR of 3.39 kg/m3·day) the removal increased considerably to 81.49% for E1 and 89.19% for E2. At this stage, there was a statistically significant difference between the reactors, indicating that at 35°C the rate of degradation of organic matter by microorganisms was higher, leading to a greater removal. Finally, in stage V, the OLR increased to 4.23 kg/m3·day and the removal percentage decreased to 73.85% for E1. This indicates that in such conditions and at room temperature, the microorganisms may be affected by organic overloading. As a result, accumulations of VFAs occur during the acidogenesis stage and there is a lower pH, which affects the methanogenic archaea. In contrast, the E2 reactor had a removal of 93.98%. The increased removal indicates that, at a temperature of 35°C, the rate of degradation by microorganisms is greatly promoted, avoiding accumulations of VFAs that affect the process. Statistically, there is a significant difference between the two reactors.
VFAs and acetic, propionic, and butyric acids (Fig. 3) in the effluent were evaluated. The results were converted into COD to make calculations and to compare them to the effluent COD.
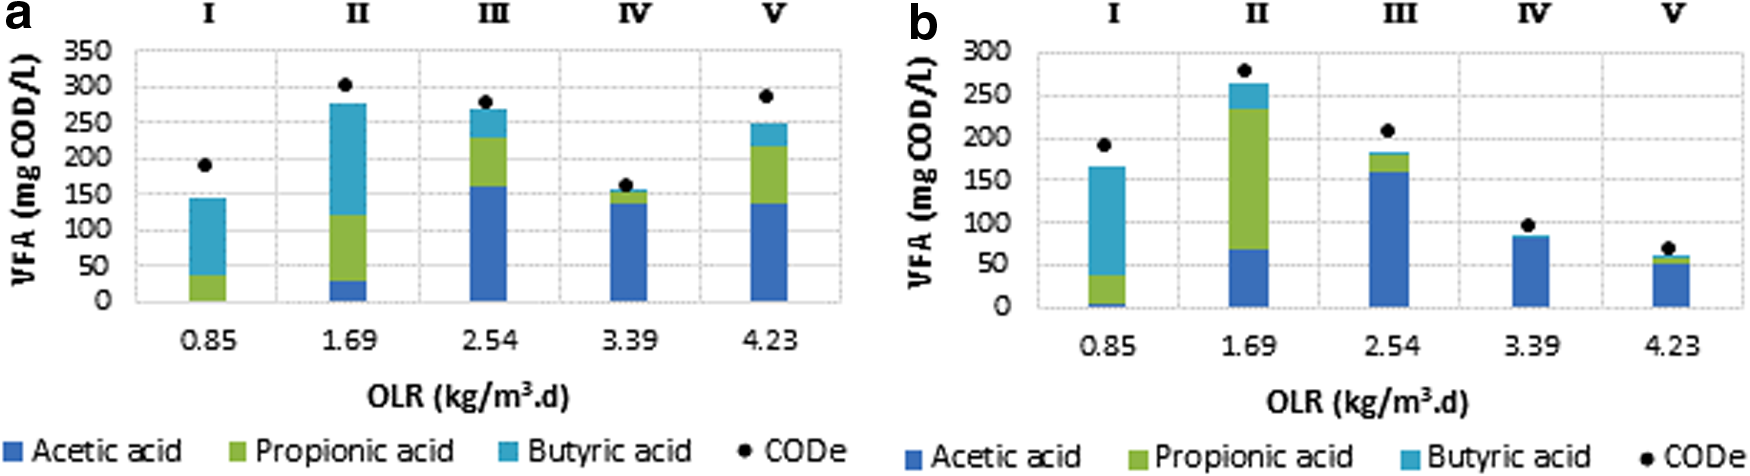
Variation of VFAs and the CODe.
In the E1 reactor, from stages I to IV (Fig. 3a) there is a progressive increase in the amount of acetic acid, but a decrease in butyric and propionic acids, indicating a transformation of the initial glucose to the shorter-chain VFA (acetic acid). In stage I, a lot of the remaining organic matter was present as butyric acid, showing that the bacteria failed to fully transform into acetic acid. This means that the methanogenic archaea did not have enough substrate to transform it into methane. In contrast, stage IV had the best COD removal. The organic matter not removed was converted into acetic acid and a small portion remained as propionic acid. When comparing the sum of VFAs and CODe, it can be seen that in some stages there was a small concentration of CODe that was not quantified as VFAs. In these cases, the difference between CODe and the VFAs may indicate the presence of COD that was not removed due to the acclimation of the bacterial and the increase in the quantity of biomass in each stage of operation of the reactors. In stage I of the E2 reactor (Fig. 3b), the same situation occurred as in the E1 reactor. This is because in the start-up stage, the bacteria were not carrying out the transformation of compounds efficiently. However, in the following stages (II, III, IV, and V) the remaining COD was mainly due to the presence of acetic acid, indicating that the transformation of compounds through anaerobic processes was highly efficient, taking into account that this is only one of numerous methanogenic pathways known. Figure 4a shows the behavior of the pH of the effluent and the IA/TA ratio.
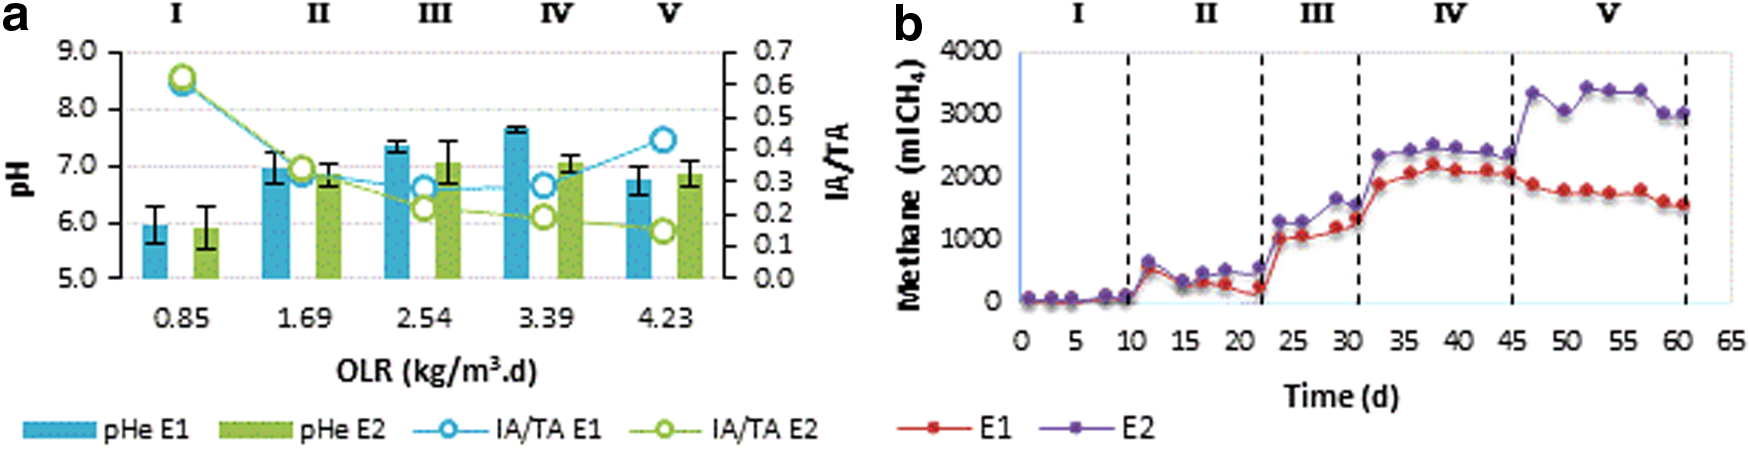
Variation of the pH, alkalinity, and methane production.
Until stage IV of the E1 reactor, the IA/TA ratio decreased as the pH increased. The IA/TA ratio began at a very high value (0.61 on average) and reached a value of 0.29 in stage IV, where the best removal was observed. Authors such as Molina et al. (2008), Ripley et al. (1986), and Jenkins et al. (1983) have reported that the best IA/TA values are under 0.3. During stage V of the E1 reactor, the removal decreased as the pH dropped, and the IA/TA ratio increased due to the accumulation of VFAs. In the E2 reactor, the pH gradually increased to a value of about 7.04 during stages III and IV, and the IA/TA ratio decreased after the reactor start-up. This showed good conditions for the degradation of organic matter.
Regarding methane production (Fig. 4b), over time the E2 reactor generated greater volumes of methane than the E1 reactor. In general, there was low methane production in stage I (56.79 mL CH4 for reactor E1 and 72.73 CH4 mL for reactor E2), compared with the other stages of reactor operation, and as the OLR increased, the volume of methane also increased. In the case of reactor E2 (35°C), the methane increased until the final stage, confirming that the organic material removed was converted into methane. For the E1 reactor, methane increased until stage IV, which was the stage that gave the best performance. In stage V, as was expected, methane production decreased due to the decrease in the removal of COD and the presence of butyric and propionic acid in the effluent, indicating that complete degradation of organic matter was not being achieved.
A mass balance for COD was performed in both reactors. For the E1 reactor, the amount of methanogenized COD (CODCH4) (Fig. 5a) progressively increased until stage IV, whereas both the CODVFA and the CODrec decreased, showing that the microorganisms were acclimatizing to the substrate. This resulted in a greater anaerobic efficiency in the methanogenization of organic matter. In stage V, the methanogenized COD decreased, and conversely, there was an increase in VFAs and part of CODrec. An organic overload may have caused this accumulation of VFAs and led to inactivation of methanogenic archaea, preventing the final conversion into methane. For the E2 reactor (Fig. 5b), the methanogenized COD increased until stage V, whereas the CODVFA decreased. An OLR of 4.23 kg COD/m3·day (stage V) was found to be suitable for this process at 35°C. It is possible that at even greater OLR values, the organic matter removal process is able to continue adequately. In contrast, for the E1 reactor, the best conditions for COD methanogenization occurred at an OLR of 3.39 kg COD/m3·day. The process was affected at OLRs above this value. In the case of the CODcel, the results were very similar for both reactors, with slightly higher values for E2 than E1, except in stage V. These results indicate that in general, microorganisms for cell growth use low concentrations of COD. However, it is important to note that anaerobic microorganisms have low anabolism, which explains why the production of biomass in these systems is lower than in aerobic systems.

COD results for each reactor.
The best stage of operation for E1 (operated at room temperature) was stage IV, with an OLR of 3.39 kg/m3·day, whereas for the E2 reactor (operated at 35°C) stage V was the best, with an OLR of 4.23 kg/m3·day. The results show that temperature had an effect on the degradation kinetics and growth of microorganisms. For a reactor operated without recirculation and at 35°C, it is possible to operate with loads in the range of 4.23 kg/m3·day and still achieve good efficiencies. In contrast, because at room temperature the kinetics were slower, at loads greater than 3.39 kg/m3·day, the VFAs began to accumulate and the system's efficiency was adversely affected. While an OLR of 4.23 kg/m3·day is suitable for processes at 35°C, the literature reports that EGSB reactors are able to treat higher OLRs, in the order of 30 kg/m3·day (Valdés, 2008). However, in this work, previous studies by López-Fernández et al. (2011) were taken as a reference as they employed an EGSB reactor with the same dimensions and found a maximum removal of 75% with an organic load of 2.76 kg/m3·day at 30°C.
Variation in upflow velocity
For the second part of the tests, the variation in the Vup was evaluated by increasing the recirculation flow rate at room temperature and using an OLR of 3.39 kg/m3·day, as this value presented the best removal percentages in the load variation tests. As the objective was to determine the best upflow velocity to perform the tests and verify whether an increase in Vup was able to match or increase the system efficiency obtained by operating at 35°C, room temperature was used. Vup of 0.255 m/h (without recirculation), 2.000 m/h, 4.006 m/h, 6.024 m/h, and 8.008 m/h with a recirculation flow of 92.73 mL/min, 199.68 mL/min, 307.33 mL/min, and 413.12 mL/min from 2.000 m/h at 8.008 m/h, respectively were evaluated.
Figure 6 shows the variation of COD in the influent and effluent, and the COD removal rates achieved. In terms of the concentration of CODe (Fig. 6a), for a Vup of 0.255 m/h (without recirculation) a mean value of 135.45 mg/L was obtained, which progressively decreased to a concentration of 27.27 mg/L with a Vup of 6 m/h. For 8 m/h the Vup concentration in the effluent increased again. Regarding the removal percentages (Fig. 6b), the greatest removal was 96.83% with a Vup of 6 m/h, whereas for a Vup of 0.255 m/h (without recirculation), a percentage of 84.03% was obtained. Recirculation is a factor that enhances the efficiency of EGSB processes because fluidization of the bed increases the contact between the bacteria and the substrate.
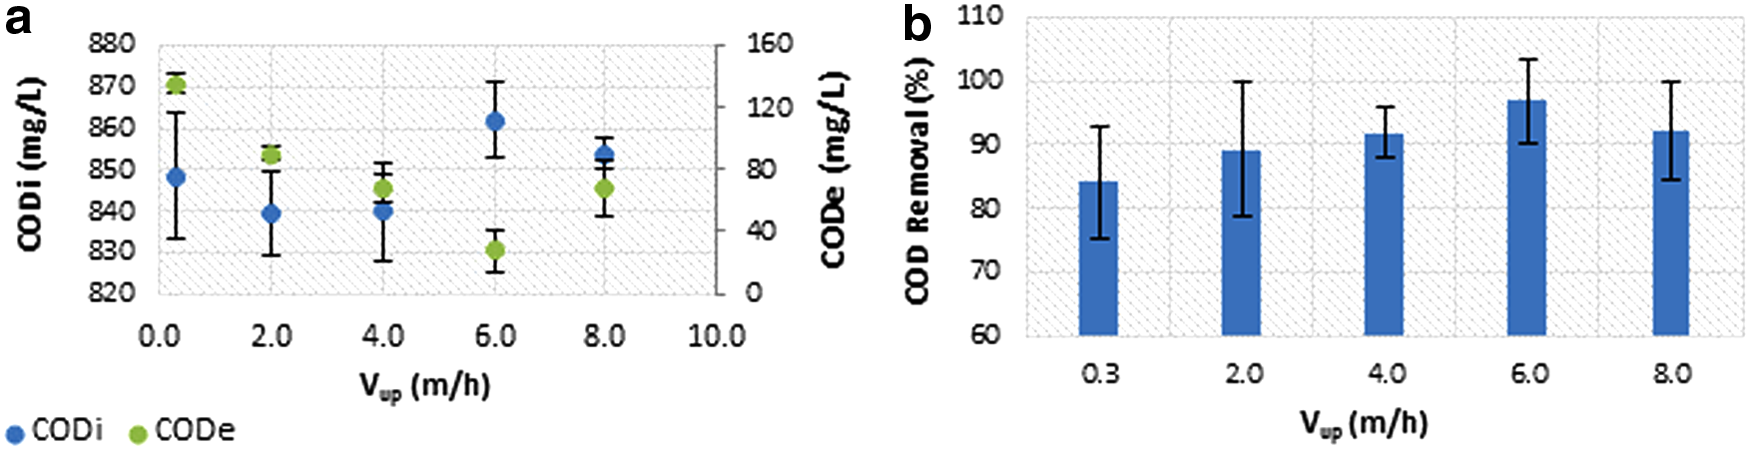
Variation of COD with respect to the Vup.
When comparing all of the evaluated recirculation velocities with the Vup without recirculation (0.255 m/h), it can be seen that in general most of the organic matter left in the effluent was in the form of acetic acid (Fig. 7), along with small proportions of propionic and butyric acid. When comparing the sum of VFAs with CODe, almost all of the CODe was present as VFAs. The lowest CODe was presented for a Vup of 6 m/h, where 95% remained as acetic acid.

Variation of VFAs and CODe with respect to Vup.
Figure 8a shows the variation of pH and the IA/TA ratio, with the pH in the influent remaining very constant (all values were in the range of pH 8.00–8.12). However, in the effluent the pH decreased, indicating VFA formation through the transformation of organic matter. In general, the IA/TA ratio remained below 0.3, which is favorable for anaerobic degradation processes. Figure 8b shows the production of methane for each Vup. As the methane production increases, the Vup also increases. This pattern continues up to Vup of 6 m/h, and by 8 m/h, the methane production decreases slightly, which is consistent with the values for organic matter removal.
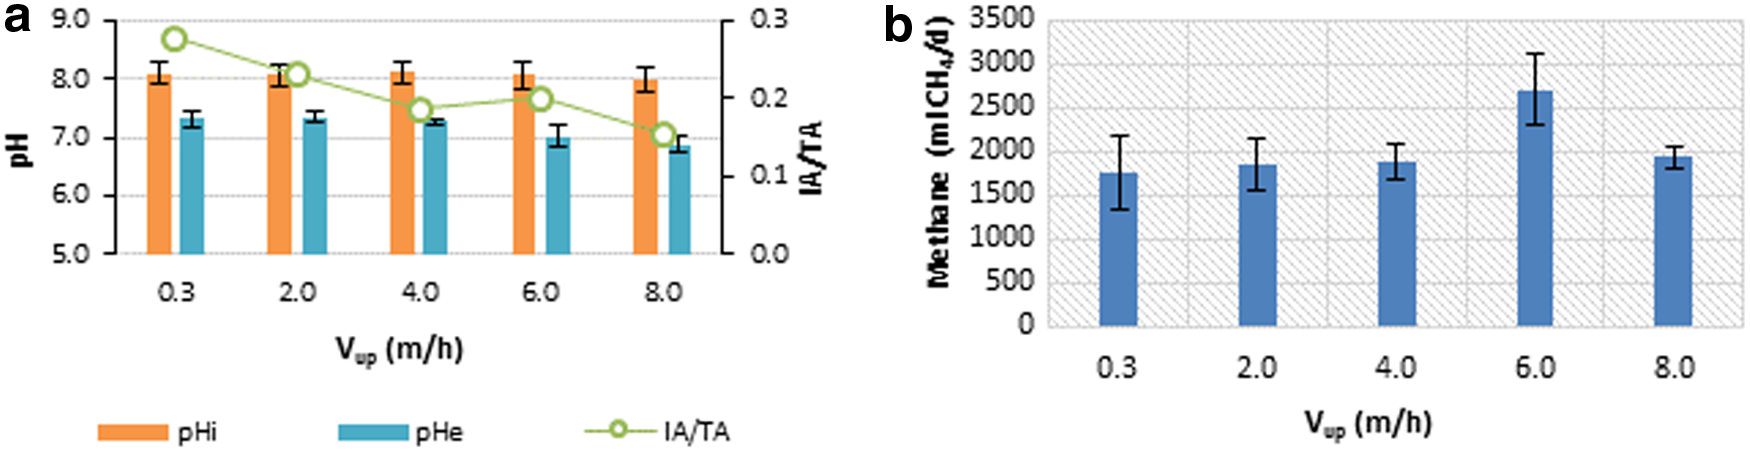
Variation of pH, alkalinity, and methane production.
The mass balance (Fig. 9) showed that as the Vup increased, the amount of methanogenized COD also increased, and conversely, the CODVFA decreased. This pattern continued with upflow velocities up to 6 m/h, but at 8 m/h the methanogenized COD slightly decreased and the amount of CODVFA increased compared with the previous values.
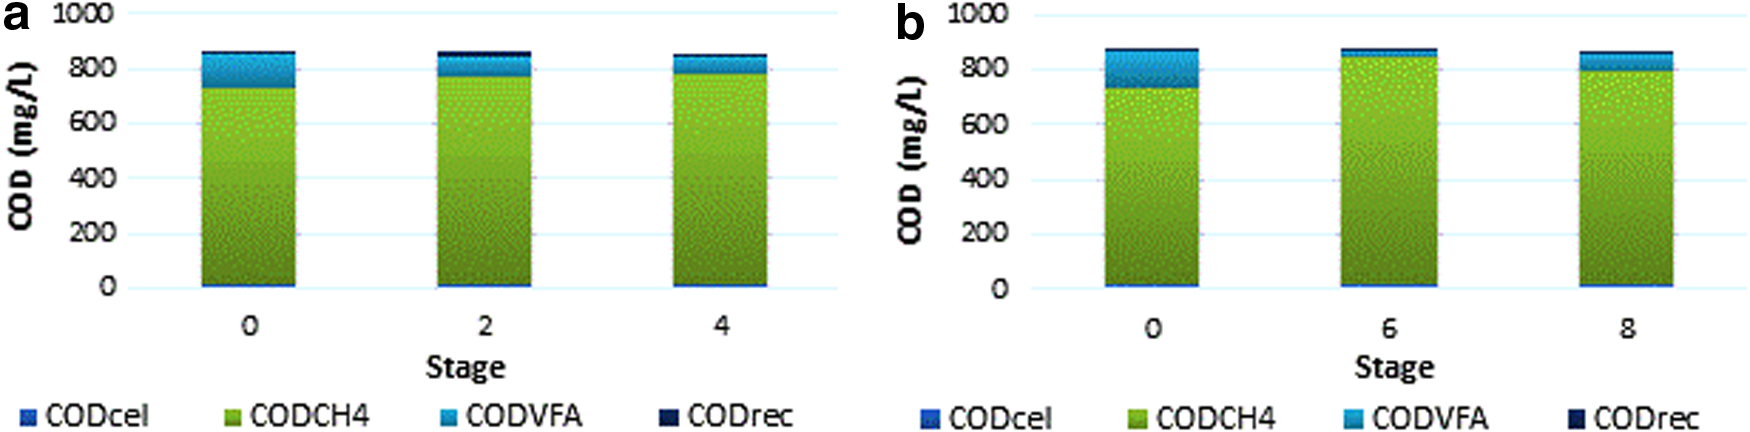
Results of COD for each reactor at different upflow velocities.
Vup has a very important influence on the efficiency of the EGSB reactors. A high efficiency (96.83%) was achieved when the Vup increased to a value of 6 m/h. However, for higher values there was a decrease in efficiency, which can be attributed to the breaking of the granules and loss of sedimentation of the biomass. On the other hand, at 35°C, maximum COD removal (93.98%) was achieved, with a Vup of 6 m/h. This indicates that it is possible to increase system efficiency using recirculation to ensure better contact between the microorganisms and the biomass.
Figure 10a shows the variation of settleability and density of the biomass granules. Regarding the SVI, good settleability was observed for all the velocities evaluated. However, when comparing each Vup it was found that up to 6 m/h (SVI of 21 mL/g) the SVI decreased as the Vup increased. By 8 m/h the SVI increased, although it continued to present good settleability. As expected, Vs is inversely proportional to the SVI, and therefore, it increases progressively up to Vup 6 m/h. The density increased significantly from 36.01 g/L for a Vup of 0.255 m/h (without recirculation) to 55.19 g/L for a Vup of 6 m/h. This shows an improvement in the granulation conditions of the biomass. The density is also associated with the size of granules, and Fig. 10b clearly shows increased granulation as the Vup increases to 6 m/h, passing from an average diameter of 0.72 mm at 0.255 m/h to 3.92 mm at 6 m/h.

Results of sludge analysis.
Figure 11 shows images of the EGSB reactor operating at 6 m/h. Biomass granulation can be observed, which considerably improves particle settleability and density, and therefore, the efficiency of the process.

Images of the reactors operated at a Vup of 6 m/h.
To determine the TSS and VSS, sludge profiles were made before the end of each stage (Fig. 12). As the upflow velocity increases the sludge profile changes, making the biomass more evenly distributed through the reactor column. For a Vup of 0.255 m/h (without recirculation), the sludge is located in the top 0.8 m of the reactor (Fig. 12a) and in the last few meters there is a small amount of biomass, although in a very low concentration. This indicates that there is not a homogeneous distribution, and there is a lack of settleability in the sludge. For the other Vup values, it can be seen that the distribution of biomass is increasingly homogeneous as the effluent is recirculated (Fig. 12b–d). This suggests that there are characteristics of mixing and fluidization present in the sludge. In fact, for a Vup of 6 m/h, the concentration of TSS and VSS was almost the same throughout the column. For a Vup of 8 m/h (Fig. 12e), the sludge profile shows that the velocity is so high for the evaluated reactors that the greatest concentration of solids is distributed in the highest areas, that is, the thrust of the water puts pressure on the biomass, preventing its settleability.
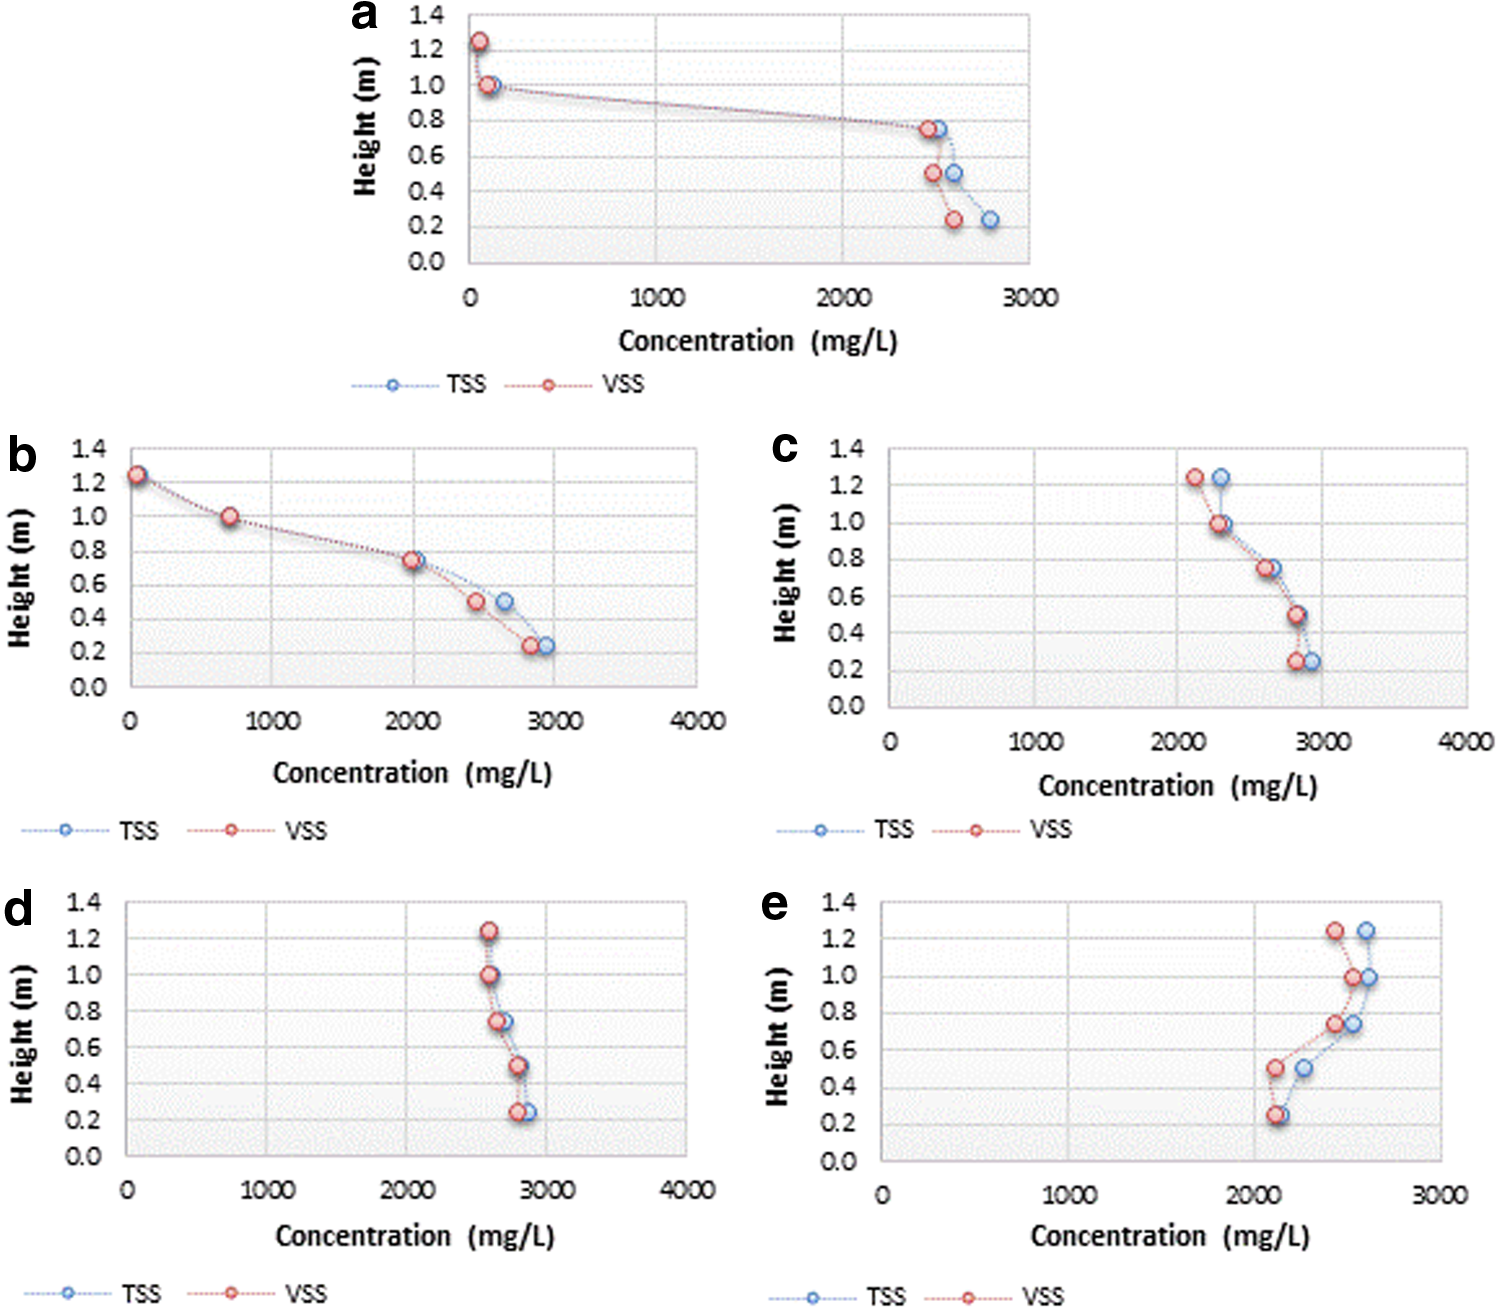
Sludge profiles made before finishing each stage.
Residence time distribution
Residence time retention (RTD) analysis was performed using KBr as a tracer, and the quantification of bromide was carried out by ion chromatography. Figure 13 shows the curves obtained using the dimensionless concentration of the normalized tracer (CΦ) versus the dimensionless time (Φ).
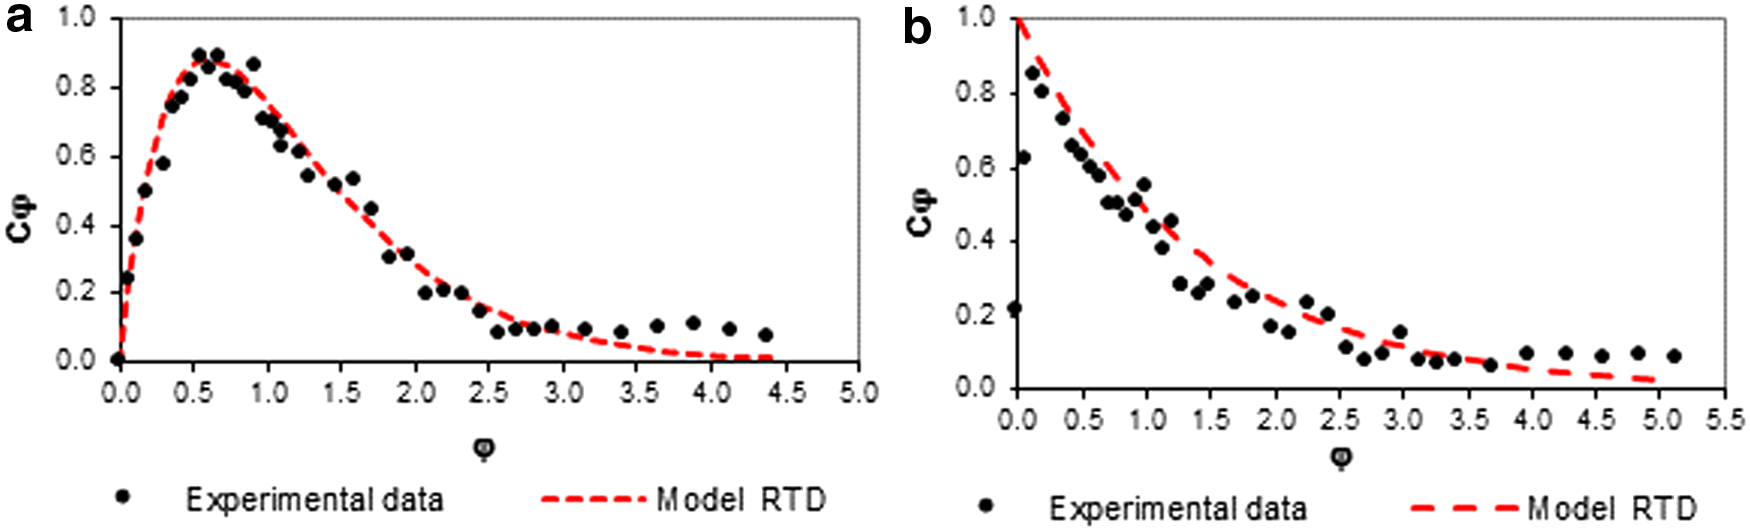
Analysis of RTD model. The dots represent the experimental data obtained and the red line represents the theoretical model.
Figure 13a shows the RTD curve obtained using a Vup of 0.255 m/h (without recirculation) and two complete mix reactors in series. Dispersed behavior tending toward a plug flow system was shown. It should also be noted that since remnants of the tracer can be seen for both tests in the tail of the curve, the entire tracer clearly did not leave the reactor. The tracer (KBr) could be absorbed in the granules, since the granules are porous, most likely the bromide added as tracer must have diffused inside the granules, and remained in the liquid core, thus introducing a tracer error, this might be the reason why, on Fig. 13, the tail of the tracer curve never got to zero. Figure 13b shows the RTD curve for a Vup of 6.0 m/h, showing behavior similar to a complete mix reactor. This test verified that recirculation has a considerable effect on the hydraulics of the reactors, which favors the degradation of organic matter. The RTD found for a Vup of 0.255 m/h was 23 h and for a Vup of 6.0 m/h it was 18 h. RTD studies performed by Brito and Melo (1997) found that the mixing properties of the EGSB reactors favor a continuous flow-stirred tank model. In general, high interstitial velocity tends to increase the plug flow characteristics, but recirculation increases the mix. This effect is predominant in EGSB reactors and has also been proven by Rodrigues et al. (1983).
Conclusion
It was found that at room temperature the best OLR for the EGSB reactors used in this experiment was 3.39 kg/m3·day, giving a removal of 89.49%. In contrast, at 35°C the best OLR was much higher (4.23 kg/m3·day), giving a removal of 93.98%. Both tests were without recirculation. Recirculation in reactors had a positive influence, improving the fluidization of the bed, which was proven by the sludge profiles made throughout the EGSB column. It was found that increasing the fluidization of the bed the mixing phenomenon is favored and, therefore, increases the granulation biomass, improving the decantation and, therefore, process efficiency. A Vup of 6 m/h at room temperature favors removal, giving a COD removal percentage of 96.83%. Finally, the test RTD makes it possible to establish that when operating under recirculation conditions, a model of completely mixed tanks is preferable, whereas without recirculation a plug flow with dispersion model is more appropriate. This leads to the conclusion that EGSB reactors have good contact with the biomass and, therefore, greatly improve the efficiency of the degradation process.
Footnotes
Acknowledgments
The authors wish to thank the GDCON group of the University of Antioquia for funding this research. The study was financed by the 2015–2016 sustainability fund of the Vice Presidency for Research of the University of Antioquia.
Author Disclosure Statement
No competing financial interests exist.