
Abstract
Abstract
Presence of excess nitrate in groundwater is threatening to public health. A novel three-dimensional electrolysis reactor (3D-ER) packed with activated carbon and foamed copper was investigated for enhanced electrolytic reduction of nitrate. Research results of linear sweep voltammetry and potentiostatic electrolysis showed that nitrate was first reduced to nitrite and then further reduced to ammonia or nitrogen gas. During batch electrolysis in nonchloride media at 2.0 A, nitrate could be successfully removed with a first order kinetic constant of 0.465 L/(h·A) and 36% selectivity to nitrogen gas using 3D-ER, which were six times faster than a two-dimensional electrolysis reactor (2D-ER). Addition of 300 mg/L chloride led to a 56% decreased nitrate removal rate, but enhanced removal of total nitrogen to 86%. Higher initial nitrate concentrations, currents, and lower chloride concentrations were beneficial for nitrate removal. 3D-ER can be successfully applied to groundwater treatment with nitrate reduction from 19.9 to 9.0 mg N/L within 6 h, which meets the standard for drinking water sources. This research presents a path forward for removal of nitrate using a nonbiogenic method, which is needed for water sources such as groundwater.
Introduction
R
World Health Organization recommends a maximum limit of 50 mg NO3−/L for adults and 15 mg NO3−/L for infants in drinking water (WHO, 1998). A standard of 10 mg N/L (equal to 44 mg NO3−/L) is set for drinking water in both the United States (USEPA, 2004) and China (GB 5749-2006). For these reasons, intensive investigations have been carried out to improve the removal of nitrate from groundwater, as well as wastewater.
Denitrification, which is the reduction of nitrate to nitrite and subsequently to nitrogen gas through other intermediates, has been widely used around the globe to remove nitrate from wastewater and nitrate-contaminated groundwater (Ghafari et al., 2008). Other physical and chemical processes include reverse osmosis (Siavash and Saeid, 2010), ion exchange (Primo et al., 2009), electrochemical processes (Talhi et al., 2011), activated carbon adsorption (Nunell et al., 2012), metallic iron-aided abiotic nitrate reduction (Huang and Zhang, 2004), and the combination of two or more of these methods (Pérez et al., 2012).
Biological denitrification, in which nitrate is reduced to nitrogen gas either by heterotrophic or autotrophic bacteria, is a robust process, but is hampered by challenges like the need for frequent adjustments of the pH, and in the case of heterotrophic denitrification, the requirement of the presence of readily-biodegradable organic carbon (Lacasa et al., 2011). Furthermore, bacteria-mediated nitrate reduction may not be suitable for drinking water. Membrane and ion exchange processes seem a viable option for nitrate removal, but these processes produce concentrated waste brine in a subsequent regeneration or back flushing procedure that requires a complementary treatment before discharge (Ghafari et al., 2008; Lacasa et al., 2011; 2012a).
Recently, electrochemical technologies such as electrocoagulation, electrodialysis, electrocatalysis, and electrolysis have been the focus of many researchers because they show promise to have a lack of sludge production, smaller footprint, relatively low investment costs, tolerance for high concentrations of nitrate, and high efficiency in removing nitrate from water, all while being easy to operate (Li et al., 2009; Lacasa et al., 2012b). Moreover, simultaneous disinfection is frequently observed due to the generation of active chlorine during electrolysis of chloride ion, whose concentration depends on the water origination.
Electrolytic reduction of nitrate has attracted increasing attention for the treatment of concentrated brines from water desalination (Bosko et al., 2014), groundwater (Zhou et al., 2009; Huang et al., 2013; Dash and Chaudhari, 2005), aquaculture wastewater (Mook et al., 2012), low level nuclear wastes (Genders et al., 1996; Katsounaros et al., 2009), and other applications. The removal efficiency and by-products generated during electrolytic reduction of nitrate depend on the electrode material, current density, electrolyte concentration, etc (Lacasa et al., 2012b). Many researchers have reported the use of different electrode materials to elevate the nitrate removal effect and avoid as much as possible the formation of side products such as nitrite and ammonia. Some of these materials included tin as cathode and platinized Pt foil as anode (Lacasa et al., 2011; Katsounaros et al., 2006), Cu/Zn as cathode and Ti/IrO2–TiO2–RuO2 as anode (Fan et al., 2013), stainless steel as both cathode and anode (Talhi et al., 2011), Pt/Pt and Pt/Cu rotating ring-disk electrode (Cuibus et al., 2012), bismuth cathode and platinized Pt foil as anode (Dortsiou and Kyriacou, 2009), CuNi alloy electrodes (Mattarozzi et al., 2013), etc.
The most common problem in the reduction of nitrate is that the negatively-charged NO3− ions always get repelled by the negatively-charged cathode, which slows the diffusion and reaction rates and, thus, decreases the overall efficiency of nitrate removal. This problem could be solved by choosing a high-selectivity cathode or by packing particle materials in the electrochemical cell to form a three-dimensional electrolysis reactor. Large surface area and porous structure of foamed metal were beneficial for adsorption of target pollutants. Besides that, the mass transfer of NO3− ions from aqueous phase to nearby foamed metal is much easier than to the cathode due to the short distance and relatively high electric potential. However, the use of three-dimensional electrodes for nitrate removal has so far been very limited, and thus, this significant research area needs further evaluation.
Overall objective of this research was to evaluate the feasibility of using three-dimensional electrolysis reactor (3D-ER) and two-dimensional electrolysis reactor (2D-ER) to reduce nitrate all the way to nitrogen gas in fresh water. Accurate assessment of the possibility of electrolysis by 3D-ER can provide an optional way for enhanced nitrate reduction and requires extensive experimental research on the mechanism, influencing factors, and current efficiency. For those purposes, comparative electrolysis was performed using 2D-ER and 3D-ER in both chloride-mediated and nonchloride-mediated systems, respectively. Mechanism and possible pathways were inferred based on the intermediates formed and the related published references by other researchers. The influence of initial nitrate concentration, chloride, and current was discussed from two aspects of first order kinetics and current efficiencies, thus providing valuable data for designing electrolytic nitrate reduction reactors.
Materials and Methods
Materials
Sodium nitrate (NaNO3), sodium sulfate (Na2SO4), sodium chloride (NaCl), sodium hydroxide (NaOH), sodium dihydrogen phosphate (NaH2PO4), and boric acid (H3BO3) were all of analytical grade and were used as received from Sinopharm Chemical Reagent Co., Ltd. Deionized water was used as a solvent to prepare synthetic wastewater. Activated carbon and foamed copper were obtained from MOXING Environmental Technology Co., Ltd. The activated carbon was made from coal with a particle size of 5 ± 1 mm. Before its use, 775 g of activated carbon was washed with deionized water to remove possible impurities and any powdered carbon black attached to it. Foamed copper with a pore diameter of less than 1 mm was cut into 5 × 5 × 2 mm pieces. Before use, 195 g foamed copper was washed with 0.1 N H2SO4 and deionized water to remove possible oxides on its surface.
Electrochemical measurements
To investigate the possible products and pathway for electrolytic nitrate reduction, linear sweep voltammetry (LSV) was performed using the electrochemical analyzer system CHI 660E (Chenhua Instrument Co., Ltd.). The fluctuation of currents was measured while the potential of the working electrode was swept linearly from −0.6 V to −1.7 V with time. The experiments were carried out in a three-compartment cell with Hg/HgO electrode, platinum wire electrode, and copper disk electrode as the reference, counter, and working electrodes (Wuhan Corrtest Instruments Co., Ltd.), respectively. The working electrode with an area of 0.5 cm2 was fixed 1 mm away from the reference electrode.
Solutions were prepared with reagent grade chemicals and ultra pure water (>18.2 MΩ cm) from Water Purification System (Milli-Q A10; Millipore). Before each test, the solution was deaerated by bubbling nitrogen gas for 10 min to eliminate the effect of oxygen in solution. Moreover, the copper electrode was polished with 0.3 μm Al2O3 powder and a thin emery cloth and then cycled between −0.4 V and −1.6 V at a scan rate of 100 mV/s for three times before data collection.
Potentiostatic electrolysis was performed at −0.95 V, −1.15 V, and −1.35 V versus SCE in a two apartment cell separated by a cation exchange membrane (Nafion 117; Saiao Electrochemical Co. Ltd.). The cathodic apartment contained 16 cm2 copper electrode, Hg/HgO electrode, and 40 mL 1.2 M NaNO3 + 1 M NaOH, while the anodic apartment contained a platinum wire as the counter electrode and 1M NaOH.
Experimental setup
Batch electrolysis system (Fig. 1) consisted of a direct current source (Model: HZC-1101; Saiao Electrochemical Co. Ltd.) (1), electrolysis cell (Model: LIBRE-DJFYQ; Libby Reiter Environmental Protection Co. Ltd.) (2), peristaltic pump (Model: YZ1515X; Longer Pump Co. Ltd.) (3), holding bottle (7), magnetic stirrer (Model: S21-2; Sile Instrument Co. Ltd.) (8), and gas washer (No. 92182734; Sinopharm Chemical Reagent Co. Ltd.) (9). The anode and cathode of the electrolysis cell were RuO2/Ti and Cu with the same dimension of 173 × 42 mm, respectively, and fixed on the PVDF cap of the reactor using titanium screws with a distance of 4 cm. RuO2/Ti anode was prepared by the traditional thermal decomposition method on a titanium plate. Activated carbon (5) and foamed copper (6) were packed into the anode and cathode region of the reactor in the ratio of 1:1 (V/V), respectively. Four liters of groundwater or synthetic wastewater with DI water as solvent was placed in the holding bottle and then driven to circulate inside the system by the peristaltic pump. During electrolysis, samples were taken from the sampling point (4) and analyzed as per standard methods. After electrolysis, samples were taken from the gas washer to analyze ammonia evaporation.
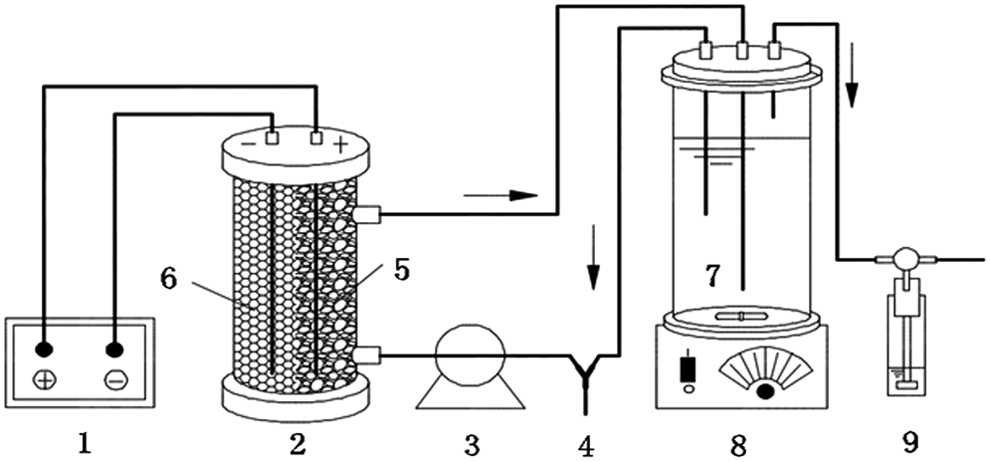
Experimental setup of electrolysis system: 1. direct current power; 2. electrolysis cell; 3. peristaltic pump; 4. sampling point; 5. activated carbon; 6. foamed copper; 7. holding bottle; 8. magnetic stirrer; 9. gas washer.
Electrolytic removal of nitrate
Comparative electrolysis was performed between 2D-ER and 3D-ER using the same system except for the packing of activated carbon and foamed copper. A thin, porous PVDF plate was placed in the center of the reactor. Four liters of synthetic nitrate solution (30 mg N/L) was prepared with NaNO3 and deionized water. NaOH and NaH2PO4 were used to prepare the buffer solution to control the system pH around 7.0 during electrolysis. Boric acid solution was diluted to a concentration of 30% for ammonia absorption in the gas washer. 0 to 300 mg/L chloride ion was added to the system to investigate diverse mechanisms and pathways for the transformation of nitrogen during electrolysis. At different intervals of electrolysis, 10 mL samples were drawn from the sampling point and analyzed immediately.
The influence of various operating parameters was studied by varying one parameter and keeping the others constant. 20, 30, 50, and 100 mg N/L nitrate solutions were prepared individually to test the effect of initial nitrate concentration. The influence of different chloride concentrations of 0, 30, 120, and 300 mg/L was studied according to nitrate reduction rates and current efficiencies. The effect of current was investigated under galvanostatic control at 0.5, 1.0, 1.5, and 2.0 A. Groundwater was taken from Songjiang District, Shanghai, and analyzed for common parameters before electrolysis. Four liters of water was treated as received under a current of 2.0 A.
Analysis and calculation
Samples were collected in a brown bottle with sealed caps and stored in 4°C refrigerator, and analyses were performed immediately after electrolysis. Nitrate concentration was determined by a standard UV spectrophotometric method using a spectrophotometer (Shimadzu UV-2600) (Huang et al., 2014). Ammonia was determined through use of Nessler's method spectrophotometrically (Shi et al., 2010). Nitrite was measured with a N-(1-naphthyl)-ethylenediamine dihydrochloride spectrophotometric method (APHA, 1998). Hydroxylamine was first oxidized to nitrite by iodine and then determined spectrophotometrically. Chloride ion levels were measured through a titrimetric method with silver nitrate (Mojiri et al., 2011), pH was measured by a pH meter (PHS-2C; Leici Company), and total nitrogen was measured by a TOC/TN analyzer (Multi N/C 3100; Analytik Jena Company).
Calculations
Current efficiency
Current efficiencies (η) were typically calculated through a way as shown in Equation (1). The parameters m′ and m are masses of the actual and theoretical products, respectively. αi represents the selectivity of the ith product (e.g., ammonia). ni is the electrons transferred per mol nitrogen of the ith product. From stoichiometry of oxidation-reduction reaction, 2, 5, and 8 mol electrons were transferred if 1 mol nitrate was converted to nitrite, nitrogen gas, and ammonia, respectively. F is Faraday's constant with a value of 96485 C/mol. M is the molecular weight of nitrogen with a value of 14 g/mol. Q and V represent the applied electrical charge (A·h/L) and volume of the electrolyte (L). [NO3−]0 and [NO3−]t are the nitrate concentrations at time zero and t. However, due to uncertainty of the final products of nitrate reduction, another parameter for efficiencies in nitrate removal (η′) was calculated by Equation (2) (Lacasa et al., 2012a).
Reaction kinetics
In previous studies (Lacasa et al., 2012a, 2012b; Li et al., 2010), the first order reaction kinetic was frequently used to simulate the electrolytic removal of nitrate from the aqueous phase. Typically, the kinetic constant k was calculated according to Equations (3) & (4). In this case, the reaction constant k had a significant relationship to the electrolyte volume and the electrode area, which made it difficult to compare the results of different studies. Previous studies had considered charge density (current passed per unit volume) to be an appropriate parameter for design (Dash and Chaudhari, 2005). In this research, a new strategy was used, which solved this problem by substituting time t with applied electrical charge Q. The new calculation method is shown in Equations (5) & (6), which gave a new first order kinetic constant k′ [L/(h·A)] independent of the electrolyte volume and electrode area.
It was quite obvious that through simple mathematic calculation, the new first order kinetic constant k′ had a direct relationship to the original k, which is shown in Equation (7). V represents the electrolyte volume (L) and A is the electrode area (cm2). In this situation, the new first order constant k′ [L/(h·A)] can be compared among different studies with different electrode areas and electrolyte volumes.
Results and Discussion
Mechanism and pathway for electrolytic reduction of nitrate
Figure 2 shows the linear sweep voltammograms obtained for 1 M NaOH, 1 M NaOH +0.1 M NaNO2, and 1 M NaOH +0.1 M NaNO3, respectively. The abrupt increase of cathodic current at a potential lower than −1.4 V voltage can be attributed to a hydrogen evolution reaction, which was similar to previous research (Reyter et al., 2011). Three other main peaks around −0.95 V, −1.15 V, and −1.35 V were observed as well. As discussed in another reference (Reyter et al., 2008), peak 1 (around −0.95 V) was usually attributed to the reduction of nitrate to nitrite as shown in Equation (8), which increased significantly when electrolyzed at a constant potential. Peak 2 (around −1.15 V) was inferred to be hydroxylamine with four electrons transferred per nitrogen (Aouina et al., 2010). However, this is not a convincing inference because hydroxylamine decomposes easily in alkaline solutions. Finally, peak 3 (around −1.35 V) usually represented the generation of ammonia as shown in Equation (9) and verified by many other researchers to be the main product of electrolytic nitrate reduction on copper electrodes (Reyter et al., 2006; 2008).
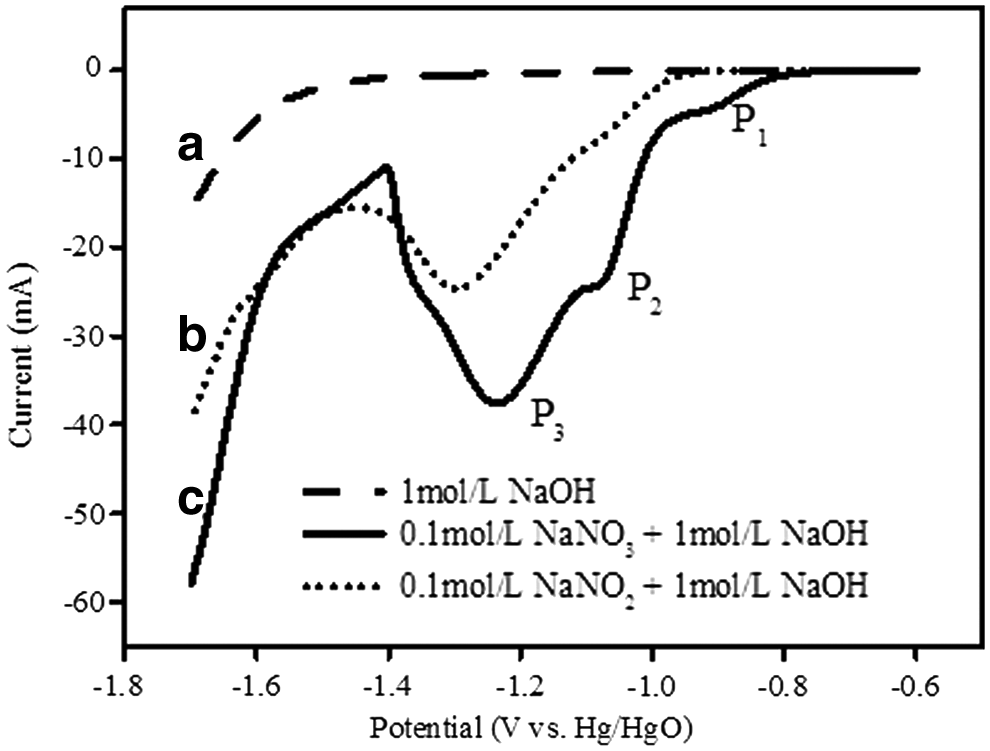
Linear sweep voltammogram of:
To verify the products of electrolytic reduction of nitrate, potentiostatic electrolysis was performed at −0.95V, −1.15V, and −1.35 V as shown in Fig. 3. For electrolysis at −0.95 V, nitrate decreased from 200 to 157 mg N/L within 47.8 h, and 94% of the nitrate was reduced to nitrite. For electrolysis at −1.35 V, nitrate concentration reduced to 74 mg N/L within 8.4 h, and 77% of the nitrate was converted to ammonia. These results verified the generation of nitrite and ammonia at −0.95 V and −1.35 V as shown in Equations (8) and (9). For electrolysis at −1.15 V, nitrate was reduced to 4.3 mg N/L within 69.5 h, of which 63% was converted to ammonia, 12% to nitrite, and the rest to gaseous products, respectively, leading to the decrease of total nitrogen in the aqueous phase. No hydroxylamine was observed during the whole electrolysis process under all three different potentials.
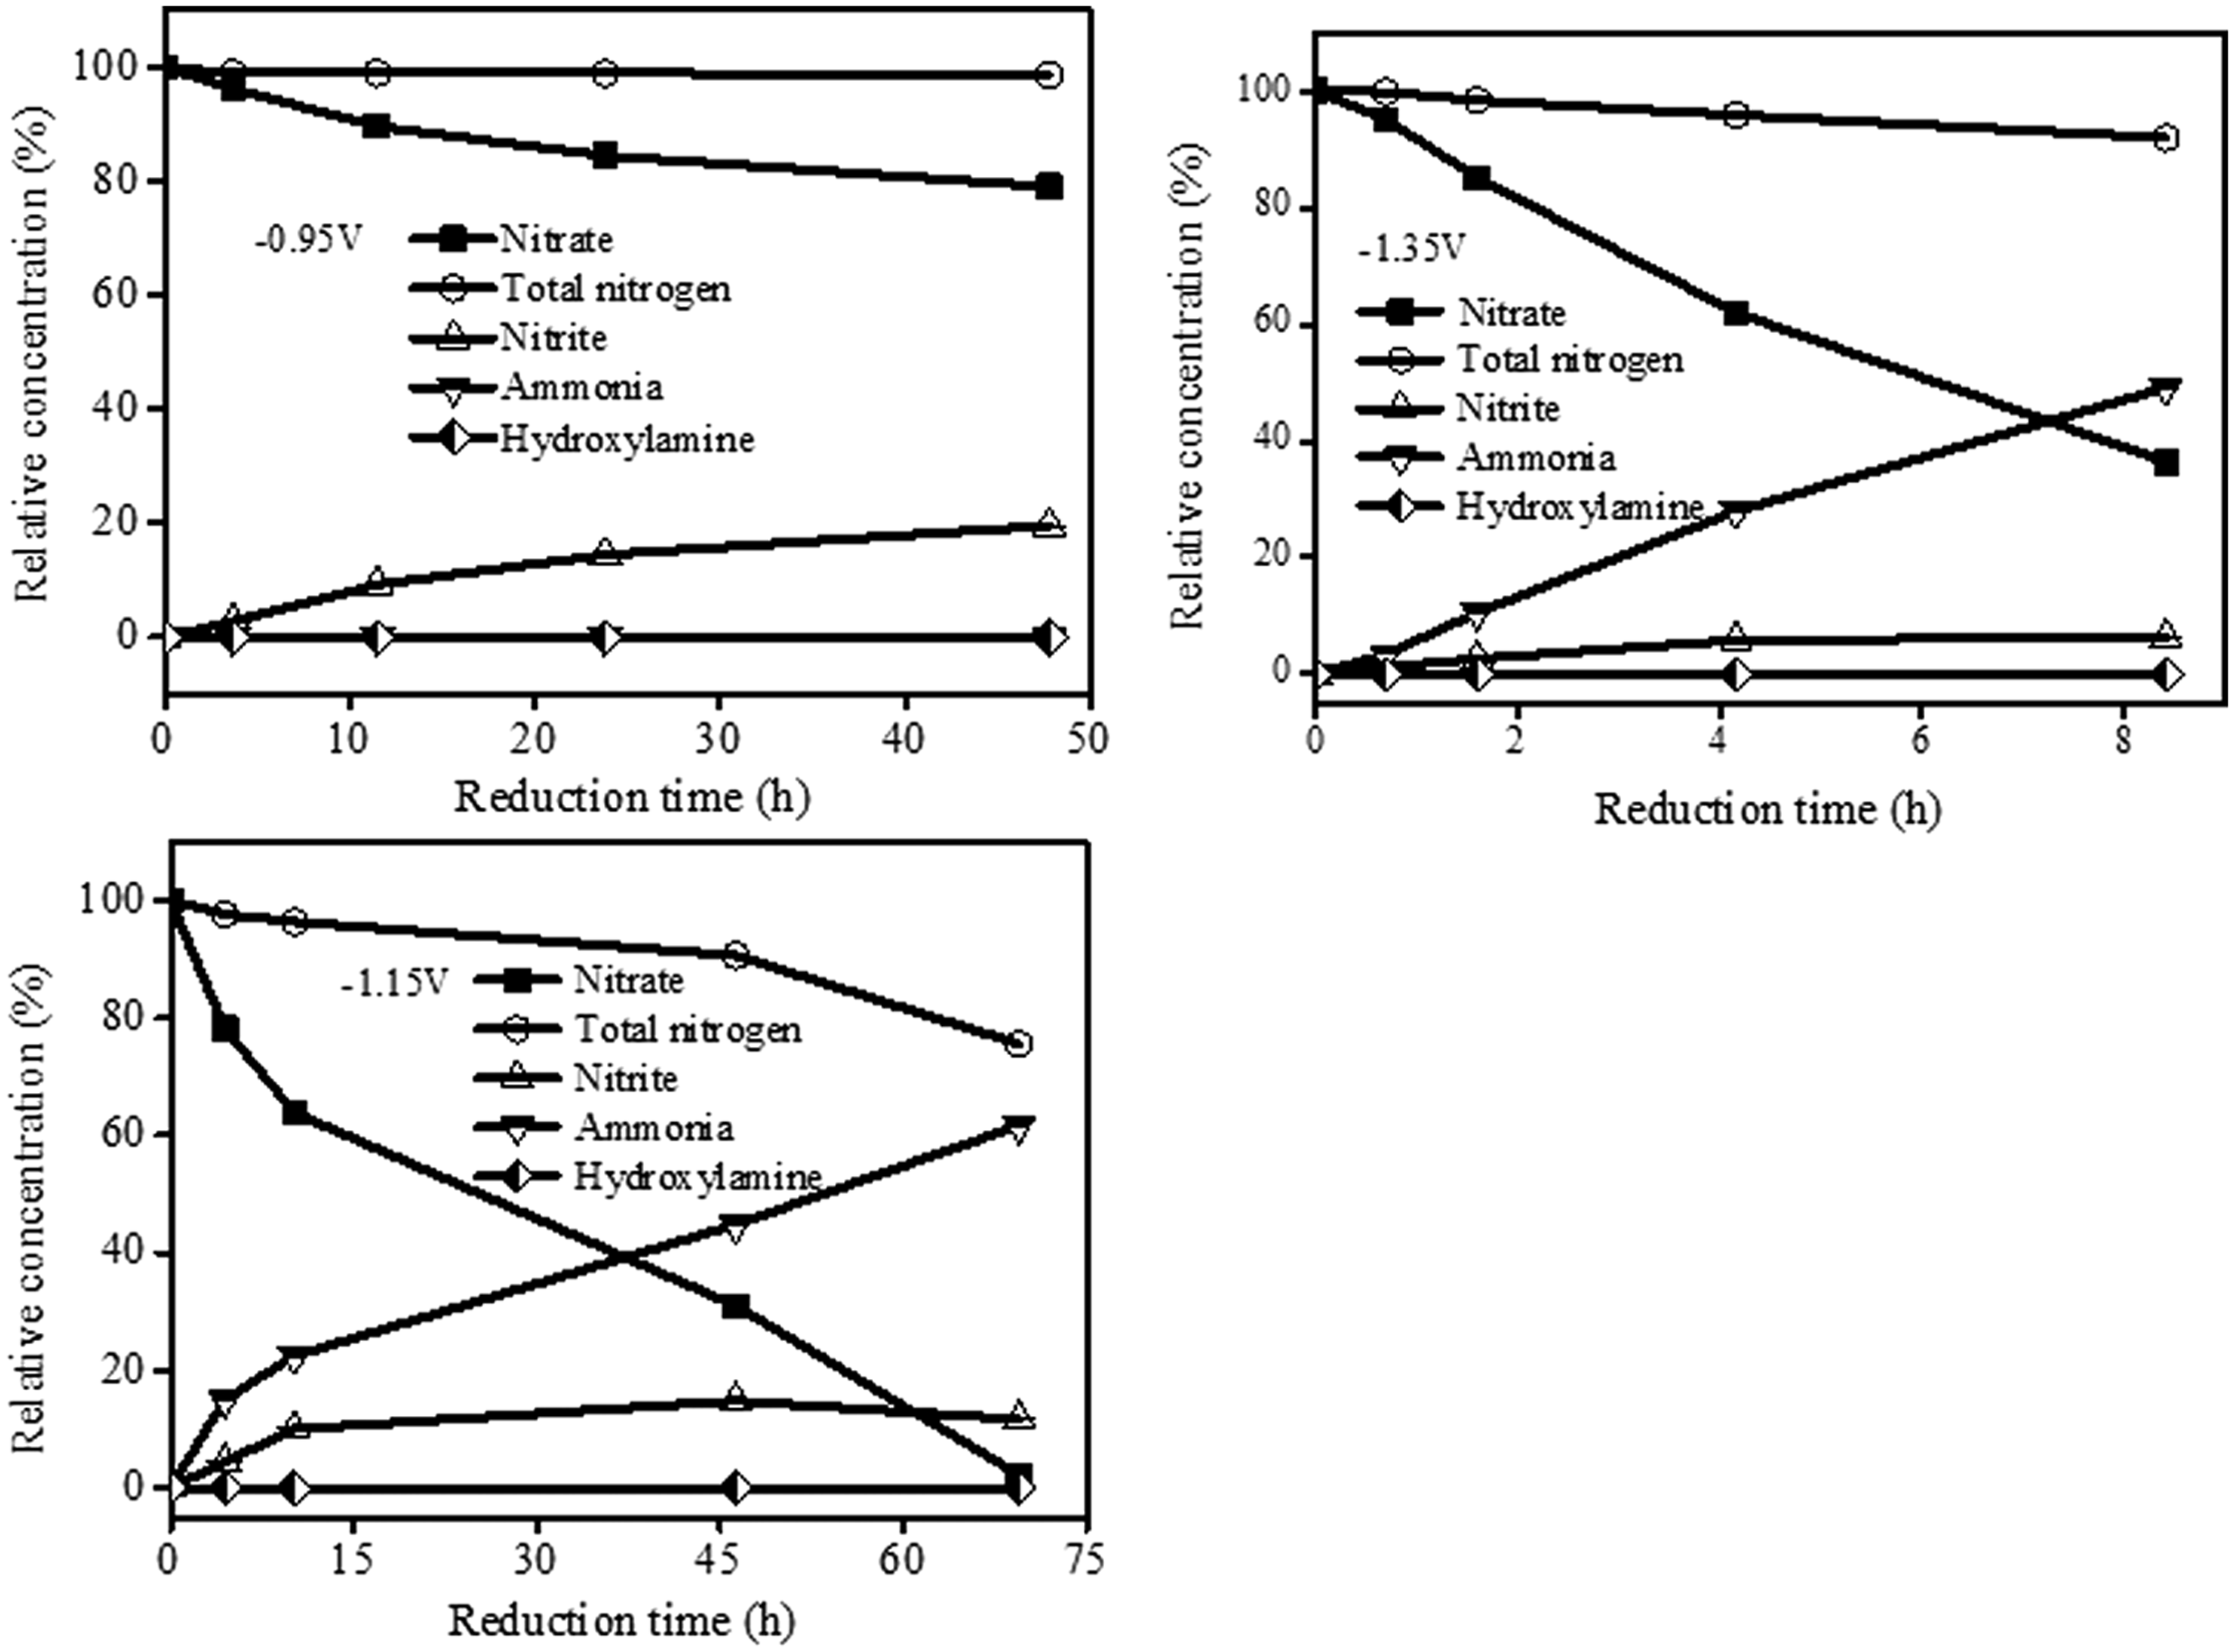
Transformation of nitrogen during the potentiostatic electrolysis at −0.95V, −1.15V, and −1.35V of 200 mg/L NO3− in 1 M NaOH solution on a copper electrode.
As shown in Fig. 4A, the maximum currents were found to increase with the scan rates from 10 to 80 mV/s, and the peaks moved toward the scan direction, which indicated that the reaction was full or half irreversible. A linear relationship was found between the maximum current and the root of the scan rate in Fig. 4B, leading to the assumption of diffusion-controlled kinetics during electrolysis. When the nitrate concentration increased as shown in Fig. 4C, the peak current ascended significantly and the peak shifted toward the direction of scan, which indicated that it was an irreversible electron transfer process. The electrons transferred during each step can be calculated according to Equation (10) (Reyter et al., 2008).

Linear sweep voltammogram of 0.1 M NaNO3 + 1 M NaOH solution with Cu as working electrode at scan rates 10–80 mV/s; B linear regression between peak current and root of scan rate:
In Equation 10, ip, α, nc, A, C, D, and v represent the peak current, charge transfer coefficient, electrons transferred, area of electrode, nitrate concentration, and diffusion coefficient, respectively. The transferred electrons were determined to be 2, 3, and 6 for peaks at −0.95 V, −1.15 V, and −1.35 V, respectively, which confirmed the generation of nitrite and ammonia as shown in Equations (8) and (9). The gaseous product of the peak at −1.15 V might be nitrogen gas through a three electron transfer reaction shown in Equation (11).
Moreover, previous research had reported that the nitrate reduction current at the Cu cathode depended linearly on the cathode surface area (Reyter et al., 2010). These results led to a new hypothesis that to enhance the nitrate reduction by electrolysis, improvement of the transfer of nitrate anions to the electrode surface might be critical and could possibly be realized by equipping the reactor with a particle electrode.
Nitrate removal in different systems
To verify the hypothesis above, both 2D-ER and 3D-ER systems were investigated using the same setup (as shown in Fig. 1) except the packing of activated carbon and foamed copper. Experimental results are shown in Fig. 5a–d, which indicated successful removal of nitrate despite different rates and products. For nonchloride electrolysis with 2D-ER in Fig. 5a, nitrate decreased from 29.0 to 13.9 mg N/L in 18 h. At the same time, ammonia increased from non detectable (ND) concentration to 8.1 mg N/L, indicating that ammonia was one of the main by-products of electrolytic reduction of nitrate. No nitrite was detected during the whole electrolysis process. These results are consistent with previous studies (Fan et al., 2013). In all, 24% of the total nitrogen was removed from the aqueous phase in the form of gaseous products, in which the selectivity to ammonia was calculated to be 54%.
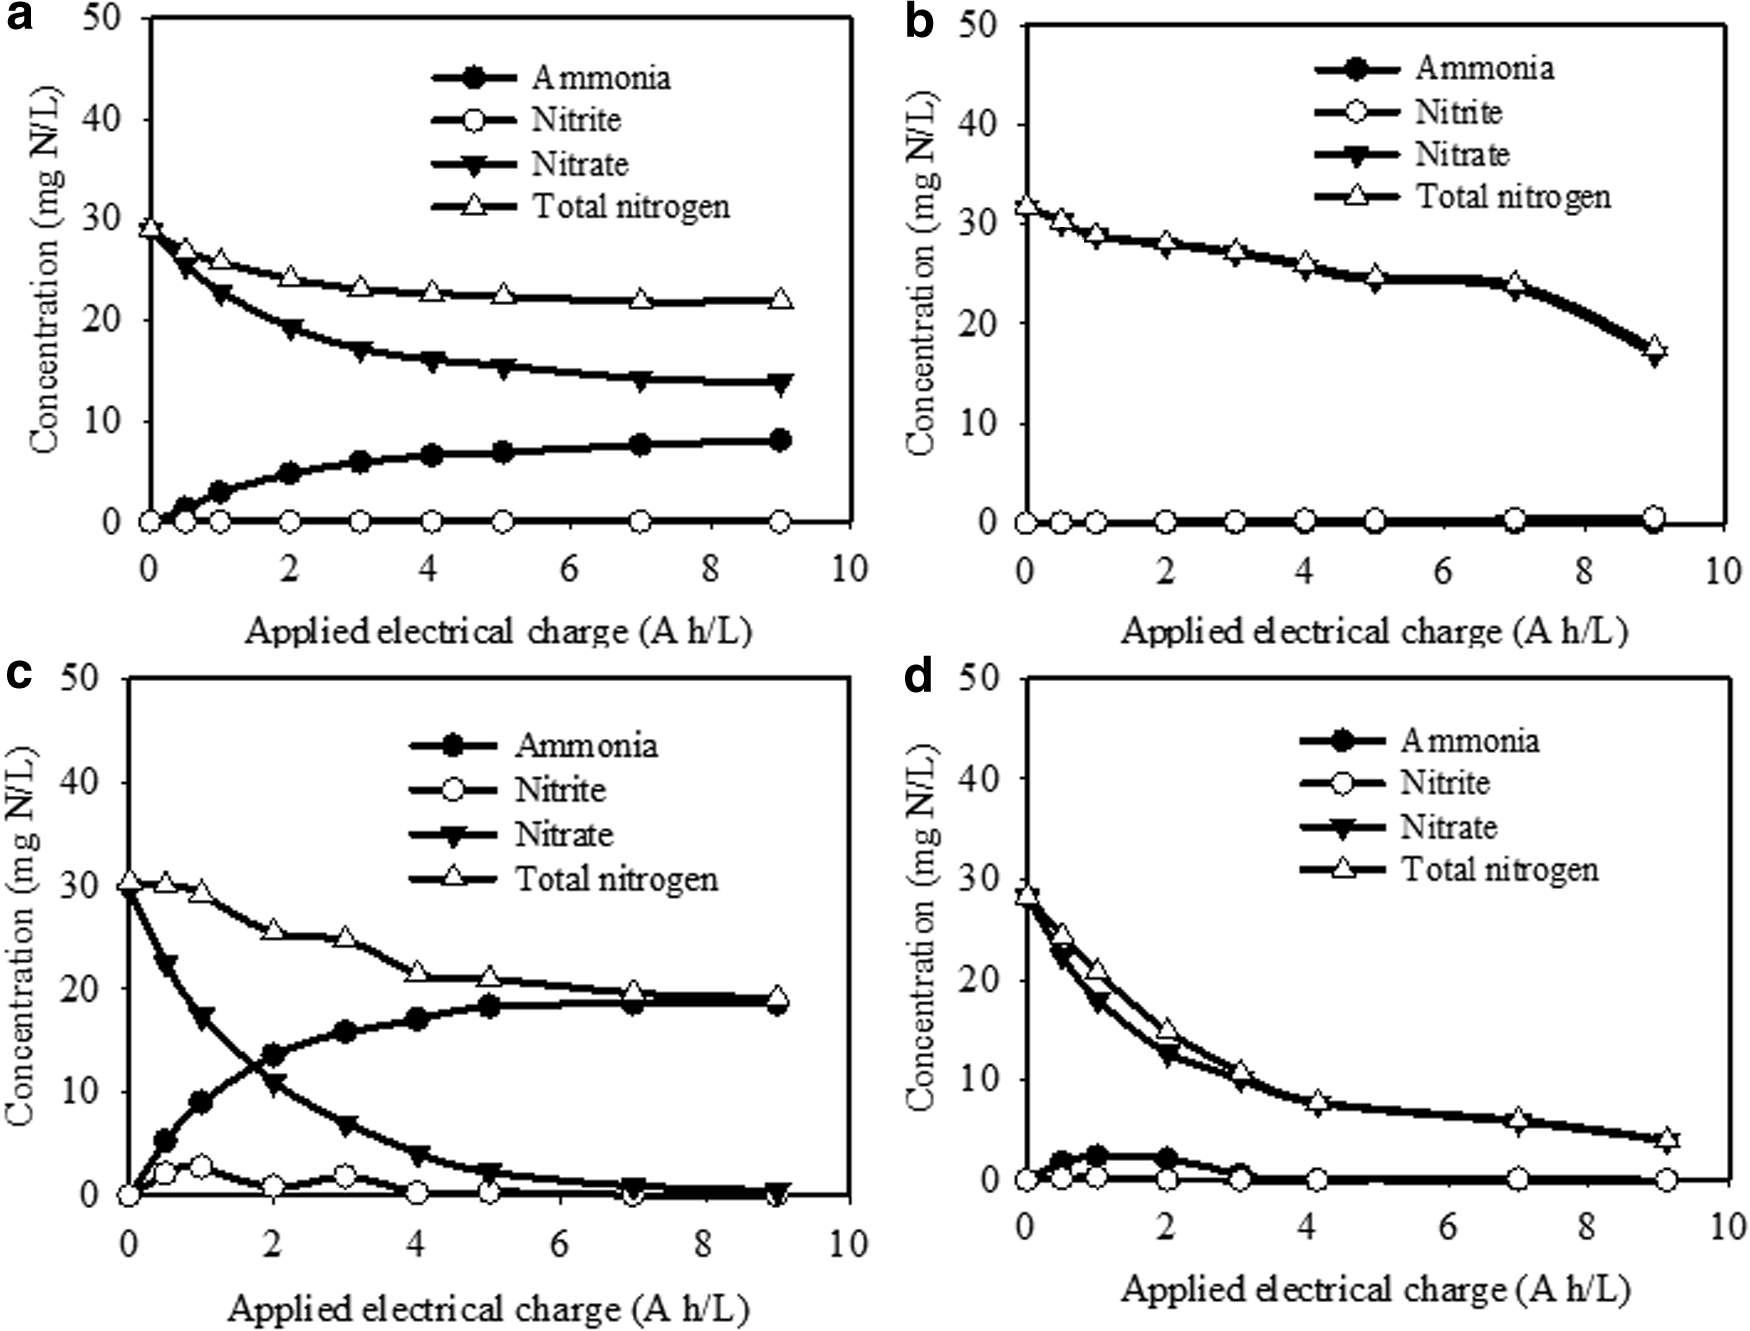
Electrolytic removal of 30 mg N/L nitrate under pH 7.0 and 2 A in different systems:
The selectivity of nitrate to ammonia might be affected by the negative potential value for hydrogen evolution (around −1.4 V in this work), which demanded further research. Other research pointed out that a high reducing environment (ORP = −463 mV) led to the conversion of nitrate to ammonia without buildup of intermediate products (Dash and Chaudhari, 2005). Possible reactions are shown in Equations (8), (9), and (11). For chloride-mediated electrolysis with 2D-ER (shown in Fig. 5b), the nitrate concentration was observed to decrease from 31.7 to 17.0 mg N/L. Nitrate reduction was slowed with 250 mg/L sodium chloride, while sulfate had little influence on nitrate reduction (Dash and Chaudhari, 2005). No ammonia was detected, and nitrite increased a little from ND to 0.56 mg N/L. Total nitrogen decreased from 31.8 to 17.5 mg N/L and indicated a 47% removal, which was almost the same with nitrate removal.
New reaction kinetic constants k′ from different studies are listed in Table 1 based on the calculation of original data from published articles. Different rate of 0.017–0.354 L/(h·A) might be caused by the materials, as well as manufacture techniques of the electrode. In this work, k′ for 2D-ER was calculated to be 0.079 and 0.058 L/(h·A) for the nonchloride media and the 300.0 mg/L of chloride-mediated system, respectively. Compared with the nonchloride electrolysis, the adding of sodium chloride brought about a 28% decrease in the nitrate removal rate, which might be caused by the competition between Cl− and NO3− for active sites on the electrode. This result was similar to that obtained by Li et al. (2010). However, total nitrogen removal was enhanced due to the reactions between ammonia and active chlorine as shown in Equations (12)–(15).
The kinetic constants were converted to the same units according to the data in the original research article.
As for nonchloride electrolysis with 3D-ER in Fig. 5c, an effluent concentration of 0.5 mg N/L was detected, and the first order kinetic constant k′ was calculated to be 0.465 L/(h·A). This was an approximate sixfold increase compared with the 2D-ER reactor under similar conditions. Ammonia concentration increased to 18.6 mg N/L, equal to 64% selectivity. Nitrite concentration increased from ND to 2.8 mg N/L and then decreased to 0.07 mg N/L, following similar trends observed by previous researchers (Brylev et al., 2007). Nitrite was an important intermediate during nitrate reduction and it quickly transformed into ammonia or other gaseous products during electrolysis. The final total nitrogen concentration was 19.1 mg N/L, resulting in a 36% selectivity to gaseous products.
For chloride-mediated electrolysis with 3D-ER as shown in Fig. 5d, nitrate decreased from 28.2 to 3.9 mg N/L, and the first order kinetic constant k′ was calculated to be 0.203 L/(h·A), which resulted in an approximate fourfold increase. After 18 h electrolysis, ammonia and nitrite concentrations were 0.03 and 0.01 mg N/L, respectively. The addition of chloride led to a delay in the appearance of ammonia and nitrite through chloride-mediated indirect oxidation. Total nitrogen decreased from the initial 28.3 to 4.0 mg N/L, which corresponded to an 86% removal; this was equal to the nitrate removal. Similar to the results using 2D-ER, the addition of chloride caused a 54% decrease in the rate of nitrate removal, but enhanced the removal of total nitrogen.
Generally speaking, activated carbon is the most commonly used material for three-dimensional electrodes since it is cheap, semiconductive, easily adsorbs many pollutants, and is preferable to generate free radicals in an applied electric field (Gedam and Neti, 2014; Zhang et al., 2013). Due to their catalytic activity under various conditions, foamed metals are being newly applied as packing materials. For example, foamed nickel was found to be effective for RhB removal as a particle electrode in a three-dimensional electro-Fenton system (Liu et al., 2012). In this work, activated carbon packed in the anodic region was designed for the generation of radicals, as well as for adsorption of organic materials in the treatment of real wastewater. Activated carbon can also avoid shorting the circuit current without the addition of an ion-exchange membrane or convection baffle.
Nitrate reduction was extrapolated to be occurring mainly at the surface of foamed copper in the cathodic region, as well as on the Cu plate. Apart from a large surface area, the adsorption of nitrate was believed to be easier along with its distance from the cathode. Transportation of nitrate to the cathode could be slowed due to electrical migration, and thus, nitrate could be reduced more easily on the surface of foamed copper (Jeong et al., 2012). Moreover, other researchers have shown that hydrogen produced from the reduction of water could be utilized for denitrification if a bacteria film formed on the particle electrode and, thus, greatly improved the efficiency (Zhou et al., 2007).
Factors affecting 3D-ER system performance
As in Table 1, previous studies had shown that electrode materials, currents, chloride concentration, and initial nitrate concentration can affect the electrolytic reduction rate. Thus, different experimental conditions were tested for the 3D-ER and the results are shown in Fig. 6. These results might lead to a deeper insight of this new system. For different initial nitrate concentrations of 20–100 mg N/L shown in Fig. 6a, 4, 6, 8, and 10 h electrolysis were needed to reach an effluent concentration of 6.2, 7.0, 6.3, and 8.8 mg N/L, which was able to meet the criteria of acceptable levels of nitrate in groundwater. The corresponding first order kinetic constants k′ are 0.424, 0.464, 0.444, and 0.444 L/(h·A), respectively, which indicate that the nitrate transfer from aqueous phase to the electrode surface was depressed by the negative potential under high initial nitrate concentrations.
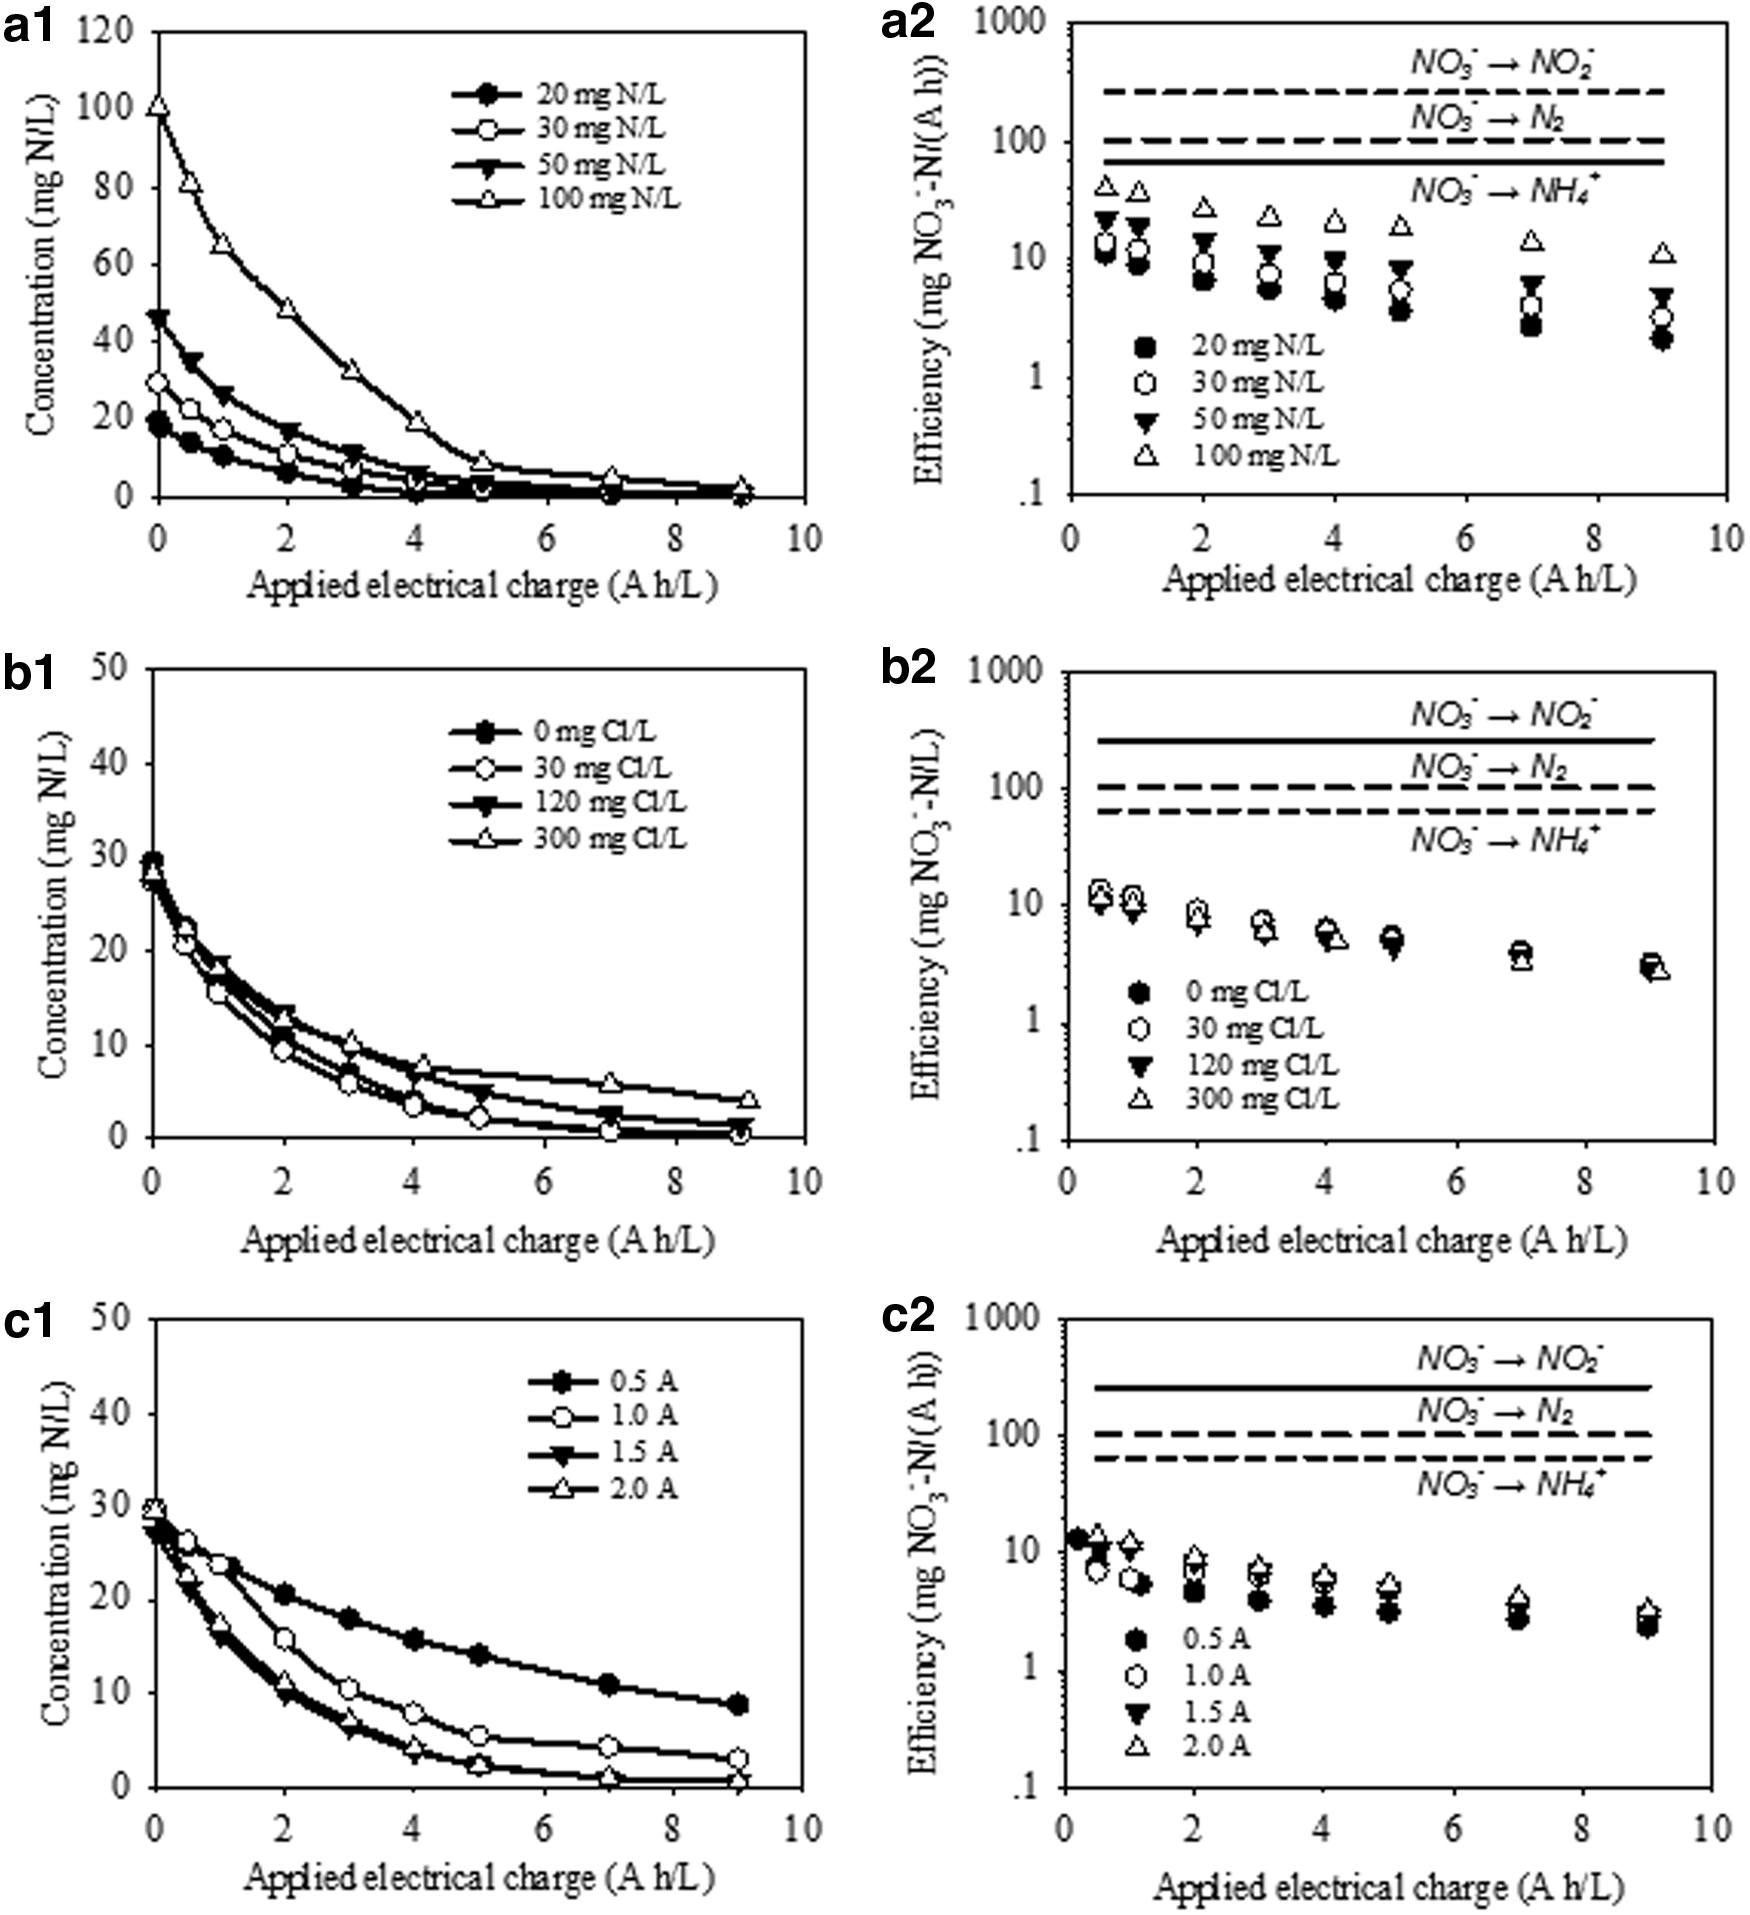
Influence of different factors on the changes of (1) NO3—N concentration and (2) corresponding efficiency with the applied electrical charge under pH 7.0:
For different chloride concentrations within 300 mg/L in Fig. 6b, about 6-h electrolysis was needed to achieve effluent concentrations of 7.0, 5.8, 9.7, and 10.1 mg N/L. The corresponding first order kinetic constants k′ are 0.464, 0.468, 0.324, and 0.203 L/(h·A), which prove the assumption of competitive adsorption on active sites of electrodes between NO3− and Cl−. Other researchers also confirmed the poisoning effect of halide in nitrate reduction, due to the potential specific adsorption of those anions on the electrode surface (Li et al., 2009; Pletcher and Poorabedi, 1979). Another possibility might be the oxidation of intermediate nitrite back to nitrate by secondary oxidant hypochloric acid as shown in Equation (16) (Pérez et al., 2012).
Figure 6c shows the nitrate reduction under different currents of 0.5, 1.0, 1.5, and 2.0 A, respectively. It was obvious that the first order kinetic constants k′ increased with currents from 0.132 to 0.272, 0.444, and 0.464 L/(h·A). However, when currents increased, the potential increased due to unchanged system conductivity, which inhibited the nitrate transfer. That explains why nitrate removal rates were almost the same under 1.5 and 2.0 A currents.
The corresponding efficiencies of nitrate removal (η′) were calculated according to Equation (2) and drawn in Fig. 6a2–c2 under various conditions. Obviously, all efficiencies decreased with the applied electrical charge, which was the typical situation for a first order reaction. Moreover, the maximum efficiencies for nitrate removal were figured out with 100% electrons transferred to target products of ammonia, nitrogen gas, and nitrite, respectively.
For different initial nitrate concentrations in Fig. 6a2, the efficiencies showed values within the range of 2.1–39.5 mg N/(A h). An obvious tendency can be observed that the efficiencies increased with initial nitrate concentration. Talhi et al. (2011) reported that energy consumption reduced from 0.325 to 0.185 kWh/g-N when the initial nitrate concentration increased from 200 to 1000 mg N/L. As for different chloride concentrations in Fig. 6b2, 2.7–13.9 mg N/(A h) efficiencies were achieved, which decreased slightly with the increase of chloride. Figure 6c2 shows the influence of current on the nitrate removal efficiencies. 2.3–13.9 mg N/(A h) efficiencies were observed using different currents. No significant decrease of current efficiency was observed within the range of 0.5–2.0 A. This result was different from previous research with 2D reactors, which revealed that high current resulted in an increase in oxygen evolution and current efficiency decreased as a result (Fan et al., 2013).
Under all conditions, the efficiencies for nitrate removal decreased when more electrical charge was applied. For all the tried conditions, the efficiencies of 2.1–39.5 mg N/(A h) were achieved, which resulted in a 3–57% electron transfer efficiency considering ammonia as the final product. In previous research, a highest value of 8.1 mg N/(A h) efficiency was achieved using graphite as the cathode at a current density of 30 mA/cm2, when 2.5 A h/L electrical charge was applied (Lacasa et al., 2012a).
Treatment of groundwater
Before electrolysis, the groundwater was taken from Songjiang District, Shanghai, and then common water parameters were determined as shown in Table 2. The ammonia, nitrate, nitrite, and TN were found to be 2.8, 19.9, 0.04, and 22.8 mg N/L, respectively, which indicated that nitrate composed most of the nitrogen contamination of the groundwater. The source of the nitrate contamination might be the overloaded fertilizer nearby, since large tracts of cultivated land are located in this district to provide fresh vegetables and fruits to the city. Metallic elements of Zn and Cu were determined to be 0.55 and 0.005 mg/L, while Fe, Al, and Ni were not detected. Other parameters such as pH, temperature, sulfate, and hardness were found to be 7.5, 12.1°C, 102.0 mg/L, and 485.4 mg CaCO3/L, which were consistent with the parameters found in the urban area of Shanghai.
ND, not detected.
The groundwater was electrolyzed as received by passing 2 A current with a direct current source. As shown in Fig. 7, nitrate concentration decreased from 19.9 to 9.0 mg N/L within 6 h, which met the quality standard for drinking water. Further electrolysis up to 18 h reduced the nitrate concentration to 1.2 mg N/L. Moreover, the removal of nitrate from the aqueous phase could be simulated by first order kinetics with reaction constant k′ of 0.312 L/(h·A). This removal was 26% lower than the synthetic wastewater with the same initial nitrate concentration of 20 mg N/L. Probably, the anion (such as Cl−, HCO3− etc.) existing in the groundwater competed with nitrate (NO3−) in adsorption on the active sites of the electrode. It is worth notice that total nitrogen decreased from the initial concentration of 22.8 to 10.7 mg N/L after 6 h electrolysis and further reduced to 1.7 mg N/L within 18 h. Ammonia and nitrite concentration was reduced to 0.5 mg N/L and 0.01 mg N/L during the same time.

Treatment results of groundwater by 3D-ER under pH 7.0 and 2.0 A.
Considering the simultaneous removal of nitrate and total nitrogen, it is apparent that hardly any other soluble forms of nitrogen (ammonia, nitrite, hydroxylamines, etc.) were generated during electrolysis. Compared with the results of synthetic wastewater without chloride ion, the main hazardous by-product of ammonia was removed by the active chlorine generated from the electrolytic oxidation of chloride ion presented in groundwater.
Conclusions
This research focused on the enhanced electrolytic reduction of nitrate by 3D-ER packed with activated carbon and foamed copper. Primary voltammetric investigation indicated that nitrate reduction can be divided into three main steps with the generation of ammonia and gaseous products. The rate limiting step was the mass transfer of nitrate to the electrode surface. 3D-ER could increase the nitrate reduction rate significantly compared to 2D-ER. The addition of chloride ions had two main effects on the process. One was the transformation of ammonia to a gaseous nitrogen-containing compound. The other was the competitive adsorption with NO3− to active sites on the electrode under high concentrations, leading to decreased nitrate reduction rates. High current and initial nitrate concentrations were beneficial for nitrate reduction. 3D-ER can be successfully applied to groundwater nitrate reduction. Within 6 h, nitrate concentration could decrease from the initial concentration of 19.9 to 9.0 mg N/L and further reduce to 1.7 mg N/L after 18 h electrolysis. This final concentration meets the standard for sources of drinking water.
Footnotes
Acknowledgments
The authors thank the National Natural Science Foundation of China (No. 51208299), Science & Technology Commission of Shanghai Municipality (No. 11JC1408700), Innovation Program of Shanghai Municipal Education Commission (No. 15ZZ075), University of Utah Lab infrastructure, and the Hujiang Foundation of China (B14003) for funding support.
Author Disclosure Statement
No competing financial interests exist.