
Abstract
Abstract
In this study, coagulation condition and prechlorination on membrane fouling were investigated. Optimum operation parameters of overall process were obtained through a proposed combined process of coagulation and ultrafiltration (UF) with the prechlorination unit set after the coagulation unit and before the UF unit. Effects of velocity gradient of the coagulation unit and the dosage of NaClO on the range of workable flux and water purification were assessed using response surface methodology. The range of workable flux of UF module obtained under an agitator rotational velocity of 40 rpm in the coagulation unit represented the maximum one. Removing as much organic contaminants as possible is the key to alleviating membrane fouling. The proposed process does not require use of the prechlorination unit and is not necessary and suitable for treatment of this type of raw water. Higher velocity gradient and operating flux presented a slower rate of filtration resistance growth. Optimum values of 40 rpm, 0 mg/L, and 100 L/[m−2·h−1] were obtained for the agitator rotational velocity, NaClO dosage, and operating flux, respectively. Under this condition, the specific flux decay rate reached the minimum value during a single filtration.
Introduction
P
Coagulation-sedimentation phase and the cake layer formed on the membrane surface by flocs that have excellent micromolecular organic retention capacity increased the separation effectiveness of the process (Park et al., 2002; Kabsch-Korbutowicz and Kabsch-Korbutowicz, 2006). Membrane fouling can be reduced by removing inorganic colloids and/or NOM from the feed water (Lai et al., 2015), preventing pore blockage through aggregating particles and organic matter during the coagulation (Howe and Clark, 2002), and increasing backwash efficiency (Barbot et al., 2008). The porous and loose cake layer on the membrane surface formed during CS–UF process with low compressibility also enables improvement of UF membrane permeability over the tighter cake layer conformation that formed under UF membrane filtration process without pretreatment (Jin et al., 2013).
Despite the demonstrated advantages of CS–UF, the extreme limit of the membrane flux still exists. A membrane flux that exceeds the right scope is one of the main reasons for heavy membrane fouling (Wang and Waite, 2008). Generally, the extent of membrane fouling increases with the increase in membrane flux. The improvement of the range of the workable membrane flux means the increase of membrane productivity and reduction in membrane fouling. Therefore, regulating overall operation conditions of the hybrid process to enable the operation of the UF module at a higher flux is necessary. Removal efficiency of contaminants, especially organic matters, should also be considered when reducing membrane fouling during the regulation of CS–UF operation conditions because low membrane fouling means low risk of adsorption on the membrane pores, and low organic removal by UF membrane may be necessary, which is not the result we want to see. Regulation of floc characteristics, such as particle size, Zeta potential, density, and fractal dimension, is the chief operation condition that needs to be considered because of its huge effect on membrane filtration resistance (Lahoussine-Turcaud et al., 1990; Park et al., 2006; Dong et al., 2014). Controlling the pH value of the solution, coagulant dosage, or velocity gradient during the coagulation process can also regulate floc properties to some extent.
Prechlorination based on the CS–UF process has also been reported to be effective in recovering the loss of membrane permeability. The chlorination unit used before (C–CS–UF) or with the coagulation (CCS–UF) can effectively enhance coagulation behaviors and control membrane biofouling. Yu et al. (Yu et al., 2014) found that a low and continuous dose of NaClO (at a concentration of 1 mg/L active Cl) with alum as pretreatment before UF membrane filtration caused substantial inactivation of bacteria, resulting in a lower membrane fouling rate than the CS–UF process because of a more porous and thinner cake layer. Zhang et al. (Zhang et al., 2006) reported the addition of NaClO (at a concentration of 6 mg/L active Cl) in the intake seawater pipe before the coagulation system as the preprocessing of UF unit resulted in flux and stability enhancement. It should be pointed out that higher concentrations of NaClO may affect the membrane properties (Regula et al., 2013) and/or cause the formation of DBPs from NOM (Sapone et al., 2015); thus, the range of NaClO doses of C–CS–UF and CCS–UF, which are used in drinking water treatment, should be controlled in a small range, usually 0.5–1.0 mg/L. The NaClO doses may move even up to 6 mg/L when C–CS–UF is used as the pretreatment process of reverse osmosis in seawater desalination.
However, the combination form, in which the chlorination unit is set after the coagulation–sedimentation unit and before the UF unit (chlorine added to the membrane tank or feed tank of UF module, CS–C–UF), which is called in situ chlorination, has received very little attention. The continuous dosage of NaClO after coagulation–sedimentation phase contrasts strikingly with the combination forms of C–CS–UF and CCS–UF and the chemical backwashing using NaClO to prevent membrane fouling.
In this article, an integrative CS–C–UF device with chlorination unit set after the coagulation–sedimentation unit is proposed.
Effects of velocity gradient during the coagulation process and the NaClO dosage on the range of the workable membrane flux and water purification were assessed. Subsequently, optimization of the overall operation parameters of the hybrid process was conducted using response surface methodology (RSM), an empirical model of the decay rate of membrane specific flux (SF, L/[h·m2·MPa]) based on agitator rotational velocity in the coagulation unit, NaClO dosage, and operating flux of the UF module. The main objectives of this study are to investigate the effects of different operating conditions on the performance of a polyethersulfone (PES) hollow fiber membrane in the treatment of Minjiang River water, determine the optimum operation parameters of the entire process, and assess the regulation efficiency of the process in lowering membrane fouling.
Material and Methods
Integrative process
A schematic diagram of the CS–C–UF pilot testing systems is shown in Fig. 1. An inside-out UF module composed of hollow PES fiber membranes (model number: 12DA0900; PENTAIR X-Flow) with an average pore size of 20 nm and a dead-end filtration mode was used. The cartridge dimension of the selected membrane module was Ø220 × 1537 mm. The molecular weight cutoff of the investigated membrane was 150 kDa. The contact angle and effective surface of the module were 44° and 55 m2, respectively. The same module was used for all experiments in this study.
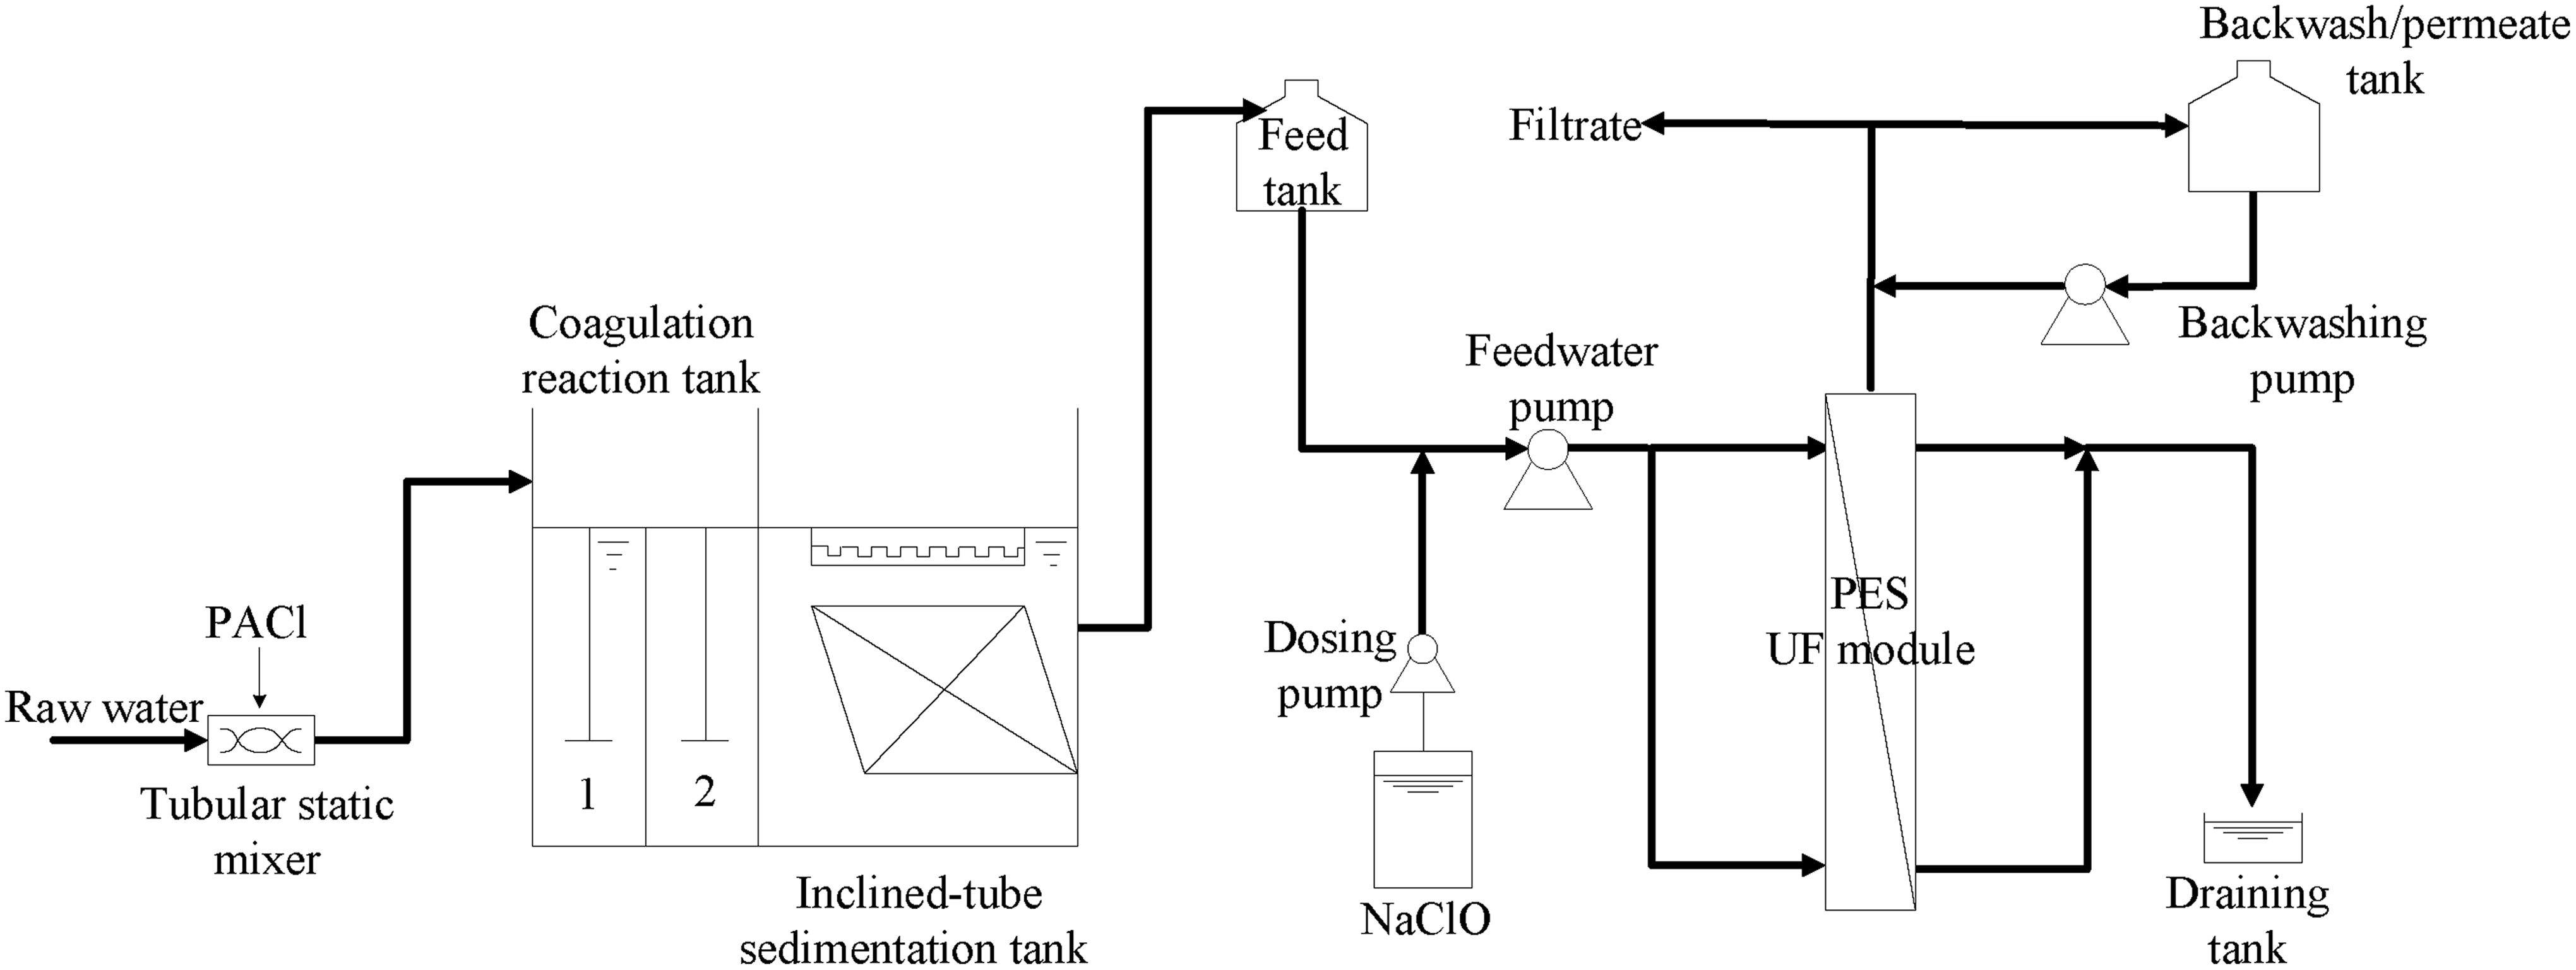
Schematic diagram of CS–C–UF pilot testing systems.
The flow rate of the overall system was 10 m3/h. Polyaluminum chloride (PACl), which was used as a coagulant, was fixed at a 4 mg/L (as Al) concentration to avoid the effects of the change in alum dosage. This fixed value of coagulant concentration has been proved to be the optimum dosage by jar stirring test, referring to the technical parameters of traditional treatment process in the water plant, in removing turbidity and organics; it can improve the quality of supply water and also reduce the cost. PACl was added continuously to raw water from the Minjiang River through an automatic dosing system and rapidly mixed by tubular static and mechanical mixers in the conventional coagulation unit. Flocculation reaction time was 25 min. The flocculation tank was divided into two equal parts (tanks 1 and 2). Their agitation units were operated under the same impeller speed. The ratio of the turning radius of which stirring paddles with vertical axes in tanks 1 and 2 was 1:2. According to Equation (1), the ratio of agitating powers in tanks 1 and 2 was 1:64, which meant that the second tank imparted 64 times more power into the solution and presented higher velocity gradient.
where P is the agitating power (W), n is the number of stirring paddles in the same radial direction, CD is the flow resistance coefficient, ρ is the density of water (kg/m3), L is the length of the stirring paddle (m), ω is the angular velocity of rotation (r/s), ri is the radius of rotation of inner edge of stirring paddle (m), and ri+1 is the radius of rotation of outer edge of stirring paddle (m).
After a settling phase of 45 min, the effluent of the sedimentation tank was pumped into the feed tank of the UF unit. Before the water from the feed tank (with a volume of 2 m3) was pumped to the UF module using the feed pump, the feed water of the UF module undergoes chlorination through the addition of NaClO. Permeate from the UF module overflowed from the permeate tank and was directed to the draining tank. For the backwash procedure, filtrate from the permeate tank was pumped by the backwashing pump into the module. Permeate flux was kept constant during the runs by a variable frequency conversion regulating pump, while TMP was an observed dependent variable. During the UF module runtime, TMP and membrane permeate flux were monitored continuously using pressure gauges and electronic flow meters, respectively, which were both connected to a computer for data logging. Acid–base staggered chemical enhanced backwash (CEB) was carried out in between runs and shortly after the hydraulic cleaning procedure, involving 20 s of backwash and 50 s of forward flushing (flushing with the membrane influent from the opposite direction to backwashing).
It must be pointed out that the results for every operating condition, with the duration of only 15 min, were based on the first filtration cycle after the hydraulic cleaning procedure and CEB so that the performance is consistent at the beginning of each run. Moreover, according to preproduction performance testing and influent quality conditions in this pilot test, the change in pure water flux of each filtration cycle was insignificant (0.5–1.5%).
Determination of maximum workable flux of UF module
The PES module used in the pilot test presented low TMP and high SF (the reciprocal of the filtration resistance, also called permeability) because of the narrow distribution of porosity (according to the model of Gaussian pore distribution obtained before the pilot test) and good hydrophilicity (with the contact angle of 44°) of the PES membrane. The pure water flux of the module was up to 700 LMH. Therefore, the workable flux of the module was expected to reach a relatively high level.
Generally, the maximum workable flux of the UF module refers to critical flux in cross flow systems (Pearce, 2011); studies have shown that once the membrane flux exceeds the critical point, the fully reversible membrane fouling becomes irreversible (Youravong et al., 2003). In our dead-end system, we proposed a new method for the range of the maximum workable flux determination. The method is shown below:
We found that SF presented a linear decrease with the increase of membrane flux. Moreover, TMP exhibited a significant rise in single filtration cycle (15 min in this case) once the SF dropped to about 2,000 L/[h·m2·MPa] with the increase of flux. In this study, membrane flux was increased step by step from 60 to 200 LMH at 10 LMH intervals. The duration of each flux step was 15 min. A simultaneous change in TMP was observed. The relationship between SF and membrane flux was fitted. The flux corresponding to the SF with the value of 2,000 L/[h·m2·MPa] was calculated with the equation of fitted straight line and considered as the maximum workable membrane flux of the UF membrane, which is shown in Fig. 2.
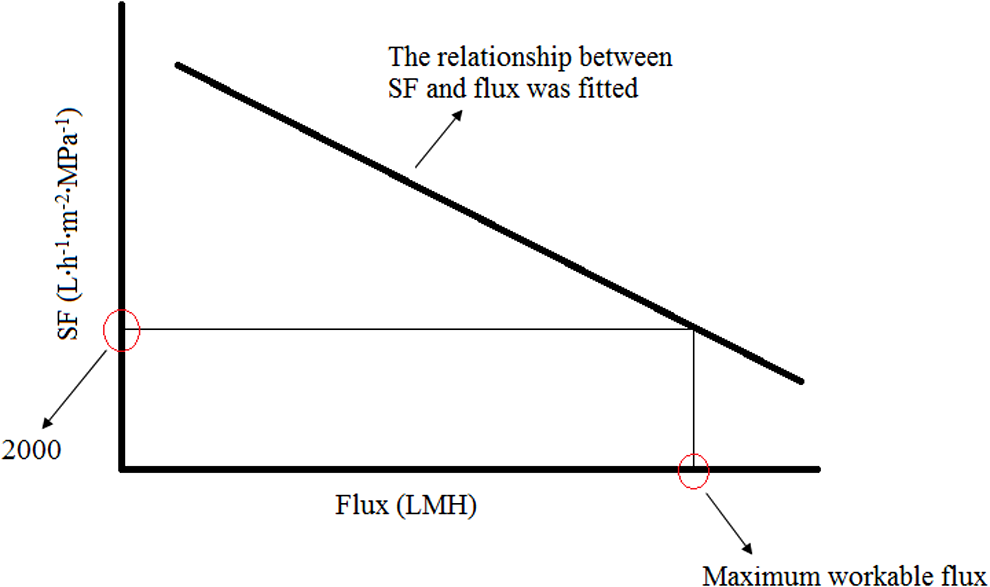
Schematic diagram of determination of maximum workable flux.
SF and SF decay rate in a single filtration cycle (denoted as σ, L/[h·m5·MPa1]) can be calculated according to the following equations [Eqs. (2) and (4)], which were reported in the literature (Diagne et al., 2013), and technical manuals of the module [Eq. (3)]:
where Q is the permeate flow rate of the UF membrane (m3/h), A is the membrane area (m2), TCF refers to the temperature correction factor, Treference is the reference temperature (20°C), Tmeasure is the measured temperature (°C), ΔSF is the SF attenuation during the operation (L/[h·m2·MPa]), and ΔV is the volume of water treated during the operation (m3).
Raw water quality
The characteristics of raw water are listed in Table 1. The pilot test was carried out in a water plant at the Fuzhou Coastal Section of the Minjiang River. During the pilot test, the turbidity of the raw water fluctuated drastically, whereas the CODMn value and TDS remained at relatively low levels. An ultraviolet absorbance at 254 nm (UV254) and CODMn value were both selected as the representative parameter of NOM concentration (Zularisam et al., 2006). The temperature did not change significantly. Low alkalinity and hardness present in raw water could not produce calcite at the membrane surface and then had obvious effects on membrane performances (Loganathan et al., 2016). Based on the water quality characteristics, NOM composed of a variety of nonbiodegradable organic compounds, including humic substances (Wong et al., 2002), and was the most likely cause of fouling.
RSM design
Box–Behnken factorial design based on Design Expert Software Version 8.0.6 (STAT-EASE, Inc.) was used to optimize the overall operation parameters of the integrated process. The complete design consisted of three levels (low, medium, and high coded as −1, 0, and +1) and 17 runs, which were performed in duplicate to optimize the levels of the selected chosen variables. The effects of the three independent variables, namely, the agitator rotational velocity in the coagulation unit (x1), the NaClO dosage (x2), and the UF module operating flux (x3), were taken into consideration in the RSM design and coded according to the following equation:
where xi is the coded value of an independent variable, Xi is the actual value (uncoded value) of the independent variable, X0 is the actual value of the Xi on the center point, and ▵X is the step change of the variable (Cheng et al., 2014; Witek-Krowiak et al., 2014). The range and levels of the processing parameters involved are given as Table 2. The central composite design matrices consisting of 12 factorial points and 5 replicates of the central points are tabulated in Table 3. A quadratic model was developed through RSM to predict the response as a function of the independent variables according to Equation (6).
where Y is the observed response, b0 is a constant coefficient, bi, bii, and bij are the coefficients for the linear, quadratic, and interaction effects, respectively, xi and xj represent the coded levels of the independent variable, and k is the number of the independent variables (three in this case). The statistical significance of the second-order model equation was determined through analysis of variance (ANOVA). The significance of each coefficient was determined by the F and P values. The nearer the multiple coefficient of determination R2 approximates to 1, the better the fitting result of the module (Zheng and Wang 2010).
The agitator rotational velocity in the coagulation unit was designed to range from 30 to 50 rpm because stirring at 40 rpm was confirmed to provide the maximum range of workable flux and the minimum σ of the UF module during the test. The NaClO dosage ranged from 0 to 2 mg/L, the relatively small scope, for much the same reason as C–CS–UF and CCS–UF (the introduction section). According to the early running experience, the TMP of the UF module used in this study displayed a very stable trend in single filtration cycle, with the routine filtration time of 40 min, when the module was operated at a flux of 80–85 LMH and carried out to treat the Minjiang River. Therefore, the upper and lower limits of the operation flux were set to 70 and 100 LMH, respectively. Table 3 illustrates the experimental conditions based on the central composite design, with the decay rate of membrane SF as dependent response.
Analytical methods
Water quality analysis was conducted according to the drinking water standard examination method (GB/T5750.8-2006). Turbidity was determined using a turbidity instrument (2100N; HACH). UV254 absorbance was obtained using a spectrometer (WFZ UV2000; UNICO). The samples were filtrated through a 0.45 μm membrane (Xinya) before determining UV254 absorbance. The permanganate index (CODMn) was measured using the potassium permanganate oxidation method. The pH values and TDS were detected by a portable surveying instrument (SX751; Sanxin). Alkalinity (bicarbonate) was measured using potentiometric titration. Hardness was calculated from measured Ca and Mg concentrations using Inductively Coupled Plasma Optical Emission Spectrometer (ICP-OES; PerkinElmer Co. Ltd.). The correlation among data was analyzed with SPSS statistical software version 17.0 (SPSS, Inc.). Relative standard deviations were calculated based on a series of replicates of the filtration cycles (n = 3).
Results and Discussion
Effects of agitator rotational velocity in coagulation unit on range of workable membrane flux
Maximum workable flux of the UF module under different agitator rotational velocities in the coagulation unit and with no NaClO dosing is shown in Fig. 3. During the test, the range of workable flux obtained under agitator rotational velocity of 40 rpm was determined to be the maximum, which was 357 LMH. TMP data were also recorded every 10 s. The growth equations of TMP in a single filtration cycle were fitted to obtain the growth slope to determine the effects of coagulation condition on membrane fouling and are shown in Fig. 4. Coincidentally, the growth slope of the TMP–filtration time curve (denoted as RTMP) in a single filtration cycle under a rotating speed of 40 rpm was the minimum (data were recorded every 5 s by computer), which indicated that membrane fouling in single filtration cycle could reflect maximum workable flux on the whole to some degree.

Effects of agitation speed on maximum workable membrane flux.
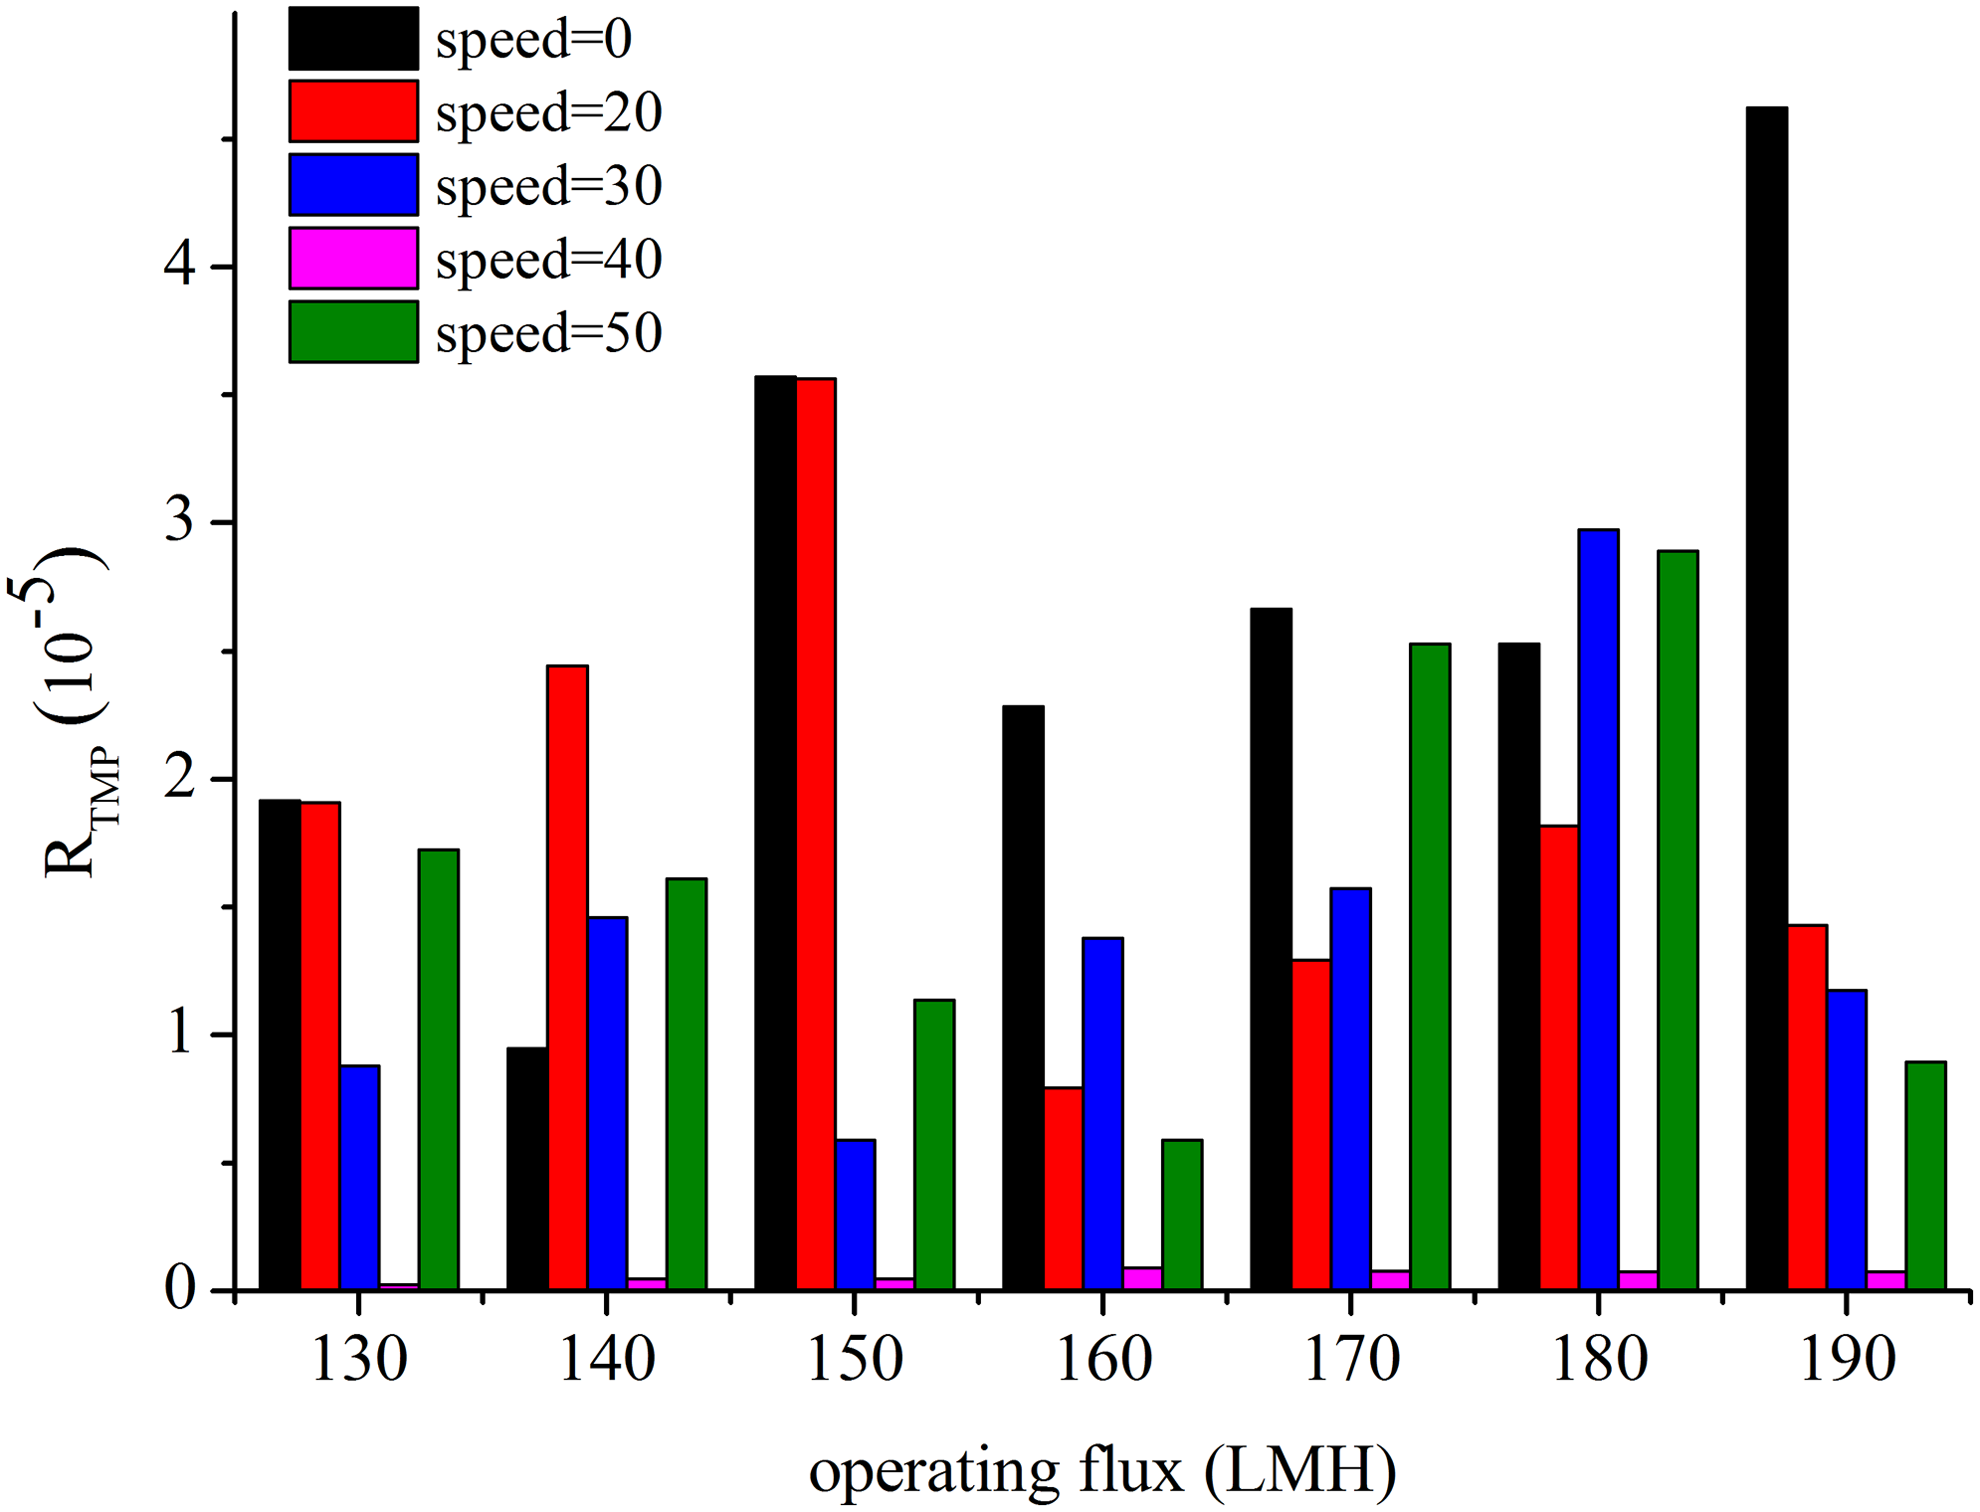
RTMP in a single filtration cycle.
Our results suggested the possibility of reducing serious membrane fouling risk by controlling the velocity gradient in the coagulation process, thereby improving the range of workable flux of the UF module. The rational adjustment and control of velocity gradient in the coagulation stage helped reduce the concentration of organics, or rather NOM, in the UF influent by the sedimentation step, which resulted in the decrease of membrane resistance. When the agitator rotational velocity in the coagulation unit increased to more than 40 rpm, the size of the flocs in the UF influent did not continue to increase with the increase of the agitation speed, but rather decreased because the flocs were disrupted significantly under high agitated strength (Spicer et al., 1998), leading to the unfavorable effect of organic coagulation.
Effects of agitator rotational velocity in coagulation unit on membrane fouling and on efficiency of contaminant removal by CS-UF
Turbidity removal by the integrative device of the CS–UF process is represented in Fig. 5. Actually and theoretically, the UF module could reduce influent turbidity steadily even when it fluctuated drastically to about 0.1 NTU because of the powerful fractionation performance of the tiny holes of the UF membranes. Therefore, in Fig. 5, focus is given to the removal efficiency of turbidity by the coagulation and sedimentation processes, which were applied as primary preprocessing steps of the UF unit and may influence membrane fouling to some extent. The turbidity values of the raw water were relatively stable during the runtime at an agitation speed of 20–50 rpm. The maximum removal rate of the turbidity and minimum turbidity value in the effluent were obtained when the agitation speed was 20 rpm. The agitation speed of 20 rpm in the coagulation resulted in the formation of larger flocs and a higher floc settling speed in the sedimentation unit, which effectively reduced the influent turbidity of the UF module. However, as shown in Figs. 3 and 4, the workable flux was much lower than the maximum value and the RTMP was much higher than the minimum one when agitation speed was carried out at 20 rpm, indicating that the turbidity value in the influent of the UF module was not a conclusive factor in the range of workable flux and membrane fouling at the turbidity range of this pilot test.

Performance of coagulation settling unit on turbidity removal.
The fact that some devices and membrane filtration systems consider turbidity as one of the most important factors for the flux and membrane fouling cannot be denied. Our study suggested that turbidity under a certain scope has limited effects on membrane fouling. Thus, the presence of dissolved organic matter may be the controlling factor in the fouling by this coagulated river water. The presence of turbid substance may even lighten membrane fouling, especially when the membrane process is combined with coagulation through the adsorption of organic compounds, thereby avoiding direct contact between the organics and the membrane surface.
Organic matters [especially the NOM (Jermann et al., 2008)] and membrane structure [such as the hydrophilicity and antibacterial properties (Lin et al., 2015)] are widely accepted to be major contributors to the reversible and irreversible fouling of the UF membrane. Apart from carrying out measures to modify membranes to gain the lower reversible and irreversible resistances, which demonstrate the lower fouling characteristics for the UF membrane (Lin et al., 2013), avoiding or reducing the accumulation of organic pollutants on the membrane surface will be extremely important as well.
Removal of CODMn by the sedimentation unit increased first then decreased with the increase in the rotational speed in the coagulation stage. The maximum removal rate of the CODMn by sedimentation was obtained when agitation speed was 30 rpm (22.0%), as shown in Fig. 6. However, the best CODMn removal rate of the overall CS–UF system, which was up to 53.7%, was obtained under an agitator rotational velocity of 40 rpm. Meanwhile, the CODMn concentration in the influent and effluent of the UF unit presented the lowest values as shown in Fig. 7. These results were considered to be correlated with the range of workable flux and the degree of membrane fouling. As for the UF influent, a lower CODMn concentration in the influent could result in lower fouling load of the UF membrane. As for the UF effluent, the lower concentration of CODMn in the effluent of the CS–UF system indicated that lower organic matter content penetrated through the membrane and that this part of the organics was likely in direct contact with the membrane surface rather than absorbed and retained by the cake layer. This contact led to the increase in the risk of pores blocking and adsorption (Fu et al., 2008). The cake layer formed on the membrane surface by the flocs had excellent micromolecular organic retention capacity and, thus, played a significant role in preventing fouling as a protective layer and in avoiding organic matters from getting deposited on the membrane surface and adsorbed by the membrane pores (Dong et al., 2007). Figure 7 shows that the CODMn concentration in the effluent of the CS–UF system reversed the trend of the attenuation slope of SF obtained from the fitting curve equation of the SF–flux, which represented the maximum workable flux. The results from the analysis by SPSS indicated that Pearson correlation coefficient of the CODMn concentration in the effluent of the UF unit with the maximum workable flux was −0.913 at the 0.05 level (two tailed). Therefore, removing as much organic contaminants as possible through the CS–UF process is the key to reducing membrane filtration resistance and improving the range of workable membrane flux, which is consistent with the information in the literature (Xia et al., 2007; Xiangli et al., 2008).

Performance of coagulation settling unit on CODMn removal.

Effects of CODMn on attenuation slope of SF. SF, specific flux.
Interestingly, Bian et al. (Bian et al., 1998) considered the phenomenon where the UV260 in the influent and effluent of the UF unit presented the lowest value as a reference for judging the optimal coagulant dosage because they found that membrane filtration resistance reached the lowest level under the coagulant dosage. Our results indicated that phenomenon could also be used to determine the best agitation speed or the velocity gradient in the coagulation process of the CS–UF system. The 40 rpm tests had the lowest SF attenuation and the highest CODMn removal; with the coagulation process involved, it is hypothesized that the part of organics removed by the UF was adsorbed in the cake layer, formed by flocs, rather than contacted with the membrane surface directly; the more organic removal efficiency by UF module, the lower organics penetrated through the membrane, which reduced the risk of pores blocking and adsorption.
Effects of in situ chlorination on range of workable membrane flux
Figure 1 shows that the agitator rotational velocity in the coagulation unit was controlled at 40 rpm in CS–C–UF process. NaClO was added to the effluent of the feed tank, which was continuously pumped into the UF module. The effects of the different concentration gradients of NaClO ranging from 0 to 8 mg/L were investigated. Although the NaClO dosage should not be too high (>1 mg/L) in drinking water treatment due to the risk of the changes of membrane properties and the formation of DBPs, the concentration gradients of NaClO were controlled in a large scale, even up to 8 mg/L, to heighten the effects of the NaClO dosage on membrane fouling. As shown in Fig. 8, the maximum workable membrane flux exhibited a downtrend along with the increase of the NaClO dosage. This result indicated that the NaClO dosage had an adverse influence on the filter performance of the membrane instead of alleviating membrane fouling as reported by Wang et al. (Wang et al., 2016), whose article indicated that a relatively low dosage of NaClO added to the submerged membrane tank could effectively lower the hydraulically irreversible fouling resistance in the CS–UF system. Therefore, we believe that for treating Minjiang River water, a high NaClO dosage is not suitable after the coagulation–sedimentation unit and before the UF unit.
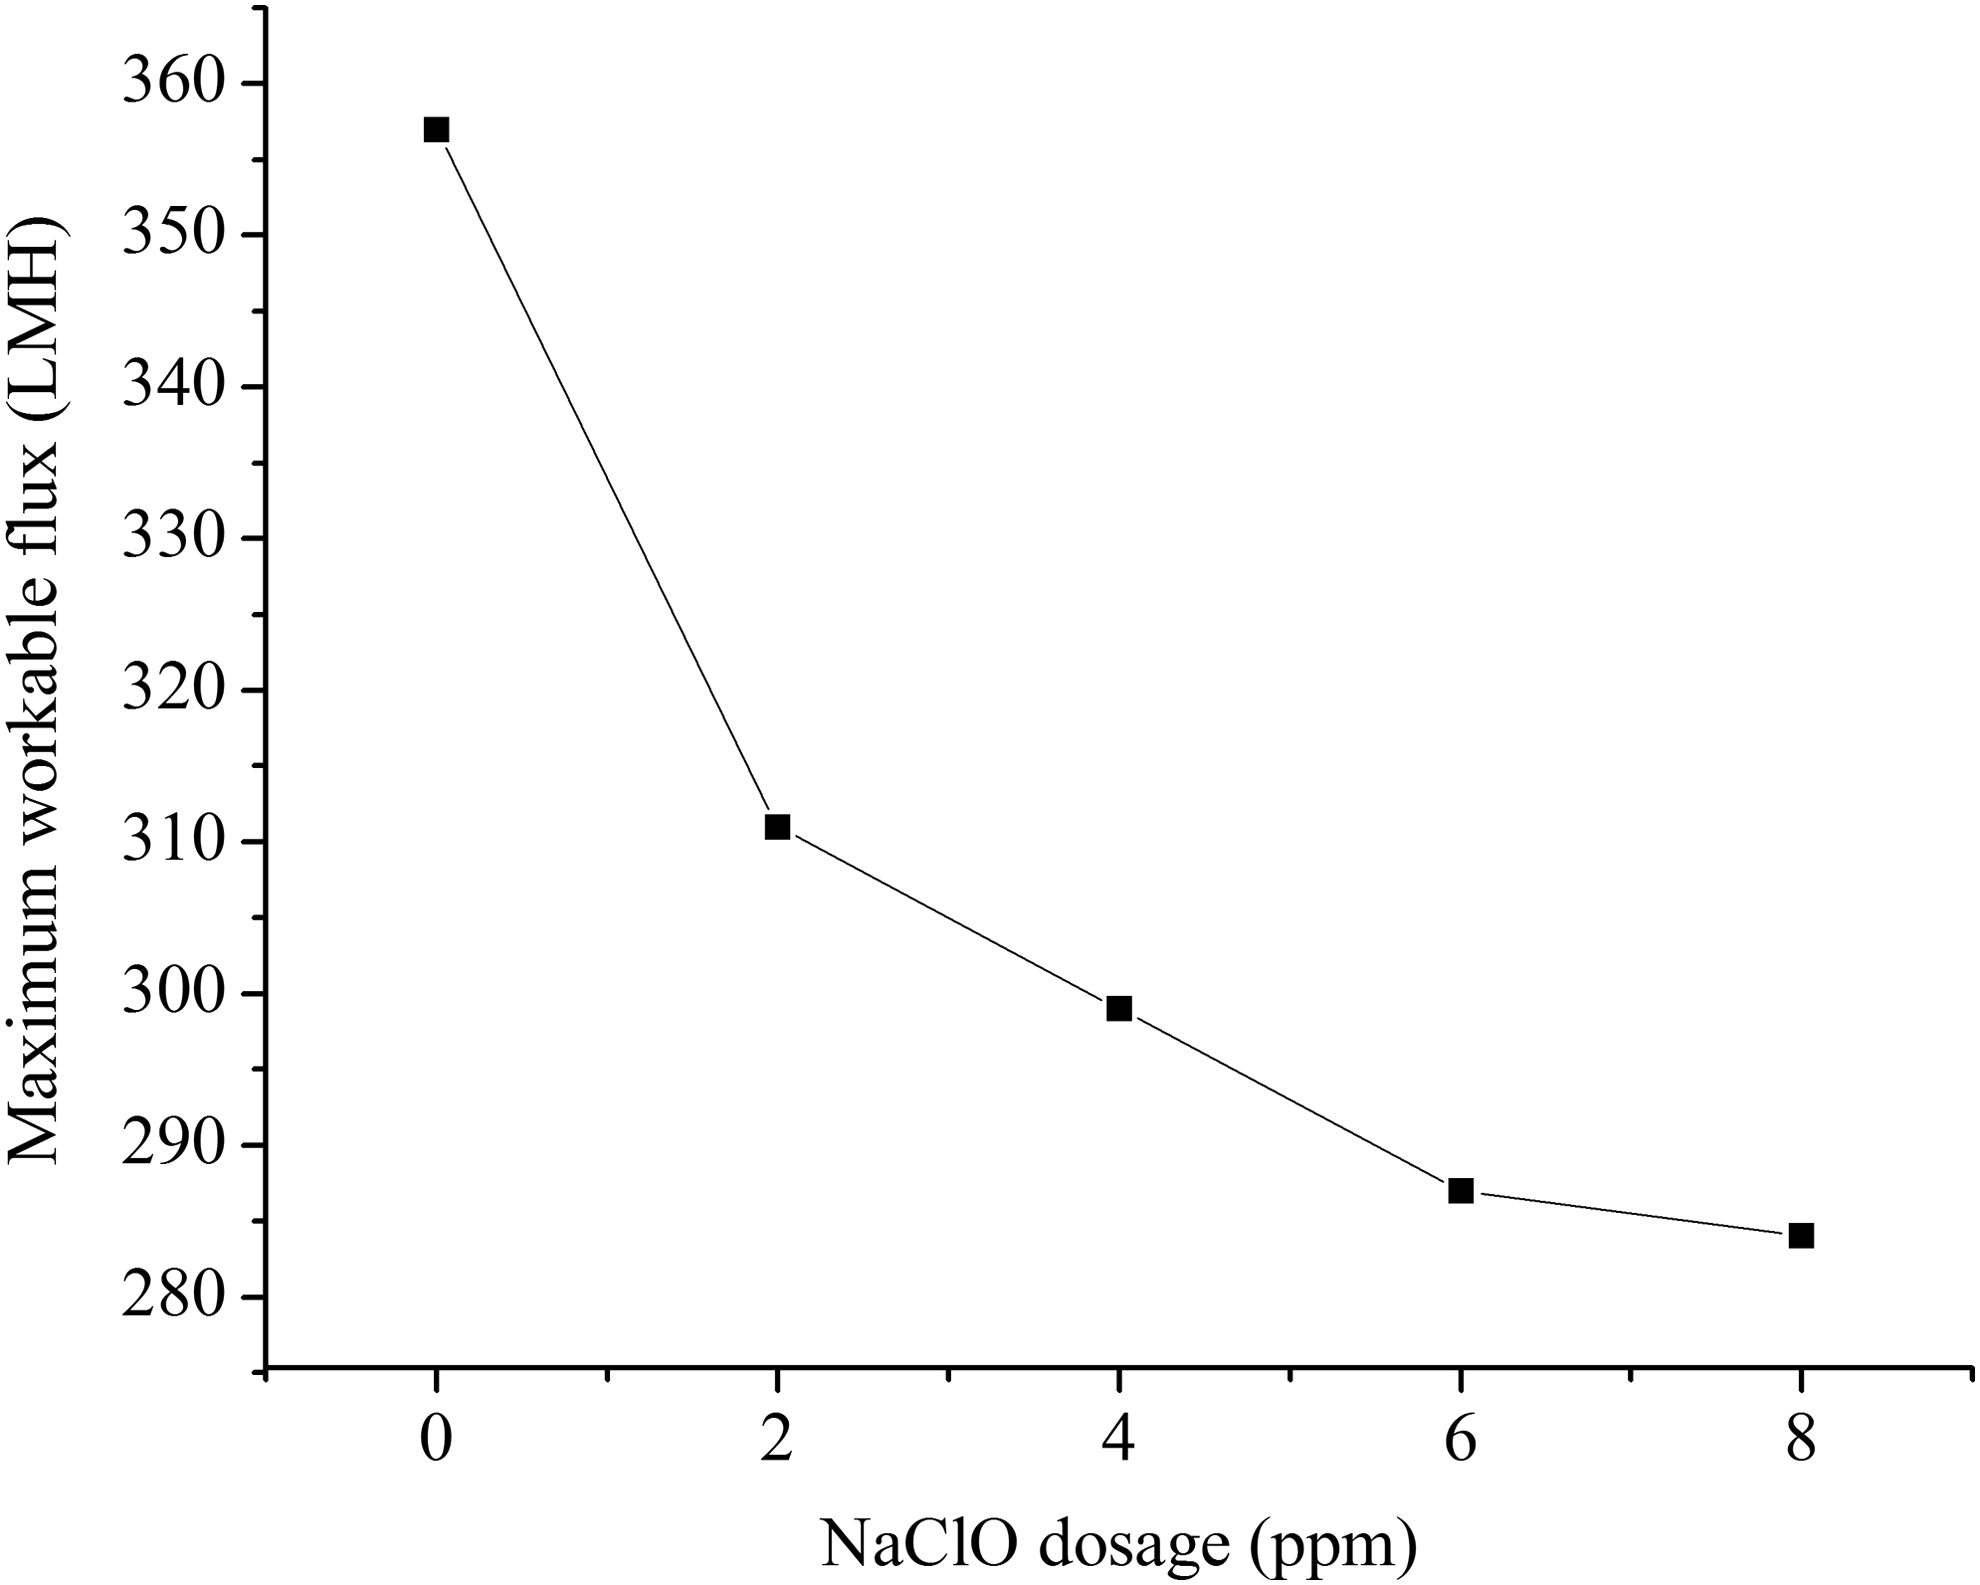
Effects of NaClO dosage on maximum workable membrane flux.
In fact, NaClO readily oxidizes aromatic humic substances and demonstrates a higher reaction rate with humic fouling (Xing et al., 2011). It is hypothesized that the cake layer formed by flocs, which acted as a protective layer, was easily destroyed when exposed to free chlorine generated by NaClO, thereby presenting an effect virtually identical to the clean in place process. The process refers to the use of various chemical agents to clean a wide range of filtration processes (Yun et al., 2015). This cleaning would destroy the cake layer, leading to some loss of adsorption and screen filter function of the membrane. Some parts of the organic matters in the influent of the UF module, which were supposed to be adsorbed and retained by the cake layer, might come into direct contact with the membrane surface, leading to a higher σ and a lower range of workable membrane flux.
Effects of in situ chlorination on membrane fouling and efficiency of contaminant removal by CS-C-UF
Turbidity removal by the CS–C–UF process has not been looked into adequately because the dosing point of NaClO does not affect the treatment effect of the coagulation and UF units. We find that the effluent turbidity of CS–C–UF differs slightly under different concentration gradients of NaClO ranging from 0 to 8 mg/L, which is presented in Table 4. Compared with the CS–UF process without NaClO dosage, the effluent of the CS–C–UF process decreased slightly, indicating that NaClO can actually strengthen the turbidity filtration function of UF membrane, especially for removing the small particles.
Analyzing the relationship between the organic concentration in the influent and effluent of the module and membrane performances is important. Figure 9 shows that the changing trend of the CODMn values in the membrane influent was the opposite of that of the maximum workable membrane flux and that their Pearson correlation coefficient reached a significant level of up to 0.902 at the 0.05 level (two tailed). The maximum workable flux in CS–UF was correlated primarily with the organics in the membrane effluent, but not the influent. As demonstrated above, the cake layer formed by flocs in the CS–C–UF process was likely destroyed by the free chlorine generated by NaClO, which resulted in direct exposure of the UF membrane to the organics. Therefore, compared with CS–UF, the CODMn values in the membrane influent presented a relatively consistent trend with the range of workable membrane flux in CS–C–UF process.
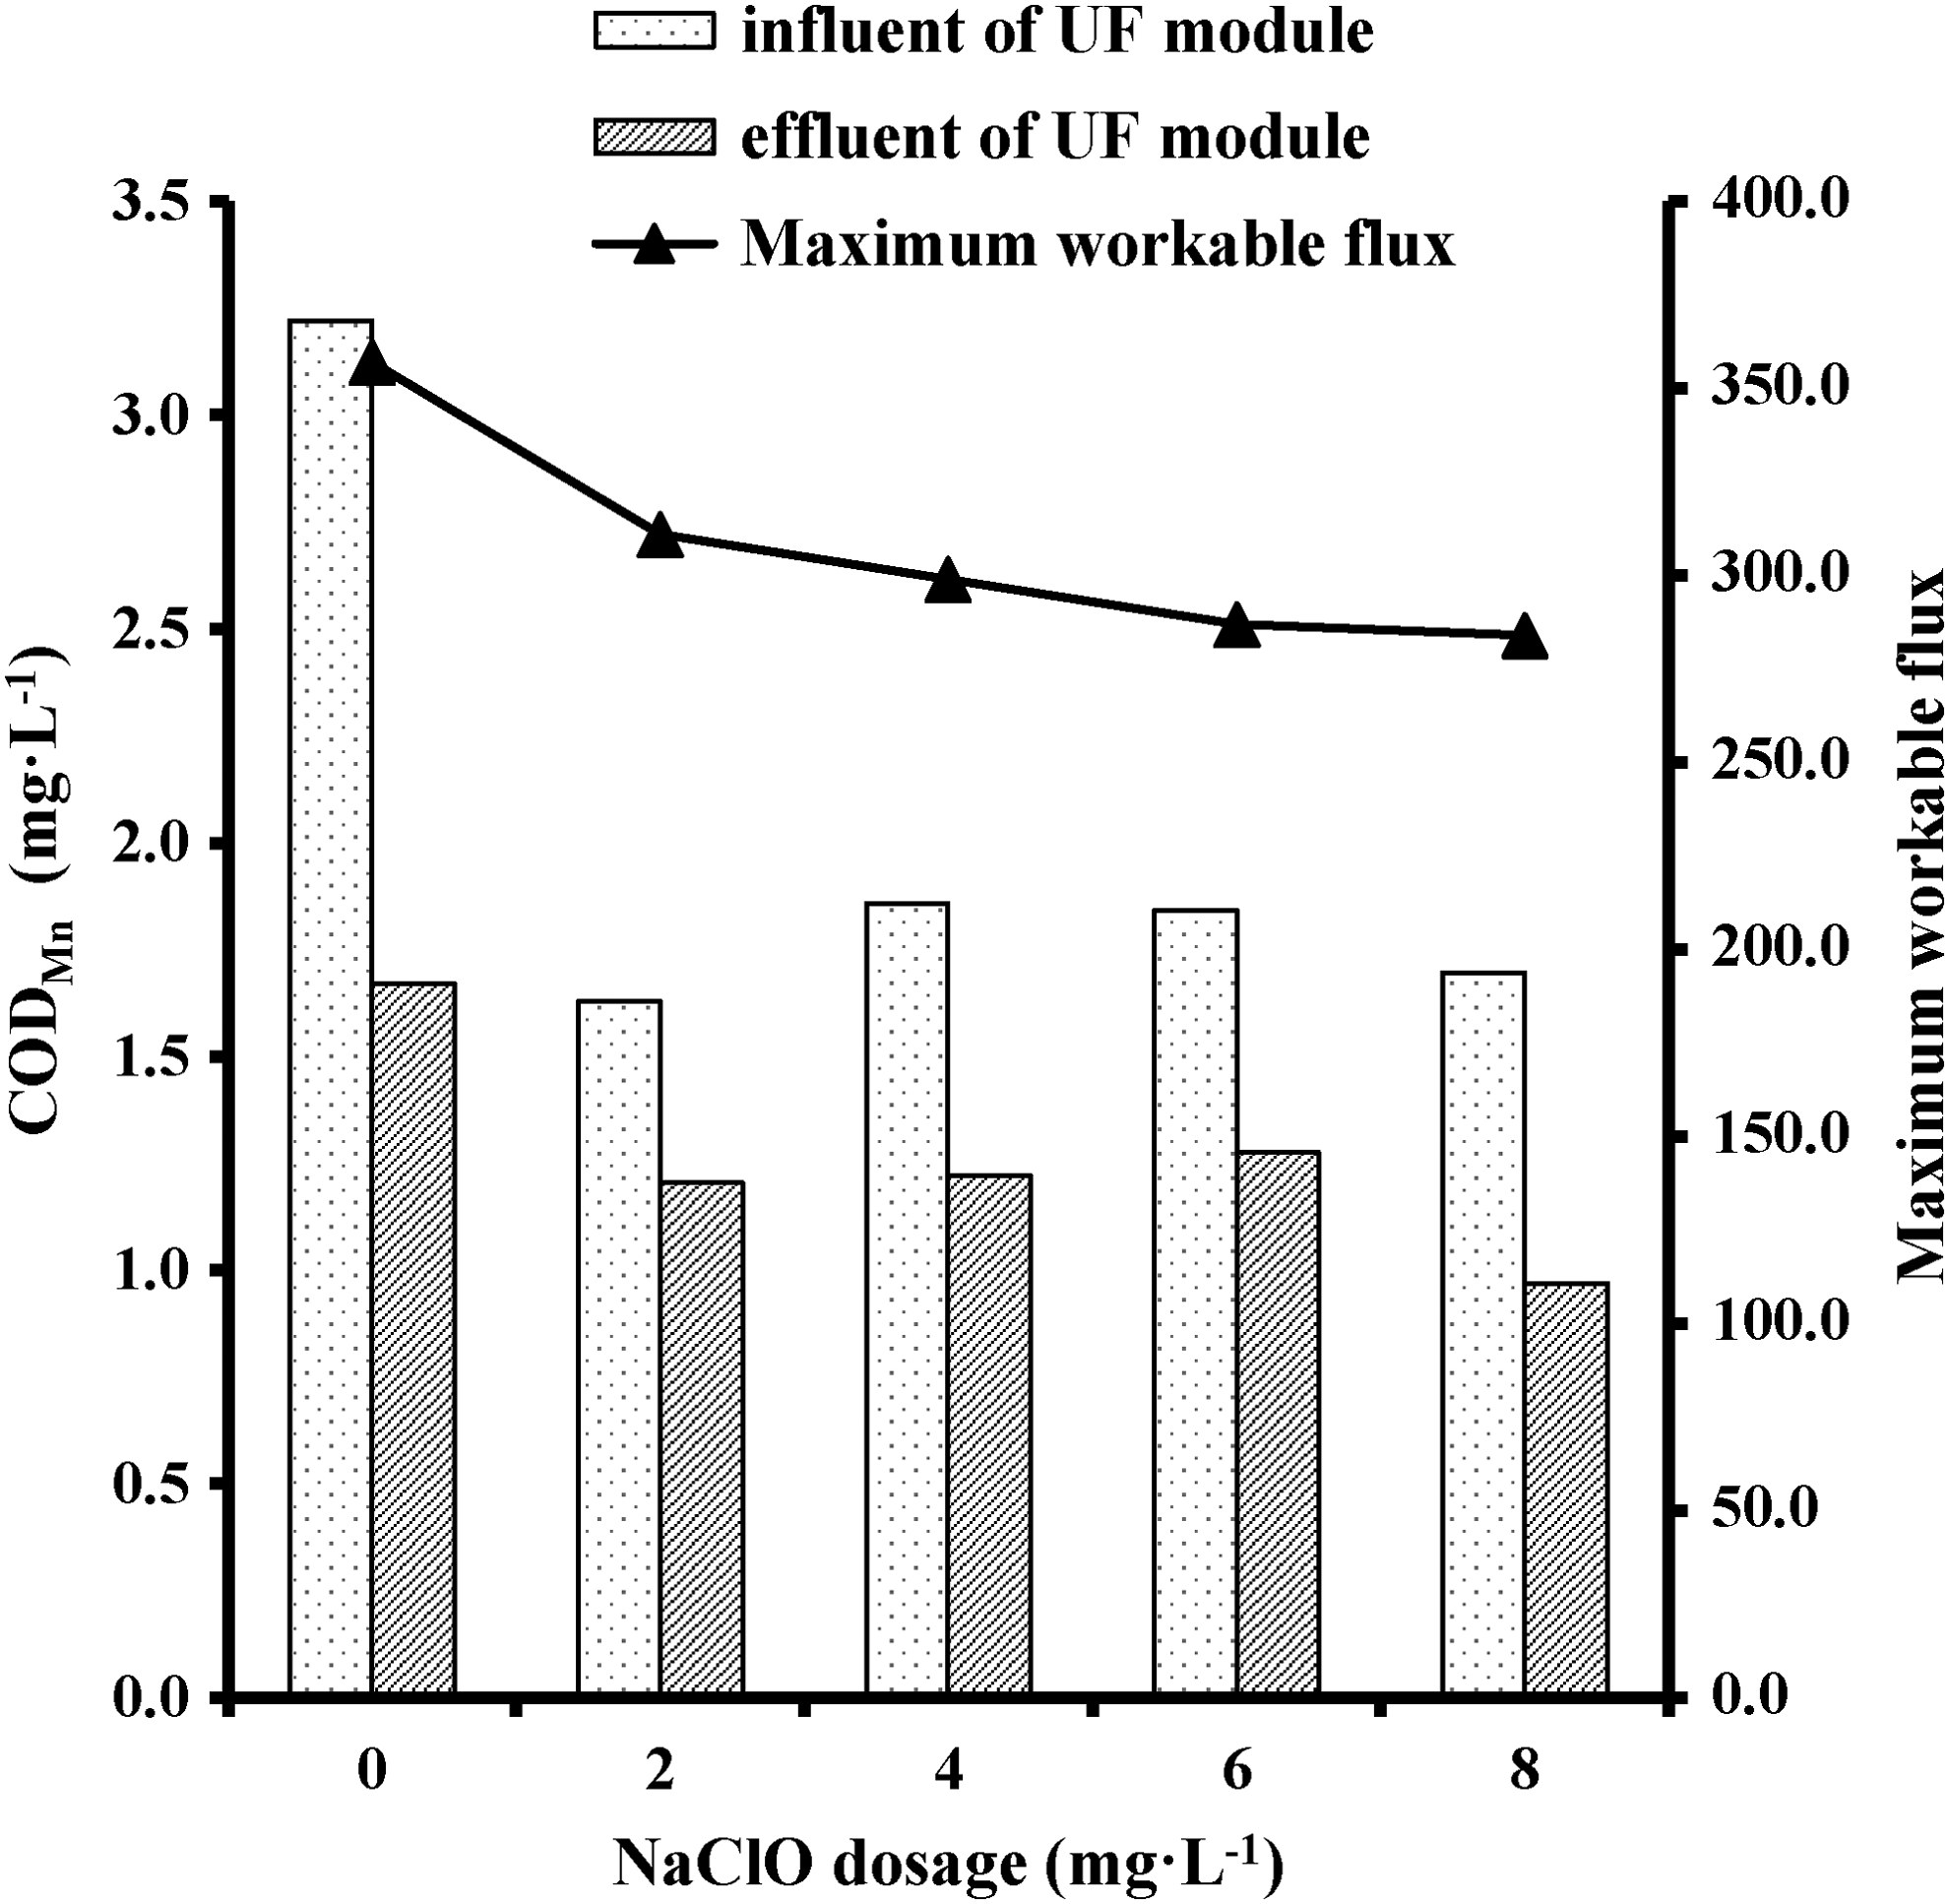
Effects of CODMn on maximum workable membrane flux in CS–C–UF system.
Agitator rotational velocity in the coagulation unit, membrane flux, and NaClO dosage was controlled at 40 rpm, 85 LMH, and 1 mg/L, respectively, to investigate further the effect of the prechlorination unit on membrane fouling. The σ was studied. Figure 10 shows that a clear monotonic positive association between the σ and the removal efficiency of CODMn by the UF module and their Pearson correlation coefficient was up to 0.919 at the 0.05 level (two–tailed). A higher removal rate of CODMn could possibly mean that more organic matters, especially NOM, such as hydrophilic neutral and hydrophobic acids that cause membrane fouling (Guo et al., 2012), were deposited and adsorbed on the membrane pores, thereby aggravating membrane fouling to some extent.
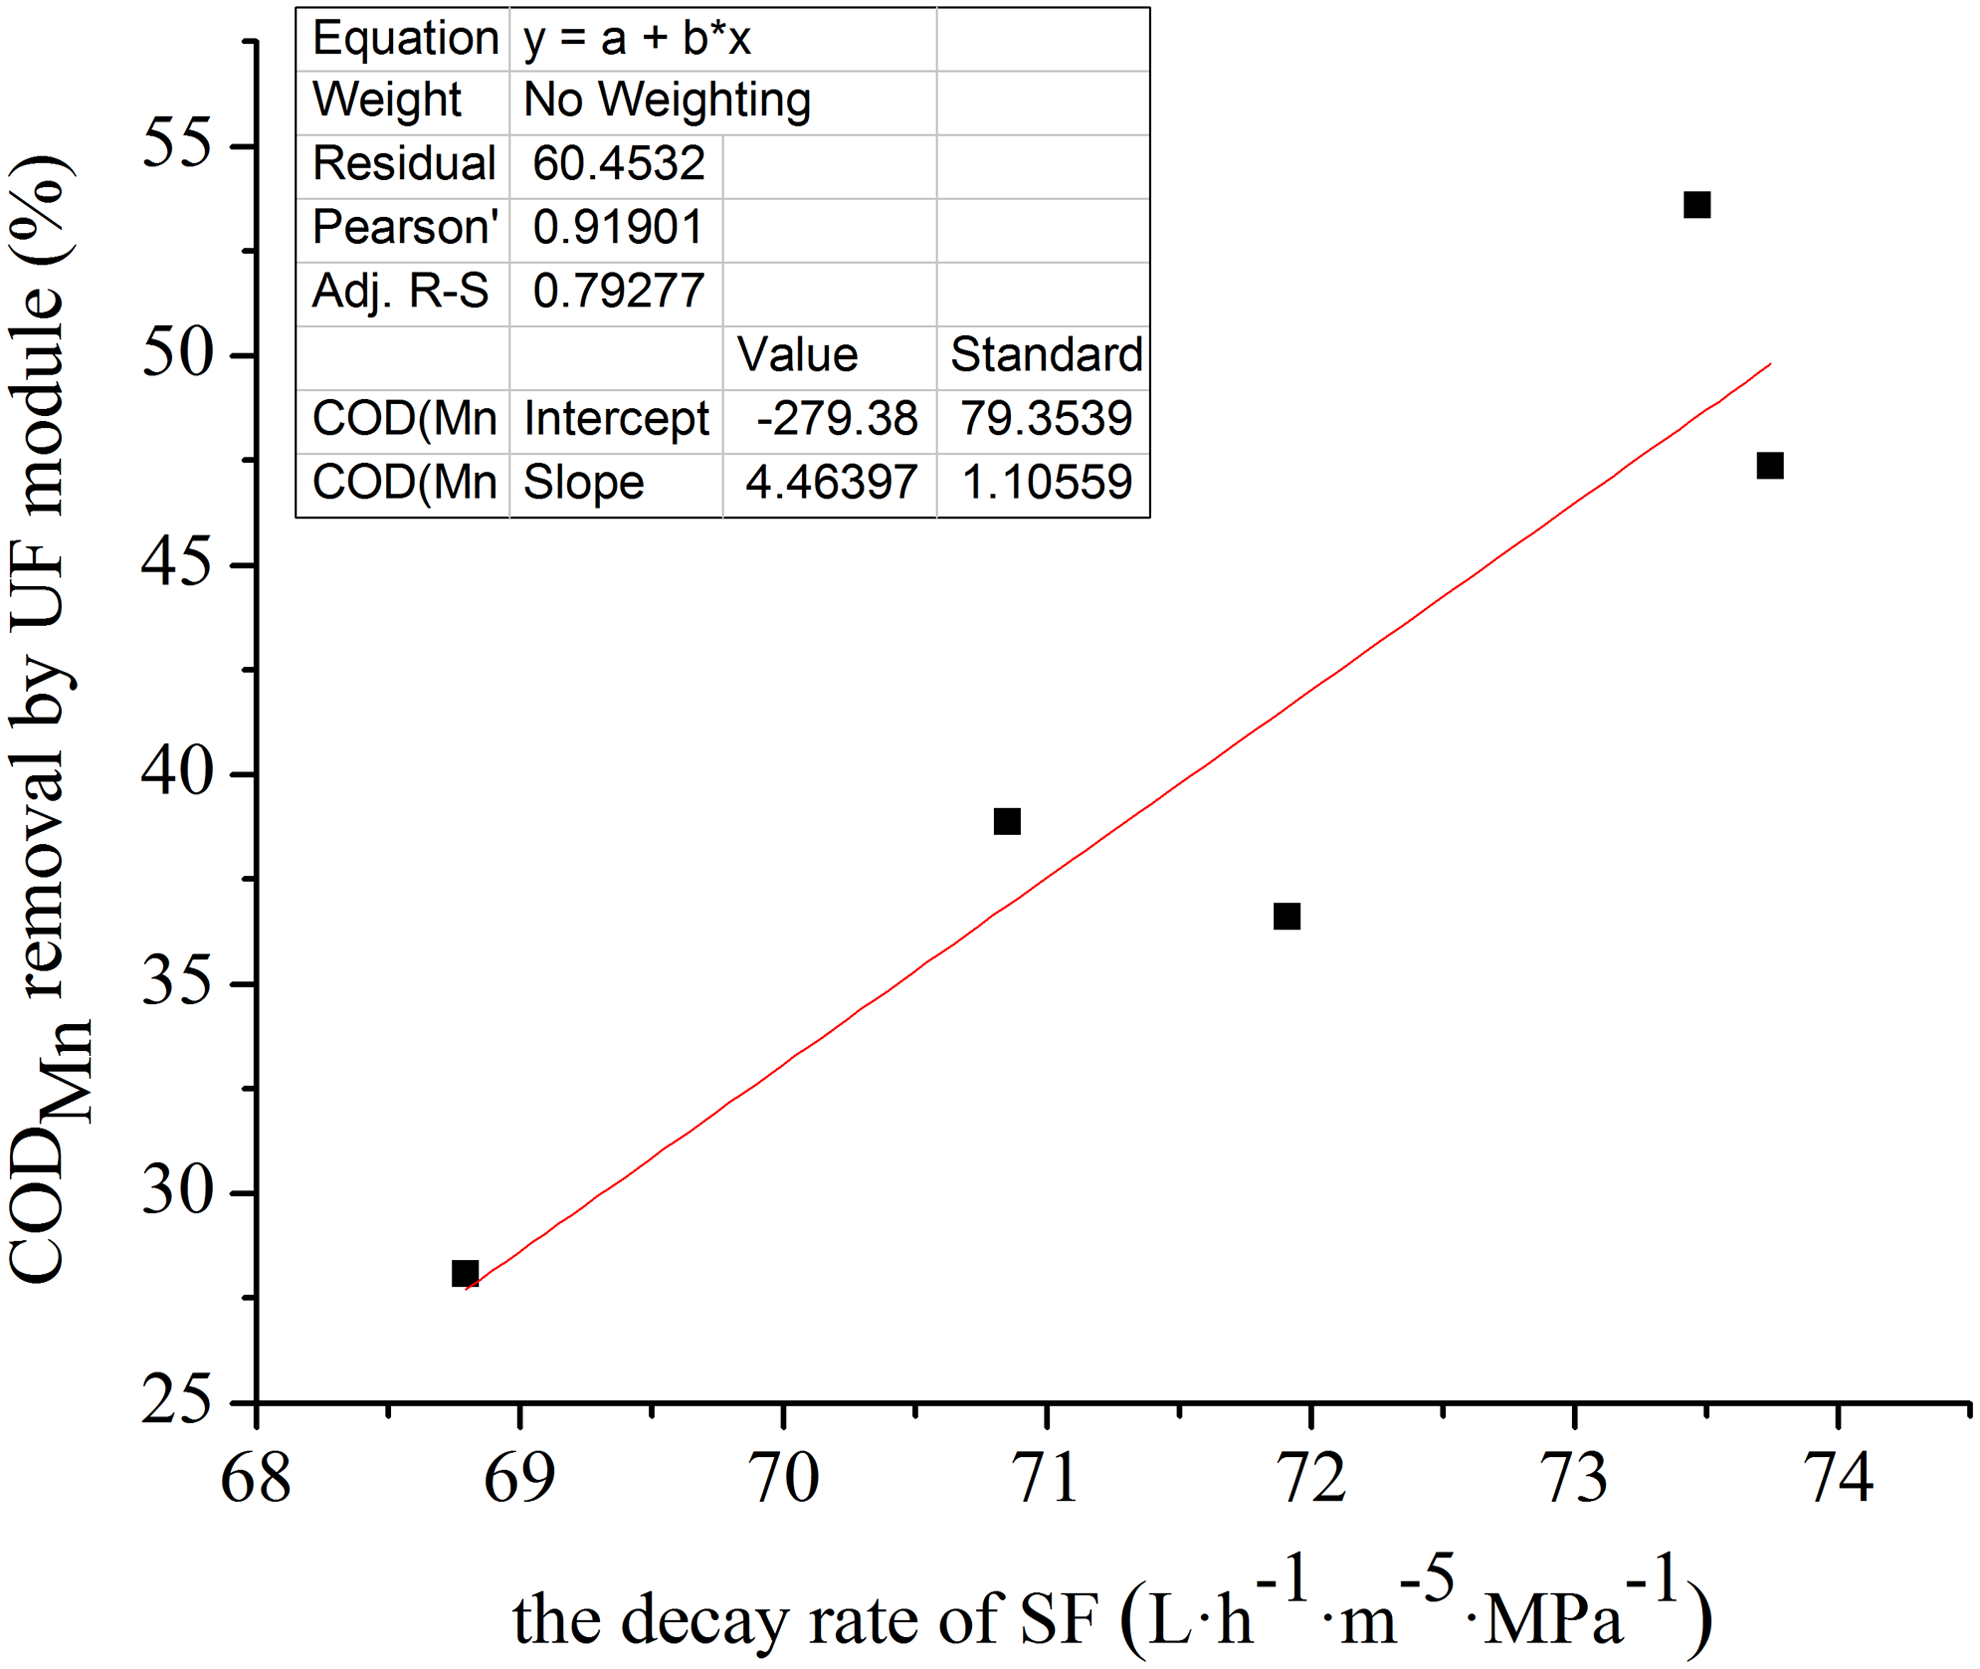
Linear fit for σ and removal rate of CODMn by UF module. UF, ultrafiltration.
Optimization of overall operation parameters for minimizing σ using RSM
The coefficient of the model for the response was estimated using multiple regression analysis method based on the results in Table 3 using Equation (5). The regression equation using the full factorial central composite design after we removed the insignificant model term (x2x3) was established as follows:
Significance of the regression model in terms of ANOVA (Table 5) was examined by F-test and p-value. The p-value for the model was less than 0.0001, which supported the high significance of the corresponding model for σ. The “Lack of Fit” value was also found to be insignificant, indicating that the model was desirably fit. “Adeq Precision” measured the signal to noise ratio, a ratio greater than 4 is desirable, and our ratio of 38.332 indicates an adequate signal. A Prob>F value that is more than 0.0500 indicated that model terms are insignificant. In this case, x2, x3, x1x2, x1x3, x12, x22, and x32 were significant model terms. According to the model term significance (based on the magnitude of F-value) (Zularisam et al., 2006), the second order effect of x1 was the most significant factor for σ, followed by the main effect of x2, the two-level interaction of x1x3, the second order effect of x3, the second order effect of x2, the two-level interaction of x1x2, the main effect of x3, the main effect of x1, and the two-level interaction of x2x3. The determination coefficient (R2) was 99.27%, with a low-level coefficient of variation (CV = 2.81), indicating that the predicted values corresponded well with the actual values and indicated the good precision and reliability of the experiments. The adjusted determination coefficient was up to 0.9854, implying that 98.54% of the variability in the experimental data can be explained by the model. Therefore, this model can be used to navigate the design space.
Values of “prob>F” less than 0.0500 indicate that model terms are significant.
ANOVA, analysis of variance.
The 3D response surface plots for σ are shown in Fig. 11. In each figure, one factor was maintained constant at its optimal value. This optimal value was determined using response surface method. The results are as follows: agitator rotational velocity: 40 rpm, NaClO dosage: 0 mg/L, and operating flux: 100 LMH. Under these conditions, the predicted σ was 47.94 L/[h·m5·MPa], which was in excellent agreement with the actual mean value (49.80 L/[h·m5·MPa]), which was obtained by repeating the experiment and applying the selected optimal conditions. The σ was found to reach the minimum value with an agitator rotational velocity of 40 rpm in the coagulation unit, which was consistent with the aforementioned research on maximum workable membrane flux in the CS–UF system (Fig. 2). This result suggested that the degree of membrane fouling during a single filtration cycle was correlated to the membrane fouling during the overall operation of the CS–UF system.

Response surface curves of σ under different conditions.
Figure 11(a) shows that the σ presented an ascending trend with the increase of NaClO to the feed tank of the UF module, which corresponded with the results of the reduced effects on range of workable membrane flux by the NaClO dosage in the CS–C–UF system. However, the variation trend of the σ with the NaClO dosage weakened under a relatively high velocity gradient in the coagulation process and transforming into an increasing trend initially, reduced with the addition of NaClO. Maximum σ was found at NaClO dosage of around 1 mg/L. This result can be explained by the removal efficiency of aromatic/hydrophobic organic acids, which were characterized by the UV254 absorbance (Mao et al., 2013) and resulted in the aggravation of membrane fouling by surface adsorption of the UF membrane (Shao et al., 2015).
Figure 12 shows that the UV254 absorbance in the membrane effluent was no lower than that in the membrane influent with a NaClO dosage of 1 mg/L in the membrane influent. The UF unit displayed some capability for UV254 removal at NaClO dosages of 0 and 2 mg/L. The slight removal of UV254 at 0 mg of NaOCl/L, negative removal at 1 mg of NaOCl/L, and slight removal at 2 mg of NaOCl/L were in agreement with the above mentioned effects of NaClO dosage on σ using the high agitator rotational velocity in the coagulation unit (σ increased first, then decreased with the increase of the NaClO dosage). More aromatic/hydrophobic organic acids would probably penetrate the UF membrane at 1 mg/L NaClO dosage rather than in NaClO dosages of 0 and 2 mg/L. Some of the organic substances in the membrane influent could react with NaClO, which could result in functional structure change (Wang et al., 2016). The modified HA can easily pass through the membrane, because the function of adsorption and screen filter of its cake layer had been lost. Some organics, which originally did not contribute to UV254 values, were also likely to present UV254 absorbance after reacting with NaClO. During the process of membrane penetrating, some modified organic substances were likely adsorbed into the pores of the membrane, leading to an increase of σ. Furthermore, the UV254 in the membrane effluent was lower than that in the membrane influent when the NaClO dosage was increased to 2 mg/L, which indicated that high NaClO dosage was likely to degrade more organics that have UV absorption peaks at 254 nm; for instance, by the severed double bonds of the organics than the NaClO dosage of 1 mg/L.
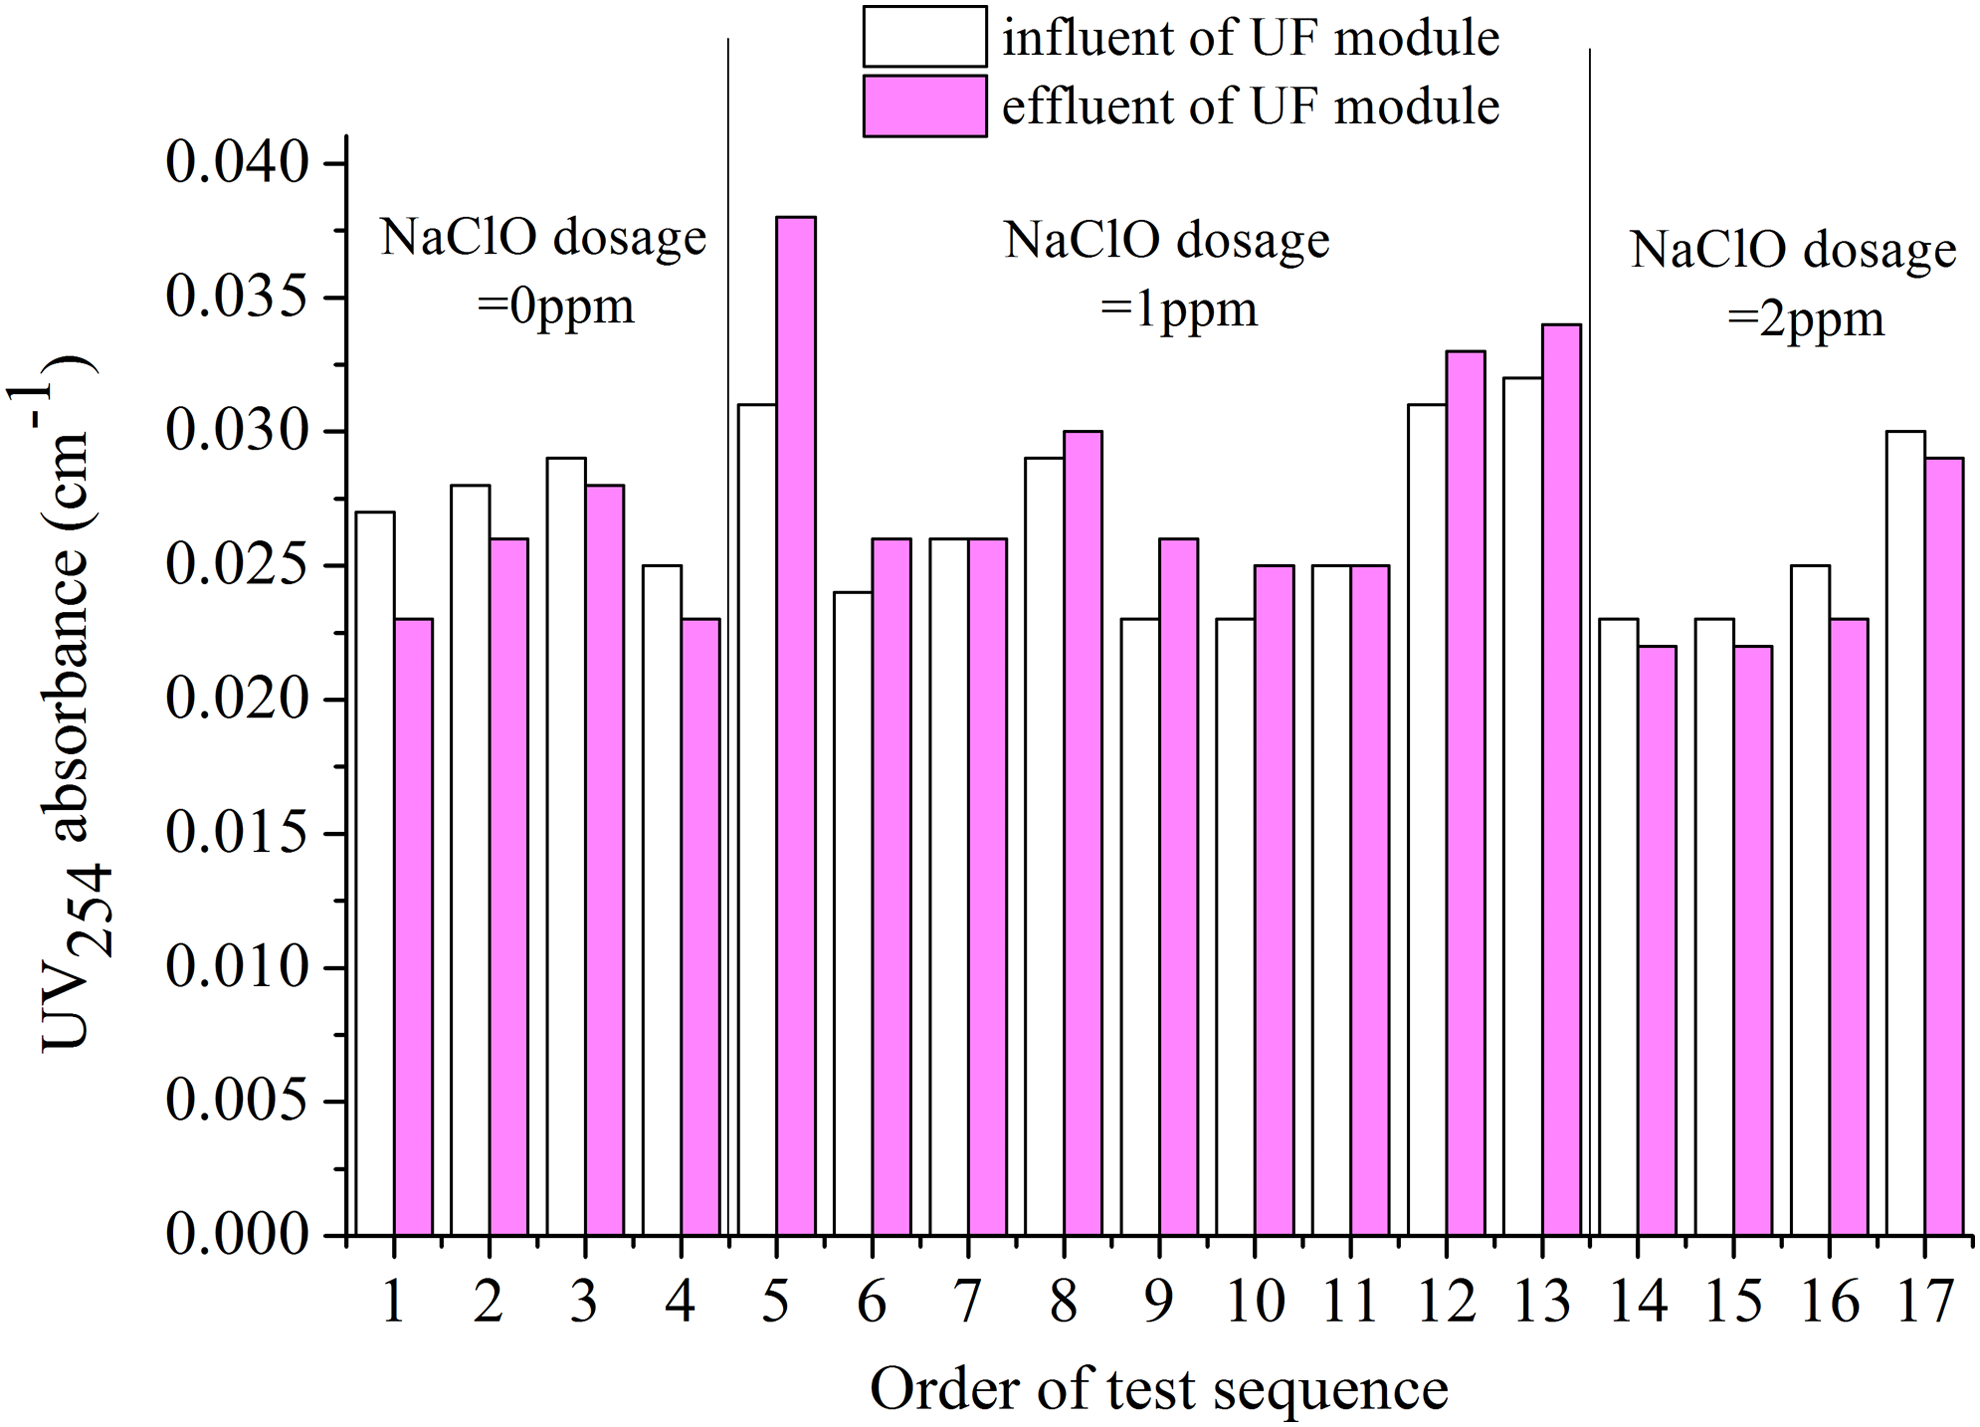
Effects of NaClO dosage on UV254 removal by UF module.
Ineffective protection of the cake layer formed by flocs under a lower agitator rotational velocity in the coagulation unit resulted in higher risks of fouling by the organics in the membrane influent. Moreover, the fouling risks would be strengthened by the NaClO, which could possibly destroy the cake layer. However, a cake layer formed under a higher velocity gradient in the coagulation process could lower the effect of the influent organics. The hypothesis of this study was that aromatic/hydrophobic organic acids, which might penetrate the UF membrane and be adsorbed into the pores of the membrane, became the dominant factor in the membrane fouling.
The module that operated under a higher velocity gradient in the coagulation process and a higher operating flux in the UF process exhibited a lower membrane fouling rate as shown in Fig. 11(b).
Flocculation is generally characterized by the mean velocity gradient (G in s−1) and is more encompassing than rotational speed. However, velocity gradients are not the same as rotational velocities. Therefore, the agitation speed in the coagulation was converted to G value based on the following equation:
where P is the mixer power at a certain agitation speed (W), μ is the absolute viscosity of water (Pa·s), and V represents the water volume (m3).
Agitation at 20, 30, 40, and 50 rpm was converted to G values in tanks 1 and 2, which are listed in Table 6.
Conclusions
A pictorial form that summarizes the contents of the article is shown in Fig. 13. This study concentrated on the impact of flocculation mixing speed on the performance of a PES hollow fiber membrane in the treatment of Minjiang River water using 4 mg/L of PACl. Overall, membrane fouling in a single filtration cycle could reflect the range of workable membrane flux. The CODMn concentration in the effluent of the CS–UF system reversed the trend of the maximum workable flux. Removing as much organic contaminants as possible is the key to alleviating membrane fouling. However, the prechlorination unit is not necessary for the treatment of this raw water. The CODMn concentration in the influent of the UF module travelled in a different direction from the maximum workable flux in the CS–C–UF process. A higher velocity gradient and operating flux exhibited slower growth rate in its filtration resistance. Response surface analysis indicated that optimum values of the experimental parameters for the agitator rotational velocity, NaClO dosage, and operating flux were 40 rpm, 0 mg/L, and 100 LMH, respectively. Under these conditions, σ reached the minimum value.

Pictorial form that summarizes contents of article.
Footnotes
Acknowledgments
We acknowledge the financial support from the National Natural Science Foundation of China (51308123), China Postdoctoral Science Foundation (2014 M561856), Science Foundation of Housing and Urban-Rural Development of Fujian (2014-K-05, 2016-K-42), and Opening Measuring Fund of Large Precious Apparatus of Fuzhou University (2016T041).
Author Disclosure Statement
No competing financial interests exist.