
Abstract
Abstract
Autotrophic denitrification and the simultaneous NH4+-N and total phosphate (TP) removal performance of elemental sulfur/lime (S/L) biofilter were investigated for the tertiary treatment of secondary effluent. Removed NO3−-N loading rate increased with the influent NO3−-N loading rate and complete denitrification was obtained at loading rates <0.298 kg/(m3·d). Half-order constants were 2.359, 3.314, 3.437, and 4.288 mgNO3−-N1/2/L1/2·h, respectively, for Empty Bed Residence Time (EBRT) of 2, 1, 0.75, and 0.5 h. Moreover, NH4+-N and TP removal performance was studied for the first time, and results indicated that NH4+-N and TP could be simultaneously removed in the S/L biofilter for tertiary denitrification. Approximately 0.081 mg/L NH4+-N was removed per mass of nitrate denitrified under condition where no nitrite was accumulated. About 0.103 mg/L TP could be removed under different EBRTs and pH was a limiting factor for phosphorus removal performance. NH4+-N and TP removal characteristics were related to NO3−-N removal along the biofilter depth. Moreover, backwashing was required when hydraulic head loss reached ∼50 cm with about 30 g NO3−-N removed. Nutrients removal performance could recover within 3–4 h. In general, sulfur/limestone packed biofilter is an economical and effective approach for tertiary denitrification. Results achieved in this study can improve the understanding of sulfur-based autotrophic denitrification for engineering application of nitrate removal from municipal wastewater treatment plant secondary effluent.
Introduction
N
Compared with heterotrophic denitrification, sulfur-based autotrophic denitrification, as described in Equation (1) (Zhang et al., 2015), has been proved as a competitive option for biological denitrification due to its several advantages (Sahinkaya et al., 2014). Elemental sulfur, as one of the sulfur-based electron donors, is cheap, chemically stable, and readily available. Also, sludge production during autotrophic denitrification is much lower compared with the heterotrophic denitrification (Oh et al., 2001). Therefore, elemental sulfur is an attractive electron source for biological autotrophic denitrification. Additionally, to buffer the generated acidity [Eq. (1)], limestone is often utilized [Eq. (2)] with elemental sulfur denitrification, namely sulfur/limestone autotrophic denitrification.
Autotrophic denitrification has been generally evaluated in lab scale bioreactors especially for drinking water (Liu et al., 2009; Sahinkaya et al., 2011; Puig et al., 2012) and groundwater treatment (Moon et al., 2008; Luna-Velasco et al., 2010). So far, autotrophic denitrification is not commonly used in conventional wastewater treatment for nitrate removal. Lv et al. (2014) developed an innovative lateral flow sulfur autotrophic denitrification reactor for nitrate removal with fairly low running resistance. A few application studies showed that sulfur compounds such as thiosulfate and sulfide (Manconi et al., 2007) along with modified spent caustic (Park et al., 2002) could be used as electron donor for efficient denitrification in activated sludge system. However, few studies have been reported for nitrate removal of the secondary effluent from MWWTP. Sahinkaya et al. (2014) studied the sulfur-based autotrophic denitrification of nitrified activated sludge process effluent in pilot and full scale column bioreactors. Yet, only the denitrification performance was mainly evaluated, while there is still no detailed information on simultaneous removal performance of other contaminants including ammonia, phosphorus, and so on that are also important limiting parameters in effluent discharge regulation.
Therefore, in this study, a sulfur/limestone autotrophic denitrification column was operated under different Empty Bed Residence Times (EBRTs). The research objectives were (1) to investigate the autotrophic denitrification performance for tertiary denitrification, (2) to examine the simultaneous ammonia and phosphorus removal performance, and (3) to examine the nutrient removal dynamics. According to the best of our knowledge, this is the first study on various nutrient removal performance of tertiary treatment using sulfur/limestone denitrification biofilter. Moreover, the running resistance and backwashing cycles were for the first time monitored and performance recovery was also examined.
Material and Methods
Bioreactor and experiments
A column bioreactor with inside diameter of 7 cm and total height of 80 cm was operated in this study. The reactor was filled with sulfur and limestone particles (both 3–5 mm in diameter) at volume ratio of 1:1. Pebbles (8–10 mm in diameter) were packed at the reactor bottom as the supporting layer. Six sampling ports were designed along with height of 10, 20, 30, 40, 50, and 60 cm from the supporting layer of the column reactor. Theoretically, the packed sulfur could satisfy the denitrification of ∼0.9 kg nitrate-N according to the Equation (1). If the reactor was applied for treatment of the municipal wastewater with influent total nitrogen concentration of about 40 mg/L, it can maintain stable operation for about 430 days.
The reactor was started with the EBRT of 120 min during the start-up period, and after a period of stable operation, the EBRT was then sequentially decreased to 60, 45, and 30 min to examine the effect of EBRT on the operation performance. Parameters of NO3−-N, NO2−-N, NH4+-N, and total phosphate (TP) in the influent and effluent were tested every 2 days to monitor the nutrients removal dynamics in the reactor. During stable operation under each EBRT, samples from different sampling ports were taken and tested to examine the nutrients removal characteristic along the column. Moreover, backwashing cycle and recovery of nutrient removal performance after backwashing was investigated to evaluate the system performance stability.
Experimental methods
Effect of pH on phosphorus removal performance
To investigate the possible limiting conditions, batch experiments were conducted as follows. The effluent of sulfur/limestone filter was separated into six beakers, and then pH was conditioned to 8.00, 8.94, 9.45, 10.00, and 10.99, and the effluent without any operation was set as the control. The six beakers were stirred under 200 rpm for 5 min and then 60 rpm for 15 min. Finally, the phosphorus concentration was determined after settling for 30 min.
Biofilter backwashing strategy
The backwashing cycle lasted 11 min and was performed by flushing the biofilter layer with compressed air for 3 min (6 L/[m2·s]) and the stored treated wastewater for 8 min (4 L/[m2·s]). From the end of backwashing, the samples were continuously taken at interval of 1 h to investigate the recovery of operation performance.
Inoculum and wastewater
The column reactor was inoculated with 1.5 L sludge (mixed liquor suspended solids [MLSS] = 3,800 mg/L) preacclimation with sodium thiosulfate (Na2S2O3·5H2O) for about 10 days. The tap water-based synthetic wastewater contained KNO3 (86 mg/L), KH2PO4 (4.4 mg/L), NH4Cl (3.92 mg/L), MgCl2·6H2O (0.03 mg/L), and FeSO4·7H2O (0.01 mg/L).
Analytical methods
Concentrations of NH4+-N, NO3−-N, NO2−-N, and SO42− and alkalinity were automatically determined by colorimetric methods with the Cleverchem 200 (DeChem-Tech.Gmbh). TP was determined by molybdate colorimetric method with a spectrophotometer (Uvmini-1240; Shimadzu). MLSS was determined by the gravimetric method.
Determination of denitrification rate of biofilter
Wastewater flow along the biofilter depth could be considered as plug flow, and the denitrification rates could be obtained with a half-order kinetic model, as follows. This model has been successfully applied to evaluate the nitrate removal efficiency of autotrophic denitrification using elemental sulfur (Darbi et al., 2003; Moon et al., 2004). Where, k1/2 is the half-order constant of autotrophic denitrification, which can be used for signifying the denitrification rate. C0 is the initial nitrate concentration at the inlet of the biofilter and Ci is the remaining nitrate concentration at different biofilter depth. H is the biofilter depth from the inlet and A is the cross-sectional area of biofiler. Q is the flow rate.
Results and Discussion
Long-term performance under different EBRTs
Denitrification performance
Initially, the biofilter was operated under EBRT of 2 h with influent nitrate concentration of about 12.5 mg/L. For a quicker acclimation of sulfur autotrophic denitrification microorganism, sodium thiosulfate was supplemented due to its easier biological utilization potential. As shown in Supplementary Fig. S1, the effluent nitrate concentration was gradually reduced and approximated to zero during the initial 1 week, indicating that the addition of sodium thiosulfate promoted the fast start-up of the biofilter and enrichment of autotrophic denitrifiers. When the addition of sodium thiosulfate was cancelled on day 7, the nitrate removal performance was unaffected. It indicated that the microbial community could adapt to the direct utilization of particle elemental sulfur as electron donor under comparatively low influent nitrate concentration. In addition, the nitrite concentration was always no more than 0.1 mg/L. Usually nitrite was prone to be accumulated in packed bed reactors under higher nitrate loadings (Tanaka et al., 2007; Sahinkaya and Dursun, 2012). This result suggested that the sulfur/limestone autotrophic denitrification biofilter was feasible for tertiary denitrification.
Figure 1a showed the denitrification performance under different EBRTs. Under EBRT of 2 and 1 h, the influent NO3−-N could almost be denitrified with removal efficiency above 99.3%. When EBRT was further decreased to 0.75 h and then 0.5 h, the effluent NO3−-N concentration was increased to 1.19 and 2.37 mg/L on average, corresponding to removal efficiency of about 90.4% and 81.0%.

Denitrification performance under different EBRTs.
However, as shown in Fig. 1b, the effluent NO2−-N was obviously increased from no more than 0.05 to 0.375 mg/L with EBRT decreased to 0.5 h, which proved that nitrite could be accumulated under shorted EBRT (Soares, 2002). It indicated the slightly incomplete denitrification, and the reduction rate of NO2− to N2 became slower than that of NO3− to NO2−. Even so, the accumulation of NO2− could still be ignored compared with that during heterotrophic denitrification under low EBRT (Wei et al., 2014; Xu et al., 2015).
Based on above discussion, EBRT of 0.75–1.0 h was suggested for tertiary denitrification of MWWTP effluent using elemental sulfur denitrification, for satisfying the class IV surface water in China. It must be pointed out that the effluent sulfate concentration was in the range of 80–120 mg/L (data not shown), which was far below the water environment quality threshold (250 mg/L) in China (GB5749-2006) and SEPA (2006).
The relationship between the influent NO3−-N loading rate and the removed NO3−-N loading rate was shown in Fig. 2. Generally, the removed NO3−-N loading rate increased with the increase of influent NO3−-N loading rate, with regression coefficient (R2) of 0.992. Under EBRT of 2, 1, 0.75, and 0.5 h, the influent NO3−-N loading rates were 0.152, 0.298, 0.395, and 0.590 kg/(m3·d), respectively, and the removed NO3−-N loading rates were 0.151, 0.293, 0.360, and 0.470 kg/(m3·d), respectively. Almost complete denitrification was attained with NO3−-N loading rate within 0.298 kg/(m3·d), which was higher than that obtained by Sahinkaya et al. (2014).
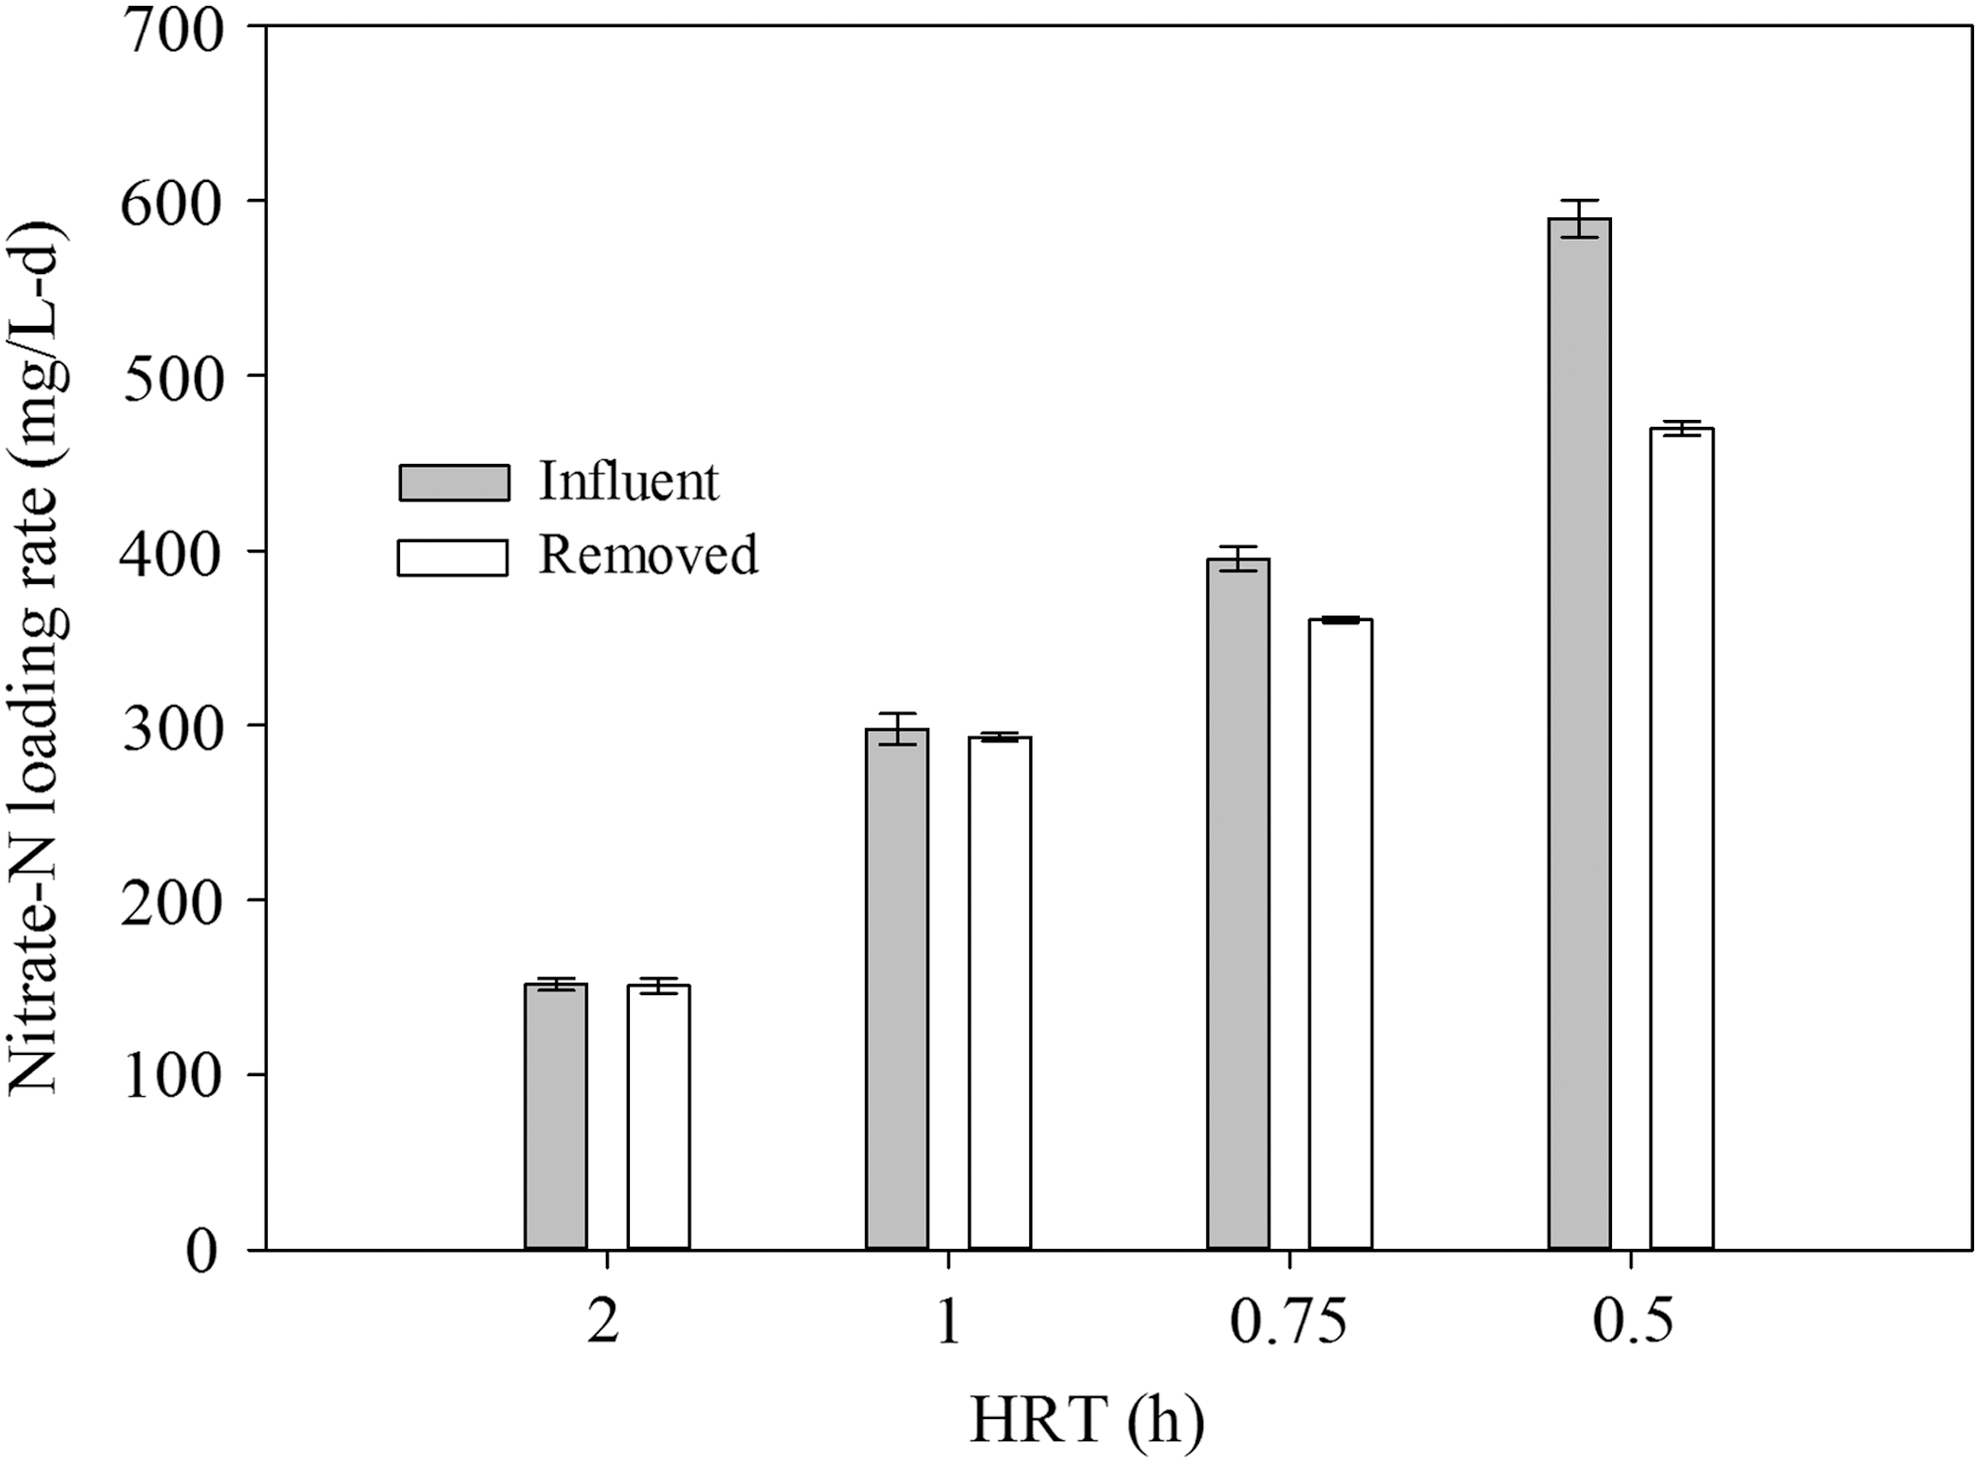
The relationship between the removed NO3−-N loading rate and the influent NO3−-N loading rate.
NH4+-N removal performance
Figure 3 showed the NH4+-N removal performance under different EBRTs in the present autotrophic denitrification biofilter. Influent NH4+-N concentration was about 1.52 mg/L. With the decrease of EBRTs, the removed NH4+-N concentration was gradually decreased. The removed NH4+-N concentrations were 1.007, 0.981, 0.794, and 0.717 mg/L respectively. However, under EBRTs of 2 and 1 h, the NH4+-N removed corresponded well with NO3−-N denitrified. Results indicated that ∼0.081 mg/L NH4+-N was removed per NO3−-N denitrified, which was in close proximity to the theoretical value of 0.08 by stoichiometry of sulfur denitrification [Eq. (1)]. Yet, only 0.071 and 0.069 mg/L NH4+-N were removed per NO3−-N denitrified when EBRTs were decreased to 0.75 and 0.5 h, which might be attributed to the accumulation of nitrite that overestimated the nitrate removal. The ammonium removal can be attributed to the participation of nitrate denitrification-based energy metabolism for cell synthesis [Eq. (1)]. For autotrophic bacteria that uses CO2 for the carbon source during cell synthesis, nitrogen is required in the form of ammonia (Metcalf and Eddy, 2003). The decrease of removed ammonia under shorter EBRTs could be attributed to the accumulation of nitrite that overestimated the nitrate removal, and then the produced energy, from the redox reaction of sulfur autotrophic denitrification, for cell synthesis, will also be reduced.

Removal performance of other pollutants under different EBRTs.
TP removal performance
TP removal performance of the biofilter under different EBRTs was profiled in Fig. 3b. Effluent TP concentration fluctuated with influent TP concentration and resulted in a similar removed TP amount. Averagely, 0.103 mg/L TP was removed under different EBRTs, corresponding to removal efficiency of 9.02%. This result indicated that EBRT had no observed effect on TP removal. Wang et al. (2015) also found that there was little change for the TP removal efficiency at different flow rate in the similar S reactor. Reason might attribute to that longer EBRT was beneficial for the dissolution of Ca2+ [Eq. (2)] while shearing force under shorter EBRT could promote the coagulation between Ca2+ and PO43− for P removal. Therefore, the biofilter demonstrated similar TP removal efficiency under different EBRTs investigated in this study. Nevertheless, increasing the influent TP concentration could promote the TP removal efficiency (Li et al., 2014), yet it was meaningless for the secondary effluent treatment from MWWTP.
The theoretical Ca2+ concentration was 22.85 mg/L under influent nitrate concentration of 12.5 mg/L and EBRT of 1.0 h, however, phosphorus removal performance was far from satisfactory. Therefore, batch experiments were conducted to investigate the possible limiting conditions and results were shown in Fig. 4. It was obviously observed that phosphorus removal performance was almost unimproved when pH was increased from 6.80 to 9.75. When pH was further increased to 10.0 and 10.99, effluent TP decreased to 0.68 and 0.29 mg/L, corresponding to removal efficiency of 38.74% and 73.88% respectively. While pH was in the range of 6.80–7.40 in the present sulfur/limestone biofilter, the phosphorus precipitant was mainly produced in the form of Ca3OH(PO4)2 and CaHPO4·2H2O, which had a comparatively higher solubility and resulted a poor phosphorus removal performance. Once pH was increased to above 10.0, phosphorus removal would be obviously improved with the precipitant of Ca5OH(PO4)3 (Song et al., 2002; Karageorgiou et al., 2007; Gutierrez et al., 2010). The above results indicated that pH value was the limiting factor for the unsatisfying phosphorus removal performance in the sulfur/limestone biofilter. The approach for enhancing the phosphorus removal performance will be discussed in our following research.
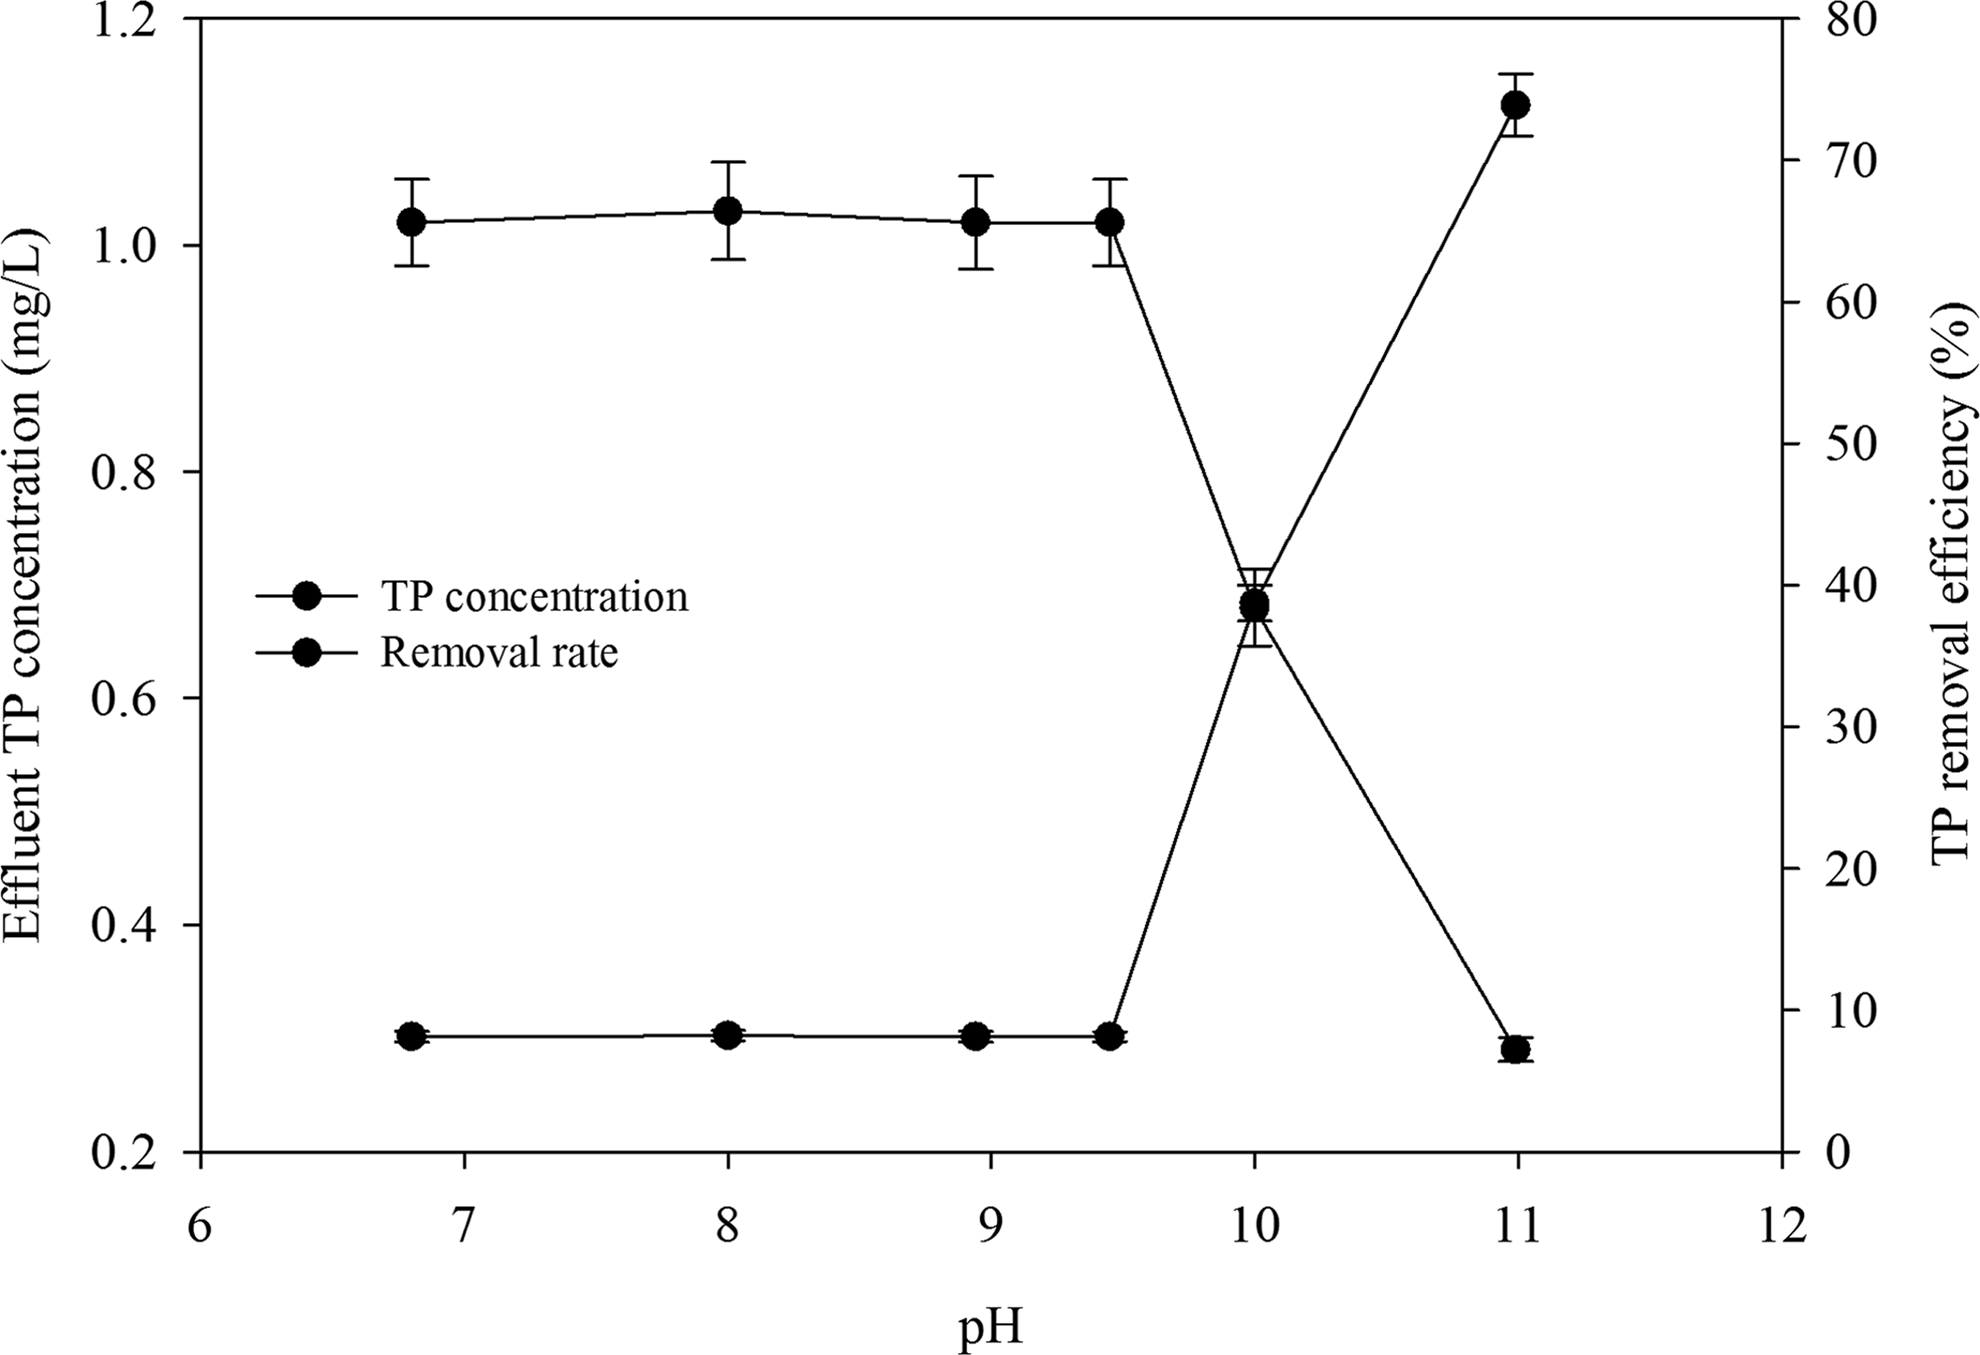
Effect of pH on phosphorus removal performance in the S/L biofilter. S/L, sulfur/lime.
Dynamics of pollutants removal along biofilter depth
Denitrification dynamics
Samples were taken every 10 cm along the biofilter depth, and dynamics of NO3−-N and NO2−-N concentrations were shown in Fig. 5a. Under EBRTs of 2.0 and 1.0 h, NO3−-N was rapidly removed with the depth of 40 cm, more than 90% of NO3−-N was removed. With EBRTs decreased to 1.0 and 0.75 h, NO3−-N concentration became evenly decreased along the biofilter. Moreover, slight NO2−-N accumulation were observed under different EBRTs. NO2−-N concentration reached the highest level at the biofilter depth of 10–20 cm and then gradually decreased. With the decrease of EBRTs, the acculumated NO2−-N concentrations were increased, yet the effluent nitrite concentrations were all <0.40 mg/L under different EBRTs, as previously mentioned.
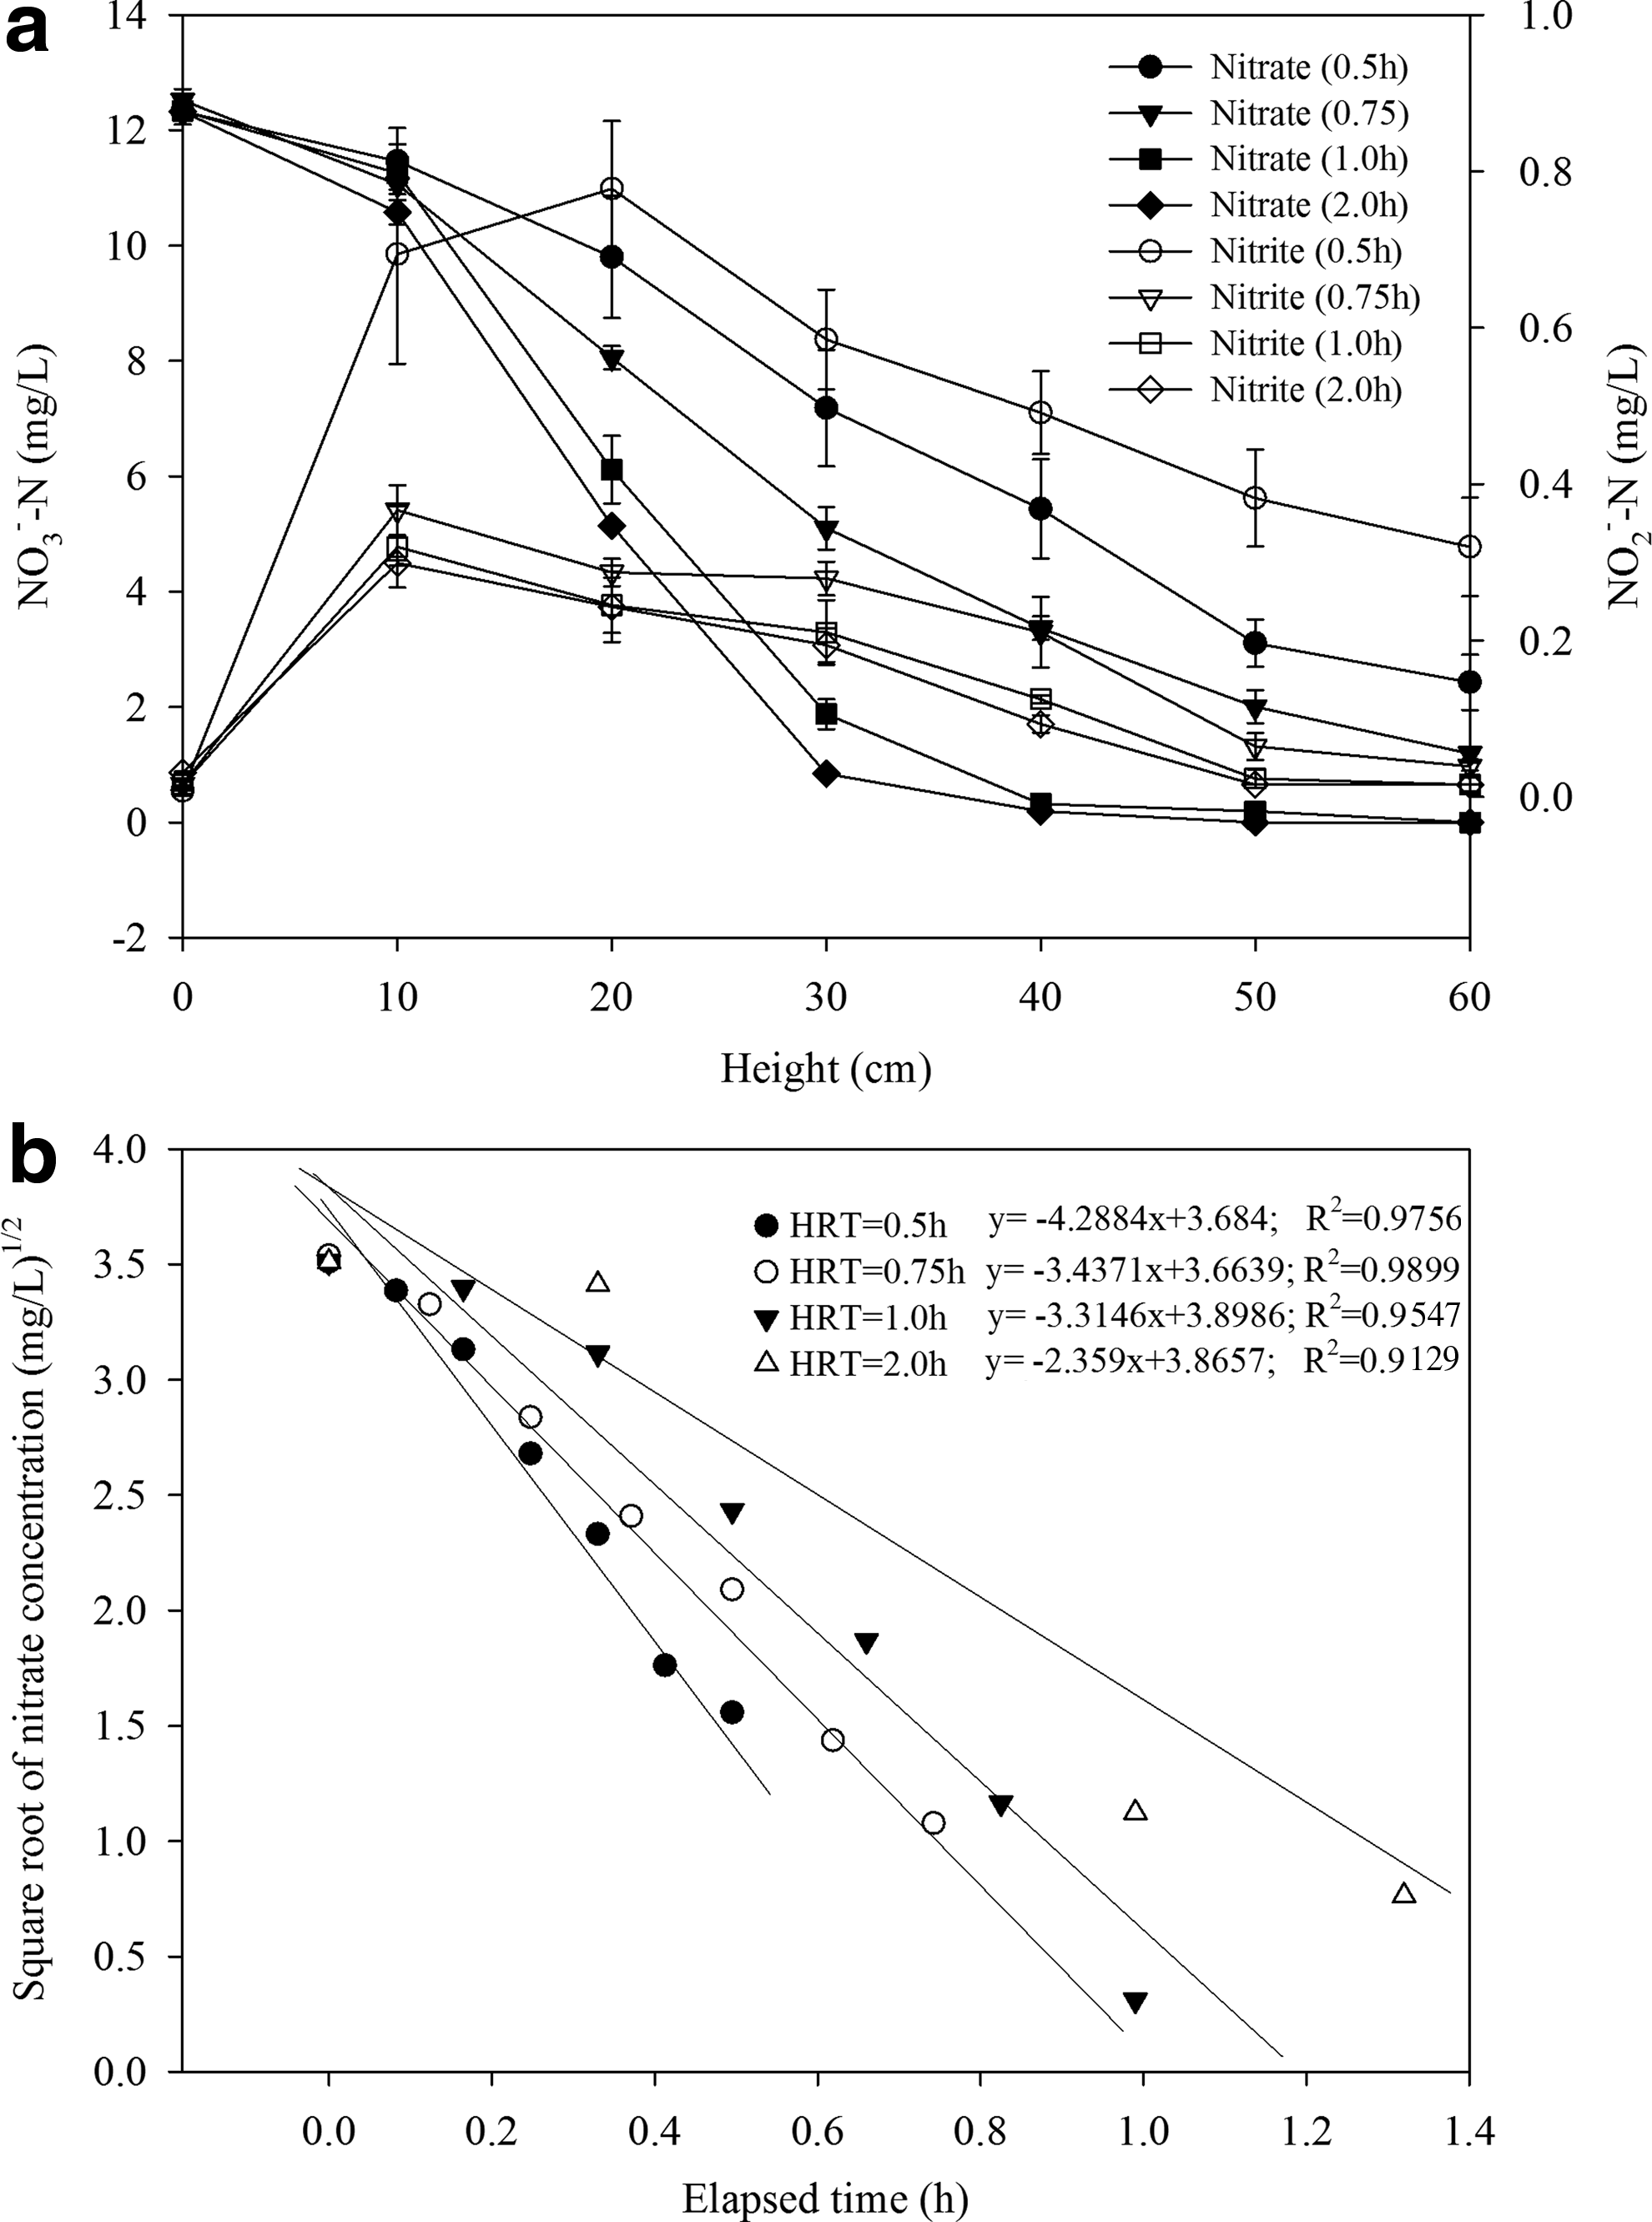
Denitrification dynamics along the biofilter depth under different EBRTs.
Using the half-order kinetic model of Equation (2), the denitrification rates were calculated and the regressed result was shown in Fig. 5b. The observed NO3−-N concentration kinetics in Fig. 5a correlated well with the half-order kinetic model under all EBRTs, with R2 of 0.929–0.975. Under EBRT of 2, 1, 0.75, and 0.5 h, the calculated half-order constants were 2.359, 3.314, 3.437 and 4.288 mgNO3-N1/2/L1/2·h respectively, which were comparatively lower than that obtained under higher initial nitrate concentration (Moon et al., 2006). This result also indicated that higher filtering velocity represented by shorter EBRT could promote the denitrification rate, and this was consistent with the result obtained by Soares (2002). The reason might be that the surface mass transfer can be improved under higher filtering velocity, and therefore the hydraulic uniformity and the contact opportunity between microbial organisms and nitrate could be improved.
TP and NH4+-N removal dynamics
Figure 6 demonstrated the TP and NH4+-N removal profiles along the biofilter under EBRT of 1 h. It indicated that NH4+-N removal corresponded well with NO3−-N removal that ∼0.082 mg/L NH4+-N was removed per NO3−-N denitrified, which has been discussed in the section on denitrification performance. TP was mainly removed at depth of 10–30 cm and this was in consistence with the NO3−-N removal profile. In sulfur/limestone biofilter, the TP removal was related to the dissolution of Ca2+ [Eq. (2)], which depended on the H+ production during sulfur autotrophic denitrification [Eq. (1)]. The fast denitrification at depth of 10–30 cm provided vast H+ and then Ca2+, therefore, TP was promptly removed.

Profile of NH4+-N and phosphorus removal along the biofilter depth.
Running resistance and performance recovery after backwashing
The profile of running resistance represented by hydraulic headloss with the accumulated NO3−-N removed was shown in Fig. 7a. Hydraulic headloss progressively increased with the accumulated NO3−-N removed, and the hydraulic headloss growth demonstrated a faster and faster rate. Once the accumulated nitrate removed reached ∼30 g, the hydraulic headloss approached 47.2 cm and began to exponentially increase, which indicated that backwashing was required. In our long-term operation, periodical backwashing was carried out once the hydraulic headloss reached ∼50 cm to avoid the deterioration of operation performance. Taking practical application for consideration, the backwashing cycle was about 104 days under influent NO3−-N concentration of about 12 mg/L and EBRT of 1 h, which was much less frequent than heterotrophic denitrification (Farabegoli et al., 2003).
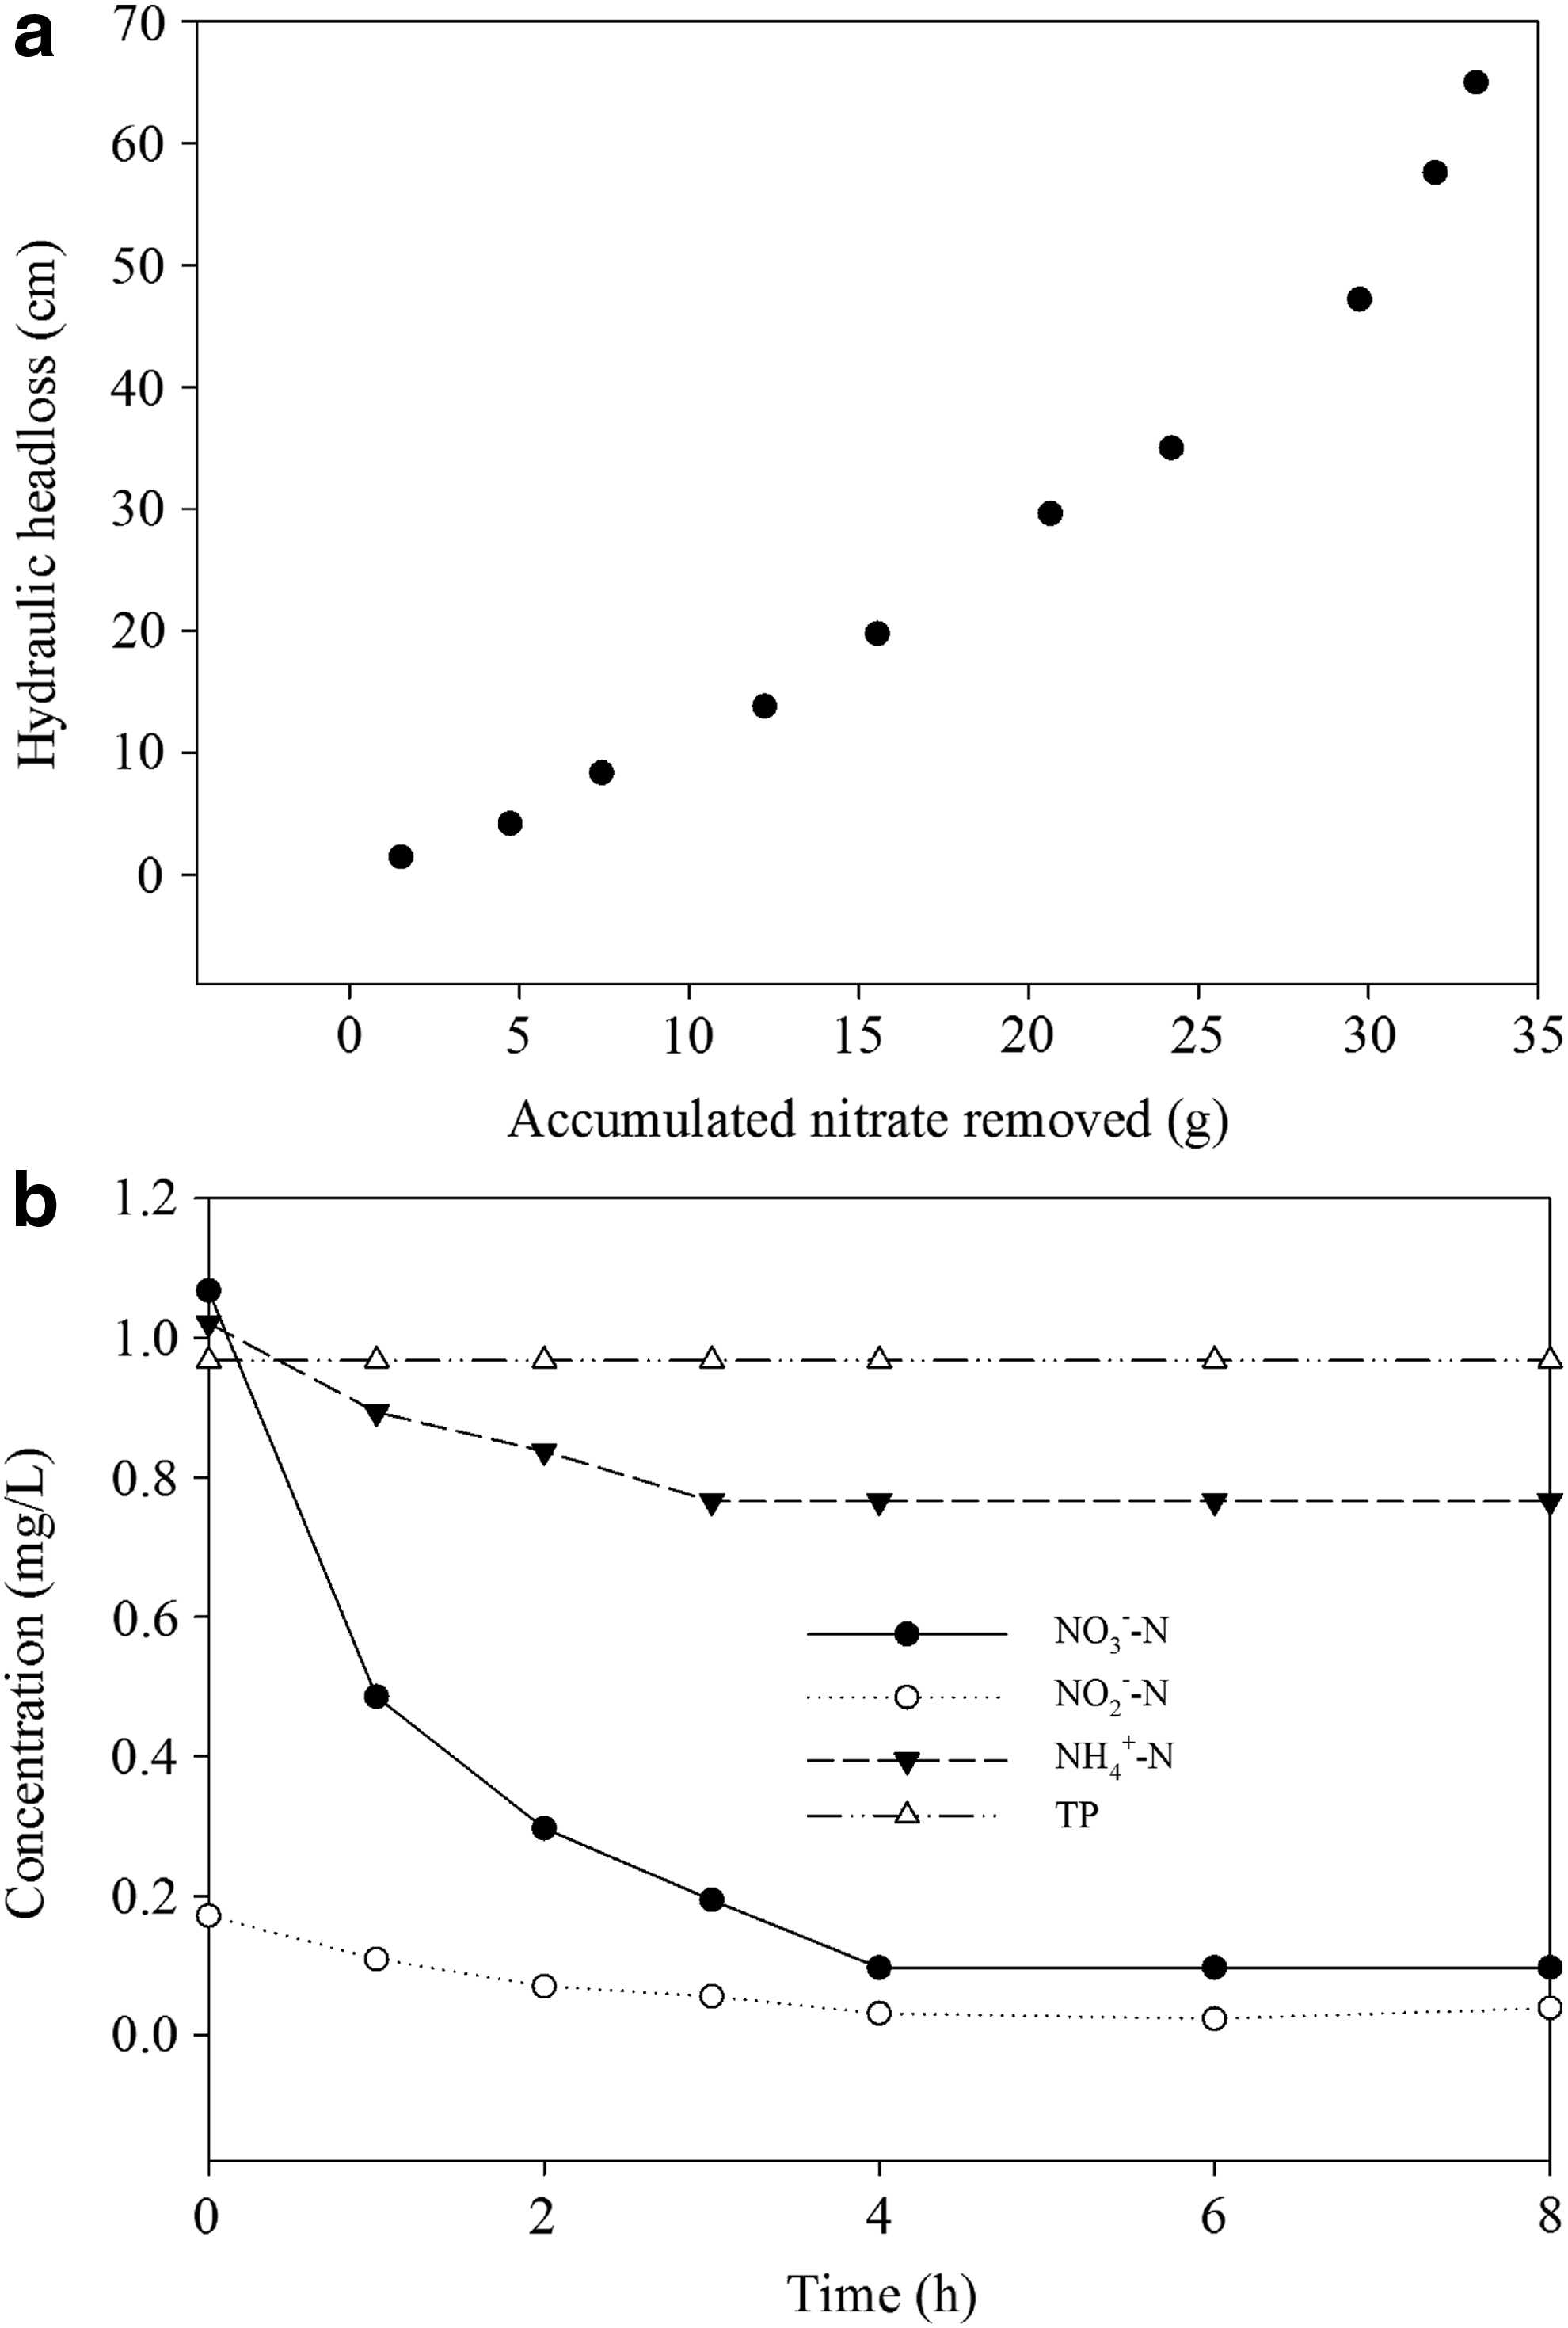
Running resistance and recovery dynamics of biofilter.
Operation performance after backwashing was demonstrated in Fig. 7b, the backwashing didn't generate obvious effect on operation performance. The effluent NO3−-N and NO2−-N concentration decreased to the steady low concentration within 4 h after backwashing, NH4+-N removal performance was recovered after operation for 3 h. It worth pointing out that the TP removal performance was almost unaffected and further study may be needed for this phenomenon.
Conclusions
In this study, an elemental sulfur/limestone biofilter was operated under different EBRTs, and the main findings can be summarized as follows:
(1) Under EBRT of 2, 1, 0.75, and 0.5 h, the effluent NO3−-N concentration was 0.058, 0.077, 1.19, and 2.37 mg/L, corresponding to removal efficiency of 99.53%, 99.37%, 90.40%, and 81.00%, respectively. (2) The removed NO3−-N loading rate ranged from 0.151 to 0.470 kg/(m3·d) with the influent loading rate increased from 0.152 to 0.590 kg/(m3·d). (3) NH4+-N and TP could be simultaneously removed in the sulfur/lime (S/L) biofilter. Approximately 0.081 mg/L NH4+-N was removed per NO3−-N denitrified without nitrite accumulation. About 0.103 mg/L TP was removed under different EBRTs and pH was a limiting factor for phosphorus removal performance. (4) The calculated half-order constants were 2.359, 3.314, 3.437, and 4.288 mgNO3-N1/2/L1/2·h respectively under EBRT of 2, 1, 0.75, and 0.5 h, and higher filtering velocity could promote the denitrification rate. (5) Backwashing was conducted when running resistance approached 50 cm with 30 g NO3−-N removed, and nutrients removal performance was recovered within 3–4 h after backwashing.
Footnotes
Acknowledgments
We would like to acknowledge the financial support of the China Major Science and Technology Program for Water Pollutant Control and Treatment (2012ZX07313001), China Postdoctoral Science Foundation Funded Project (2015M571426), and Shenzhen Knowledge Innovation Plan (Grant No. JCYJ20130402100505795).
Author Disclosure Statement
No competing financial interests exist.
References
Supplementary Material
Please find the following supplemental material available below.
For Open Access articles published under a Creative Commons License, all supplemental material carries the same license as the article it is associated with.
For non-Open Access articles published, all supplemental material carries a non-exclusive license, and permission requests for re-use of supplemental material or any part of supplemental material shall be sent directly to the copyright owner as specified in the copyright notice associated with the article.