
Abstract
Abstract
A sol-gel-based TiO2-coated photo-catalytic device was developed and demonstrated for field applications for controlling volatile organic compounds (VOCs) in three varying indoor environments: (i) laboratory using benzene (efficiency >99%), (ii) conference room of an industry producing organic solvents (mono, di, and tri chloro benzene) (efficiency >70%), and (iii) chemistry laboratory using multiple solvents/VOCs (efficiency >88%). The VOC degradation rate constant for coexisting multiple VOC was estimated to be 1.06/min/m2, which was about 34% less than that of benzene. A VOC mass balance model was developed to describe interaction between indoor air and kinetics of VOC degradation to estimate required extent of treatment for safe VOC concentration in the indoor air. Toxic intermediates of benzene that were adsorbed on the catalyst surface (solid phase) were identified and quantified with GC/GC-MS (gas chromatography-mass spectroscopy). Intermediates accounted for less than 5% of the total mass of benzene treated. The overall hazard index of the toxic intermediates released from regeneration of catalyst is estimated in the range 0.11–0.74, which is less than 1, and, thus, poses no significant risk to the occupants.
Introduction
V
Increasing the intake of ventilation air to dilute indoor VOC levels has limitations due to associated significant energy costs, and it is not of much use when ambient air (as in industrial area) itself is highly polluted. The conventional VOC control technologies, condensation, incineration, and adsorption are not feasible for small rooms. Photo-catalytic oxidation (PCO) with titanium and other semi-conductor-based catalysts has been extensively studied for VOC control (Epa, 2011; Tejasvi et al., 2015; Dhada et al., 2015). The PCO using nano-sized semiconductor TiO2 photo-catalysts and UV as a source of energy is an effective, relatively inexpensive, and safe technique (Dhada et al., 2015).
In semiconductor material, an e− of valence band (VB) is excited by photo-irradiation to a vacant conduction band (CB), creating an h+ in VB. The excited e− and h+ lead to the formation of strong oxidizing hydroxyl radicals (•OH) in the presence of humidity that can oxidize VOCs into water vapor and carbon dioxide (Černigoj et al., 2007). The complete mineralization of VOCs does not happen instantly. Some toxic intermediates will be formed due to partial oxidation (Blount and Falconer, 2002) and adsorbed on the catalyst surface. Those intermediates can get released in the indoor air at the time of regeneration of the catalyst by heating it at about 450°C. These toxic intermediates may be harmful to the building occupants, sometimes even more than the parent VOC that is being treated (Mo et al., 2009a). Harmful intermediates could be a major impediment for field application of PCO technology.
Key issues of PCO-based VOC control technology, including TiO2 coating, reaction kinetics, and catalyst deactivation/regeneration, have been duly addressed and technology is ready for being employed in the field (Dhada et al., 2015). However, the issue of risk associated with toxic intermediates released from regeneration of catalyst surface remains unresolved. Identification and quantification of intermediates, formed in few minutes to few hours on catalyst surface, is essential. In fact, there is a need to characterize the risk in a comprehensive manner that accounts for an untreated amount of parent VOCs and intermediates adsorbed on the catalyst.
The objective of this study is three-fold: (i) develop and evaluate a photo-catalytic device for controlling VOCs in indoor air, (ii) model the interaction between indoor air and kinetics of VOC degradation, and (iii) identify and quantify the toxic intermediates of benzene degradation (adsorbed on catalyst surface) to characterize the comprehensive risk of their exposure. Specifically, the device was evaluated through three different studies: Case-1: laboratory using benzene only, Case-2: conference room of an industry producing organic solvents (monochloro benzene [MCB], dichloro benzene [DCB], and trichloro benzene [TCB]), and Case-3: large chemistry laboratory using multiple solvents/VOCs (dichloromethane, methanol, ethyl acetate, acetone, hexane, etc.). In addition, for Case-1, intermediates of benzene degradation were quantified to characterize the risk through estimation of hazard index (HI), ratio of chronic daily intake, and reference dose.
Materials and Methods
PCO device set-up and its evaluation
A proto-type device (Fig. 1) consisting of seven numbers of reactors (borosilicate glass tubes; 60 mm inner diameter and 270 mm length; effective volume = 700 cm3; and inner surface area = 524 cm2) was fabricated and installed in three indoor environments (described later). The device was equipped with temperature and relative humidity (RH) sensors with the facility for holding UV-C transparent germicidal lamps of 16 W (15 mm outside diameter, 300 mm length, and λ = 254 nm; Sankyo Denki, Japan) inside the reactor.
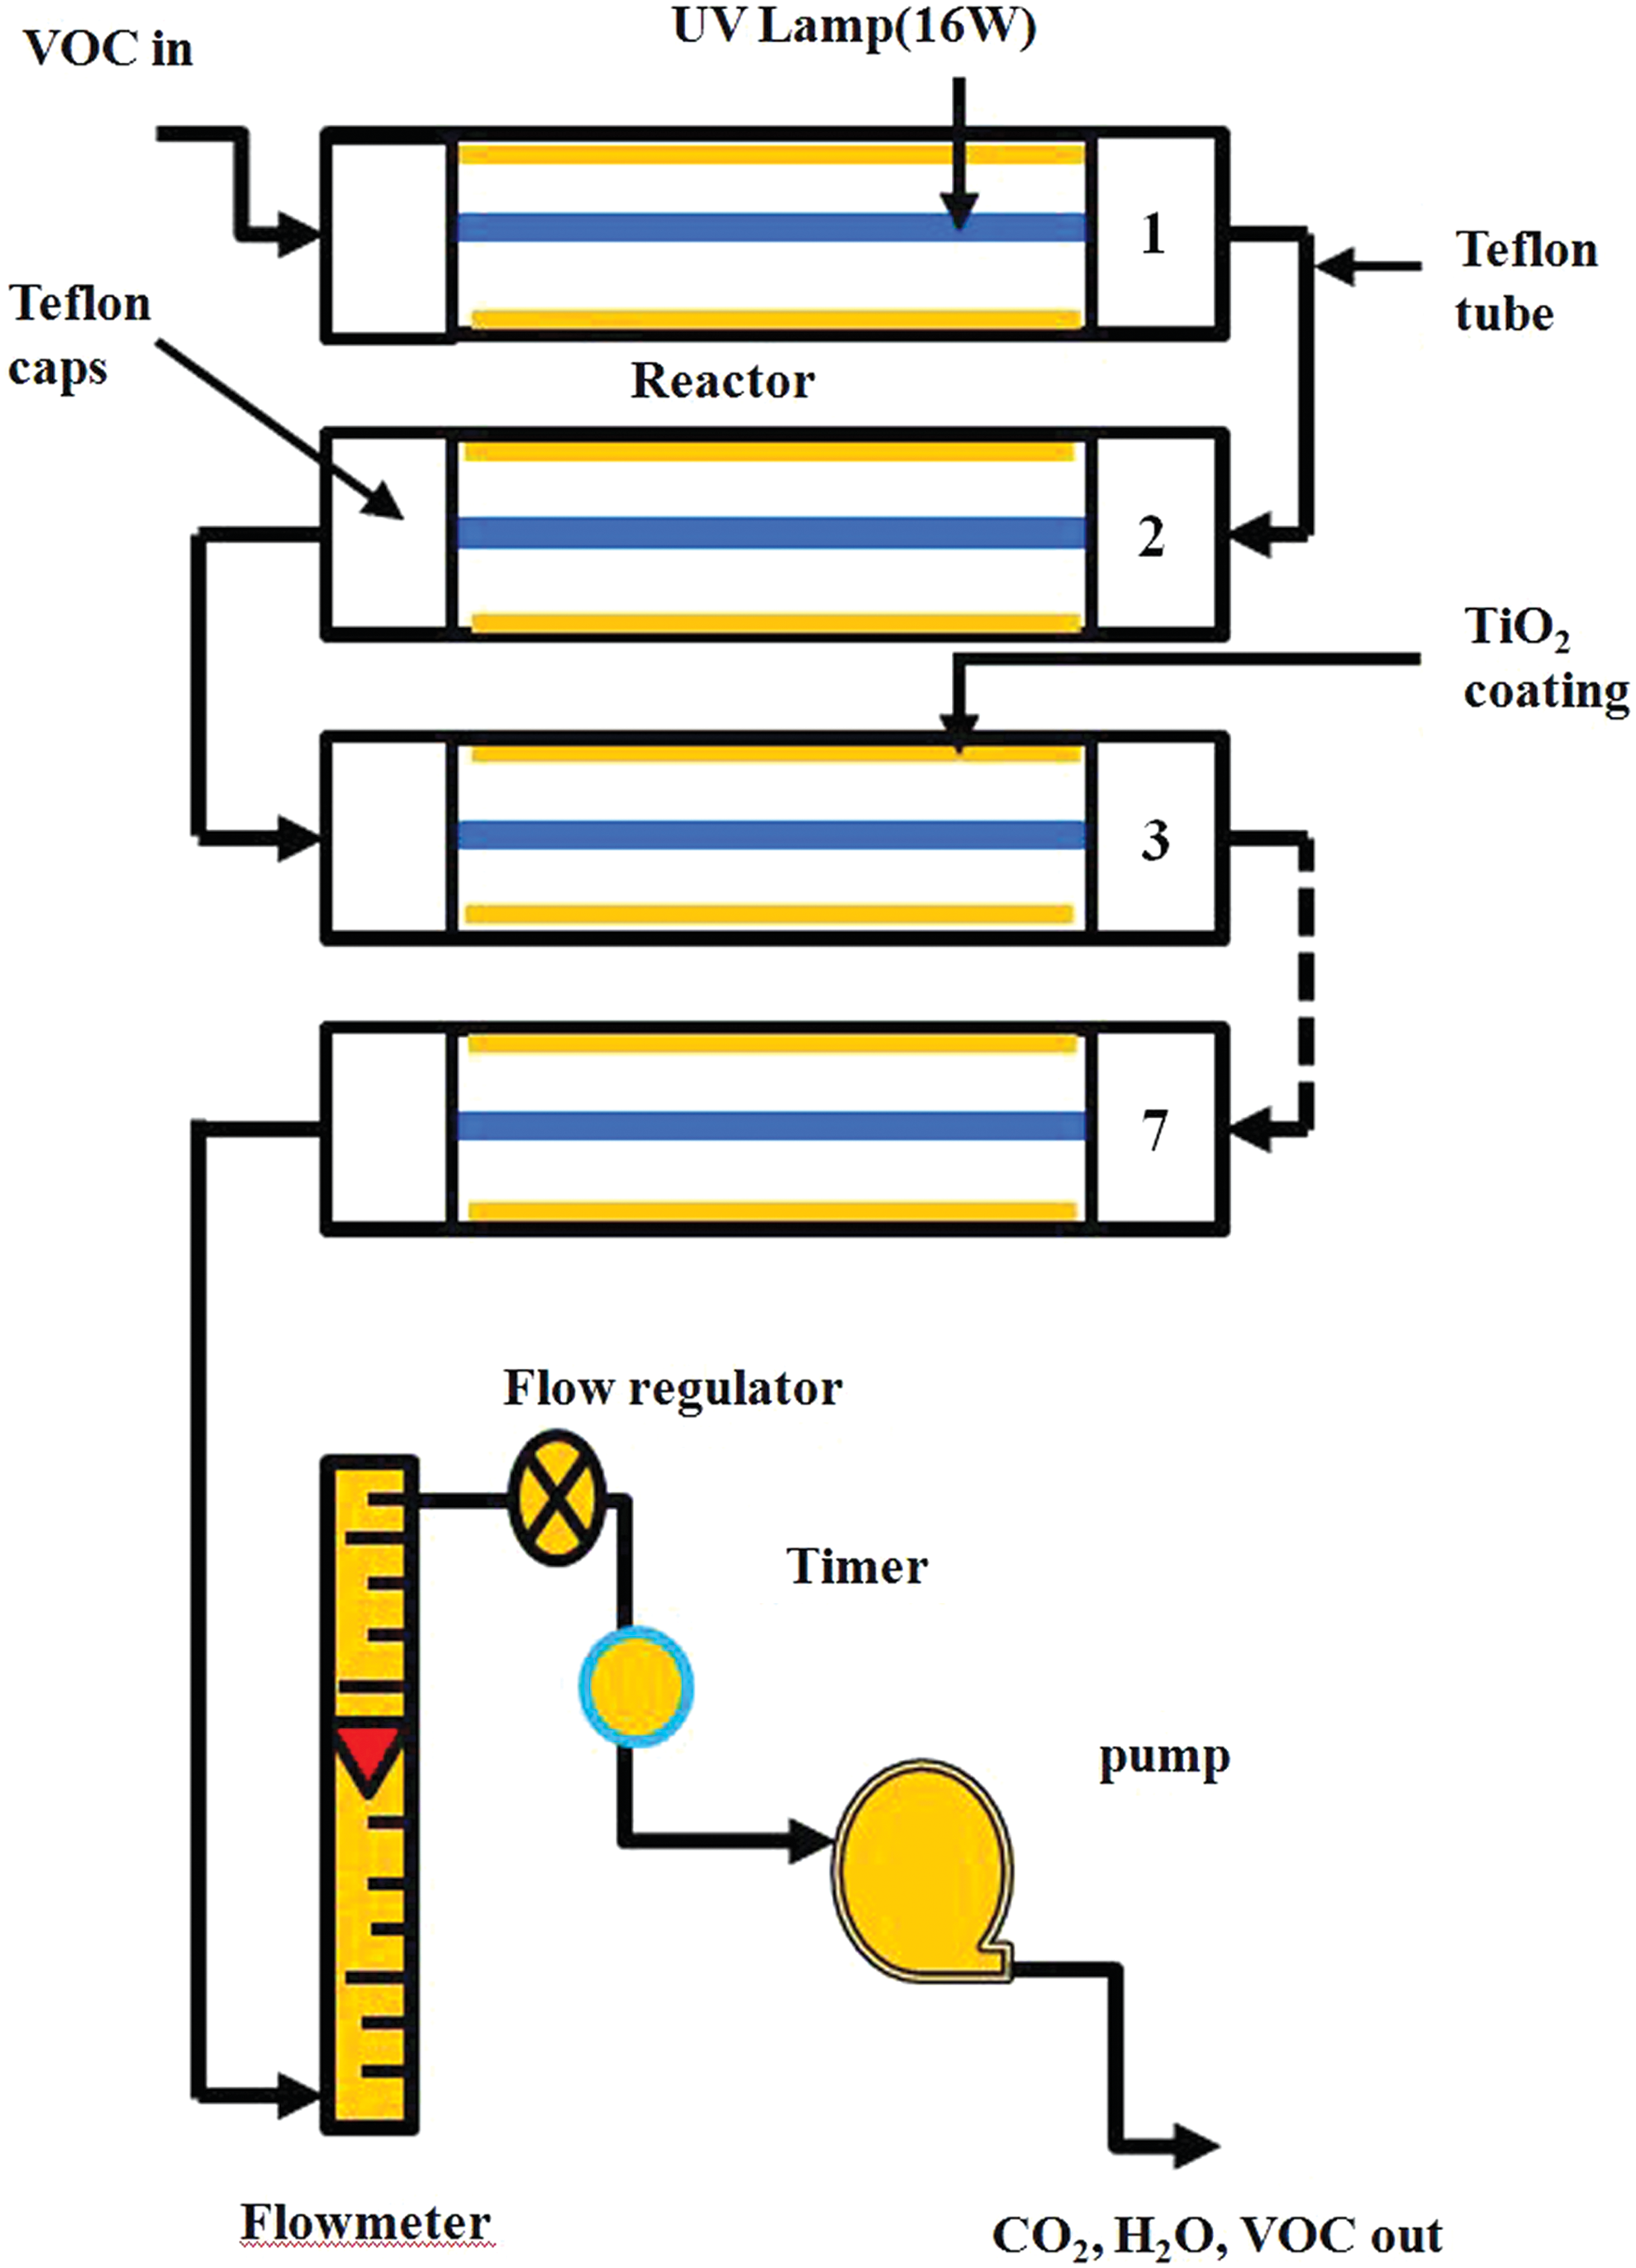
Schematic of VOC control device. VOC, volatile organic compound.
After trying various TiO2 coating methods (physical coating and sol gel) on different substrates (aluminum and borosilicate glass) (Colmenares et al., 2014; Tejasvi et al., 2015), the reactor was finally coated by the sol-gel method with a mixture of (two sols: Sol A and Sol B) titanium tetra-isopropoxide, di-ethanolamine, acetylacetone, deionized water, and ethanol at a molar ratio of 1:1:0:0:34 (Sol A) and 1:0:1:3:20 (Sol B). The coating process and catalyst surface morphology have been described in Dhada et al. (2015). The summary of surface morphology, particle size (10.2 ± 1.43 nm), phase of catalyst (anatase phase), root-mean-square surface roughness (1408 ± 95 nm), band gap energy between CB and VB (3.25 eV), film thickness (23.9 μm), and BET surface area (98 m2/g) is provided.
The fabricated device was evaluated through three different studies: Case-1, Case-2, and Case-3; Table 1 shows type of indoor environment, VOC(s) being treated and its concentration, flow rate, and time of operation for three case studies. Total VOC (TVOC) concentrations in all experiments were measured using a TVOC analyzer (ppb RAE 3000, Honeywell, CA 95134-1708 USA), which measures only the volatile phase of VOCs. The temperature and RH during the experiments were 22.4°C ± 2.3°C and 57% ± 3%, respectively.
Study includes intermediates of benzene photo-degradation and their health risk assessment.
VOC, volatile organic compound; TVOC, total VOC.
Intermediates of PCO of benzene
For Case-1, the intermediates of benzene degradation in the solid phase (adsorbed on catalyst) were identified on GCMS and quantified on GC. The initial benzene concentration was 150 ± 30 ppm; this appears to be a high concentration but laboratories using large amounts of benzene as solvent can have such high indoor air concentrations. For quantification of intermediates, identically coated glass chips (same as surface of device) of a total area of 3 cm2 were kept inside the device. In other words, the chips act as a surrogate of the reactor surface and that of the exhausted catalyst. Our study suggests that the catalyst needs to be regenerated after 12 h of continuous operation.
Dhada et al. (2015) have described the catalyst regeneration techniques and reported that heating of the catalyst at a temperature of 450°C for 15 min was the most effective; the catalyst recovery after regeneration was more than 98%. The chips (after 12 h of operation of the device) were taken out and extracted with methanol for identifying and quantifying the intermediates adsorbed on the catalyst. It may be noted that when regenerated by heating, the catalyst will emit the same compounds that are absorbed at the chip. The chips were immersed in 15 mL methanol and ultrasonicated (Fast Clean) for 30 min. The extracted methanol was filtered through a 0.45 μm syringe filter (Millex-HV, PVDF) and concentrated to 1.5 mL with the help of Turbo Vap (Turbo Vap-II; Caliper Life Science) by purging N2 gas at 23°C. Then, 0.4 μL of extracted concentrated liquid sample was injected into the GC through a 1 μL syringe (Hamilton Bonaduz) for quantification of intermediates. GC-FID (Clarus 500, Perkin Elmer) was equipped with the fused silica capillary column SPB-624 (60 m × 0.25 μm × 0.4 μm; Supelco make) and calibrated for previously reported intermediates of benzene (n-hexane, benzaldehyde, phenol, pentane, crotonaldehyde, benzylalcohol, cyclohexane, cresol, benzoic acid, hydroquinone, benzene, toluene, xylenes, ethylbenzene, methanol) (Jacoby et al., 1996; Cao et al., 2000; Guo et al., 2008; Han et al., 2008; Sleiman et al., 2009; Mo et al., 2009b; Farhanian and Haghighat, 2014; Dhada et al., 2016) at four levels (5, 50, 100, 500 ppm) for each of the compounds. The temperature programming for GC was as follows: 40°C, 5 min hold, ramp@10°C/min up to 200°C, 5 min hold, ramp@10°C/min up to 240°C, and 1 min hold.
Results and Discussion
Case-1: Benzene degradation, intermediates, and health risk
The device (Fig. 1) was first run without switching on the UV lights, and it was observed that inlet and outlet concentrations were identical at the level of about 100 ppm. As soon as the UV light was switched on, within a few seconds, the benzene concentration at the outlet dropped to less than 1 ppm (Fig. 2). The device was continuously operated for 8 h for varying inlet concentrations of 76–160 ppm, with an average removal efficiency of 99.54%. The device performed exceptionally well for benzene removal. However, as stated earlier, the formation of intermediates is of significant interest from health point of view. In the following sections, formation of intermediates (identification and quantification), their release into the indoor environment, and health risk are discussed.

Performance of control device for degradation of benzene.
Identification and quantification of intermediates extracted from catalyst
The toxic intermediates are released from the surface of the catalyst at the time of regeneration, and they have been examined by extracting the adsorbed compounds from the chips kept inside the reactor. The GCMS identified the following compounds, including probable compounds: (a) identified in this study and also reported in literature are phenol, methyl cyclopentane, pentane, acetone, hexane, cyclohexane, 1,4-benzoquinine, benzaldehyde, benzyl alcohol, cresol, hydroquinone, benzoic acid, and benzene [reported in literature (Jacoby et al., 1996; Cao et al., 2000; Guo et al., 2008; Han et al., 2008; Sleiman et al., 2009; Mo et al., 2009b)] and (b) identified solely in this study are 4-methyl phenol-(4-cresol), methyl cyclohexane. 2,2,4-trimethyl hexane, and 2,2,3-trimethyl decane. We could quantify some of the intermediates (acetone, benzoic acid, hexane, phenol, etc.) for which standards were available; Fig. 3 shows mass (μg) of intermediate per mg of benzene treated in 8 h of operation of the device.

Mass of intermediates (μg) adsorbed on catalyst for every mg of benzene treated in 8 h.
The major intermediates that affect the photo-catalytic activity of TiO2 surface are acetone and benzoic acid. The intermediates adsorbed on catalyst surface (about 4.4% of benzene mass that passed over the catalyst) are released during catalyst regeneration. Dhada et al. (2015) have reported carbon balance by measuring benzene and CO2 concentrations at the inlet and outlet of the device. A carbon balance of about 95% was obtained, suggesting a deficit of 5% at the outlet. The intermediates deposited on the catalyst surface account for about 3%. The remaining 2% carbon is not accounted for, which may be attributed to the parent compound and/or intermediates (identified or unidentified) adsorbed on other parts of the device. The health risk assessment of intermediates is discussed next.
Risk assessment of released intermediates
It may be noted that all quantified intermediates have a noncancer risk that can be accessed through HI (Asante-Duah, 1998). Specifically, the HI has been estimated for two cases: (i) graduate students (GS) who work for 5 years in the laboratory and (ii) permanent staff (PS) who work for 35 years in the laboratory. The total chronic HI can be calculated as follows:
where CDI i is the chronic daily intake for the i th contaminant and RfD i is the reference dose (mg/kg-day) for the i th contaminant.
CDI is calculated as per the following formulation:
where CA: Chemical concentration in air (mg/m3) (Table 2)
RfD is not available for crotonaldehyde, 1,4 benzoquinone, and hydroquinone.
(U.S.E.P.A, 2003).
(GSI Environmental, 2013).
IR: Inhalation rate (0.83 m3/h for adult)
ABSs: % chemical absorbed into the blood stream
ET: Exposure time (8 h/day)
EF: Exposure frequency (261 days/year; 5 working days a week)
ED: Exposure duration (5 years for GS and 35 years for PS)
BW: Body weight (70 kg).
AT: Average time (period over which exposure averaged: 70 years × 365 days/year)
The stated levels of parameters were taken from Asante-Duah (1998).
Overall HI for the graduate students is 0.11 and for permanent laboratory staff, it is estimated to be 0.74. It may be stated that the risk estimated through HI is well below 1 for both students and permanent staff. Since HI is the ratio of CDI to RfD (safe dose; Asante-Duah, 1998), a value of HI less than one is considered acceptable. The major part of the risk is from acetone, which is emitted during regeneration of the catalyst. This analysis suggests that the risk of intermediates is acceptable. The technology can be employed in the indoor environment without any undue risk or fear. It is recommended that regeneration of the catalyst (which takes about 15 min) should be undertaken in an isolated area to avoid the exposure of intermediates adsorbed on the catalyst surface. To facilitate continuous operation of the device, a fresh set of catalysts should replace the deactivated catalyst in the shortest possible time.
Case-2: Evaluation of device in conference room of a solvent industry using MCB, DCB, and TCB
The device was installed in the conference room of an industry producing, storing, and handling organic solvents (MCB, DCB, and TCB) to remove the VOCs (Fig. 4). Before we discuss the performance of the device, we model the VOC concentration inside the room by accounting for VOC infiltration of outdoor air, exfiltration of indoor air, VOC emission within the room, and VOC removal inflicted by the installed device.
Overall VOC control system installed inside room.
Mass balance across the device: Adsorption of VOCs and the PCO on the catalyst surface can be represented by the Langmuir–Hinshelwood equation:
where KA is the adsorption coefficient for a gas on a material, and k is the degradation rate constant (time−1). At low concentrations (ppm levels), the reaction reduces to a first-order process by neglecting the term KAC in the denominator (1 >> KAC).
where KO = kKA (overall degradation rate constant, time−1)
Assuming the device to be a plug flow reactor, at steady state, the outlet concentration can be expressed as follows:
where tr is the retention time inside the device, Cout is the steady-state VOC concentration at the outlet of the device, and Ci is the steady-state inlet concentration to the device that is the same as the steady-state concentration in the room.
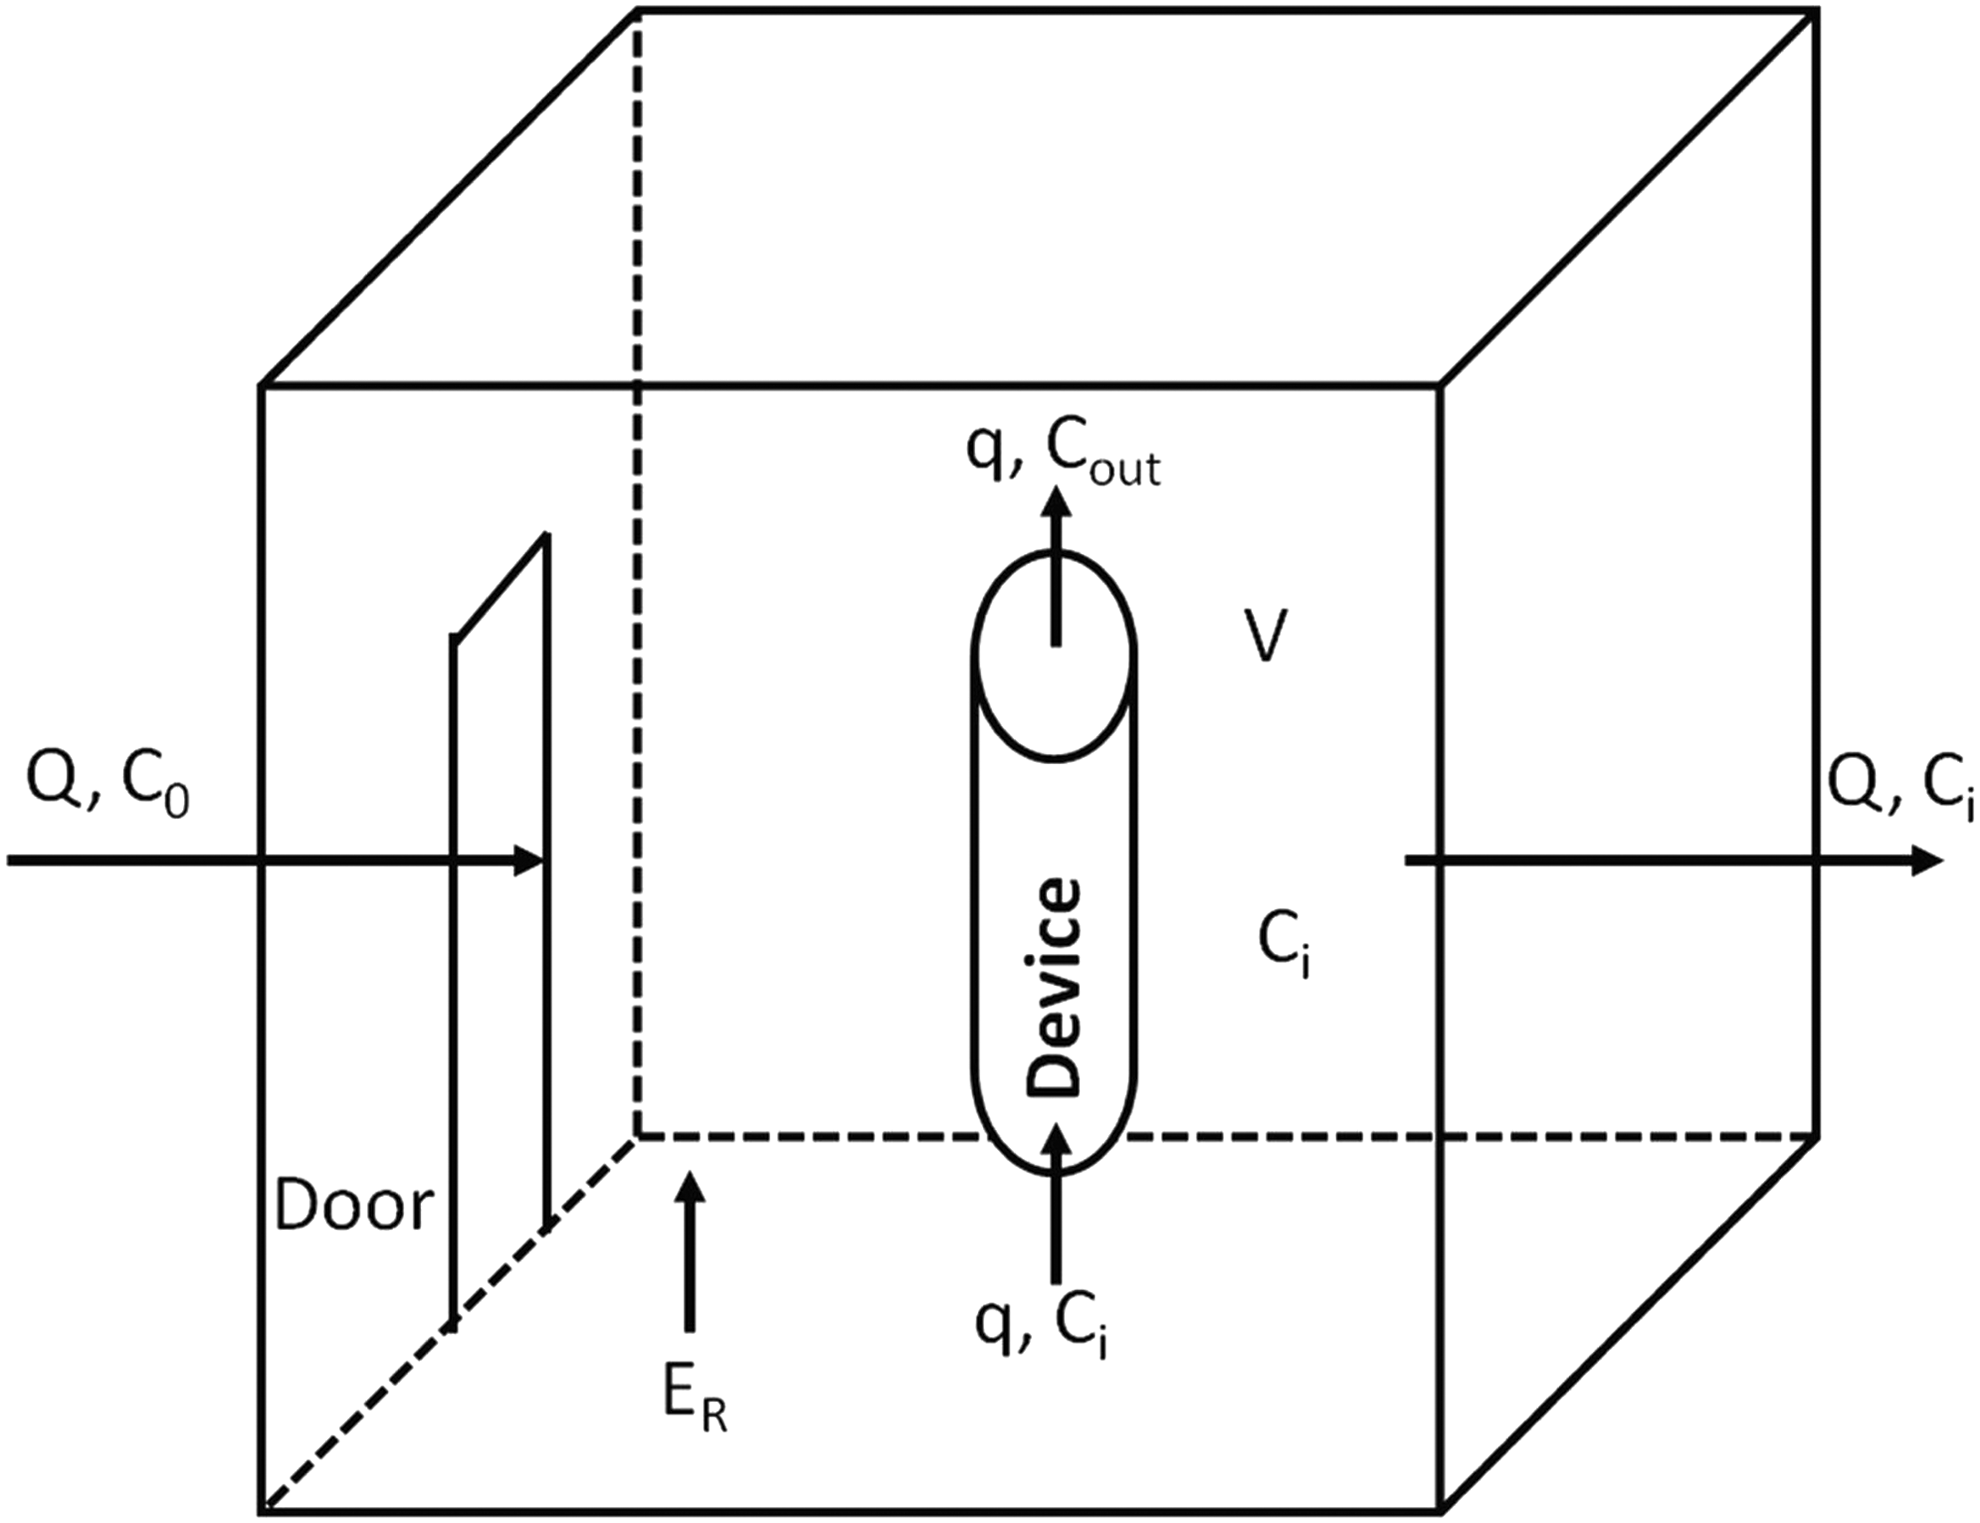
Mass balance across the room: If the room is considered as completely mixed, the VOC mass balance across the room (having the VOC control device) can be stated as follows:
In mathematical terms,
where C0 is the concentration of VOC entering into the room, Q is the rate of flow of air both in and out of the room, ER is the emission rate of VOC from a source in the room, V is the volume of the room, q is the rate of flow into the device, Cr is the VOC concentration at any time inside the room, and Cout-d is the VOC concentration at any time at the outlet of the device (refer to Fig. 3 for the system and explanation of variables).
At steady state (Cr = Ci), the VOC concentration can be expressed as follows:
If N is the number of such devices installed (in parallel), Ci can be calculated as
If N is the number of such devices that will be required to attain the desired steady-state concentration, Ci can be calculated as
Degradation rate constant per unit surface area of coating, k’ = 1.79/min/m2 is adopted from Dhada et al. (2015), since the degradation constants for chlorinated benzene compounds were not available. Ko = 0.6104/min is obtained by multiplying k’ by the TiO2-coated surface area of seven reactors installed in the device (Ar = 341 × 10−3 m2); rate of flow into the device q = 4 × 1 0−3 m3/min (at room condition); and measured concentration immediately outside the room C0 = 76 ppm, which enters the room through the door with a flow rate of Q. The Q is estimated from the size of the door (1 × 2.1 m) and the time required (2.3 s) to complete the cycle of door opening and closing. The measured average velocity of air at the time of door opening was v = 1 × 10⁻² m/s (measured using anemometer: Lutron Anemometer; AM-4201). On average, the door is opened 15 times during 10 h of working. Thus, the rate of flow of air both in and out of the room, Q = 6.04 × 10⁻³ m3/min. It may be noted that the room had no provision for ventilation, and the opening and closing of the door allowed the outside air to come inside the room.
Figure 5 shows the performance of the control device in terms of its inlet and outlet TVOC concentrations. It is seen that a steady-state concentration is attained in about 30 min at both inlet and outlet of the device. The initial TVOC concentration at t = 0 was 76.0 ± 6.0 ppm. The measured steady-state concentration at the inlet of the device was 63.0 ± 5.0 ppm. It may be noted that the steady-state concentration at the inlet of the device is the same as the steady-state concentration in the room.
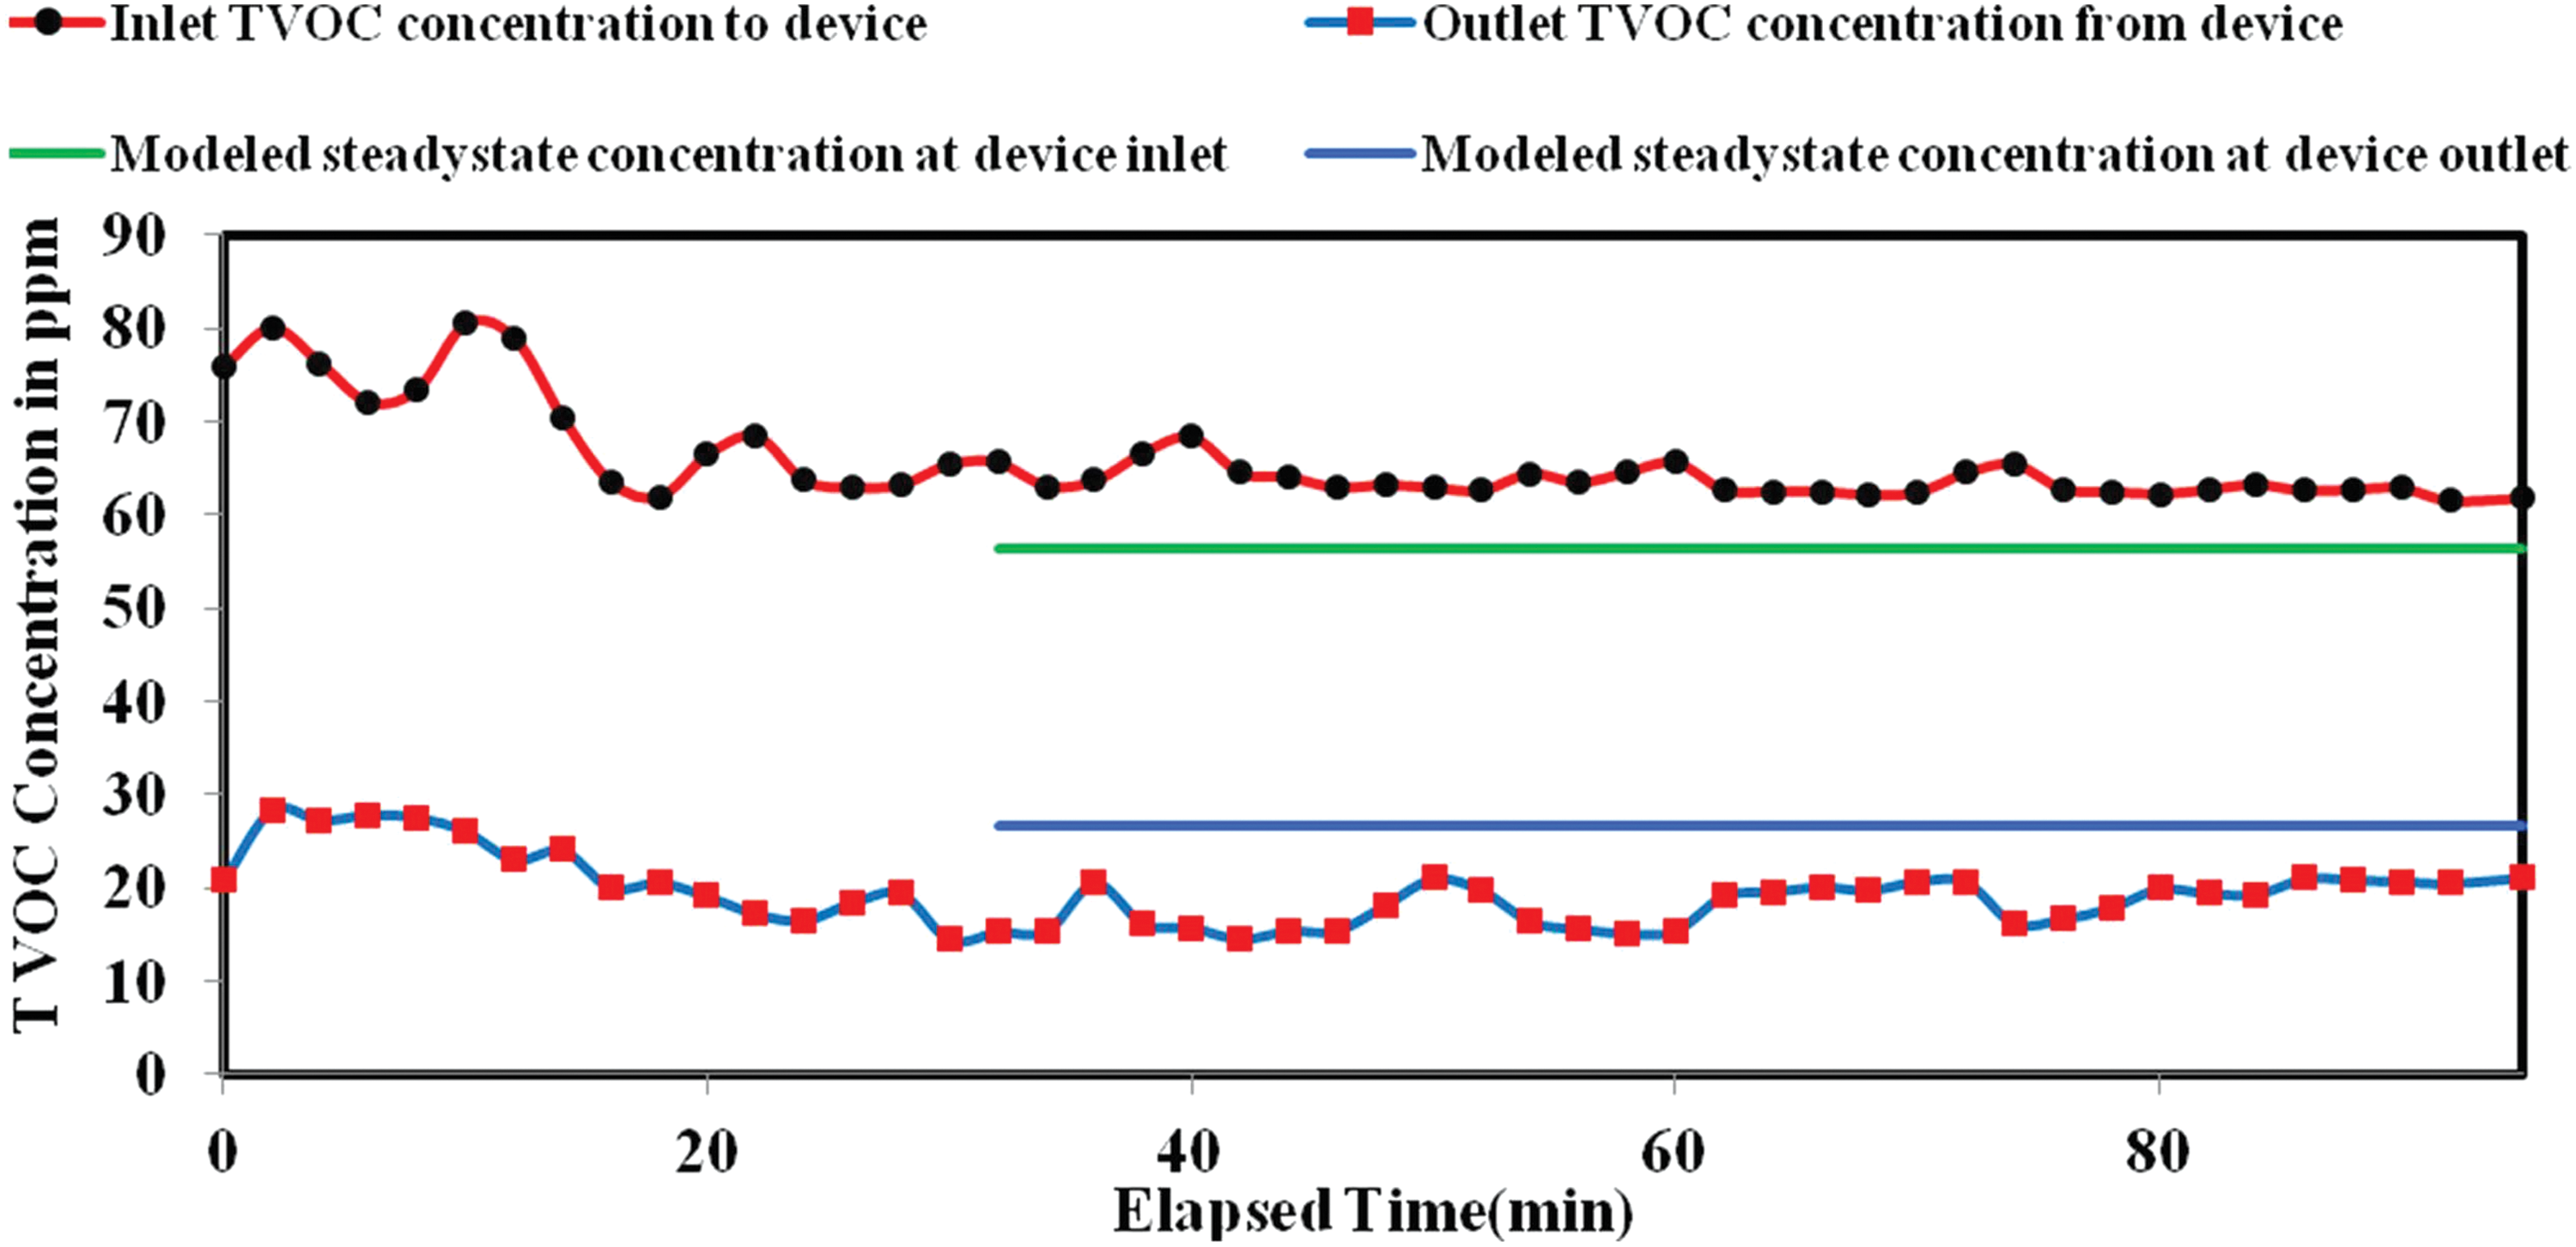
Modeled and observed TVOC concentrations at device. TVOC, total VOC.
By employing the developed model [Eq. (8)], the steady-state concentration Ci in the room was calculated as 56.3 ppm. This suggests that the model is performing well, as measured and modeled concentrations (inside the room) are in close association with each other (Fig. 5). The measured steady-state concentration at the outlet of the device was 18.2 ± 3.6 ppm, and the modeled steady-state concentration [Eq. (7)] was 26.7 ppm (Fig. 5). The model is over-predicting concentration by 47%. The possible reason for such a discrepancy is that some of the VOCs may have adsorbed in the reactor, tubings, and teflon caps that were not accounted for in the model formulation. The efficiency of the device at steady state was 71%. However, the effective VOC reduction attained in the room was only about 20% for one such device. It implies that we may have to install more such devices depending on the desired VOC concentration in the room.
Equation (9) can be used to estimate the number of control devices required for obtaining the desired concentration of VOCs for the given size of the room, inlet VOC concentration in the room, emission rate inside the room, and ventilation or airflow in the room. For the current case, Fig. 6 shows the ratio of steady-state concentrations (Ci/C0) as a function of number of devices. We have estimated the number of devices that may be required to bring the initial concentration of 76 ppm (considering TVOC is benzene) to a ceiling limit of OSHA at 25 ppm (Dhada et al., 2016) as six (Fig. 6).
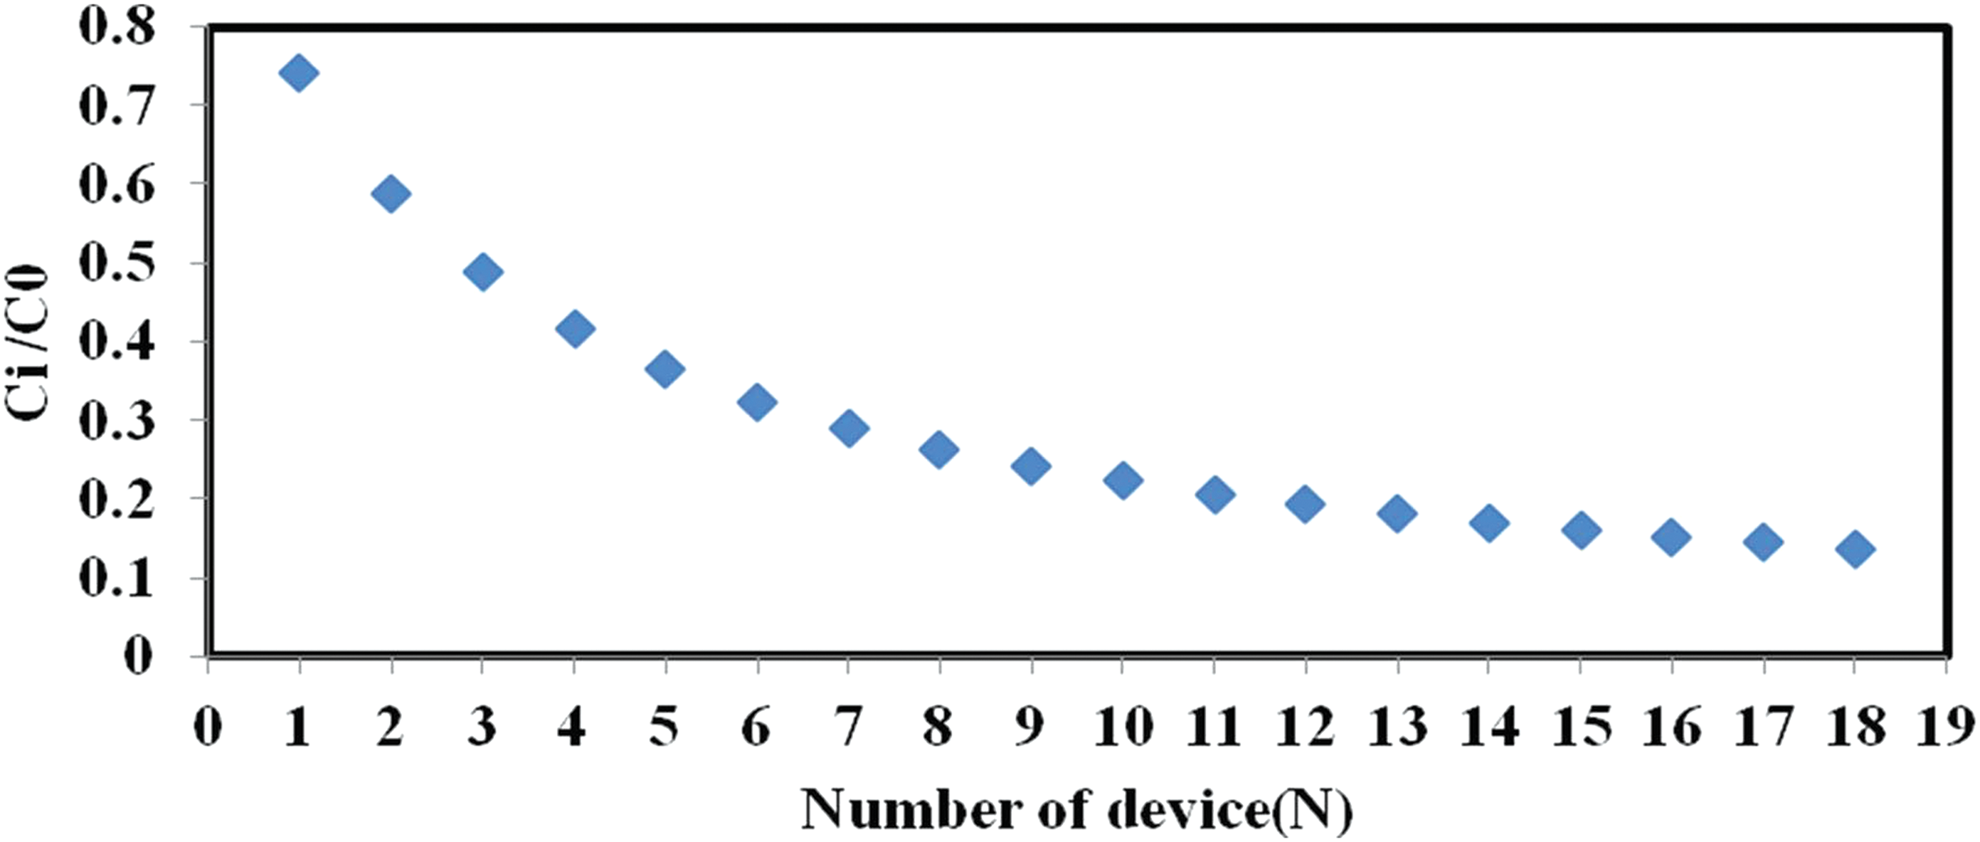
Ratio of steady-state TVOC concentration inside the room and entering the room versus number of devices for Case-2.
Case-3: Evaluation of device in large chemistry laboratory using multiple VOCs (Dichloromethane, Methanol, Ethyl Acetate, Acetone, Hexane)
The performance of the device was evaluated in a laboratory by using multiple solvents/VOCs (dichloromethane, methanol, ethyl acetate, acetone, hexane). The retention time of TVOC in the device was calculated as 0.7 min. Figure 7 shows the performance of the control device in terms of inlet and outlet TVOC concentrations. It is seen that a steady-state concentration is attained in about 100 min at both inlet and outlet of the device. The initial period in Fig. 7 shows a high concentration due to the fact that the air conditioning units and room exhaust fans take a while before becoming effective; after about 100 min, concentrations stabilize. The measured steady-state concentration at the inlet of the device was 73.0 ± 5.0 ppm (i.e., after 100 min). The measured steady-state concentration at the outlet of the device was 8.8 ± 3.0 ppm. The reduction efficiency of the device at the steady state was 88.89%. The degradation rate constant, k’ for coexisting multiple VOCs was estimated to be 1.06/min/m2, which is 34% less in comparison to the k’ value of benzene (1.6/min/m2) (Dhada et al., 2015). The degradation of multiple VOCs is expected to be slower than that of single compounds. For multiple VOCs, the process is complex because of competitive reactions and formation of complex intermediate products of degradation that can deactivate the catalyst and impede the overall degradation (Dhada et al., 2016).

Performance of control device for degradation of TVOC in chemistry laboratory.
Conclusions
This study has applied the PCO technology in the field and demonstrated its usefulness for the control of benzene, coexisting multiple VOCs, and chlorobenzenes. The estimated degradation rate constant for coexisting multiple VOCs was 1.06/min/m2 (surface area of catalyst), which is smaller by 34% in comparison to that of benzene (1.6/min/m2). The possible reason for a reduction in rate constant for multiple VOCs is the occurrence of several concurrent competitive reactions on the surface of the catalyst. The control efficiency of the device was more than 99% for benzene, 88% for multiple VOCs, and 71% for chlorobenzenes.
The other major focus of the study was to assess intermediates of benzene degradation, as they may pose risk to building occupants. Acetone and benzoic acid are major intermediates of benzene that are adsorbed on the catalyst surface. The other intermediates include: 4-methyl phenol-(4-cresol), Methyl cyclohexane. 2,2,4-trimethyl hexane and 2,2,3 trimethyl decane, 2-methyl-3-butan-1-ol, m-phenyl benzonitrile, and 4-(phenyl methoxy)-1,2,5-oxadiazol-3-amine. The overall HI for a laboratory using benzene as solvent is in the range 0.11–0.74, which is well below the acceptable value of 1. It is concluded that the technology is safe and can be employed with confidence. However, it is advisable that outlet gases of the PCO device are released outside the room.
Footnotes
Acknowledgments
The authors gratefully acknowledge Dr. Rajendra Prasad, chief executive, Ecotech Instruments, Gautam Buddhnagar, India, for helping them in preparing the device and Kirit Mehta and Navin C. Patel, Clean Enviro Projects Consultancy Pvt. Ltd., Vapi, for permitting installation of the device at industry premises. This work was financially supported by the Ministry of Environment and Forests, New Delhi, India, through Grant 1-14/20009-CT, dated March 30, 2012.
Author Disclosure Statement
No competing financial interests exist.