
Abstract
Abstract
Indium Tin Oxide (ITO) conductive glass was modified by layer-by-layer modification of chitosan (CS) and α-Fe2O3 nanoparticles. Lactic acid bacteria were the source of electrons in the studied microbial fuel cells (MFCs) system. When ITO/(CS/α-Fe2O3)4/CS was the anode, external resistance was 626.6 Ω, while maximum current and maximum power density were 1.16 mA and 0.122 W/m2, respectively. These values were far higher than already reported results. Atomic force microscope image proved that ITO/(CS/α-Fe2O3)4/CS surface was rougher than blank ITO and ITO/(CS/α-Fe2O3)8/CS surfaces, which enable it to have a higher specific surface area for the microbes to grow. For ITO/(CS/α-Fe2O3)4/CS, physical properties played a leading role, while the chemical properties mainly determined the surface morphology of ITO/(CS/α-Fe2O3)8/CS. Lactic acid bacteria in fermentation waste could improve the current of MFCs. Layer-by-layer assembly of CS/α-Fe2O3 could significantly improve the performance of MFCs.
Introduction
M
Various substrates, which have been researched for use in MFCs as feed, include natural and synthetic compounds or wastewaters (Pant et al., 2010). Food waste is usually added to the substrate, which acts as the carbon source for the microbes in bioelectrochemical systems (ElMekawy et al., 2015). It has been proven that the prefermentation of food waste could be a useful strategy to enhance the performance of MFCs (Kannaiah and Venkata Mohan, 2011).
Fermentation is a metabolic process that converts sugars to acids, gases, or alcohol. It takes place in the lack of oxygen and becomes the cell's primary means of ATP production (Nam et al., 2014; Alibardi and Cossu, 2016). The fermentation waste, produced by many food factories, includes chemical energy, carbon sources, and lactic acid bacteria. Such waste is ideal for anaerobic digestion, which mainly consists of four steps: hydrolysis of the substrate, acidogenesis, acetogenesis, and methanogenesis (Kastner et al., 2012; Zhang et al., 2015).
Organic acids, primarily propionic and lactic acids, are obtained from the hydrolysis process and acidogenesis processes. These compounds could be used by the electricity producing microbes to transform chemical energy to electrical energy (Lobo et al., 2015). For example, the fermentation of Chinese cabbage results in a large amount of lactic acid bacteria. The lactic acid bacteria had been proved to have good ability to produce electrons (Yang Jingna and Guan, 2014). The lactic acid bacteria in fermentation waste could inhibit the growth of some other bacteria by secreting lactic acid, acetic acid, hydrogen peroxide, and lactobacillin (Delavenne et al., 2012). These secretions would inhibit the transportation of electrons from lactic acid bacteria to the anode surface.
It has been proven that lactic acid bacteria belong to Fe(III) reducing bacteria, and the existence of Fe(III) oxides could induce lactic acid bacteria to assemble an electrically conductive network, which will accelerate the ability of lactic acid bacteria, through which they transfer the electrons (Mahadevan et al., 2006). The low electron transfer rate from microbes to the anode surface was one important factor that affects the efficiency of the MFCs (Santoro et al., 2015). This problem can be solved by the modification of anode material, which would change both the physical and chemical properties of the anode and facilitate the transfer of electrons from microbes to the anode surface (Choi, 2015).
Layer-by-layer assembly of polyelectrolytes has been proven to be an effective way for improving the transfer of electrons from microbes to the anode surface (Zhu et al., 2014). For example, the layer-by-layer assembly of chitosan (CS) and α-Fe2O3 nanorod could improve the transferring abilities of electrons. However, the resultant current density of the MFCs was found to be very low (Ji et al., 2011; Martin et al., 2011). The maximum current observed by using CS/α-Fe2O3-modified Indium Tin oxide (ITO) conductive glass and the Shewanella loihica PV-4 bacteria in MFCs is just around 2 × 10⁻⁶ A, and still is very low (Ji et al., 2011). To the best of our knowledge, there still is no study focusing on using CS/α-Fe2O3-modified ITO to improve the performance of MFCs by using high electron producing lactic acid bacteria.
In this study, a double-compartment MFC was built by using lactic acid bacteria as the electrons producing microbes and ITO as the anode. CS/α-Fe2O3 was assembled on the ITO surface. The surface properties of modified ITO were investigated by the atomic force microscope (AFM). The effects of assembled polyelectrolyte and number of layers on ITO anode on current and power density were investigated. The effect of fermentation substrate on the performance of MFC was also studied. The possible mechanism of fermentation waste for improving the performance of MFC was also discussed in the current work.
Materials and Methods
Materials
ITO anode was purchased from Conduc optics and electronics tech. (jintan) Co., Ltd. (China). The chitosan (deacetylation degree 85%, Mn = 250 kDa) was obtained from Qingdao Haidebei Bioengineering Co., Ltd. (China). Sodium bicarbonate (NaHCO3), calcium chloride (CaCl2), Ferric chloride hexahydrate (FeCl3 · 6H2O), urea (purity >95%), magnesium chloride hexahydrate (MgCl2 · 6H2O), sodium chloride (NaCl), sodium acetate (CH3COONa), ammonium chloride (NH4Cl), potassium ferricyanide (K3Fe(CN)6), disodium hydrogen phosphate (Na2HPO4), sodium dihydrogen phosphate (NaH2PO4), potassium dihydrogen phosphate (KH2PO4), potassium chloride (KCl), sodium hydroxide (NaOH), hydrochloric acid (HCl), and hydrogen peroxide (H2O2) were purchased from China National Pharmaceutical Group Corporation. All reagents were of analytical grade and used as received.
Synthesis of α-Fe2O3 nanorods
α-Fe2O3 nanorods were synthesized using the already reported method (Ocana et al., 1999). Ferric chloride hexahydrate, urea, and sodium dihydrogen phosphate were taken in 1:1.1:0.05 molar ratio, respectively, and were dissolved in ultrapure Millipore water with the iron content of 0.01 mol/L. The solution was sealed in a bottle and kept at 100°C for 3 days. Then, the solution was cooled to room temperature and centrifuged at 10,000 rpm for 20 min. The purification process was repeated for at least five times to obtain all the nanorods. The precipitates were dried by an oven and were redispersed in distilled water with ultrasound before further use.
Modification of ITO anode
ITO was cut into 4 × 5 cm. The activation of ITO surface was done by following the reported method (Ge et al., 2013). In short, the ITO was immersed in 4% potassium hydroxide (KOH) in acetic acid (CH3COOH) solution and treated with ultrasound for 5 min. Then, it was treated with ultrasound in ethyl alcohol and ultrapure water for 5 min, respectively. After that, the obtained ITO anode was immersed alternatively in 1% chitosan (CS) solution and 0.1 g/L α-Fe2O3 nanorod solution. In each step, the adsorption time was 20 min. Then ITO was immersed in ultrapure water to wash off the unabsorbed ingredients for at least 5 min. The final step is to put layer-by-layer assembled polyelectrolyte-modified ITO anode in 1% chitosan solution for 20 min and then in ultrapure water for 10 min. The electrode was dried under soft ultrapure nitrogen gas.
Characterization of α-Fe2O3 nanorods
Morphology of the prepared α-Fe2O3 nanorods was investigated using a scanning electron microscope (JSM-6360LV; Japan). Particle size distribution analysis by intensity was done using Malvern Zetasizer Nano ZSP having a range of 0.3–10.0 μm (diameter).
Characterization of ITO anode and morphology of microbes
Surface morphology of ITO was taken with Dimension 3100 Atomic Force Microscope (AFM, Bruker, Germany). The morphology of the microbes on ITO anode was characterized by scanning electron microscope (JSM-6360LV, Japan). Electrical conductivity and total solids (SS) were measured using DDS-307A conductivity instrument (LeiCi Trade Shanghai Co., Ltd., China) at 25°C. COD of the system was measured by the potassium dichromate reflux method (Baumann et al., 1974).
MFC reactor construction
The experimental instrument was a double-compartment MFC reactor. The chamber size of each compartment was 8 × 8 × 8 cm. The cultivation buffer consisting of 2.5 g/L NaHCO3, 0.08 g/L CaCl2, 1 g/L NH4Cl, 0.2 g/L MgCl2 · 6H2O, 10 g/L NaCl, and 0.82 g/L CH3COONa was used for bacteria growth. The working solution gradient consisted of 165 mL cultivation buffer and 135 mL fermentation waste, which was cultivated in a biochemical incubator at 37.5°C for 3 days before use. The cathode compartment was filled with 300 mL 50 mmol potassium ferricyanide solution. A proton exchange membrane (N117, Dupont, Inc., USA) was placed between the two chambers to separate them.
Both electrodes were connected to an external resistance (0–9999 Ω). The MFCs were operated in the intermittent flow mode, whereby each batch mode test continued for at least 7 days. Every MFC reactor chamber was stirred using a magnetic stirrer.
Electrochemical measurements
All the current-time curves, cyclic voltammetry (CV), open circuit potential, and polarization curves were measured by the electrochemical workstation (chi660d CH Instruments, Inc., China). The voltage and current across an external resistor (100, 300, 500, 800, 1000, 3000, 5000, 7000, and 9000 Ω) were monitored using a virtual instrument (UT803,UNI-T™) connected through a data monitor card (MPS010601; Mofei Co., Ltd., China). The current response at the electrode surface to a specific range of potentials was measured at a fixed scan rate, shifting from −1.0 to 0.5 V versus with Ag/AgCl at 5 mV/s while monitoring the current. All of the mentioned measurements were performed for the anode system.
Results and Discussion
Structure and morphology of ITO anode
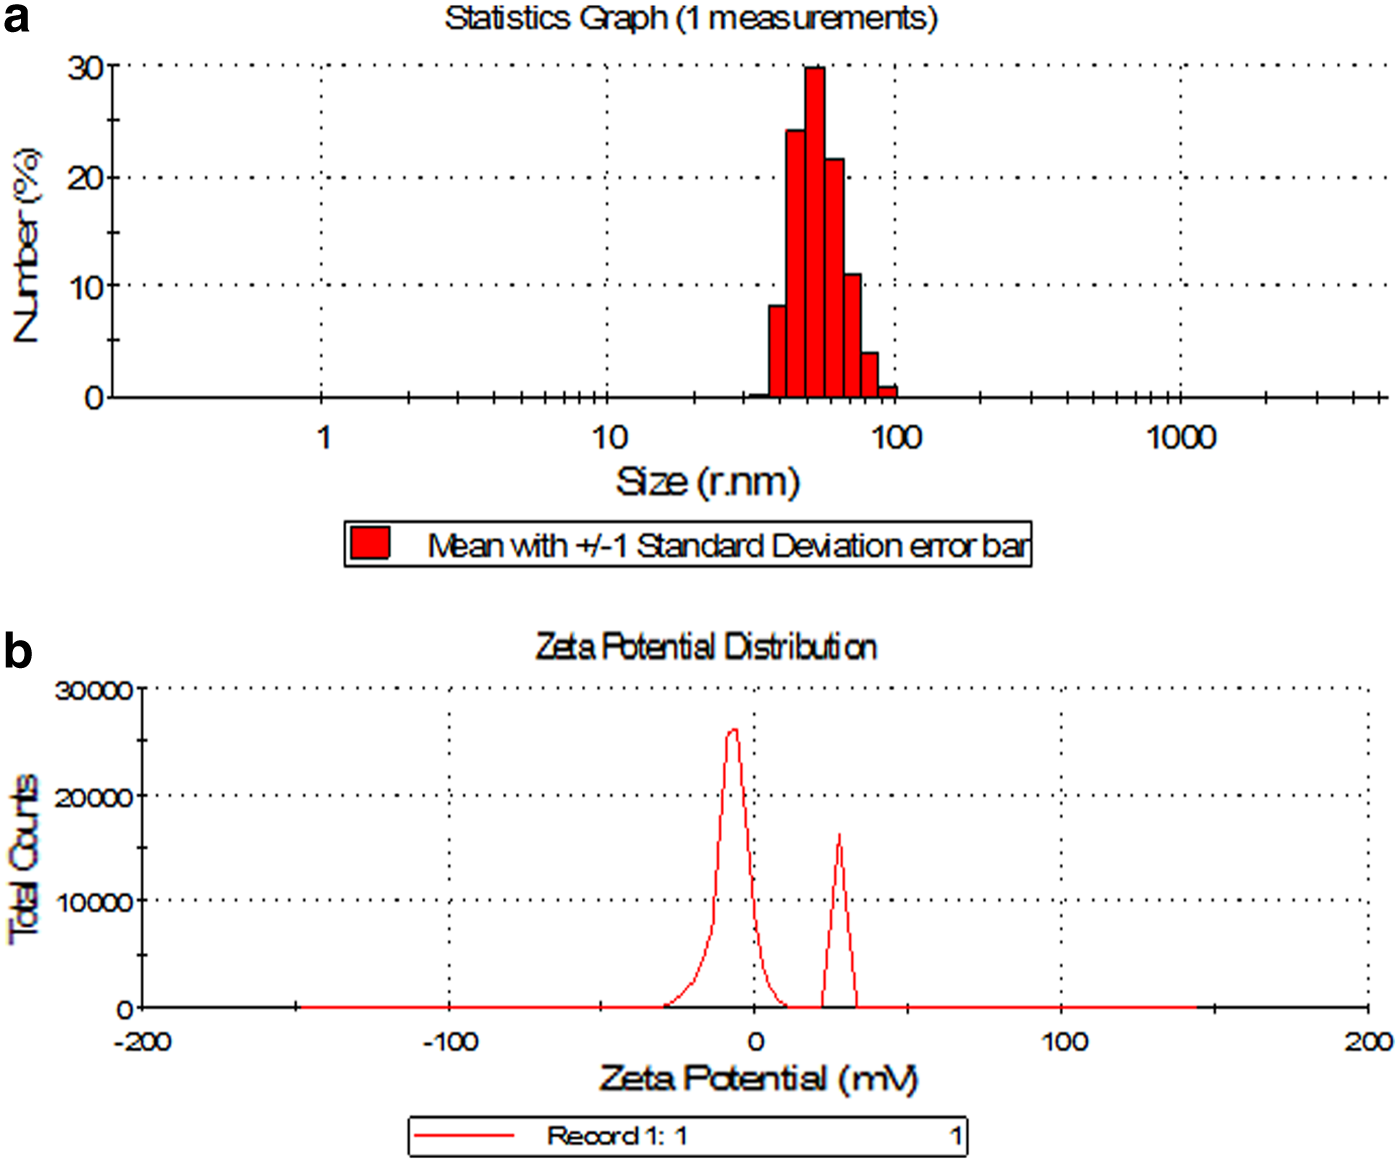
Size of nanorods and zeta potential distribution of α-Fe2O3 nanorods are shown in Fig. 1. The average size of α-Fe2O3 nanorods is around 40–100 nm. It also can be seen that most of the nanorods are negatively charged. To investigate the influence of assembled layers of CS and α-Fe2O3 on the morphology of ITO anode, the ITO was subjected to AFM characterization before and after the layer-by-layer modification. As shown in Fig. 2, the blank ITO anode, four layers CS/α-Fe2O3 and one layer chitosan-modified ITO (ITO/(CS/α-Fe2O3)4/CS), six layers CS/α-Fe2O3 and one layer chitosan-modified ITO (ITO/(CS/α-Fe2O3)6/CS), and eight layers CS/α-Fe2O3 and one layer chitosan-modified ITO (ITO/(CS/α-Fe2O3)8/CS) had different surface morphology and roughness.

Morphology of
The mathematical average roughness (Ra) of ITO blank was 0.791 nm, while the RMS average roughness (Rq) is 1.81 nm. Ra and Rq of ITO/(CS/α-Fe2O3)4/CS had a value of 0.844 nm and 1.13 nm, respectively. The Ra and Rq values of ITO/(CS/α-Fe2O3)6/CS were 0.872 and 1.27 nm, respectively. The Ra and Rq values of ITO/(CS/α-Fe2O3)8/CS were 0.436 and 1.46 nm, respectively. ITO/(CS/α-Fe2O3)6/CS had the maximum surface roughness, while the ITO/(CS/α-Fe2O3)8/CS anode had the minimum surface roughness. The lowest surface roughness of ITO/(CS/α-Fe2O3)8/CS would be due to the properties of the assembled charged polymers. With more polyelectrolyte molecules assembled on the ITO surface, the charged polymer chain became more regular, which made it smoother than the other three kinds of ITO surfaces.
The analysis of physical properties of layer-by-layer assembled polyelectrolyte had shown similar results (Han et al., 2012). Large surface roughness means large specific surface area. The thickness of the charged polymer layers increases with the assembly layer number. ITO/(CS/α-Fe2O3)4/CS and ITO/(CS/α-Fe2O3)8/CS were chosen for the following experiments. Figure 3 shows the SEM image of microbes on ITO blank and ITO/(CS/α-Fe2O3)4/CS. The results show that there are many kinds of microbes in this substrate system. The types of the microbes have not been identified in the current work and should be done in future work. It is observed that the amount of microbes on ITO/(CS/α-Fe2O3)4/CS is higher than that on the blank, which had also been proven by the microbes' activity experiment.

SEM images of microbes grow on
The phosphatide method was used for checking the microbes' activity (Aelterman et al., 2008). The results showed that the amount of microbes on the ITO/(CS/α-Fe2O3)4/CS was around 80 mg biomass-C, while that on ITO blank was 56 mg biomass-C. This might be attributed to the morphology and change in chemical composition of the ITO surface.
Current-time curves
Figure 4 shows the current-time curves of MFCs with the blank and modified ITO anode. As can be seen, the current produced by ITO/(CS/α-Fe2O3)4/CS was far higher than that produced by ITO/(CS/α-Fe2O3)8/CS, which were both far higher than the blank ITO anode. When the external resistance is 1000 Ω, the maximum current of ITO/(CS/α-Fe2O3)4/CS anode reaches 0.63 mA. After functioning for 4800 min, its electronic current begins to decrease slowly and reaches the final value of 0.41 mA.
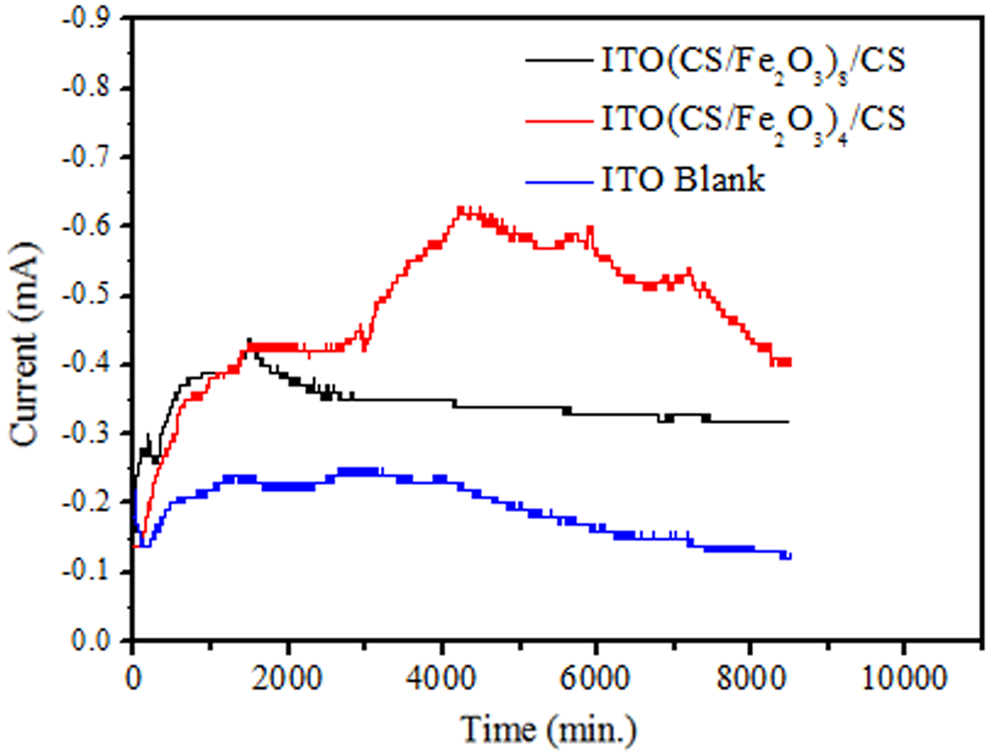
Current-time curves of the MFCs with ITO blank, ITO/(CS/α-Fe2O3)4/CS, and ITO/(CS/α-Fe2O3)8/CS anodes. MFC, microbial fuel cell.
The maximum current of ITO/(CS/α-Fe2O3)8/CS could reach 0.43 mA and also begins to decrease slowly after running for 3000 min. Its current was relatively stable and remained constant at 0.32 mA until the end of the operation. The maximum current of ITO blank is 0.25 mA after 3000 min. It decreases to 0.10 mA after operating for 9000 min. The current-time result was related to the surface morphology and chemical component of ITO anode. After CS/α-Fe2O3 modification, the performance of MFCs was dramatically increased. The current of this substrate system is far higher than the current (2 × 10⁻⁶ A), which was obtained for the reported system (Ji et al., 2011).
Cyclic voltammetry
To evaluate the effect of modification of ITO with CS/α-Fe2O3 and CS on electrochemical performance of anode, CV measurements were performed after the anodes had operated in MFCs for 24 h (Fig. 5). ITO/(CS/α-Fe2O3)4/CS and ITO/(CS/α-Fe2O3)8/CS anode had one oxidation current and one reduction current. ITO blank anode had one oxidation current and two reduction currents. The results of CVs, as shown in Fig. 5, were in accordance with the results of the current-time curves in Fig. 4.
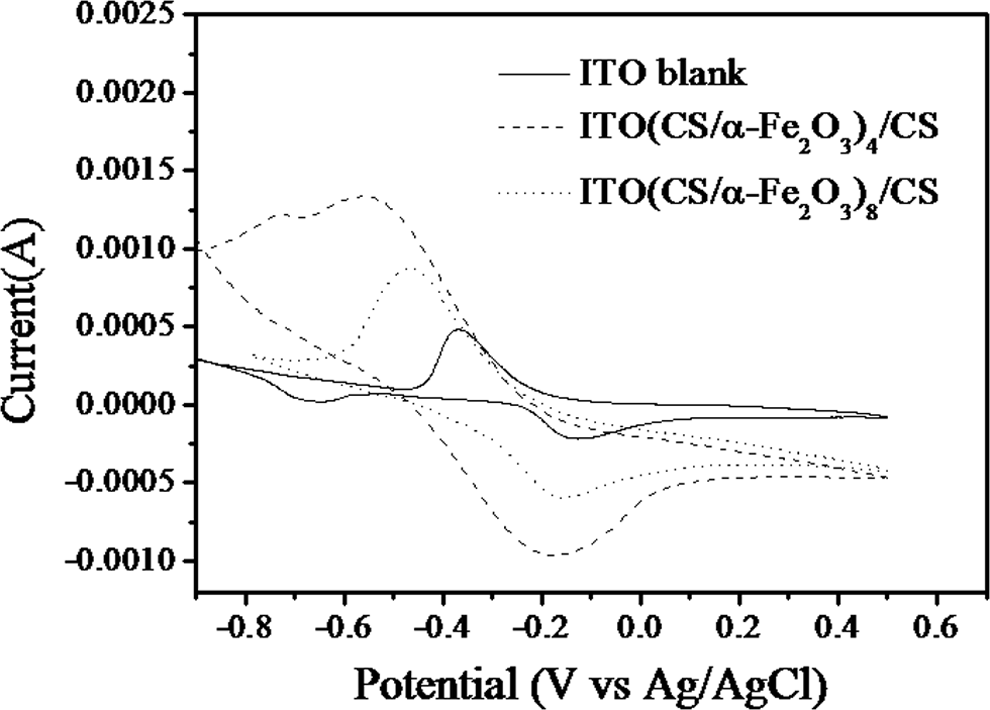
CV curves of ITO blank, ITO/(CS/α-Fe2O3)4/CS, and ITO/(CS/α-Fe2O3)8/CS anodes. CV, cyclic voltammetry.
Obviously, the ITO/(CS/α-Fe2O3)4/CS anode had a higher oxidation peak than ITO/(CS/α-Fe2O3)8/CS anode, both of which are far higher than the corresponding value of ITO blank. It meant microbes on ITO/(CS/α-Fe2O3)4/CS anode had higher activities than ITO/(CS/α-Fe2O3)8/CS and ITO blank anode. This also explains the reason why ITO/(CS/α-Fe2O3)4/CS and ITO/(CS/α-Fe2O3)8/CS anode had higher current than the blank ITO anode in the studied MFCs system. There are two reduction peaks in the ITO blank anode, which might be attributed to the Fe3+ in K3Fe(CN)6 that was deoxidized to Fe2+ and then to Fe in catholyte compartment.
In fact, the increases in redox peak and current are probably due to several factors. One of them is the change in microenvironment of the ITO surface, which altered the activities of the microbes and the interaction between microbes and anode. The outer layer of modified ITO surface is polyelectrolyte CS, which had a very good biocompatibility and could attract more microbes to adhere and grow. Large surface roughness means large specific surface area, which also was good for more microbes to grow. The existence of negative α-Fe2O3 could induce some microbes to assemble into the electrically conductive network, which was built by microbes (Mahadevan et al., 2006).
The α-Fe2O3 nanorods also improved the electron transferring efficiency in the extracellular network of microbes. Both chemical and physical properties influenced the results in the ITO/(CS/α-Fe2O3)4/CS and ITO/(CS/α-Fe2O3)8/CS anode systems. The higher roughness of ITO/(CS/α-Fe2O3)4/CS resulted in higher specific surface area of the system and, due to the anchoring of more microbes with higher activities, resulted in high performance of MFCs.
Electrochemical impedance spectroscopy and polarization curves
Figure 6 shows the polarization curves of MFCs with ITO blank and modified anodes. It can be seen that the voltage of ITO blank remained unchanged with the increase of current density. After calculations, its internal resistance was 1524 Ω. ITO/(CS/α-Fe2O3)8/CS anode system showed a similar trend with the ITO blank anode. Its internal resistance was found to be 1018.6 Ω. The voltage curve of ITO/(CS/α-Fe2O3)4/CS anode system became smooth with the increase of current density, whereas its internal resistance was 626.6 Ω.

Polarization curves of MFCs with ITO blank, ITO/(CS/α-Fe2O3)4/CS, and ITO/(CS/α-Fe2O3)8/CS anodes.
Power densities of MFCs with ITO blank and modified anodes are shown in Fig. 7. The power density of ITO/(CS/α-Fe2O3)4/CS is higher than those of ITO/(CS/α-Fe2O3)8/CS and ITO blank anode. The maximum power densities of ITO blank, ITO/(CS/α-Fe2O3)4/CS, and ITO/(CS/α-Fe2O3)8/CS were found to be 0.035, 0.124, and 0.084 W/m2, respectively. This is in accordance with the current, CV, and polarization curves. It was attributed to the surface roughness of ITO/(CS/α-Fe2O3)4/CS, which was far higher than the blank ITO and ITO/(CS/α-Fe2O3)8/CS. Physical factor strongly influenced the higher power density of ITO/(CS/α-Fe2O3)4/CS anode system, while the chemical factors strongly affected the results of ITO/(CS/α-Fe2O3)8/CS anode system.
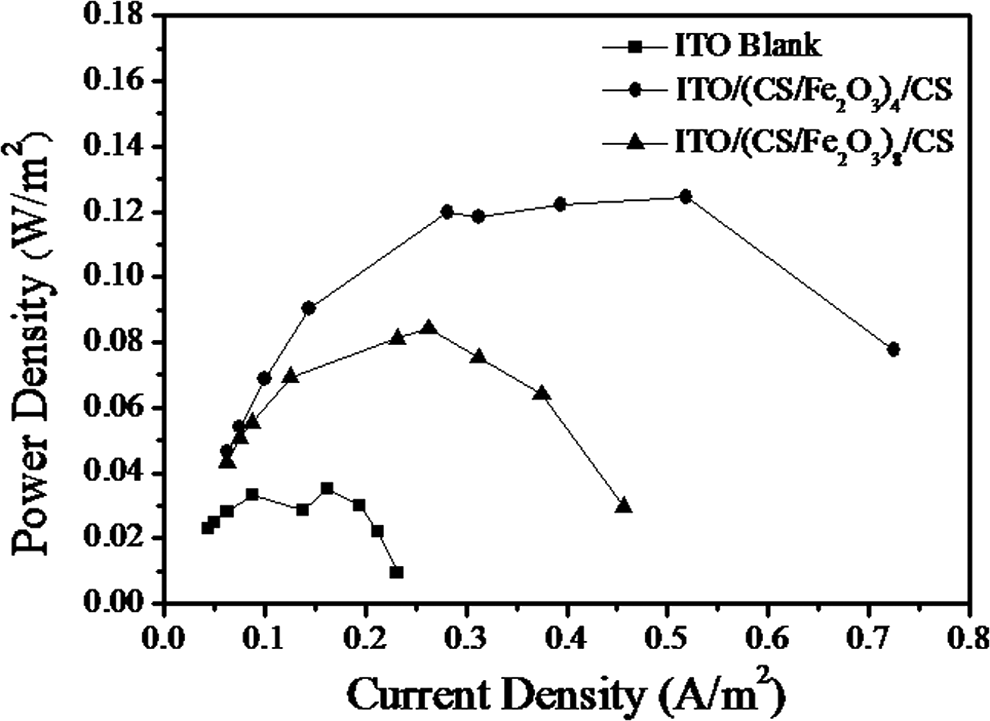
Power density curves of MFCs with ITO blank, ITO/(CS/α-Fe2O3)4/CS, and ITO/(CS/α-Fe2O3)8/CS anodes.
Variations in other factors in MFC system
COD removal efficiency of ITO blank, ITO/(CS/α-Fe2O3)4/CS, and ITO/(CS/α-Fe2O3)8/CS anode system was 69.8%, 76%, and 74%, respectively. The original pH value of anode substrate was 6.96, and after dealing with the ITO/(CS/α-Fe2O3)4/CS and ITO/(CS/α-Fe2O3)8/CS, the pH value changed to 7.28 and 7.72, respectively. The anode system changed from week acidic state to week basic state, which proved that a good proton transfer ability was maintained in the MFC system (Rozendal et al., 2006). The values of electrical conductivity of cathode compartment were found to be 1097 μs/cm (for ITO blank anode system), 2010 μs/cm (for ITO/(CS/α-Fe2O3)4/CS anode system), and 1936 μs/cm (for ITO/(CS/α-Fe2O3)8/CS anode system).
Conclusions
Lactic acid bacteria in fermentation waste could improve the current of MFCs. The roughness of ITO/(CS/α-Fe2O3)4/CS is higher than the corresponding value of ITO blank and ITO/(CS/α-Fe2O3)8/CS. The current and activities of microbes in ITO/(CS/α-Fe2O3)4/CS anode system are higher than those found in ITO/(CS/α-Fe2O3)8/CS and ITO blank systems. The values for internal resistance of ITO blank, ITO/(CS/α-Fe2O3)4/CS, and ITO/(CS/α-Fe2O3)8/CS were 1524, 1018.6, and 626.6 Ω in the MFCs wastewater treatment system, respectively.
The values for maximum power density of ITO blank, ITO/(CS/α-Fe2O3)4/CS, and ITO/(CS/α-Fe2O3)8/CS were 0.035, 0.124, and 0.084 W/m2, respectively. The higher roughness of ITO/(CS/α-Fe2O3)4/CS resulted in higher specific surface area available for growth of more microbes. The physical properties had a stronger effect on ITO/(CS/α-Fe2O3)4/CS anode. The layer-by-layer assembly of CS/α-Fe2O3 could significantly improve the performance of MFCs. The exact type of bacteria and metabolic pathway of the microbes are still uncertain and need to be identified in future research work.
Footnotes
Acknowledgments
This work was supported by the National Natural Science Foundation of China (No. 41373127), the Program for Liaoning Excellent Talents in University of China (No. LR2015052), Liaoning Provincial Natural Science Foundation of China (No. 2013020082), Science and Technology special fund of Shenyang City under Grant (No. F14-207-6-00), General project of the Education Department of Liaoning Province (No. L2015428), and the Zhejiang Open Foundation of the Most Important Subjects.
Author Disclosure Statement
No competing financial interests exist.