
Abstract
Abstract
Colony formation of Microcystis aeruginosa, a bloom-forming cyanobacteria, is closely associated with algal blooms in eutrophic freshwater systems worldwide. To develop effective methods for controlling excess algal growth, it is important to evaluate mechanisms underlying how M. aeruginosa forms colonies. In this study, extracellular polysaccharides (EPS) was isolated from algal blooms that mainly consisted of the genus Microcystis in eutrophic lakes and powdered EPS was prepared. This powdered EPS was used to control the EPS concentration in culture medium; then, the relationship among EPS, calcium (Ca2+), and colony formation of dispersed unicellular M. aeruginosa was investigated under alkaline conditions (pH 8.0). Experimental data indicated that the addition of powdered EPS (200 mg/L) alone did not induce colony formation of M. aeruginosa cells at pH 8.0, however; high concentration of calcium ion (1,000 mg/L) did contribute to colony formation. Moreover, when both EPS (200 mg/L) and calcium ion (1,000 mg/L) were added, the average cell number per colony increased by 2.6 times and particle size was enlarged compared with the culture medium in which calcium ion (1,000 mg/L) alone was added. The average total sugar content per colony and/or single cell of M. aeruginosa was found to be 62.7 pg/colony and 1.28 pg/cell for Ca2+ added medium, and 730 pg/colony and 5.74 pg/cell for the EPS+Ca2+ medium, indicating that an increase in cellular EPS content caused colony formation of M. aeruginosa.
Introduction
M
Under natural conditions, M. aeruginosa tends to form colonies by aggregating large number of cells that are encapsulated within the mucilaginous sheath, which is mainly composed of extracellular polysaccharides (EPS) (Nakagawa et al., 1987; Wilson et al., 2010). M. aeruginosa also possesses gas vesicles that can be linked to buoyancy (Wallace and Hamilton, 2000; Brookes and Ganf, 2001). The mucilaginous colony formation of M. aeruginosa prevents their predation from zooplankton (Fulton and Paerl, 1987) and enhances vertical migration as per Stoke's law (Brookes et al., 2003), promoting photosynthesis and nutrient uptake (Fogg and Walsby, 1971; Yang et al., 2008). It was also observed by Amemiya and Nakayama (1984) that metals such as Ca, Mg, and Fe in respective concentrations of 23.3, 3.73, and 8.48 mg/g could be accumulated in EPS, and eventually consumed by M. aeruginosa for survival, growth, and maintenance of the colonies (Nakagawa et al., 1987; Nagai et al., 2007). These unique characteristics tend to provide M. aeruginosa colonies with a greater competitive advantage over other phytoplankton species, and are, therefore, often found to be dominantly present at the water surface, preventing sunlight penetration and posing a threat to other submerged aquatic vegetation as well as organisms (Xu et al., 2013).
It has been generally recognized that M. aeruginosa loses its ability to form colonies and be buoyant under laboratory conditions. Previous studies have indicated that when the colonial M. aeruginosa isolated from algal blooms was transferred into a laboratory culture medium, the colonial cells disaggregated into single or twin cells after multiple generations, and they ceased to form colonies afterward (Stainer et al., 1971; Zhang et al., 2007). In addition, M. aeruginosa would not exhibit distinct buoyancy. As recognized by Plude et al. (1991) and Li et al. (2013), EPS plays an important role in maintaining colonial morphology, and the reason for M. aeruginosa becoming unicellular under laboratory conditions could be attributed to the decrease in EPS secretion (Yang et al., 2008). Some studies revealed that the disaggregated M. aeruginosa were able to colonize when EPS secretion was promoted under laboratory conditions, and the ability of M. aeruginosa for buoyancy was observed to be restored (Burkert et al., 2001; Wang et al., 2011; Yang and Kong, 2012). However, in these studies, the EPS content was increased by the addition of either zooplankton or high calcium ion, because of a defensive response toward predators or the activation of protein related to EPS production, respectively.
Buoyancy of M. aeruginosa depends on the balance of gas vesicle and carbohydrate contents or the colony size; M. aeruginosa tends to be buoyant when the content of gas vesicle in cells is predominant over carbohydrate, or the colony size is expanded (Zhu et al., 2014). During the course of cultivation, M. aeruginosa does not exhibit distinct precipitation in the culture medium, which means that the contents of gas vesicle and carbohydrate are not largely varied, and that the specific gravity of M. aeruginosa is around 1.0 or lighter. If the colony formation or enlargement of the colony size of M. aeruginosa could be enhanced using EPS, M. aeruginosa would rise to the water surface based on Stoke's law. This would imply the possibility of encouraging M. aeruginosa cells to naturally travel to the water surface, and thereby enable their removal through cost-effective methods such as skimming. Moreover, buoyancy is also an inherent characteristic of cyanobacterial species other than M. aeruginosa. Therefore, the ability to control buoyancy after colony formation could in general result in the development of a removal mechanism for cyanobacteria. Such a mechanism would help control algal blooms in eutrophic freshwater systems, and reduce its impact on water treatment plants and conservation of water quality.
It is hypothesized that the colony formation of M. aeruginosa could be induced if the EPS content in the medium was artificially increased. Since increasing the EPS secretion of M. aeruginosa artificially can be difficult, we isolated EPS as a powdered material from cyanobacterial blooms, consisting mainly of the colony-forming M. aeruginosa, in eutrophic lakes, and this powdered EPS was used to control the EPS concentration in the culture medium (Sato et al., 2016). Moreover, since it has also been reported by Zhao et al. (2011) that the colony formation of M. aeruginosa is influenced by the presence of dominant ions such as calcium in eutrophic lakes. As addressed earlier, calcium is highly concentrated (23.3 mg/g) in EPS (Amemiya and Nakayama, 1984); so, the effect of Ca2+ concentration in medium on the colony formation of M. aeruginosa was also examined. Although the unicellular M. aeruginosa formed colonies by adding the EPS into the medium under high Ca2+ concentration (1,000 mg/L), the colony formation was achieved only under weak acidic condition (pH 6.0) and reproducibility of the colony formation of M. aeruginosa was observed to be low at a solution pH higher than 6.0. This was due to the unstable solution pH in the medium, because the pH was controlled without a buffer. It was also implied in preliminary experiments that the colony formation might depend on the activity of M. aeruginosa and that the reproducibility of colony formation tended to be improved more for M. aeruginosa cells in an exponential growth phase than those in a stationary phase. As is well known, algal blooms tend to appear under alkaline conditions, so the present study attempted to induce colony formation of M. aeruginosa by controlling EPS and Ca2+ concentrations in the medium under strictly controlled pH condition using a buffer solution and M. aeruginosa activity. Furthermore, since the EPS concentration in the medium could be controlled in this study, an attempt was made to determine the amount of EPS required per colony and/or single cell of M. aeruginosa for effective colony formation.
Experimental Protocols
Unicellular M. aeruginosa
Unicellular M. aeruginosa strain (UTEX LB 2061) was obtained from the Culture Collection of Algae of the University of Texas, USA. This strain existed as a single cell or twin cells, which were highly dispersed in the medium. M. aeruginosa was cultured using 100 mL Wright's cryptophytes (WC) medium (Guillard and Lorenzen, 1972) in a 300 mL Erlenmeyer flask, which had nitrate-nitrogen (NO3-N) and phosphate-phosphorus (PO4-P) concentrations of 14 and 1.55 mg/L, respectively. No silicate sources were included in the medium. The pH of the solution was adjusted to 8.0 using 0.5 M HCl. Cultivation was performed at 25°C and 2,000 lux under static condition for about 2 weeks, after which an aliquot of the medium was transferred to fresh WC medium to subculture the unicellular M. aeruginosa. All media and glassware used for the cultivation were autoclaved at 121°C for 30 min before use. Each flask was manually stirred three times a day, and randomly moved around to make sure they received uniform light irradiance. All procedures were conducted in a clean bench to minimize microbial contamination.
Extraction of EPS from cyanobacterial blooms
A sample of cyanobacterial bloom was obtained in Lake Senba (36°22′ N, 140°27′ E) in September, 2014, Mito, Japan. The dense cyanobacterial sample was collected from the upper 5 cm of the water surface. The sample was rapidly transferred to the laboratory, and it was stored at 4°C in dark before use. Morphological observation using an optical microscope confirmed that the main species of the cyanobacterial bloom was the genus Microcystis. Extraction of EPS was attempted from this sample.
Extraction of EPS from the sample mentioned earlier was performed according to the method presented by Amemiya and Nakayama (1984), and Nishikawa and Kuriyama (1974), with some modifications. EPS on the cell surface of the cyanobacterial bloom was solubilized using 2% EDTA and 0.25 M NaOH and allowed to settle for 1 h at 25°C. The suspension obtained from this process was centrifuged at 3,000 rpm for 15 min, and the supernatant was collected. The supernatant was then mixed well with 1.5 times the volume of ice-cold ethanol, and the mixture was stored overnight at −20°C to precipitate EPS. After that, the solution was centrifuged at 3,000 rpm for 15 min, and the supernatant was removed to collect EPS from the bottom of the centrifuge tube. The EPS was freeze-dried at −0.1 MPa, −20°C for 3 h. The dried EPS was homogenized into a powder and stored in a desiccator before use.
Colony formation of unicellular M. aeruginosa
Unicellular M. aeruginosa was precultured in a 350 mL WC medium (NO3-N = 14 mg/L and PO4-P = 1.55 mg/L) in a 500 mL Erlenmeyer flask at 25°C with a controlled light illuminance of 10,000 lux and a light and dark cycle of 14 h:10 h. The solution pH was adjusted to 8.0 using 0.5 M HCl. Each flask was manually stirred three times a day, and randomly moved around to make sure that all flasks received uniform light irradiance. Preliminary experiments indicated that reproducibility of the colony formation of M. aeruginosa was significantly affected by the activity of M. aeruginosa cells and that the reproducibility tended to improve in the exponential growth phase compared with those in a stationary phase. Therefore, the preculture process was continued for 7 days to reach the exponential growth phase for M. aeruginosa. After cultivation, the culture medium was centrifuged at 3,000 rpm for 15 min and the supernatant was removed. Residual cells were resuspended in deionized water and further centrifuged at 3,000 rpm for 15 min to wash cells. The washing process was repeated three times to remove all ions contained in the medium.
Washed unicellular M. aeruginosa cells were then inoculated into a 50 mL culture medium in a 100 mL Erlenmeyer flask. Since colony formation could not be achieved at pH higher than 6.0 during preliminary experiments, which would be due to the unstable solution pH in the medium because the pH was controlled without a buffer. Accordingly, the present study used a 4.1 mM tris-(hydroxymethyl)-aminomethane (Tris) solution, which was the same Tris concentration as the WC medium, to control pH. An initial cell density of M. aeruginosa was 1.0 × 10⁶ cells/mL. Calcium chloride (CaCl2) was used to adjust Ca2+ ion concentration to 1,000 mg/L. The powdered EPS was first dissolved in deionized water and adjusted to 10,000 mg/L; then, the solution was filtered through Whatman GF/C filter paper. The filtrate was added to each flask to give the desired concentration. To investigate the effects of EPS and Ca2+ ion on colony formation of M. aeruginosa, three kinds of experimental medium were prepared: EPS (200 mg/L) added medium, Ca2+ (1,000 mg/L) added medium, and EPS (200 mg/L)+Ca2+ (1,000 mg/L) added medium. A control medium with no additions of EPS and Ca2+ ion was also prepared for comparison. Both the EPS and Ca2+ ion concentrations were determined based on preliminary experiments. EPS concentrations from 0.1 to 500 mg/L or calcium concentrations from 0 to 750 mg/L did not induce the colony formation of M. aeruginosa. As addressed next, the 200 mg/L EPS solution gave the chemical oxygen demand (COD) concentration of 12.7 ± 0.23 mg/L, which corresponded to the value in a eutrophic or hypereutrophic lake (Xu et al., 2003). The solution pH in all media was adjusted to 8.0 ± 0.1, which is close to the value in eutrophic lakes (Jin et al., 2006) by 0.5 M NaOH. Each flask was cultured in an incubator at 25°C, adjusting the light illuminance of 10,000 lux with a light and dark cycle of 14 h:10 h, respectively, and cultivated for 24 h under static condition. After cultivation, each flask was placed in shakers with an agitation speed of 120 rpm for 30 s to avoid colonial aggregation and sedimentation in the bottom of the flask. An aliquot of the culture medium was taken to measure cell and colony densities. Since individual M. aeruginosa exists as a single cell or twin cells, the aggregation of more than three cells was defined as a colony in this study. Each sample was filtered through a Whatman GF/C filter paper and the filtrate was used for the determination of dissolved concentrations of total sugar, nitrogen, phosphorus, and divalent calcium. The experiment was conducted in triplicate (n = 3), and the results were expressed as the mean value with a standard deviation (SD).
Analysis
Colony density, total cell density, and cell density excluding the colonies were measured by direct counting using an optical microscope with a digital camera system (AM-4023X; Dino-lite) and a plankton counting chamber (MPC-200; Matsunami Glass). The average cell number per colony (NAC) was calculated by the following equation:
where Ct is the total cell density (cells/mL), Ce is the cell density excluding the colonies (cells/mL), and c is the colony density (colonies/mL).
Zeta potential (ζ potential) of M. aeruginosa cells and/or colonies was determined by the ζ potential analyzer (ZC-3000; Microtec). ζ potential is the important parameter of double-layer repulsion for individual organic and inorganic particles, and it is used for the measurement of the apparent surface charge of algal cells (Aktas et al., 2012; Li et al., 2015). The ζ potential analyzer was equipped with a microscope to observe M. aeruginosa cells and colonies in a sample vessel. The vessel has the channel and electrode, which allows cells and colonies to migrate horizontally under conditions of applying a voltage. Approximately 4 mL of aliquots of each medium was filled in the vessel, and voltage was adjusted to 30 V. The electrophoretic mobility was measured at the static layer, and the ζ potential of cells and colonies was calculated according to Smoluchowski's equation.
where
where η is the viscosity of medium (kg/[m·s]), ɛ0 is the vacuum permittivity (8.85 × 10⁻¹² s4·A2/[kg·m]), ɛr is the dielectric constant of the medium (dimensionless), u is the electrophoretic mobility (m2/[V·s]), v is the velocity of M. aeruginosa cells and colonies (m/s), V is the voltage (V), and L is the distance of electrode (m).
Cell and/or colony size distribution was also determined by the ζ potential analyzer, although particles larger than 40 μm could not be detected. In the particle size measurement, particle diameter above 10 μm was regarded as a colony because the largest M. aeruginosa cell presented ca. 8–10 μm diameter in the control and such cells were considered twin cells. In each experiment 300 particles were measured and the frequency distribution and frequency percentage in each particle size were calculated. The solution pH was measured by the pH meter (D-51; Horiba). Nitrogen and phosphorus concentrations were analyzed by ion chromatography (ICS-1100; Dionex) and molybdenum blue method (Murphy and Riley, 1962) using a UV-Vis spectrophotometer (UV-2550; Shimadzu), respectively. Concentrations of divalent calcium ion were determined using an atomic absorption spectrometer (nov AA 300; Analytik). Total sugar content in the media was determined by the phenol–sulfuric acid method with glucose as the standard (Dubois et al., 1956). COD was measured based on the acidic permanganate methods (Japanese Standard Association, 1998). A 200 mg/L of EPS solution without the addition of Tris buffer was prepared, and 100 mL of the solution was used for the analysis.
Significant differences in variables among each medium were assessed by one-way analysis of variance using IBM SPSS Statistics (Version 22; IBM). Tukey's tests were conducted to compare the values for each medium when a significant difference between 0 and 24 h was detected. Difference was regarded to be statistically significant when p < 0.05.
Results
Optical microscopic observation
Photomicrographs were taken for each medium after 24 h cultivation using an optical microscope to observe the morphological changes of M. aeruginosa. They are shown in Fig. 1a–d. M. aeruginosa were present only as a single cell or twin cells and were highly dispersed in the control medium (Fig. 1a). Similar morphology was observed in the EPS added medium; however, the medium contained sheath-like substances, which were not observed in the control (Fig. 1b). In comparison, single cell and twin cells in combination with several small colonies were found in the Ca2+ added medium (Fig. 1c). The EPS+Ca2+ added medium was morphologically similar to the Ca2+ added medium; however, the colonies were much larger (Fig. 1d).

Photomicrograph of Microcystis aeruginosa in each medium.
Colony and cell densities of M. aeruginosa
Colony density, total cell density, and cell density excluding colonies were measured for each type of culture medium, and the results are tabulated in Table 1. M. aeruginosa formed colonies in the Ca2+ added, and the EPS+Ca2+ added medium. The colony density of the Ca2+ added medium was significantly higher (1.03 × 10⁴ ± 2.97 × 10³ colonies/mL) than that of the EPS+Ca2+ medium (8.92 × 10³ ± 3.37 × 10³ colonies/mL) (p < 0.05). The total cell density of the control decreased from 1.00 × 10⁶ to 8.48 × 10⁵ ± 7.12 × 10⁴ cells/mL after 24 h of cultivation. There was not a significant difference in the total cell density between the control and the EPS only added medium (1.00 × 10⁶ ± 6.53 × 10⁴ cells/mL), and a similar value was obtained in the Ca2+ only added medium (9.53 × 10⁵ ± 9.17 × 10⁴ cells/mL) (p > 0.05); whereas ca. 1.9 times higher cell density (1.58 × 10⁶ ± 6.08 × 10⁴ cells/mL) than that of the control was obtained in the EPS+Ca2+ medium (p < 0.05). The cell density excluding colonies in both the Ca2+ added (4.70 × 10⁵ ± 9.87 × 10³ cells/mL) and the EPS+Ca2+ added medium (5.46 × 10⁵ ± 1.02 × 10⁵ cells/mL) was significantly lower than the control (8.48 × 10⁵ ± 7.12 × 10⁴ cells/mL), as most cells were aggregated within the colony (p < 0.05).
Values are represented as mean ± standard deviation (n = 3). Different superscript letters represent significant differences (p < 0.05).
EPS, extracellular polysaccharides.
Using the values for colony density, total cell density, and the cell density excluding colonies, the average cell number per colony was calculated and the results are also presented in Table 1. The average cell number per colony for the Ca2+ added medium was 48.8 ± 14.0 cells/colony, whereas ca. 2.6 times higher value of the cell number (127 ± 49.7 cells/colony) was obtained for the EPS+Ca2+ added medium (p < 0.05).
Cell and colony size frequency distribution
Table 2 summarizes the cell and/or colony size frequency distribution in each medium. The control medium showed that ∼193 ± 37 cells (64% ± 12%) and 106 ± 37 cells (36% ± 12%) of M. aeruginosa were in the range of 0–5 and 5–10 μm, respectively, and particles larger than 10 μm were not found in the medium. In the EPS added medium, the number of particles exhibiting 10–15 μm was 12.7 ± 10 cells (4% ± 3%), and others had a particle diameter of <10 μm. The Ca2+ added medium had larger particle sizes of 10–15, 15–20, and 20–25 μm diameters with the proportion of 10% ± 2%, 2% ± 2%, and 0.2% ± 0.2%, respectively. In the EPS+Ca2+ medium, particles with 0–25 μm of diameters were present, and the diameters ranging from 30 to 35 μm were observed, in which the proportion was ca. 0.5% ± 0.5% in the total cell density. Unlike other experimental parameters, there was not a significant difference in the cell and/or colony size distribution between each medium, and only the number of particle sizes of 10–15 μm in the EPS added medium was significantly fewer (p < 0.05) than the Ca2+ and the EPS+Ca2+ medium.
Values are represented as mean ± standard deviation (n = 3). Values in parentheses are the proportion of individual particles to total particles. Different superscript letters represent significant differences (p < 0.05).
Flocculation of EPS interacted with each other.
Change in ζ potential
Changes in ζ potential of M. aeruginosa cells and/or colonies in each medium are shown in Fig. 2. The ζ potential for the control medium was −30.0 ± 2.3 mV, which exhibited a significant difference from the EPS added medium (−35.7 ± 5.5 mV). In the Ca2+ added medium, the absolute ζ potential indicated a significantly lower value (−25.6 ± 8.1 mV) than that of the control (p < 0.05), and was the lowest among all media considered in this study. A decrease in ζ potential was also observed for the EPS+Ca2+ added medium, representing the value of −27.8 ± 0.6 mV, which was remarkably lower than that in the control medium (p < 0.05).
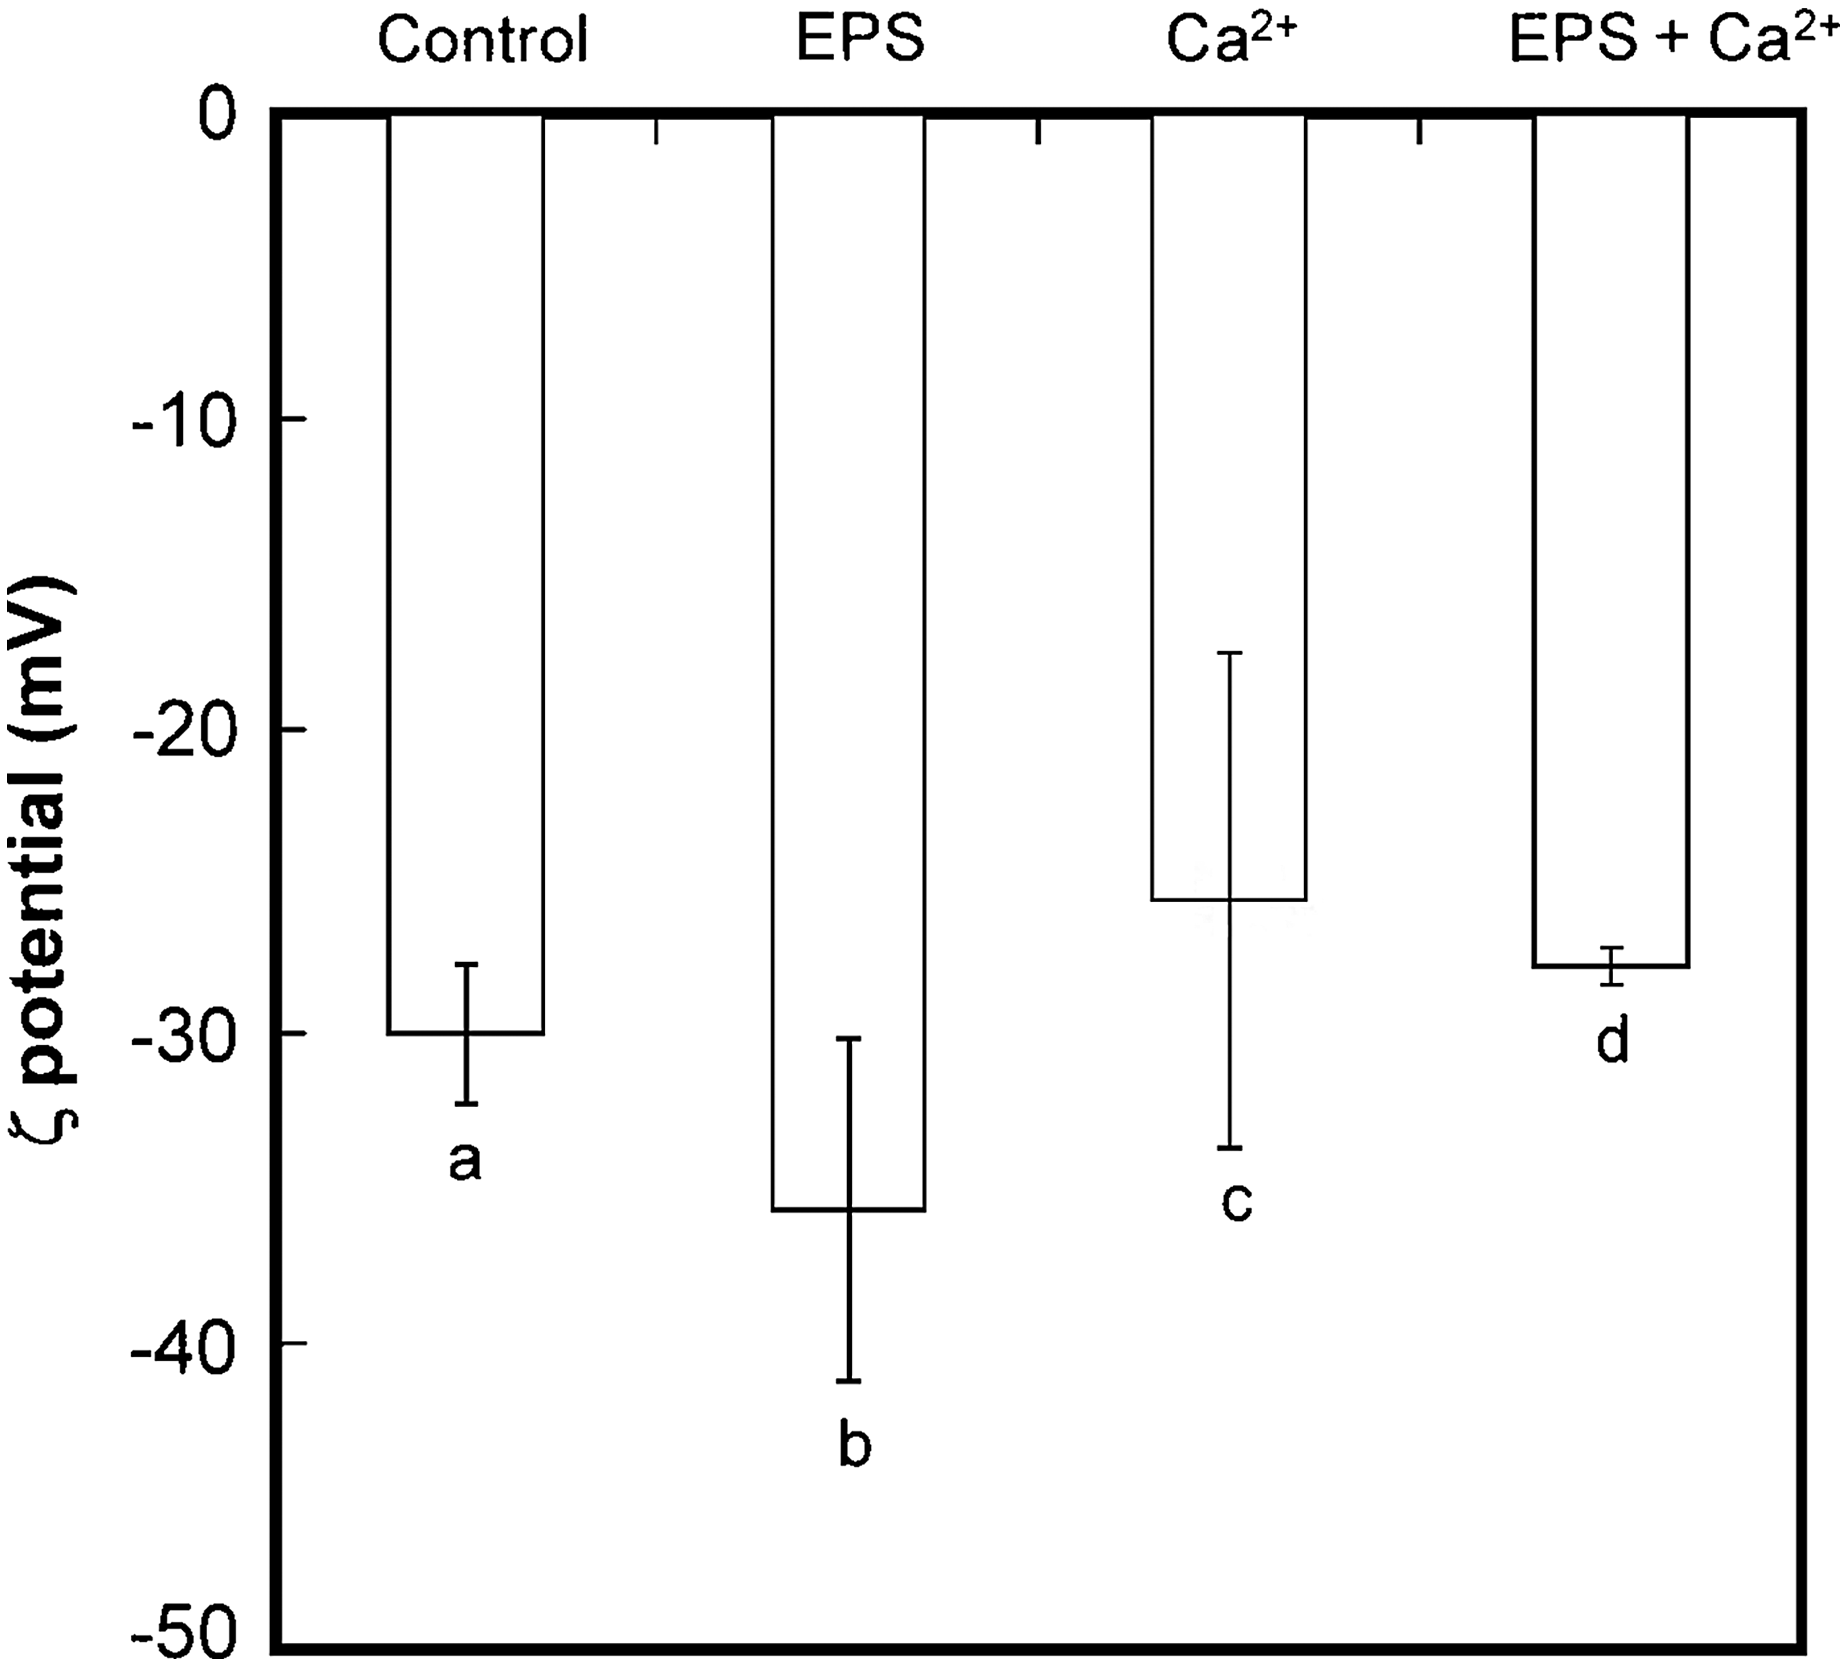
Zeta potential of M. aeruginosa cells and colonies in each medium. Values are represented as mean ± standard deviation (n = 3). Different letters represent significant differences (p < 0.05).
Nutrient, calcium concentrations, and pH in each medium
No nitrogen concentration was detected in each medium either before or after the experiment, whereas phosphorus was observed when the powdered EPS was added to the medium. Phosphorus concentrations for the EPS-only and the EPS+Ca2+ media presented ca. 1.51 ± 0.03 mg-P/L and 1.46 ± 0.02 mg-P/L at t = 0 h, and 1.44 ± 0.02 mg-P/L and 1.29 ± 0.05 mg-P/L at t = 24 h, respectively. Phosphorus concentrations for the EPS added and the EPS+Ca2+ added medium were remarkably reduced after 24 h (p < 0.05).
Calcium concentration for the control and the EPS added medium was below detection limit both before and after the experiment. The calcium concentrations for the Ca2+ added and the EPS+Ca2+ added media exhibited ca. 1,006 ± 8.74 and 1,026 ± 10.2 mg/L at t = 0 h, and 977 ± 23.0 and 1,030 ± 10.9 mg/L at t = 24 h, respectively. Little change in the concentration both before and after the experiment was observed for the media (p > 0.05).
Although the solution pH was measured for all media, little difference was observed (p > 0.05). The pH values varied between 7.9 and 8.1 among each medium.
Total sugar and COD concentration in each medium
Total sugar content at the beginning (t = 0 h) and the end (t = 24 h) of experiments in each medium was measured. The total sugar content for the control and the Ca2+ added medium was below detection limit both before and after the experiment. When the powdered EPS was added into the medium, the total sugar contents for both the EPS added and EPS+Ca2+ added media showed ca. 1.30 ± 0.42 and 2.67 ± 2.86 mg/L at t = 0 h, and 7.38 ± 1.00 and 0.87 ± 0.19 mg/L at t = 24 h, respectively. Although total sugar content increased after the 24 h cultivation in EPS added medium (p > 0.05), a significant change both before and after the experiment was not observed in other media (p > 0.05). The COD concentration in the medium with the EPS addition was measured at the beginning of the experiment, and the value was obtained to be 12.6 ± 0.23 mg/L.
Discussion
As exhibited in Fig. 1, the addition of the powdered EPS (200 mg/L) in the medium did not cause morphological changes of M. aeruginosa, suggesting that EPS alone would not induce colony formation of M. aeruginosa at the solution pH of 8.0. The addition of the powdered EPS also resulted in the phosphorus concentration in the EPS and the EPS+Ca2+ media to be as high as ca. 1.5 mg/L, although nitrogen was not detected. Several studies indicated that the EPS production as well as colony formation of Microcystis would be promoted when nutrients, especially phosphorus concentration, are limited (Otero and Vincenzini, 2003; Wang et al., 2010a, 2010b). Despite these findings, the colony formation of M. aeruginosa was observed in the EPS+Ca2+ medium, indicating that phosphorus and nitrogen concentrations were not influential factors for the development of M. aeruginosa colony formation in this study.
Although EPS alone had no effect on the colony formation, the addition of Ca2+ ion (1,000 mg/L) did induce morphological changes of M. aeruginosa (Fig. 1 and Table 1). Moreover, the presence of particles larger than 10 μm diameter indicates that colony formation of M. aeruginosa occurred in the Ca2+ added medium (Table 2). Wang et al. (2011) investigated the effects of Ca2+ and Mg2+ ions on the colony formation of M. aeruginosa. Their results clearly indicated that the colony formation was affected by the Ca2+ ion, and that the concentration required for making large colonies was 100 mg/L. In our preliminary experiments, calcium concentrations between 0 and 750 mg/L at pH 8.0 in the aqueous solution did not induce reliable M. aeruginosa colony formation (data not shown). These disagreements could be due to differences in the M. aeruginosa strain, the presence of macro/micro nutrients, as well as culture conditions such as cultural period, light intensity, and temperature.
According to the report by Amemiya and Nakayama (1984), the calcium content in EPS extracted from algal blooms (mainly the genus Microcytis) was 23.3 mg/g. This indicates that calcium is highly concentrated in EPS and there is a strong calcium gradient between Microcystis cells and EPS. In the present study, we could not incorporate calcium into EPS, as it was different from wild colonial Microcystis. This may be the reason that the high Ca2+ concentration of 1,000 mg/L in the culture medium was needed to induce colony formation of M. aeruginosa. When concentrations of Ca2+ ion and EPS in the medium were simultaneously adjusted to 1,000 and 200 mg/L, respectively, colony formation was more enhanced compared with the medium with the addition of Ca2+ ion. This result indicates that colony formation of M. aeruginosa under controlled EPS and Ca2+ concentrations in the culture medium can be accomplished not only in acidic condition (pH 6.0) (Sato et al., 2016), but also in alkaline condition (pH 8.0).
It is also recognized that reproducibility of the colony formation of M. aeruginosa was improved when M. aeruginosa cells obtained in an exponential growth phase were used compared with those in a stationary phase (data not shown). These trends suggest that active M. aeruginosa cells would strongly interact with both EPS and Ca2+ ion to form colonies. However, a comparison of the average cell number per colony between these studies indicates that the calculated value at pH 8.0 was approximately half of that at 6.0. These results suggest that the colony formation was unfavorable for the alkaline condition compared with the acidic condition, which agrees with the result presented by Wyatt et al. (2012) that the strong flocculation of Chlorella zofingiensis by adding ferric trichloride was observed under the acidic condition. The enhancement of colony formation would be due to the interaction between EPS and the Ca2+ ion accompanying the cross-linked reaction (discussed next).
The absolute value of ζ potential for the surface of M. aeruginosa cells increased by adding the powdered EPS compared with the control (Fig. 2). It is understood that several functional groups such as carboxy, amino, and hydroxy groups exist on the EPS matrix (Wang et al., 2012; Santos et al., 2014; Sato et al., 2016) and that the carboxy group was negatively charged at pH above 4.0 (Wang et al., 2012). The enhancement of the negative charge of M. aeruginosa cell surface would be attributed to the carboxy groups on EPS (Hadjoudja et al., 2010).
On the other hand, the addition of the Ca2+ ion, even with the powdered EPS, caused the opposite trend in ζ potential. Qu et al. (2012) evaluated the effect of Ca2+ ion on the ζ potential of extracellular organic matters (EOM) of M. aeruginosa cells and concluded that the absolute ζ potential value of organics of EOM was gradually lowered, accompanying the increase in the amount of Ca2+ ion added. The ζ potential reduction of Microcystis cells was also observed by the addition of manganese dioxide (Qu et al., 2015). In the present study, the addition of Ca2+ ion to each medium also led to the decrease in the absolute ζ potential values of M. aeruginosa cells/colonies compared with the control (p < 0.05). The decrease in ζ potential would be attributed to the neutralization of negative charge on the M. aeruginosa cell surface, which resulted in the aggregation of cells and the formation of colonies. However, the degree of the absolute ζ potential reduction in this study was ca. 5–10 mV less than pH condition of 6.0 (Sato et al., 2016), implying that the pH condition of the present study may be disadvantageous for colony formation of M. aeruginosa compared with the acidic condition. Although the ζ potential of the EPS+Ca2+ added medium was significantly lower (p < 0.05) than the Ca2+ added medium, the averaged cell number per colony was larger (p < 0.05) in this medium, implying that the colony formation and the expansion of M. aeruginosa cell size relate to not only the calcium ion but also the EPS added into the medium.
Colony formation would also be attributed to the hydrophobicity of M. aeruginosa cells. Fattom and Shilo (1984) discussed the adhesion mechanism of benthic cyanobacterial cells and that the cell–cell attachment was induced by cationic ions such as magnesium and sodium ions, which could weaken negative charge and also change the nature of the cell surface from hydrophobicity to hydrophilicity. Comparing morphological changes of M. aeruginosa in both the EPS and the EPS+Ca2+ media in this study, it was obvious that the colony formation of M. aeruginosa was achieved in the latter medium. This trend might be due to the enhancement of hydrophobicity of the added EPS as well as due to the EPS present on M. aeruginosa cells accompanying the addition of Ca2+ ion in the medium.
Amemiya and Nakayama (1984) attempted the chemical analysis of trace metal ions in EPS isolated from algal blooms (mainly the genus Microcystis) and indicated that EPS contained several metals such as Na, K, Ca, Mg, Fe, Mn, Zn, Ni, and Cu, and the highest contents of the metals was Fe (ca. 25% in total metal contents). Nagai et al. (2007) pointed out based on several culture experiments that iron limitation significantly affected the growth of M. aeruginosa. From these results, the iron ion as well as other micronutrients contained in EPS would affect the colony formation of M. aeruginosa.
In our preliminary experiment, we performed elemental analysis of EPS using an elemental analyzer (Perkin Elmer2400; Perkin Elmer), and found that EPS contained 30%, 5%, 7%, and 58% of carbon, hydrogen, nitrogen, and oxygen (by balance) respectively. This result implies that the carbon content of EPS was quite low. The low carbon content is reflected in the result of COD analysis, which gave the value of 12.7 ± 0.23 mg/L in the medium with the EPS addition (t = 0 h). In the present study, we first dissolved EPS in distilled water, then filtrated the EPS solution, and finally adjusted the EPS concentration in each medium. Consequently, the total sugar content in both the EPS added and EPS+Ca2+ added media showed ca. 1.30 ± 0.42 and 2.67 ± 2.86 mg/L at t = 0 h, respectively. Thus, although the EPS concentration was adjusted to 200 mg/L in the EPS added medium, the dissolved carbon concentration in the medium was similar to the value in a eutrophic (7.10 mg/L) or hypereutrophic lake (14.0 mg/L) (Xu et al., 2003).
For Ca2+ added medium, the averaged total sugar contents per colony (TSCcol,i) and/or single cell (TSCcell,i) of M. aeruginosa could be quantified based on the values in Table 1 and Fig. 2, and calculated by the following equation:
where TSC is the EPS content in the medium, Dcol is the colony density, NAC,i is the averaged cell number per colony, and the suffixes i and j are the Ca2+ added and the control media, respectively.
In case of the EPS+Ca2+ medium, the same equations can be applied, but the suffixes i and j should be used for the EPS added and the EPS+Ca2+ medium, respectively.
TSCcol and TSCcell values exhibited 62.7 pg/colony and 1.28 pg/cell for the Ca2+ added medium, and also 730 pg/colony and 5.74 pg/cell for the EPS+Ca2+ medium, respectively. In the study of Li et al. (2013), M. aeruginosa in cultures formed macroscopic colonies when the EPS content was ca. 0.6–0.8 pg/cell, whereas M. aeruginosa mainly existed as unicellular and twin cells at the EPS content below 0.4 pg/cell. Yang et al. (2008) revealed that M. aeruginosa needed the EPS sugar content of 2.14 pg/cell for the formation of the colony, although a single cell and twin cells possessed only 1.85 pg/cell. These findings support our hypothesis that an increase in the cellular EPS content causes the colony formation of M. aeruginosa. Despite the high EPS content after cultivation in the EPS added media, no colony was formed. As discussed next, this would be due to the presumption that the enhancement of electronical repulsion between cells would be enlarged by accompanying the addition of EPS without the presence of multivalent metal cations that could weaken the negative charge of cells.
Previous studies clarified that EPS contained uronic acids (Amemiya and Nakayama, 1984) that have functional groups such as hydroxyl and carboxy groups. Uronic polymers such as pectin could be cross-linked by polyvalent metal cations such as Ca2+ ion, whereas divalent cations are known to be cross-linked with negatively charged functional groups to make cell–cell aggregation (IIjima et al., 2002; Wang et al., 2011).
Therefore, the surface functional groups such as carboxy groups in EPS are considered to be negatively charged in aqueous solution; thus, in this study, electrostatic repulsion among cells occurred, causing the nonaggregation of M. aeruginosa in the EPS added medium. In the Ca2+ added medium, a slight amount of EPS surrounding M. aeruginosa cells was aggregated to each other via cross-linked reactions that were caused by the addition of Ca2+ ion, contributing to the colony formation in the Ca2+ added medium. Similarly, M. aeruginosa colonies in the Ca2++EPS added medium were formed in the same way as the Ca2+ added medium, but due to the presence of a large amount of EPS added, the cross-linked reaction between EPS and Ca2+ ion was enhanced. This would be the mechanism for the formation of large-sized colonies of M. aeruginosa in the Ca2++EPS added medium.
Visible observation of the culture flask also confirmed the assembly of M. aeruginosa colonies in the medium. However, M. aeruginosa colonies did not rise to the water surface and tended to be suspended in the medium. As mentioned earlier, the buoyancy of M. aeruginosa is dependent on the colony size, and the balance of gas vesicle and cellular carbohydrate contents as well. Chu et al. (2007) indicate that the carbohydrate content in M. aeruginosa cells is consumed under dark condition. In this study, a light and dark cycle in the culture experiment was 14 h:10 h, implying that the duration of dark condition was short for M. aeruginosa to consume enough carbohydrate. These experimental conditions may affect the buoyancy of colonial M. aeruginosa in this study.
Summaries
This study isolated EPS as a powder material from cyanobacterial blooms (mainly colony-forming M. aeruginosa), and the powdered EPS was used to trigger colony formation of the dispersed unicellular M. aeruginosa by controlling EPS concentration in the culture medium under alkaline conditions. The effect of the Ca2+ ion on the colony formation of the dispersed M. aeruginosa was also investigated; then, the interaction between EPS and Ca2+ ion on the colony formation was discussed. The main conclusions of this study can be summarized as follows.
(1) Addition of the powdered EPS into the medium did not cause morphological changes of the unicellular M. aeruginosa, suggesting that EPS alone would not induce the colony formation of M. aeruginosa under alkaline conditions.
(2) A high concentration of calcium ion (1,000 mg/L) caused the colony formation of the unicellular M. aeruginosa.
(3) When EPS and Ca2+ ion in the culture medium were adjusted to 200 and 1,000 mg/L, respectively, the average cell number per colony and the particle size of M. aeruginosa showed ∼2.6 times greater values than those in the Ca2+ added medium.
(4) TSCcol and TSCcell values exhibited 62.7 pg/colony and 1.28 pg/cell for the Ca2+ added medium, and also 730 pg/colony and 5.74 pg/cell for the EPS+Ca2+ medium, respectively, indicating that an increase in the cellular EPS content causes the colony formation of M. aeruginosa.
Footnotes
Acknowledgments
This work was supported in part by the River Fund (No. 27-1211-006) in charge of The River Foundation, Japan, and by JSPS KAKENHI Grant Number 15K18142. The authors would like to extend their deep gratitude to Prof. Dr. Fumio Imazeki, Safety and Health Organization, Chiba University, for the encouragement rendered toward this study.
Author Disclosure Statement
No competing financial interests exist.