
Abstract
Abstract
Direct anaerobic treatment in the main line of a wastewater treatment plant is a promising way of recovering chemical energy, even in moderate climates. Full-scale applications of upflow anaerobic sludge blanket (UASB) reactors are common in warm climates and have recently begun to appear in areas with colder climate. Several new types of reactors optimized for low temperature treatment were proposed such as UASB-Digester or anaerobic membrane bioreactor (AnMBR). However, long-term operation of such systems treating real wastewater at winter temperatures is needed to assess their suitability. The aim of this article is to evaluate the operation of a laboratory-scale UASB reactor (1.9 L) before and after the installation of ultrafiltration membrane for solids separation from the effluent. The laboratory model treated wastewater at 15°C for over 850 days. The organic loading rate of the UASB reactor and AnMBR was 1.4 and 1.6 g COD/[L·d], respectively, while the hydraulic retention time was around 9 and 10 h. Energy recovery from the wastewater in gaseous methane was 4% and 6% in the UASB reactor and AnMBR, respectively. The methane content was 63% ± 17% and 64% ± 2%, respectively. In the UASB reactor, 64% of the influent chemical oxygen demand (COD) was removed in long term. The AnMBR ran at average 85% COD removal. Results show that AnMBR can deliver more stable effluent quality for wastewater treatment even at low (15°C) temperature. However, even the AnMBR effluent requires further posttreatment. Thus, simpler and less energy demanding UASB appears more relevant for wastewater pretreatment under European conditions.
Introduction
W
Hydrolysis of particulate organic matter is the limiting step for wastewater treatment and its rate is strongly dependent on temperature (Lettinga et al., 2001). Mesophilic reactors usually consist of a single reactor as hydrolysis rate at 35°C is sufficiently high. However, at lower temperatures, accumulation of solids in a single-stage reactor poses the risk of methanogens washout.
There are number of approaches for how to deal with the excessive amount of suspended solids. For example, Wang (1994) used hydrolytic upflow sludge blanket pretreatment with a subsequent upflow anaerobic sludge blanket (UASB) reactor operating at overall hydraulic retention times (HRTs) equal to a single UASB (5 h). Later, UASB-Digester system was proposed that enhances the removal of suspended chemical oxygen demand (COD), allowing short HRT of the main wastewater stream (Lettinga and Hulshoff-Pol, 1991; Mahmoud, 2008; Zhang et al., 2013). In this approach, solids accumulated in a UASB reactor are digested in a mesophilic digester and later partially returned back as inoculum with an increased methanogenic activity. Recently, anaerobic membrane bioreactors (AnMBRs) have been used for wastewater treatment. AnMBRs enable good control over solids retention time and achieve effluent quality unprecedented in anaerobic wastewater treatment (Shin et al., 2014).
All modifications of AnMBR achieve (An et al., 2009) good effluent quality, but require complex instrumentation, including expensive membrane modules, number of pumps, and pressure sensors. Moreover, the operation of external membrane modules is energetically very demanding. Therefore, it must be assessed, whether the gains of AnMBRs are sufficient to offset their increased complexity and higher price when compared to the performance of UASB reactors.
The only direct experimental comparison of wastewater treatment with simple UASB reactor and AnMBR was published recently by Liu et al. (2013) and Ozgun et al. (2015). However, these authors used synthetic wastewater, applied higher temperature (27–30°C; 25°C), and the operation was rather short.
This article aims to compare the performance of a laboratory-scale UASB reactor and AnMBR treating real wastewater under conditions relevant for large wastewater treatment plants operating in temperate climate of Central Europe (15°C). The main objectives were to evaluate (1) COD removal efficiencies of both reactors, (2) the efficiency of energy recovery (methane production) in both reactors, and (3) COD balance of both reactors. Based on literature data (Shin et al., 2014; Ozgun et al., 2015), we hypothesized that the effluent of AnMBR will be of high quality in terms of COD (between 30 and 100 mg/L) and suspended solids. We also hypothesized that energy recovery achieved in AnMBR will offset the increased energy consumption and complexity of AnMBR compared to the UASB.
Experimental Protocols
UASB reactor
Experiment were carried out in a 1.9 L UASB reactor made of 1 m tall polymethylmethacrylate tube with an inner diameter of 52 mm. The wastewater was fed to reactor by a peristaltic pump (Watson-Marlow 101 U/R) to the bottom of the reactor (1.5 cm above bottom) at a constant flow rate. The organic loading rate (OLR) thus varied according to the actual wastewater strength. Glass marbles layer (200 pcs, 1 cm diameter) distributed the flow of wastewater at the bottom of the reactor. A simple gas–liquid–solid separator was placed on the top of the UASB. It constituted from a deflector placed on the reactor wall and a funnel connected to the top of the reactor. The production of biogas was measured online by a gas-meter Ritter MGC-1 (Dr.-Ing. Ritter apparatebau GMBH & CO. KG) connected to a computer.
Sludge profile measurement was enabled by side sampling ports having 10 cm spacing. To prevent sludge from floating and escaping, a sieve and a brush filtered the mixture in the reactor, being placed ∼10 cm beneath the gas–liquid–solid separator.
Reactor temperature was maintained at 15°C by a PVC tube wounded around it. The tube was connected to a cooling circulator (Julabo GmbH). The temperature setting was based on literature, intended to simulate the average winter weather conditions at large wastewater treatment plants in Central Europe (Mucha, 2009).
AnMBR
A membrane module was added after 765 days of operation to a UASB reactor resulting in a UASB-MBR reactor, hereafter referred as AnMBR. To minimize a hydraulic stress on the bioreactor, a novel hydraulic scheme was adopted from Ozgun et al. (2015), (Figs. 1 and 2A). The novelty was in using a side cross-flow membrane, while not disturbing the bioreactor by high flux necessary for proper membrane operation. This was achieved by using two interconnected circuits. The faster circuit for membrane was operated at a flux of 2,000 L/d resulting in cross-flow velocity of 0.2 m/s in membrane module (pump: Kouril PCD 283B). The slower circuit maintained the basic mass exchange; it transferred water from the top of the bioreactor to a fast circuit at ∼40 L/d (pump: Kouril PCD 83) and the retentate from fast circuit to the bottom of the bioreactor. This low pumping rate corresponds to 0.8 m/h of upflow velocity in the bioreactor, minimizing the hydraulic stress and excess mixing. The membrane module consisted of five PVDF tubular membranes from Norit (Pentair X-Flow F4385), of mean pore size 30 nm, given total area of 0.082 m2. The effluent was withdrawn using an external filtrate suction pump (Watson-Marlow 405 U/L2). Filtrate passed the membrane tubes from the inside out at flux of 4–5 LMH and transmembrane pressure (TMP) under 40 kPa (typically 10–20 kPa). The operation sequence was set at 28 min filtration and 2 min backwash. This was later changed to 14 and 1 min, respectively. The membrane was backwashed at double flux compared to the filtration period. Operation program written in LabVIEW (National Instruments) logged the data from three pressure transducers (68075-32; Cole-Parmer) and controlled the pump operation according to water level in the bioreactor.
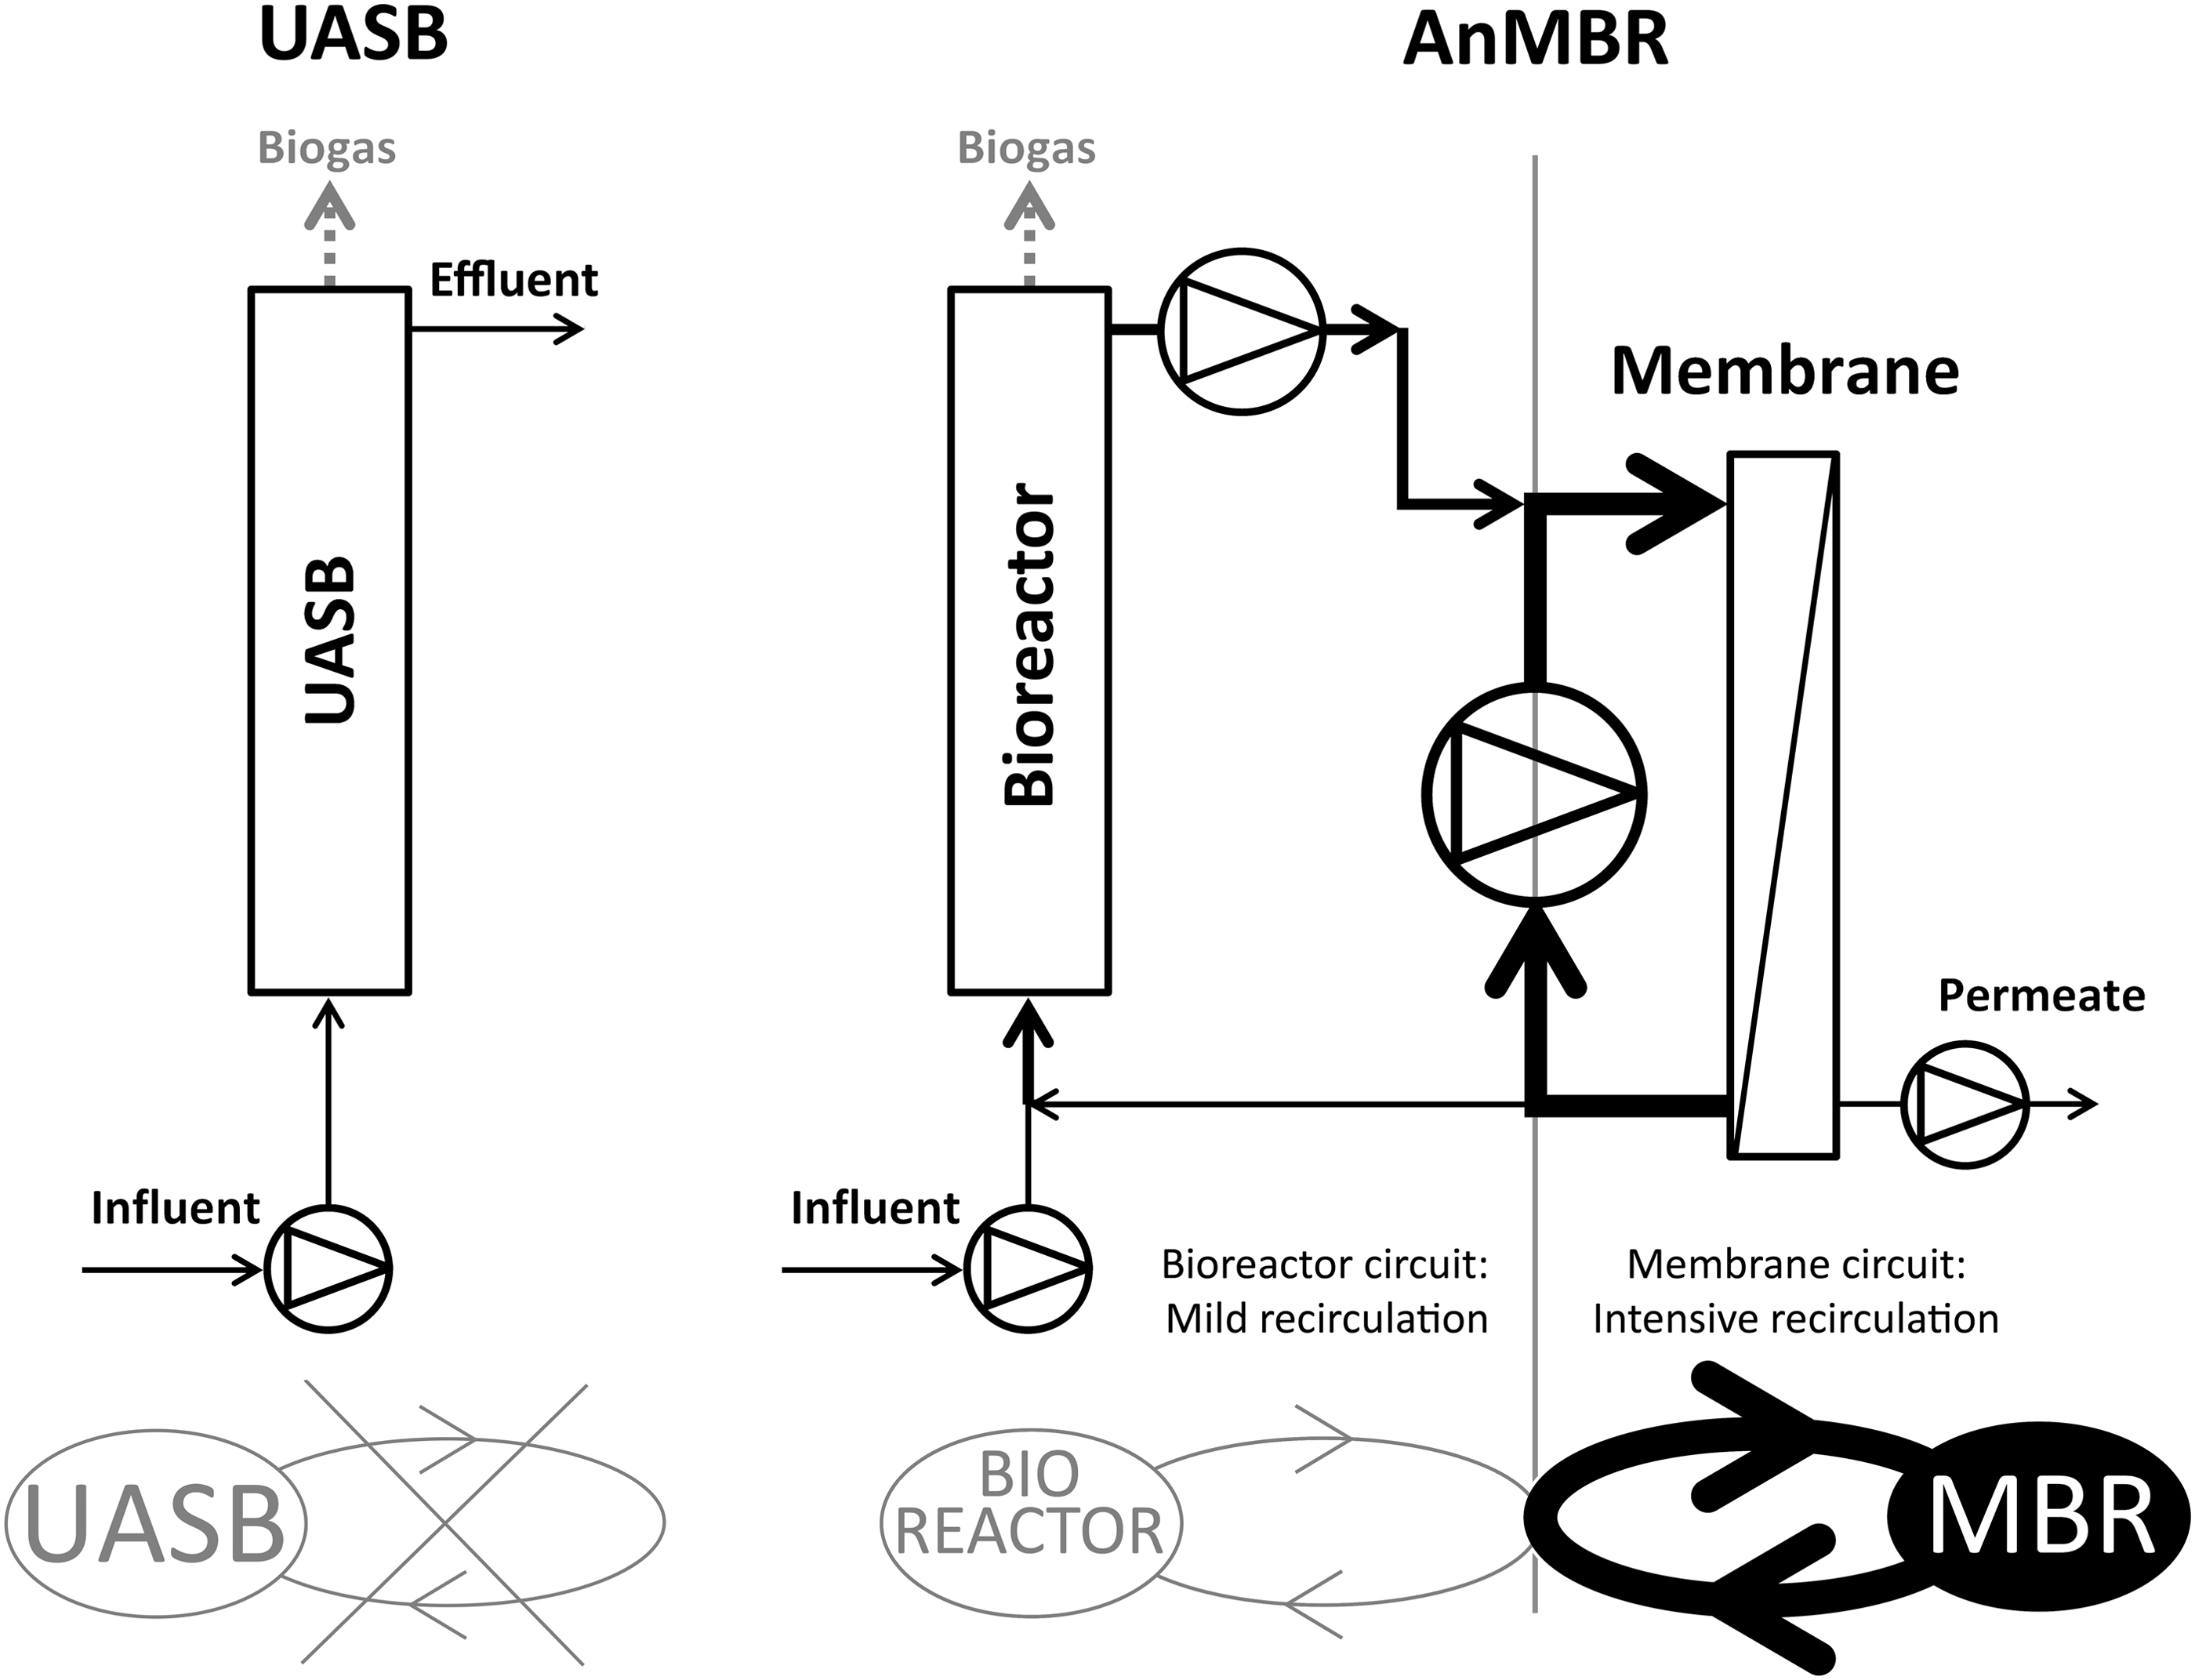
Scheme of UASB; novel AnMBR reactor scheme according to Ozgun et al. (2015) to control bioreactor sludge blanket upflow velocity and prevent deterioration by intensive sludge recirculation. AnMBR, anaerobic membrane bioreactor; UASB, upflow anaerobic sludge blanket.

As a consequence of the membrane addition, UASB upflow velocity increased from 0.1 m/h in UASB mode to 0.8 m/h in AnMBR mode. The up-flow speed increased to 1.4 m/h during backwash period. These values are low compared to the theoretical velocity of 40 m/h that would be achieved, if the membrane module was directly connected to the bioreactor.
Inoculum and wastewater treated
At the start, UASB was inoculated with 1 L of digested sludge from a full-scale mesophilic sludge digester operated at the wastewater treatment plant Ceska Lipa (48,000 PE, PE—population equivalent) (Table 1). The wastewater was collected every 7–12 days at a large municipal treatment plant. Half of the wastewater volume (∼35 L) was sieved through a 4 mm sieve and stored in a mixed container (A) in refrigerator at 6°C ± 3°C. The water was then continuously pumped from the fridge to the reactor. The rest of the wastewater in second container (∼35 L) (B) was meantime stored in another refrigerator. After emptying the mixed container (A), it (A) was refilled from the second container (B) after sieving.
Reactor sludge samples were taken from sampling port placed 21.5 cm above the reactor bottom.
COD, chemical oxygen demand; VSS, volatile suspended solids.
Concentration of the wastewater was rather high and its chemical oxygen demand consisted mostly from nondissolved forms (Table 2).
Wastewater was collected at the same site during the whole experiment run.
TAN, total ammonia nitrogen; VFA, volatile fatty acid.
COD decay in wastewater between collection and feeding to anaerobic reactor
As this study was not carried out on-site, the wastewater was subjected to up to 12-day long storage. To determine the decay of the wastewater between collection and consumption in anaerobic reactor, a kinetic test was performed (Fig. 3). Series “Reactor influent” simulates the normal storage pathway—samples were taken as normal reactor influent sample just before the reactor, meaning after pumping from the mixed container (A) in refrigerator. This container (A) was usually refilled two to three times (the discontinuous lines in Fig. 3) from the second closed nonmixed container (B). For comparison of mixing/nonmixing conditions impact, series “Standing storage” represents sampling from open and nonmixed 1 L bottle (C) standing at the same place as regard to previous sample (A). The wastewater in this bottle (C) was shaken only before sampling.
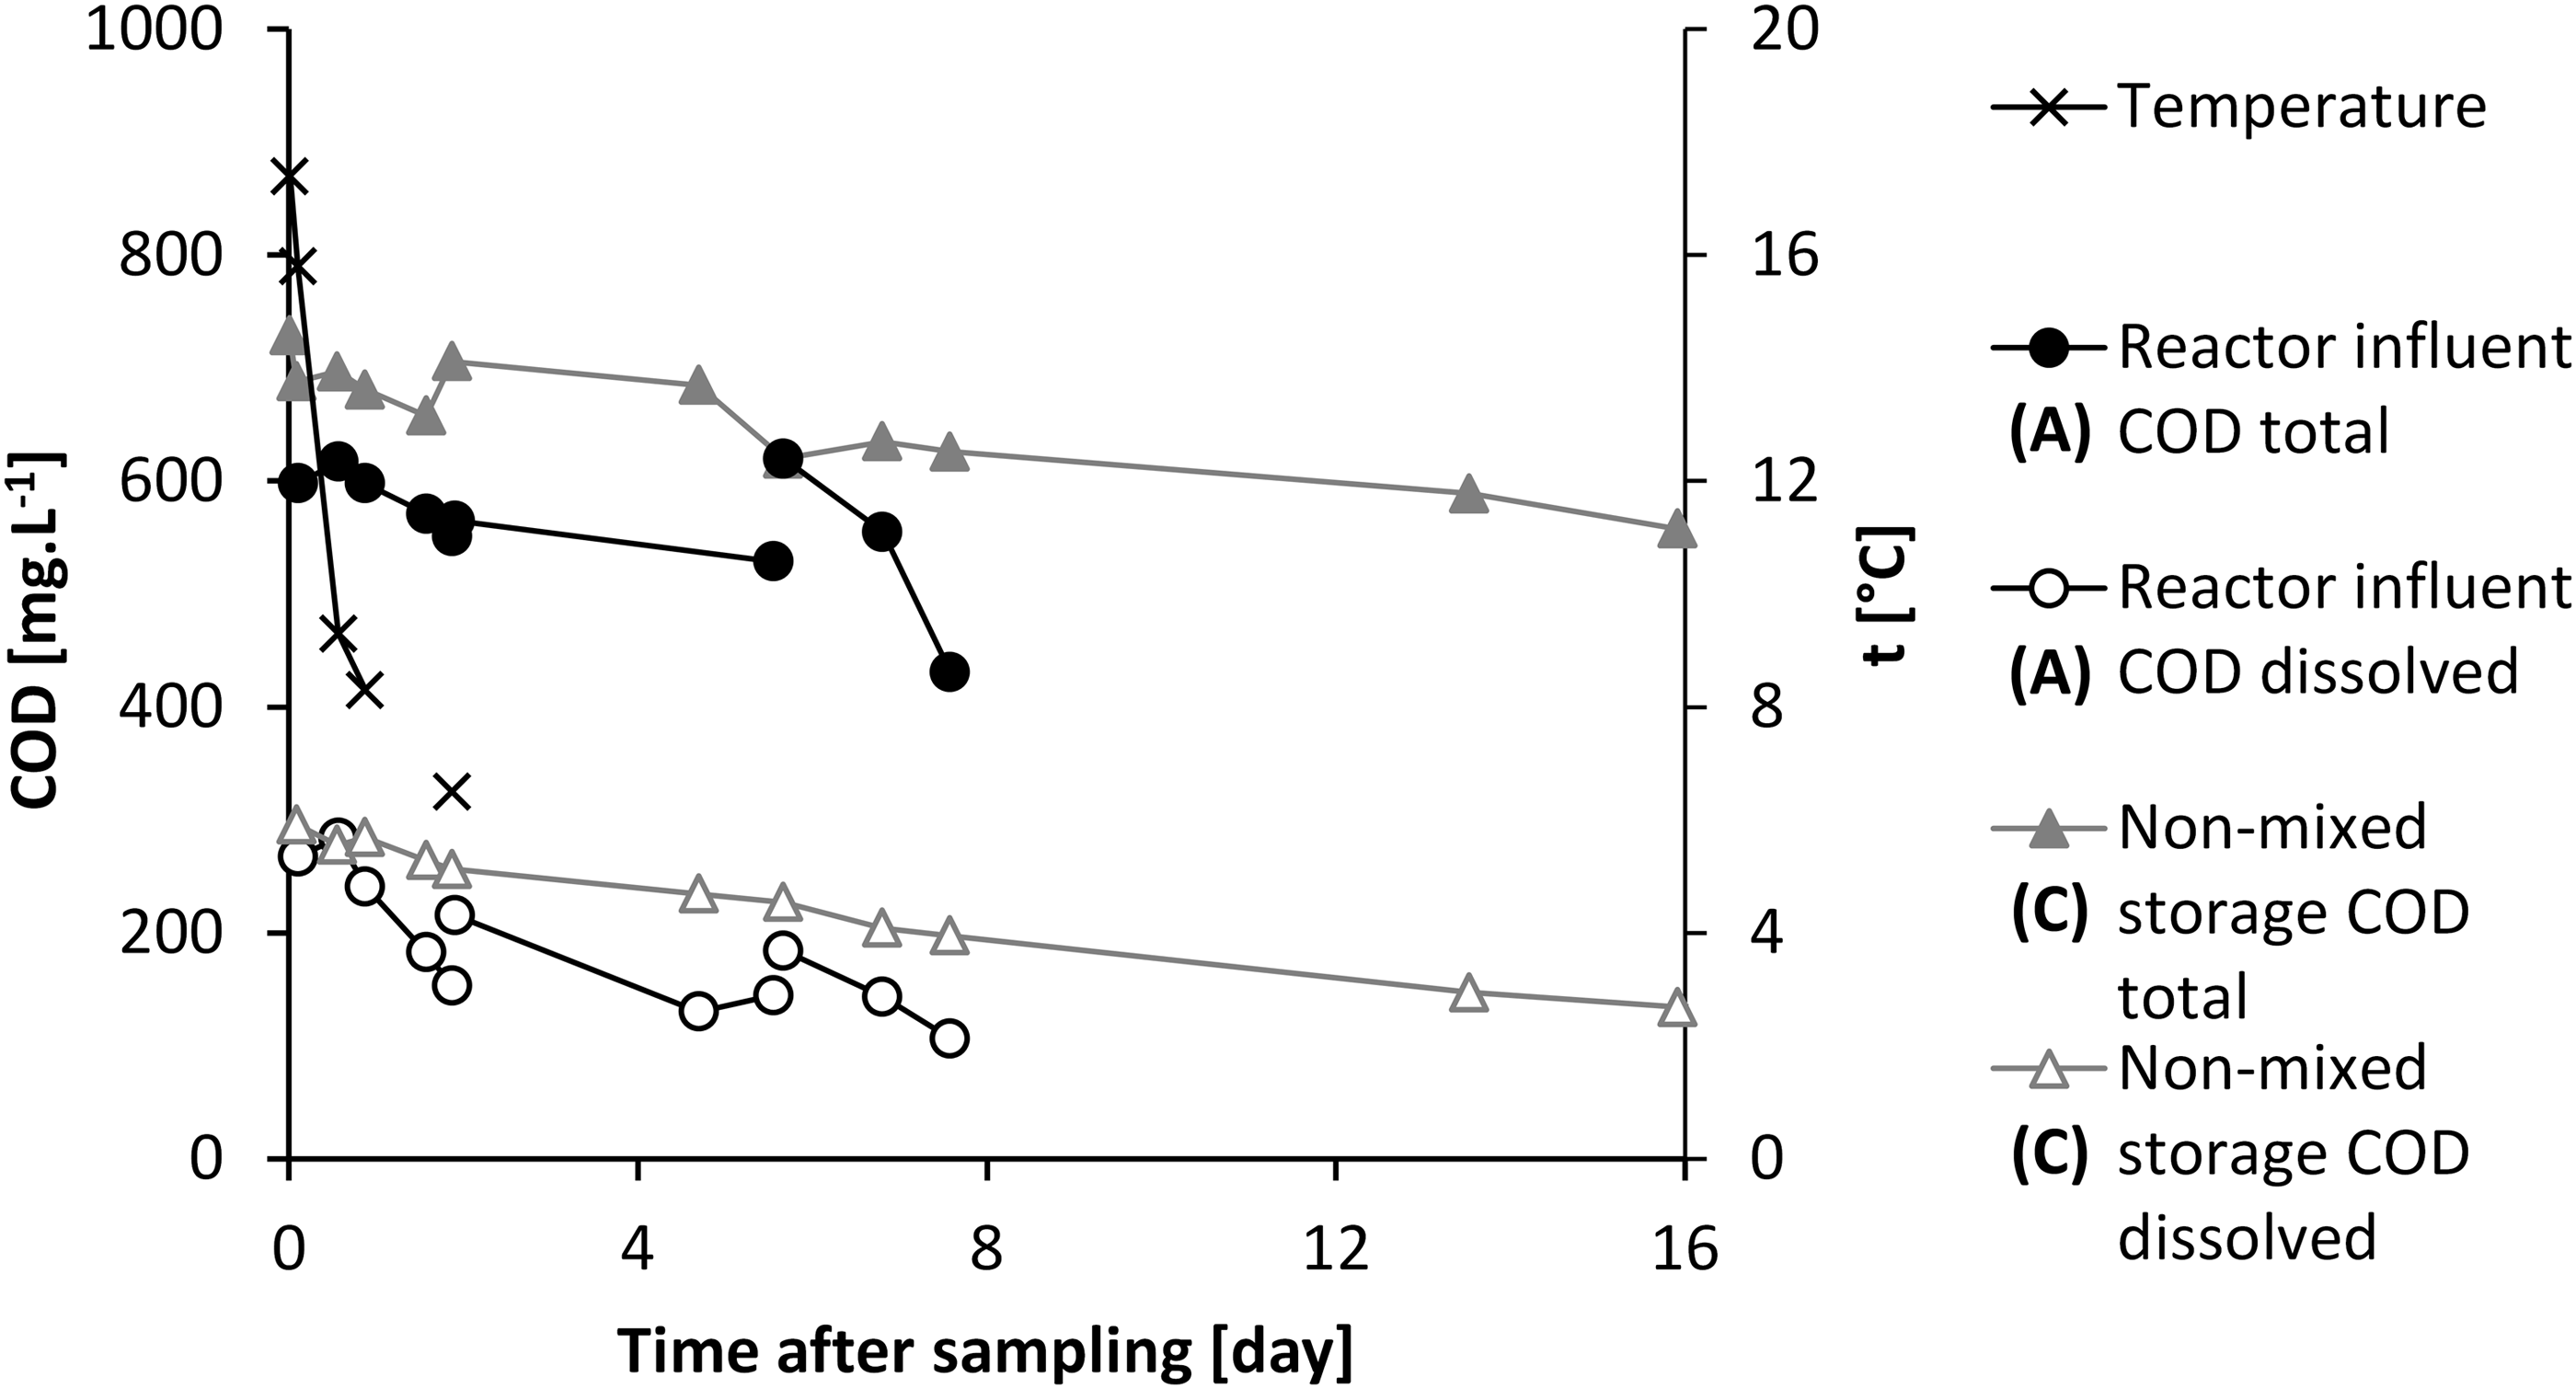
Study on chemical oxygen demand (COD) decay in the wastewater between collection and feeding to anaerobic reactor. “Reactor influent”
Sieving of the wastewater preserved 84% of total and 93% of dissolved COD (B→A). At the end of wastewater batch, 8 days after collection, the total and dissolved COD in mixed container (A) were 61% and 37% of the initial concentrations measured in 35 L barrel (B) 2 h after collection. Storage in open nonmixed flask (C) without sieving preserved 86% of total COD (initially sampled at collection site) and 67% of dissolved COD (sampled 2 h after collection) after 8 days. The greater decrease of the COD in the mixed tank (A) may be attributed to the following: (1) decay of wastewater enhanced by mixing and good sludge–wastewater contact; (2) slower cooling of tens of liters (B) of wastewater compared to 1 L in nonmixed flask (C); and (3) pumping from the bottom of the mixed container (A) may lead to preferential pumping of the heavier content in terms of density and COD concentration at the beginning of batch consumption. These results showed that the open mixed storage presents significant degradable COD loss that could have been utilized for biogas production. The storage in general acts as a pretreatment affecting the wastewater biodegradability and thus the treatment efficiencies and methane recovery rates. The results agree with previous work of Wang et al. (1995) as the anaerobic storage exerted the lowest COD degradation over time.
Operation of reactors
The UASB reactor was operated for 765 days. The initial phase (day 0–462) was characterized by continuous optimization of the laboratory setup—sewage storage, pump operation, prevention of sludge flotation, and improvements in biogas measurement. It is assumed that biomass was fully adapted to the low temperature after this period. The initial phase was followed by 226-day long (days 463–688) run at stable conditions (Fig. 4).

During the subsequent transition phase (689–764), the flow rate increased from 5.2 to 8.0 L/d and OLR doubled. This phase was not evaluated due to the little data and few accidental heat-ups of the system during membrane module installation.
Finally, the AnMBR setup was completed at day 765. The early AnMBR phase was again characterized by several optimizations and for the AnMBR, only the phase between days 836 and 884 was evaluated.
During the startup of AnMBR system, the daily flow slightly varied. Despite constant setting of the permeate pump, the resulting flow was partly determined by TMP. The flux was measured by rainfall data logger (Conrad Professional USB, WS-0101) starting at day 849.
Analytical methods
Point samples were taken from influent, effluent (permeate for AnMBR), and sludge bed once to twice a week. pH, CODtotal, CODdissolved, solids, and ammonium nitrogen were measured according to standard methods (Water Environmental Federation and American Public Health Association, 2005) for reactor run evaluation. The dissolved forms were measured from sample centrifuged for 10 min at 14,926 g on Sigma 3-16P (Sigma Laborzentrifugen GmbH). After the ultrafiltration membrane was incorporated, the effluent sample solids were completely dissolved. To quantify easily removable hydrogen sulfide, part of the permeate sample was aerated for 2 min and then measured as “COD aer” (Table 3). This method was adapted from the method previously published by Yoo et al. (2012). Biogas quality was tested on GC-TCD (CE Instruments GC 8000 Top) equipped with a packed column (using Porapak Q 80–100 mesh, Waters corporation).
COD aer.—effluent sample pretreated using 2-min aeration to strip out hydrogen sulfide-related COD.
Related to whole system volume of 2.8 L.
AnMBR, anaerobic membrane bioreactor; BDL, below detection limit; HRT, hydraulic retention time; OLR, organic loading rate.
Samples of volatile fatty acids (VFAs) were taken weekly from the influent, effluent, and sludge bed. The samples were centrifuged for 10 min at 14,926 g, filtered through filter paper and stored in 1.5 mL vials in refrigerator at −18°C. Before measurement, H3PO4 solution was added to maintain nondissociated forms (0.01 mL of 1:4 (V:V) H3PO4). The samples were measured on GC-2010 (Shimadzu) equipped with a flame ionization detector using Varian capillary column CP-Wax 58 (FFAP) CB of 25 m length with inner diameter 0.25 mm and film thickness 0.2 μm.
Results
Start-up of UASB reactor (days 0–462)
During the start-up period, good reactor performance was limited by several factors: (1) intermittent pumping during the first 228 days, (2) insufficient mixing conditions in wastewater storage during the first 141 days, (3) influent pipes of large diameter (263 days), and (4) leaks of biogas from reactor and tubing (443 days).
During this period, we observed growth of organic nitrogen hydrolysis. At the beginning of the experiment, the concentrations were equal. After 80 days, the effluent total ammonium nitrogen exceeded the influent value by 13%, showing a significant increase in the hydrolysis activity.
Stable operation of UASB reactor (days 463–688)
The UASB phase was characterized by COD removal efficiency most often between 60% and 75% (Fig. 3), with average efficiency 64% ± 13% (Table 3). The main mechanism was the removal of particulate COD (79% ± 13%) and corresponding removal of total suspended solids TSS (78% ± 19%) (Fig. 4). Only part (4%) of COD was converted into gaseous methane (Fig. 5), which equals to 7% gasification of COD removed (i.e., 0.024 m3 CH4/kg COD removed). The particulate and dissolved solids formed 41% ± 15% and 59% ± 15% of total effluent COD. Sulfide and VFA formed 24% ± 7% and 11% ± 5% of the total effluent COD, respectively. Although we had only two data points for sulfide concentration during this period, the amount agrees with data from the following transition period (689–765, seven points), when the sulfide sulfur was 23 ± 7 mg/L accounting for 25% ± 10% of effluent COD concentration. Dissolved COD concentrations decreased from average 124 ± 52 mg/L in the influent to 102 ± 28 mg/L in the effluent. Hydrolysis of organic matter resulted in the release of nitrogen originally present in organic compounds. Total ammonia nitrogen concentration in the effluent was 23% ± 10% higher than in the influent, which corresponds to the increase from 42 ± 6 to 51 ± 6 mg/L. These concentrations did not pose a risk for ammonia toxicity as the highest detected pH was of 8.4 (day 72) and the highest total ammonia nitrogen was 90 mg/L (day 46). These values could at 15°C lead to maximum free ammonia concentration of 5 mg/L (Liao and Mayo, 1972), which is significantly lower than the inhibiting concentrations reported for anaerobic biomass (Yenigün and Demirel, 2013).
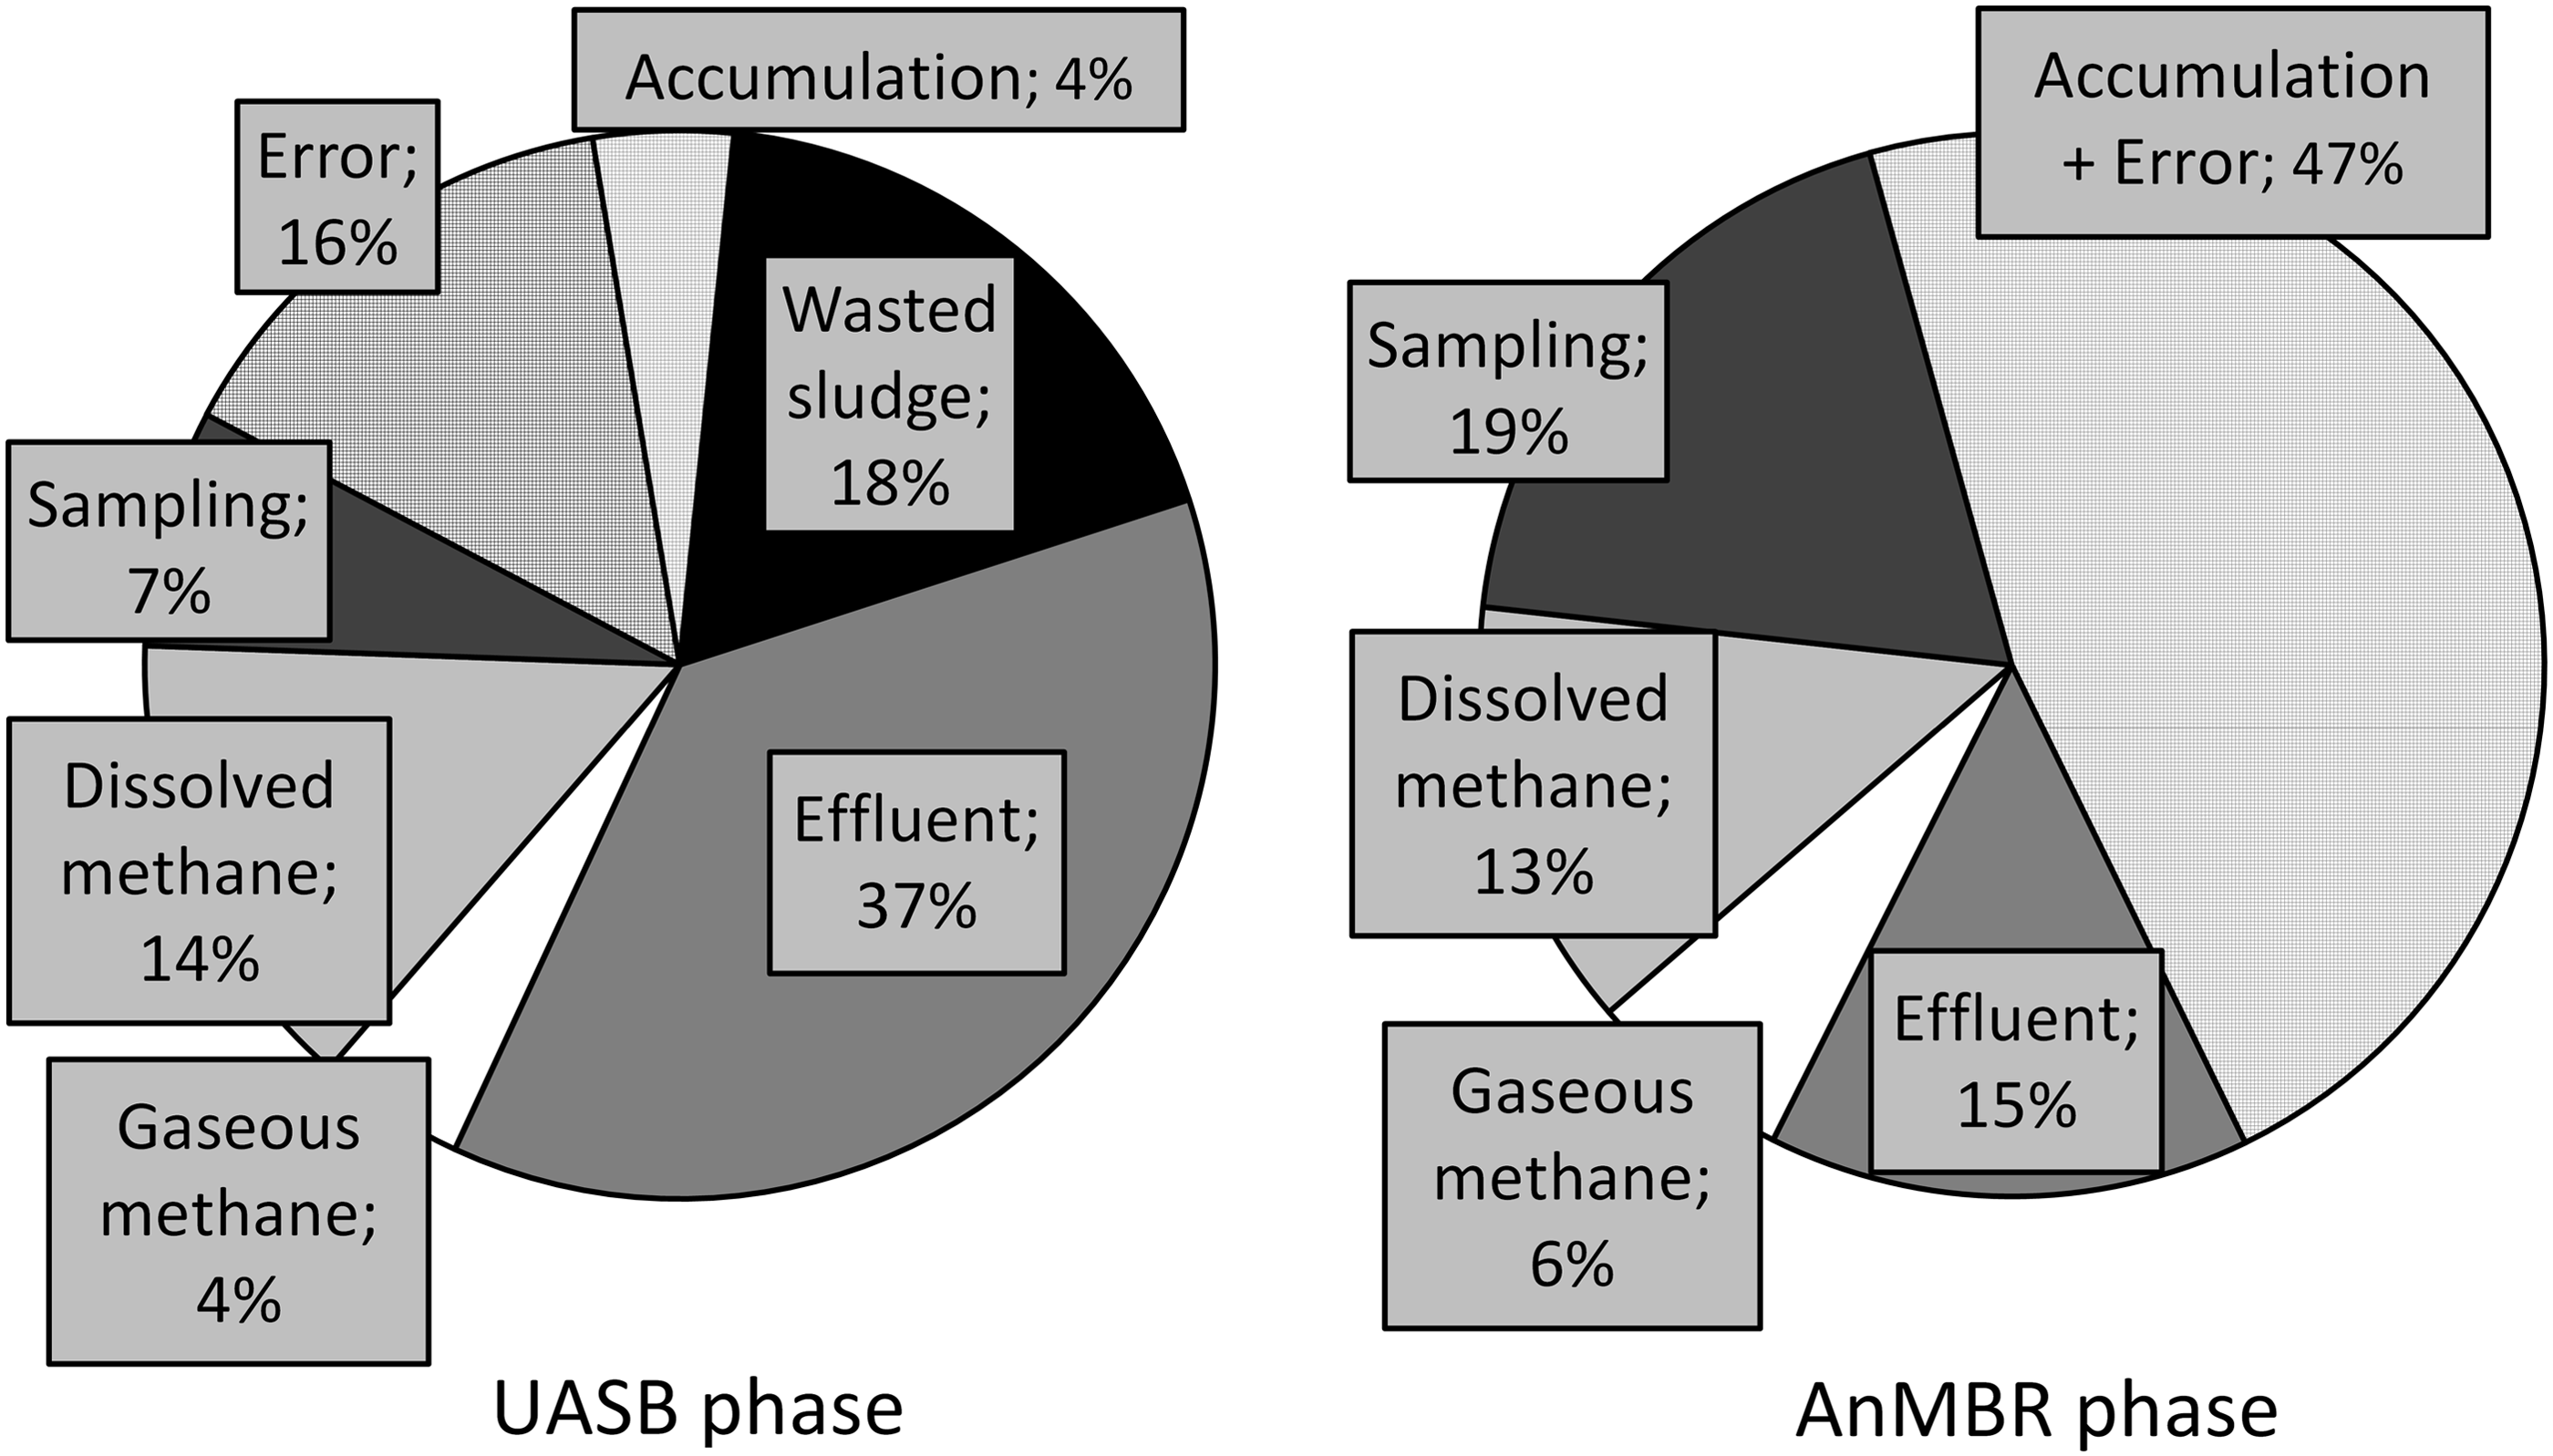
Mass balance of COD in the UASB reactor (days 463–688) and later AnMBR (days 836–884). The 100% for both balances is the influent COD mass.
Daily biogas production was 100 ± 40 mL standard temperature and pressure, 0°C, 101 325 Pa (STP). Biogas contained 63% ± 17% of CH4, 3% ± 2% of CO2, and 34% ± 18% of nitrogen, assumed to be stripped out from the wastewater.
Occasional sludge flotation was observed, but the floating sludge was captured by the brush installed in the upper part of the UASB reactor. Flotation occurred mainly after temporary influent pumping interruption and subsequent restart, or in the case of overloading. The sludge plug was always mixed and it usually settled down with no difficulties after the release of biogas bubbles. Channeling in the sludge bed also did not increase the efficiency of COD removal.
Vertical stratification of UASB sludge bed
Stratification was measured on day 702. UASB sludge bed analyses showed significant stratification over the height of the sludge blanket (Fig. 6). Generally, the concentration of COD, solids, and VFAs decreased with increasing sludge bed height. The sludge at the bottom of the reactor was very viscous (Fig. 2B), indicating the presence of greater amount of extracellular polymeric compounds. The high concentration of dissolved COD (645, 705 mg/L) at the bottom (6, 11.5 cm) of the reactor indicates the hydrolysis of organic matter.
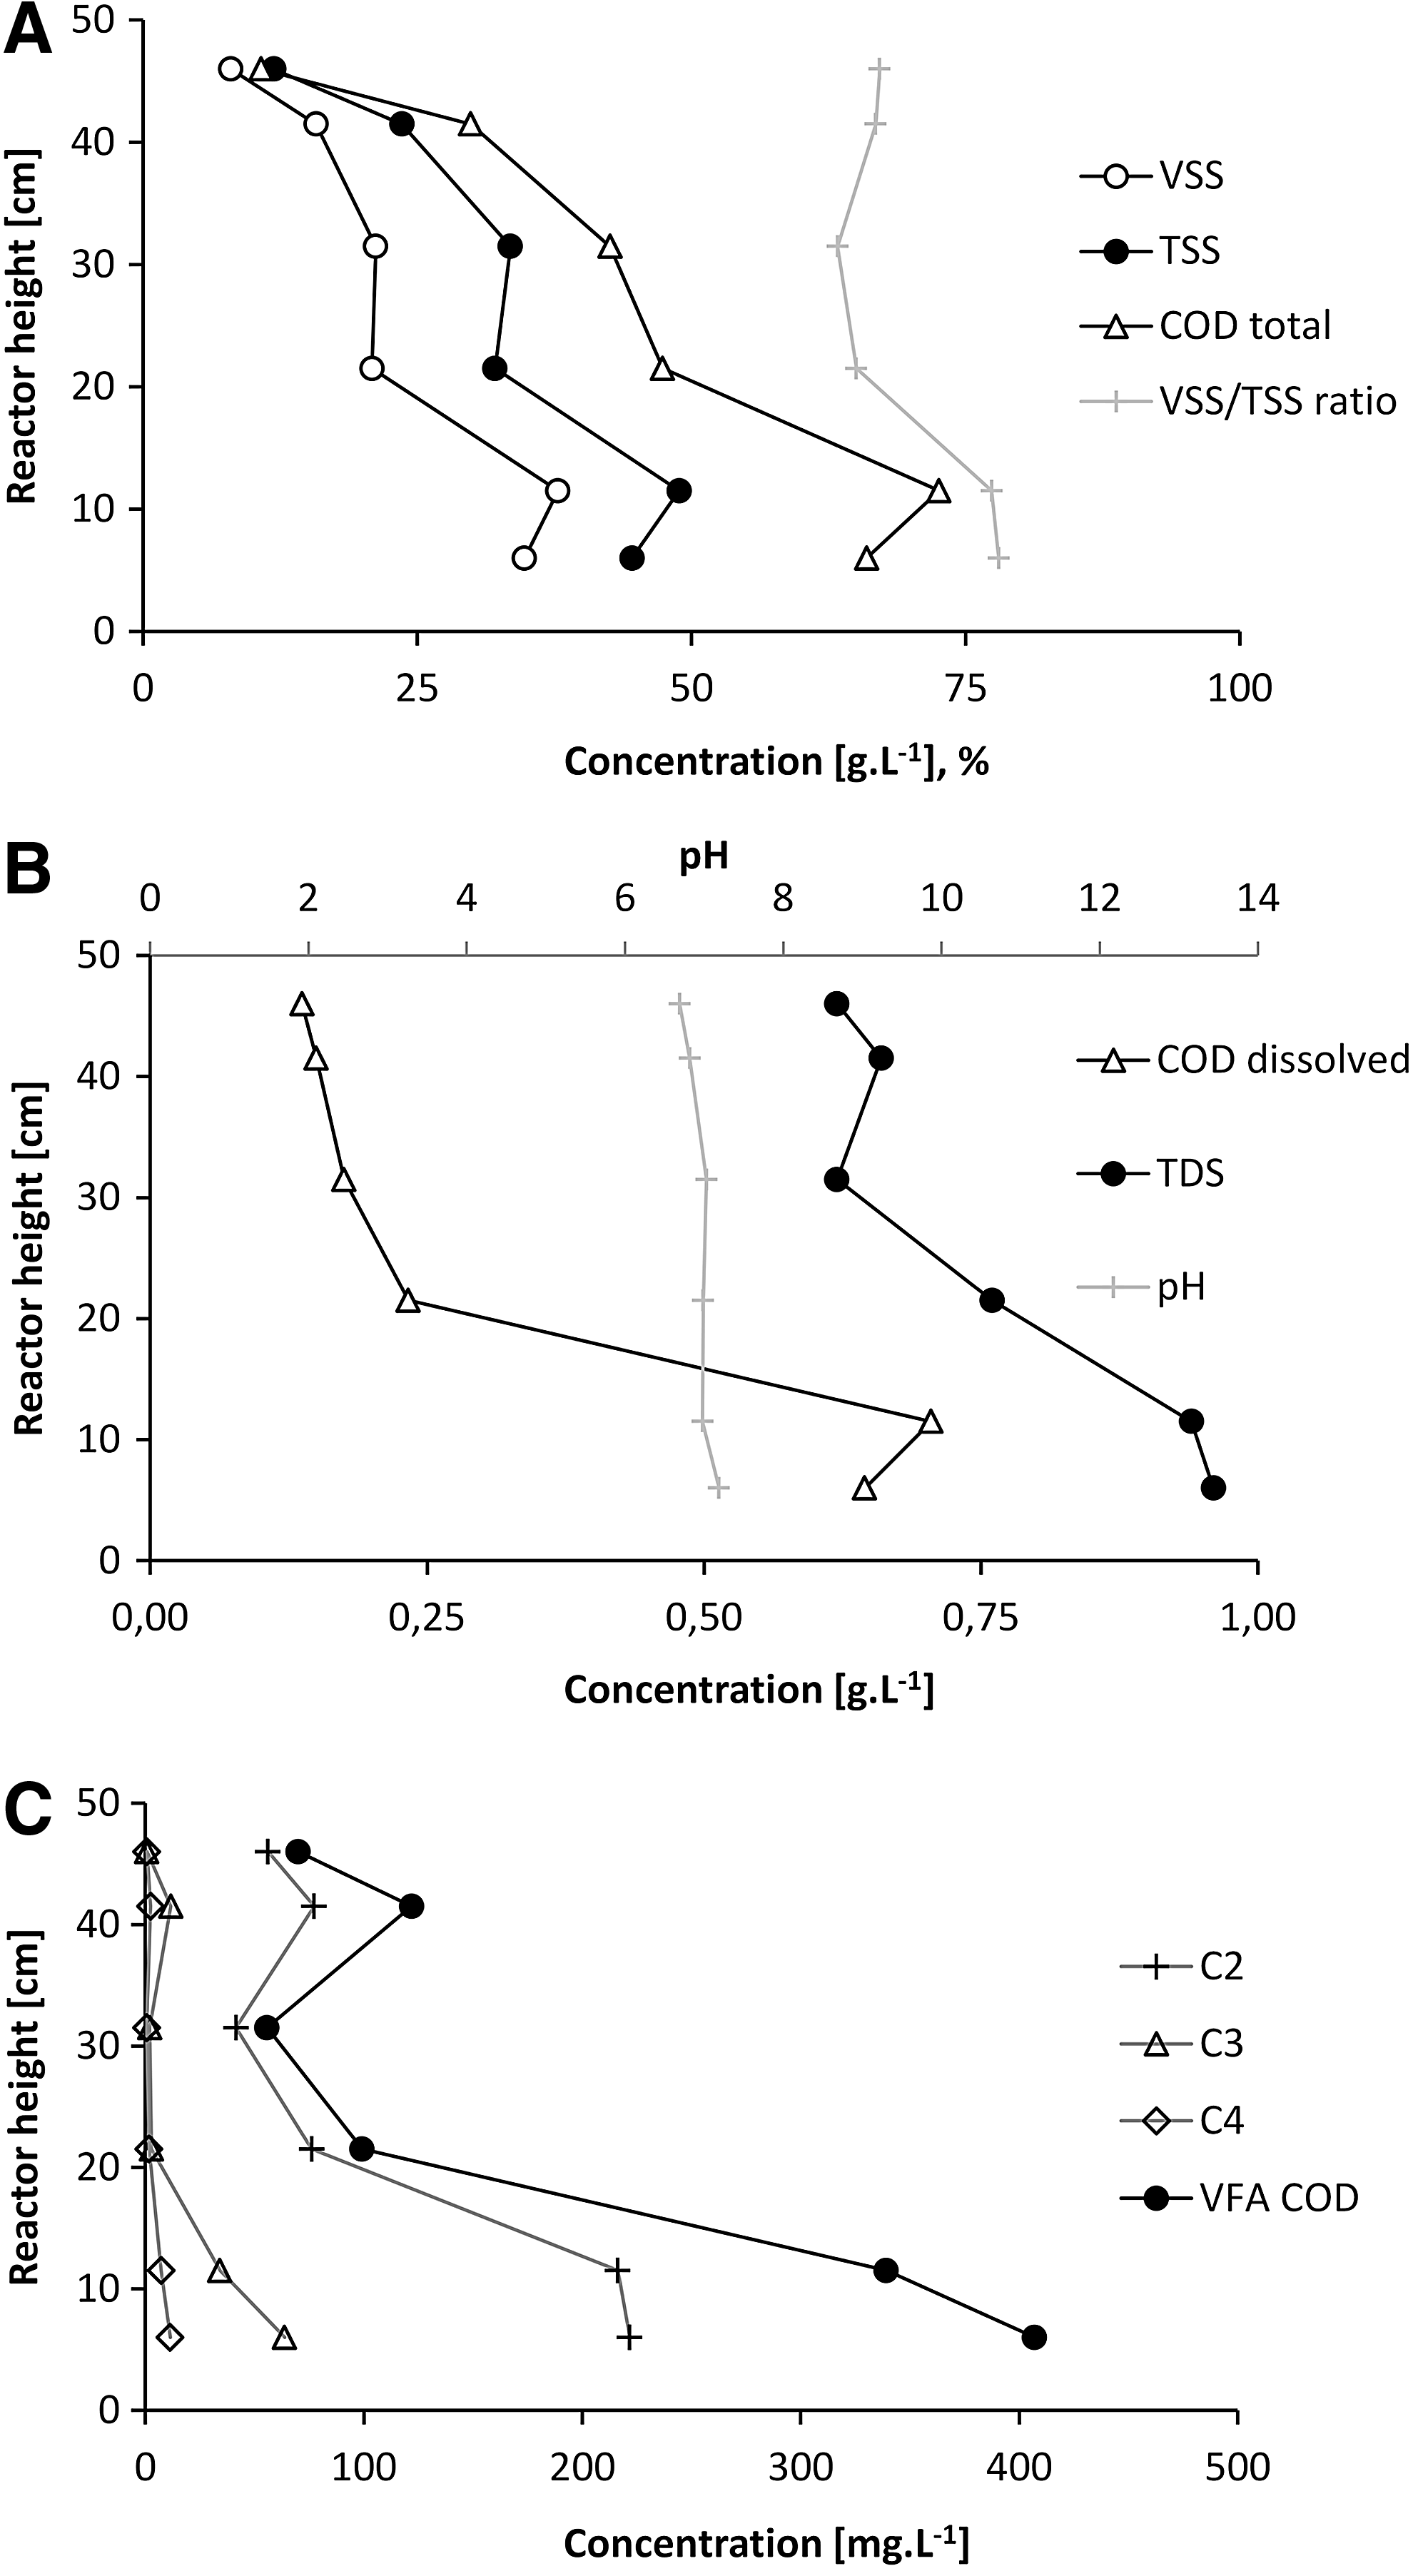
Vertical profile in sludge bed of UASB (day 702):
Transition from UASB to AnMBR (days 689–835)
At the final period of UASB operation, HRT gradually decreased to 6 h during days 689–700. Subsequently, the total COD of wastewater increased to 659 ± 103 mg/L (days 700–765) compared to previous 527 ± 129 mg/L (days 463–688). Both changes led to an increased OLR of 2.8 ± 0.4 g/[L·d] (days 700–765). The overall COD removal reached up to 75% ± 4% (five data points) between days 700 and 717.
The first 70 days of AnMBR operation were characterized by shock loading of the system and subsequent recovery period. The system volume instantly expanded by 47% due to membrane installation. As volatile suspended solids concentration in membrane compartment started to grow at the start of AnMBR operation, sludge had to be discharged from the bioreactor at double rate compared to the previous period. The overall TSS concentration in the cross-flow circuit varied greatly between 0.2 and 7.1 g/L with a median of 2.8 g/L. The structure of sludge changed, no longer enabling to determine the sludge bed top borderline, thus, the sludge height measurement was stopped (Fig. 4B).
During the last period of UASB operation, the sludge concentration was maintained as high as 28 ± 10 g TSS/L (days 700–765), but after transition to AnMBR, it decreased to 11 ± 5 g TSS/L (days 774–799) because sludge was partly wasted and also redistributed over the whole setup. The concentration of dissolved COD in the membrane module also grew during the first AnMBR phase and the effluent COD concentration increased to 198 ± 53 mg/L. It should be noted that soluble COD in the retentate was much higher (e.g., 697 mg/L at day 785). COD concentrations in the effluent temporarily reached the level of previous UASB stage, but all COD was dissolved. A significant part of COD consisted of sulfide (up to 42% ± 8%) and VFA (21% ± 10%). The rest was assumed to be soluble microbial products. With advancing accumulation of sludge, COD removal efficiency grew from 70% to 85% after the first 70 days of AnMBR operation.
Stable operation of AnMBR (days 836–884)
The use of membrane in the AnMBR stabilized the quality of the effluent. Within the evaluated period, effluent COD was 93 ± 22 mg/L (Table 3). The presence of membrane ensured solids-free effluent. A significant part of effluent COD was still formed by dissolved sulfide (56% ± 24%), which corresponds to 48 ± 15 mg COD/L. During the evaluated period, the mean TSS concentration in the reactor remained 24 ± 3 g/L, while in the retentate it varied between 0.7 and 9.7 g/L, indicating not complete sludge structure change.
Biogas was produced in daily amount of 130 ± 60 mL STP. Its methane content was 64% ± 2%. Energy recovery increased to 6%.
Dissolved gases in effluent
Dissolution of gases was significant due to the lower temperatures and greater flows of wastewater through the reactor compared to mesophilic sludge digesters. That dissolution had two effects: (1) decreased amount of gaseous methane production—only 4% of input COD (∼14 mL CH4/g COD or 0.6 m3 CH4/[PE·y] and (2) as CO2 is relatively well soluble in water, it was nearly completely dissolved in the effluent resulting in high concentrations of methane in biogas. For the UASB period, the concentration of methane reached (63% ± 17%) and membrane addition did not change this concentration. Based on the Henry's law, up to 14% and 13% of influent COD could leave the UASB and AnMBR, respectively, as dissolved methane. The missing 20–30% can be accounted to nitrogen originally dissolved in wastewater and afterward stripped out from the wastewater by produced biogas.
Discussion
UASB reactor can be recommended for wastewater pretreatment
Generally, the UASB performed as expected from the literature data (Table 4) as it reached COD removal 60–75% at psychrophilic temperatures and OLRs between 1 and 3 g COD/[L·d]. COD removal was positively influenced by high particulate content in the influent wastewater (Zhang et al., 2013). The UASB was operated at low upflow velocity of 0.1 m/h and occasional channeling was observed. Such a low velocity enhanced separation of fine particles, but on the other hand limited the mixing of reactor content and substrate–biomass contact necessary for maintaining the biological activity (Lettinga et al., 2001). Furthermore, low mixing rate in the reactor led to occasional sludge flotation and washout, and prevented stable performance on suspended solids removal. The effluent total COD concentration of 180 ± 59 mg/L did not meet European discharge limits. The 41% ± 15% share of particulate COD in the effluent can be problematic to subsequent posttreatment. To be able to benefit from the advantages of this low energy input wastewater pretreatment, a novel scheme should be proposed as mentioned by Zhang et al. (2013), that is, the UASB reactor should be followed by aerobic posttreatment to remove remaining COD and sulfide. After this posttreatment, wastewater would have low-enough C/N ratio to be passed to autotrophic nitrogen removal. Thereafter, the effluent from autotrophic nitrogen removal will probably meet the discharge limits for COD/BOD5. The sludge produced in the intermediate aerobic step should be digested to enhance the energy balance of the system.
Calculated based on influent concentration and COD removal efficiency.
Calculated based on methane yield Nm3 CH4 per kg COD removed and COD removal efficiency.
SAF-MBR, staged anaerobic fluidized bed membrane bioreactor; AFBR–anaerobic fluidized bed bioreactor.
Calculated as OLR = COD IN/HRT from data supplied; MF—microfiltration, UF—ultrafiltration.
AFMBR, anaerobic fluidized bed membrane bioreactor; TMP, transmembrane pressure.
The increased COD removal rate during the transition from UASB to AnMBR was related to an increased organic loading and influent COD concentrations. Same trends are also reported in literature (Mahmoud et al., 2003).
The effluent COD and achieved energy recovery indicate the UASB reactor being rather an energy-saving pretreatment step than an integrated solution for wastewater treatment.
AnMBR reactor enhanced COD removal, but increased energy consumption
High COD removal efficiency (up to 85%) achieved in the AnMBR represents competitive technology to aerobic treatment pathways. When stable AnMBR operation was achieved (since day 836), high effluent quality (COD below 100 mg/L) shows the advantage of membrane addition to a simple UASB reactor. The effluent COD concentration was reduced to 50% and exerted significantly smaller quality variation. Notable part—56% ± 14%—of the effluent COD consisted of sulfide, which can be easily removed aerobically at short HRT, for example, using a biofilter. These effluent COD concentrations are comparable with 100–125 mg/L achieved by Gouveia et al. (2015), treating municipal wastewater at 18°C. Ozgun et al. (2015) reported the decrease of COD effluent concentration from 149 to 42 mg/L when a membrane module has been attached to the original UASB reactor. In this context, we polished the effluent from about 50% due to the membrane action, but treating raw wastewater and mainly at lower temperature (15°C vs. 25°C). The ability of AnMBR to capture dissolved COD from about 70% allows the system perform better resulting in both the higher methane yield and higher COD removal efficiencies.
By adopting the configuration proposed by Ozgun et al. (2015) (Fig. 1), we were able to limit sludge–membrane contact; however, changes in sludge structure took place. During the AnMBR operation, TSS in the membrane recycle achieved only ∼13% (3.2 ± 3 g/L) of the reactor TSS (24 ± 3 g/L), indicating that very slow change in sludge bed structure occurred. Retaining most of the solids in reactor gives a significant advantage over CSTR AnMBR configurations. Significant changes of sludge physical properties were also observed by Ozgun et al. (2015). These are believed to be associated with the disruption of selective pressure due to the membrane addition and partial mixing as a consequence of high cross-flow membrane circuit flux.
The amount of influent COD transformed into gaseous methane (6%) in the AnMBR implied very low energy recovery compared to typical 27% of conventional sludge stabilization (Cornel et al., 2011). However, AnMBR still may be less energy intensive than the activated sludge process because energy produced in conventional systems is fully utilized to propel the energy intensive aerobic treatment, resulting in net energy consumption. The biogas quality was stable and even a small amount produced represents a chemical energy recovery potential as the gas fuel to be used on-site.
Comparing AnMBR and UASB reactor
COD concentration in the AnMBR effluent was significantly lower compared with the UASB. The main advantage of AnMBR over UASB is the complete elimination of the risk of biomass washout. Anaerobic biomass and particulate organic matter from wastewater were completely retained in the system, resulting in completely solids-free effluent. In addition, due to the effect of ultrafiltration membrane, significant part of dissolved COD fraction was retained in the bioreactor. VFA concentration in the effluent remained almost unchanged (data not shown) since the VFA can easily pass the membrane. We also observed slightly yellowish, but transparent color of the AnMBR effluent compared to the colorless or slightly turbid effluent of UASB. This could be explained by the presence of polysulfides in the AnMBR effluent, but no data or literature support for this claim is available. The absolute separation of solids, while preserving nutrients, is of great interest for possible nutrient recovery/reuse (Batstone et al., 2015).
The price to pay for better COD removal in the AnMBR was the energy and chemicals spent on membrane fouling control as reported by other researchers (Seib et al., 2016). It has been reported that the energy consumption of AnMBR can be higher than the consumption of conventional activated sludge systems (Smith et al., 2014). Our system produced 130 mL of biogas of average 64% methane content; so the available electricity production with common 36% electrical efficiency of combined heat–power unit will be probably close to 0.02 W, while the continuously operated cross-flow pump used ∼30 W. This is where the AnMBR reactor design should be balanced between the effluent quality and related energy requirements. New approaches for fouling control using fluidized granular activated carbon are giving very promising results in terms of future self-sufficiency even with cross-flow configuration at very small cross-flow velocities (Table 4) (Shin et al., 2014; Seib et al., 2016). This approach is supported also by Jeison et al. (2009)—the increase of cross-flow velocity and related shear stress may not only increase the operational costs and temporarily reduce the fouling but can also lead to sludge particle breakdown and consequent membrane fouling.
On the other hand, effluent COD of the AnMBR needs posttreatment as well as the UASB effluent to meet most of European legislation limits. In that case, the effluent quality stability is no longer of such importance. Significantly lower energy demands of UASB reactor can offset higher AnMBR treatment efficiency and energy recovery.
COD balance showed low energy recovery at 15°C for both reactors
COD balance was calculated for both UASB and AnMBR (Fig. 5). In the UASB reactor, COD was retained in the sludge bed and later was withdrawn from the system either as wasted sludge or by sampling. The gaseous methane share was only 4% of the influent COD. Based on Henry's law (63% methane in headspace, 100 kPa pressure + 5 kPa for GLS separator), dissolved methane formed ∼14% of the influent COD.
During AnMBR operation, both soluble and suspended COD was retained in the reactor and up to 6% of it was converted into gaseous methane. Finally, most of COD was withdrawn from the reactor as wasted sludge. The membrane completely retained suspended COD, resulting in significantly lower effluent COD in the AnMBR compared to the UASB reactor.
Challenges in mainstream anaerobic digestion application
The degree of methanization in both systems (4% and 6%) was much lower than 12.5% of Zhang et al. (2013) at the early stage of their experiment. Later, these authors achieved up to 24.4% using higher sludge recirculation rate between UASB and mesophilic sludge digester. Up to 19% conversion of influent COD was reported for a single UASB reactor and 42% for UASB reactor of UASB-Digester system (Mahmoud et al., 2004). However, these authors also took dissolved methane into account. In that case, this work could achieve up to 19% methanization.
Dissolved methane is a big problem of psychrophilic anaerobic digestion because it decreases energy recovery and it means significant release of greenhouse gases into atmosphere. Indeed, up to 14% of COD release as dissolved methane is of environmental concern. Taking into account the average daily production of COD 120 g per PE (Kroiss and Cao, 2014), 14% means the annual release of 1.5 kg of methane, that is, ∼30 kg of CO2 equivalent (Lelieveld et al., 1998). This amount would make up to 0.3% of the total CO2 production per capita per year in the Czech Republic (Hertwich and Peters, 2009). The emissions of methane are considerably high in contrast to the current total (emissions + energy related emissions) emissions of 14 kg of CO2 per PE per year at Central Prague wastewater treatment plant (Prague Water Supply and Sewerage Company, 2012). Only the utilization of the dissolved methane would justify the use of cold anaerobic digestion as it is an intensive greenhouse gas-emitting process.
For areas of less stringent discharge limits, milder winter conditions and influent quality variations, we suggest using conventional UASB with aerobic posttreatment. For more demanding conditions in terms of influent quality variations, severe winter conditions and stringent discharge limits, we suggest using AnMBR system with very low effluent COD/BOD5 concentrations. The use of granular activated carbon fluidized bed reactors can even enable attached growth of biomass and thus splitting solids retention time (SRT) of biomass and SRT of residual solids from wastewater, so that these solids could be treated under different conditions or just withdrawn from the system (Shin et al., 2014). Using properly operated AnMBRs for low-strength wastewater under the severe conditions at state of the art will lead to high quality from reliable technology effluent, but for the higher energy costs. The approaches to low energy fouling control are subjected to intensive research, but more work has to be done to lead the outcomes to practical applications.
It should be noted that mainstream Anammox process is ready for full-scale application, but the necessary nitritation step is a subject of intensive research. Thus, autotrophic nitrogen removal, although mentioned in this work, is not yet prepared for full-scale mainstream installation (De Clippeleir et al., 2013).
Summaries
Based on our data, UASB reactors are more suitable for wastewater pretreatment under low temperature (15°C) in European region compared to AnMBRs. This is mainly due to their lower energy demand. Even though the AnMBR achieved better COD removal efficiency than the UASB (85 compared to 65%, respectively), the effluent of both AnMBR and UASB reactor must further be posttreated to fulfill European discharge standards. The energy recovery in the form of gaseous methane was very limited, but the energy demand for COD removal in the UASB reactor was significantly smaller than is necessary in activated sludge systems.
Footnotes
Acknowledgment
This research was supported by Technology agency of the Czech Republic (Grant No. TH01021100).
Author Disclosure Statement
Mr. J.B. reports grants from Technology agency of Czech Republic; no other competing financial interests exist.