
Abstract
Abstract
In this study, an optimization programming based on inexact stochastic method and factorial design was proposed to support management of energy and environmental systems under uncertain conditions. It could be used for analyzing various policy scenarios associated with different levels of economic penalties when promised targets are violated. Moreover, it can obtain optimal decisions of primary energy supply, electricity, and thermal power generation, capacity expansion, and emission control scheme. The developed model has been applied to a case study within a multifacility, multiperiod, and multidemand-level context to demonstrate the feasibility of the proposed methodology. Factorial method has been used for sensitivity analysis to address the interactive uncertainties in modeling parameters, as well as providing a trade-off analysis between the economic objective and the relevant energy and environmental policies. The generated approach will be able to reflect dynamic complexities in energy and environmental systems under social–economic–environmental requirements. It is helpful for adjusting the interrelationship among conflicting economic objectives and environmental benefits under multiple uncertainties, formulating allocation patterns of energy resources and services, and identifying the effectiveness of current regulations.
Introduction
E
However, the issues related to energy activities are complicated due to the existence of uncertain factors, dynamic conditions, and component interaction of energy systems. Such complexities intensify the difficulties in identifying trade-offs between economic objectives and environmental benefits. Also, pollution-related processes are not well acknowledged and reflected. Therefore, it obliges researchers to develop effective tools based on systems analysis methodology for supporting the planning of energy and environmental systems under uncertainty.
Previously, research efforts were made on studying various uncertainties and complexities in energy systems management (Dupačová et al., 1991; Martin, 1995; Huang and Loucks, 2000; Seifi and Hipel, 2001; Maqsood et al., 2005; Cai et al., 2009, 2011a, 2011b; Li et al., 2011; Canizes et al., 2012; Shen et al., 2012; Suo et al., 2013; Zhu et al., 2013; Zhang and Huang, 2014; Liu et al., 2015b). Among them, methods based on inexact stochastic programming were widely explored to address uncertain and dynamic complexities existing in a variety of energy system components.
For example, Lv et al. (2011) provided a two-stage inexact joint-probabilistic optimization method for regional air quality management system with multiple pollutants and sources. The uncertainties were expressed as probability distributions and interval values. The method could not only examine the risk of violating joint-probability constraints but also account for economic penalties as corrective measures against any infeasibility. Zhou et al. (2013b) proposed a two-stage stochastic programming model for the optimal design of distributed energy systems under uncertain energy demands and supplies, where the difference between stochastic design and deterministic approach was addressed. Overall, these methods are efficacious to handle uncertain data, and analysis of multiple scenarios is desired. In particular, decision should be made before uncertain information is revealed, whereas the second-stage one is to adapt to the previous decision based on further information.
However, in energy management systems, many uncertain modeling parameters are interrelated to each other, the previous optimization methods can merely handle interactive relationships among decision variables. Therefore, the objective of this study is to develop a factorial based stochastic optimization approach for energy and environmental systems management under uncertainty.
The proposed approach will be able to reflect dynamic complexities in terms of power generation scheduling, facility-capacity expansion planning, and air pollution control. Factorial analysis will be undertaken to address the interactive uncertainties in modeling parameters and reveal their interactive effects on the system objective and relevant energy and environmental policies; such an analysis will strongly facilitate the study of combined effects from two or more impact factors on system response (Lewis and Dean, 2001; Qin et al., 2008; Onsekizoglu et al., 2010; Wang et al., 2013). A case study will then be presented to demonstrate the effectiveness of the developed method. The results will be helpful for adjusting the interrelationship among conflicting economic objectives and environmental benefits under multiple uncertainties.
Factorial Based Stochastic Optimization Method
Inexact stochastic programming
Basic emission reduction facilities of a power plant could deal with certain amount of contaminants according to the environmental policy. The treatment cost during this period is relatively lower. However, various factors, such as the debased energy supply or the upgraded emission standard, could lead to excess emissions. The operating cost for excessive contaminants is relatively higher. If the basic reduction facilities could deal with the whole emission, it will reduce system cost. Otherwise, the power plant will have to deal with additional contaminants, thus resulting in economic penalties.
In this problem, two groups of decision variables can be distinguished. A first-stage decision of preregulated emission can be calculated from gross actual power generation. When the uncertainty of excess emission is disclosed, a second-stage reduction activity could be taken to compensate for adjusting the adverse effects. Thus, with the objective of minimizing the system cost, this problem under the above consideration can be formulated as a scenario-based two stage programming (TSP) model (Li and Huang, 2012):
subject to the following equations:
where f is total system cost; Xt is treatment target made in advance during period t (first stage parameter);
In many real-world applications, results produced by optimization techniques can be rendered highly questionable if the modeling inputs cannot be expressed with precision (Yeomans and Huang, 2003; Yeomans et al., 2003). This means decisions must be made at discrete points in time and discrete probability levels for an uncertain variable. The interval parameters programming (IPP) is addressed to solve the uncertainties. It can directly handle uncertainties presented as interval numbers. Normally, an IPP model where coefficients of the decision variables in the objective function and constraints are reflected as interval variation can be expressed as follows:
subject to the following:
where
To solve the above problem through linear programming, the distribution of Q must be approximated by a set of discrete values. Assume Q can be discretized into different values, and each has a probability of occurrence. Let pm be the probability of occurrence for scenario m in period t, and combine TSP with IPP framework, equation (2) can be reformulated as follows:
subject to the following:
Solution method
According to Huang et al. (1992), the IPP model can be partitioned into two deterministic submodels
where
where
2 k factorial design and analysis
Sensitivity analysis can investigate the importance of uncertainty in modeling parameters and enable more informed decision support. However, it can merely examine the effect of changes in a single parameter over its range, but hardly detect combined impacts of multiple parameters on modeling outputs. In comparison, factorial designs are efficient for identifying the effects of two or more parameters. By a factorial design, all possible combinations for two or multiple-level factors are investigated in each complete trial or replication of the experiment. They are more efficient than traditional sensitive analysis. They allow the effects of a factor to be estimated at several levels of other factors, yielding conclusions that are valid over a range of experimental conditions. Furthermore, a factorial design is necessary when interactions may be present to avoid misleading conclusions. Therefore, sensitivity analysis using factorial designs is desired for conducting a more comprehensive investigation of the significance of modeling parameters that affect system performance (Zhou et al., 2013a; Wang and Huang, 2014).
The most common factorial analysis is based on the
Figure 1 provides the outline of the proposed methodology. The comprehensive process covers stochastic programming and a two-level factorial design. Also, the methods can be divided into two categories: optimization techniques and statistical experimental designs. The optimization techniques consist of TSP and IPP to deal with uncertainties in the system. Factorial designs pertain to statistical experimental designs for sensitivity analysis on significant system variables. All the methods are integrated within a general framework to address the uncertainty, risk, and influence in a systematic manner.
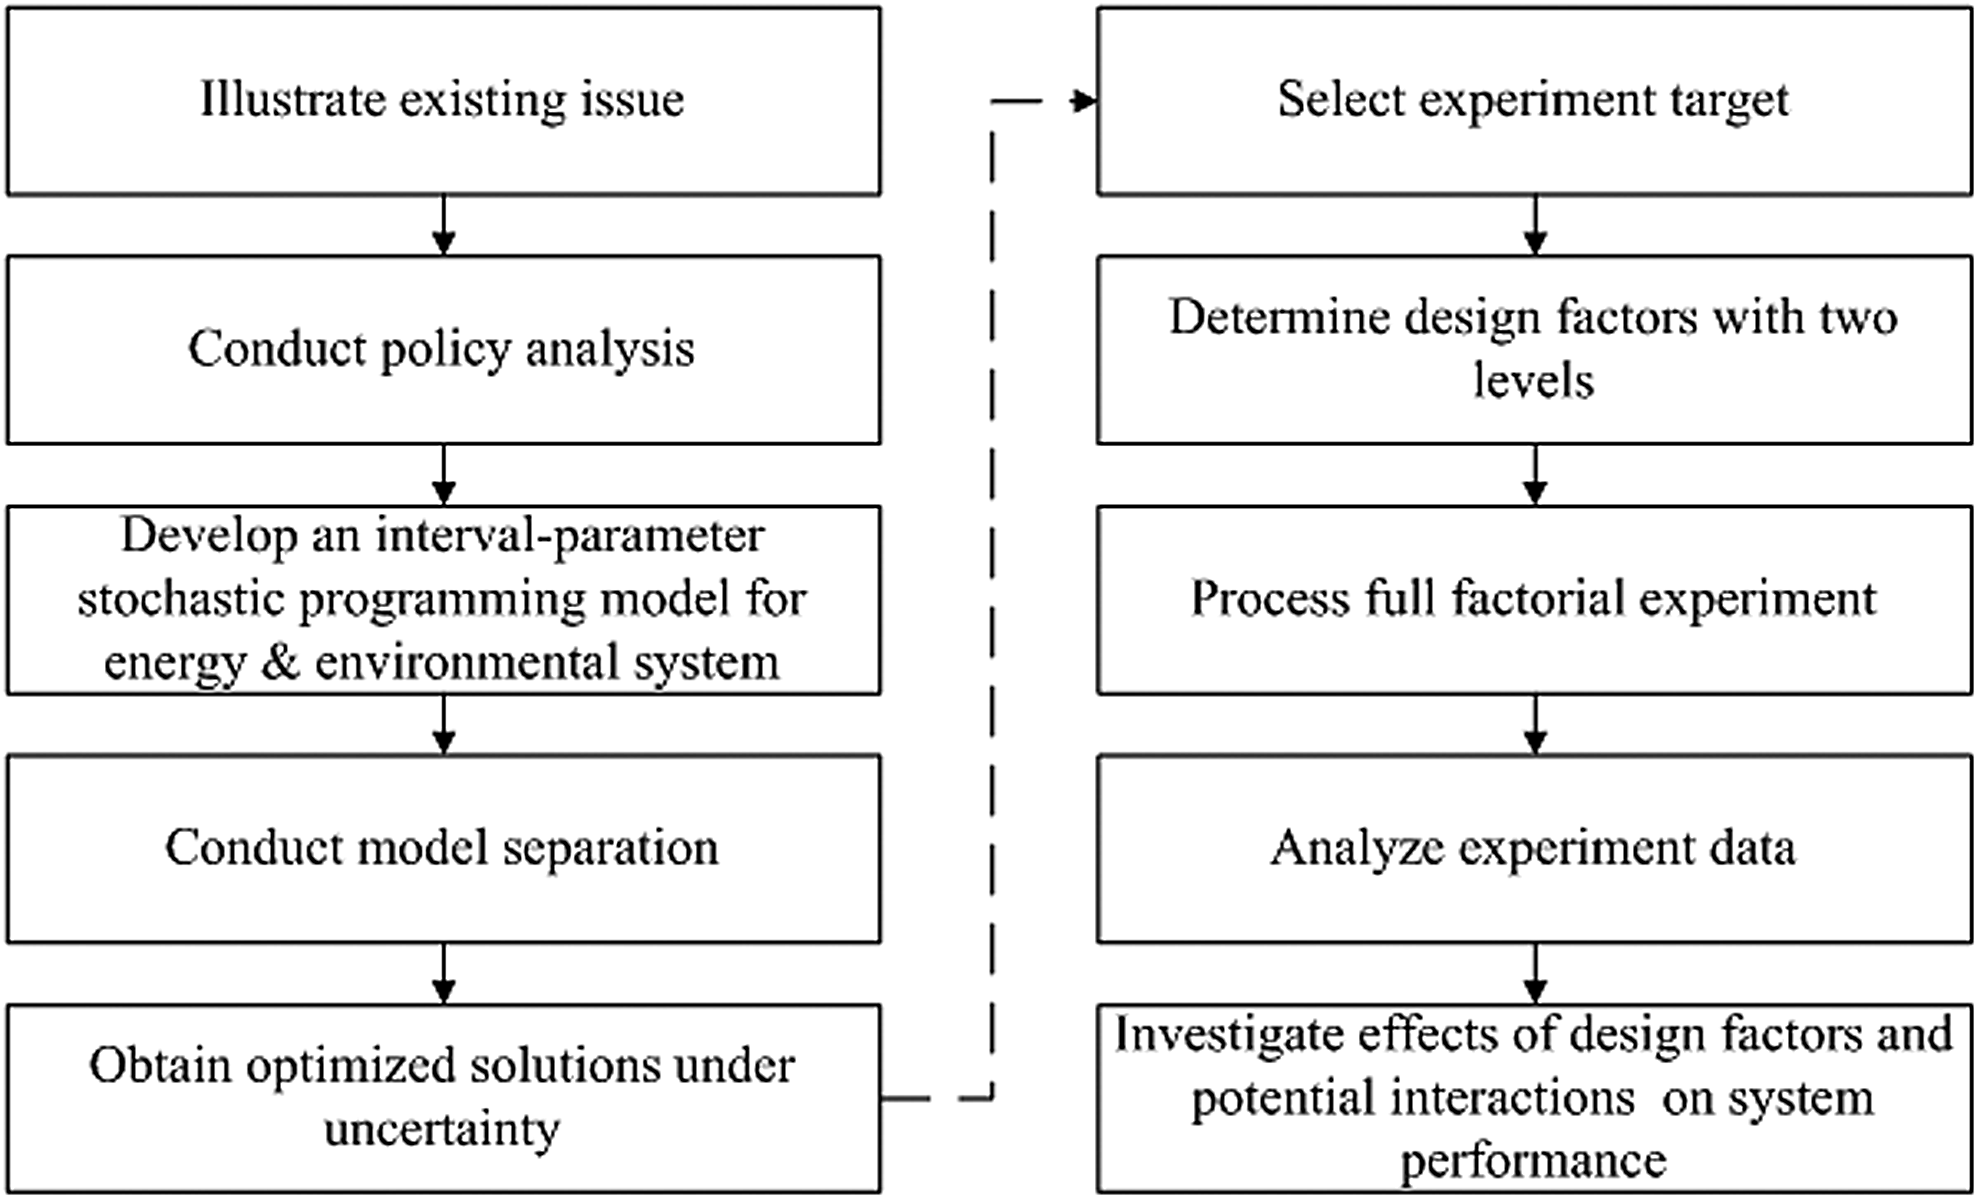
Outline of proposed methodology.
Energy and Environmental Systems Planning
Overview of study systems
Energy and environmental system management is complex with a mixture of social, economic, mechanical, and environmental processes and factors. Decision makers are regularly responsible for making power generation plans from multiple facilities through multiple energy resources and technologies. Allocating energy services to meet the need of end users with multilevel demands as well as reaching environmental standard should also be taken into account. The optimization target would usually be minimizing system cost, while meeting the above conditions. In the energy and environmental systems, a power generation plan could be a dynamic connect to flexible energy demand and changing environmental standard. However, energy consumption may also be uncertain. The relevant decisions must be made at time stage under various uncertainties (Li et al., 2010; Dong et al., 2013; Rafael et al., 2015; Wang et al., 2015).
In this study, a hypothetical, but typical energy and environmental system is developed (Fig. 2). Representative cost and technical data are summarized from government reports and related literatures. In the proposed system, five types of energy resources, including coal, diesel, natural gas, wind power, and solar power, are employed for power generation. Multiple combined heat and power (CHP) generation technologies and renewable energy can be allocated. The end users are split into agricultural, industrial, and municipal/commercial sectors. Three time periods with each having a 1-year planning horizon are under consideration. This could also be adjusted by decision makers according to practical necessity. Corresponding to historical data, it stipulates the heating period to 4 months per year, while electricity demand is ceaseless. Pollution control is also under consideration within the systems framework.
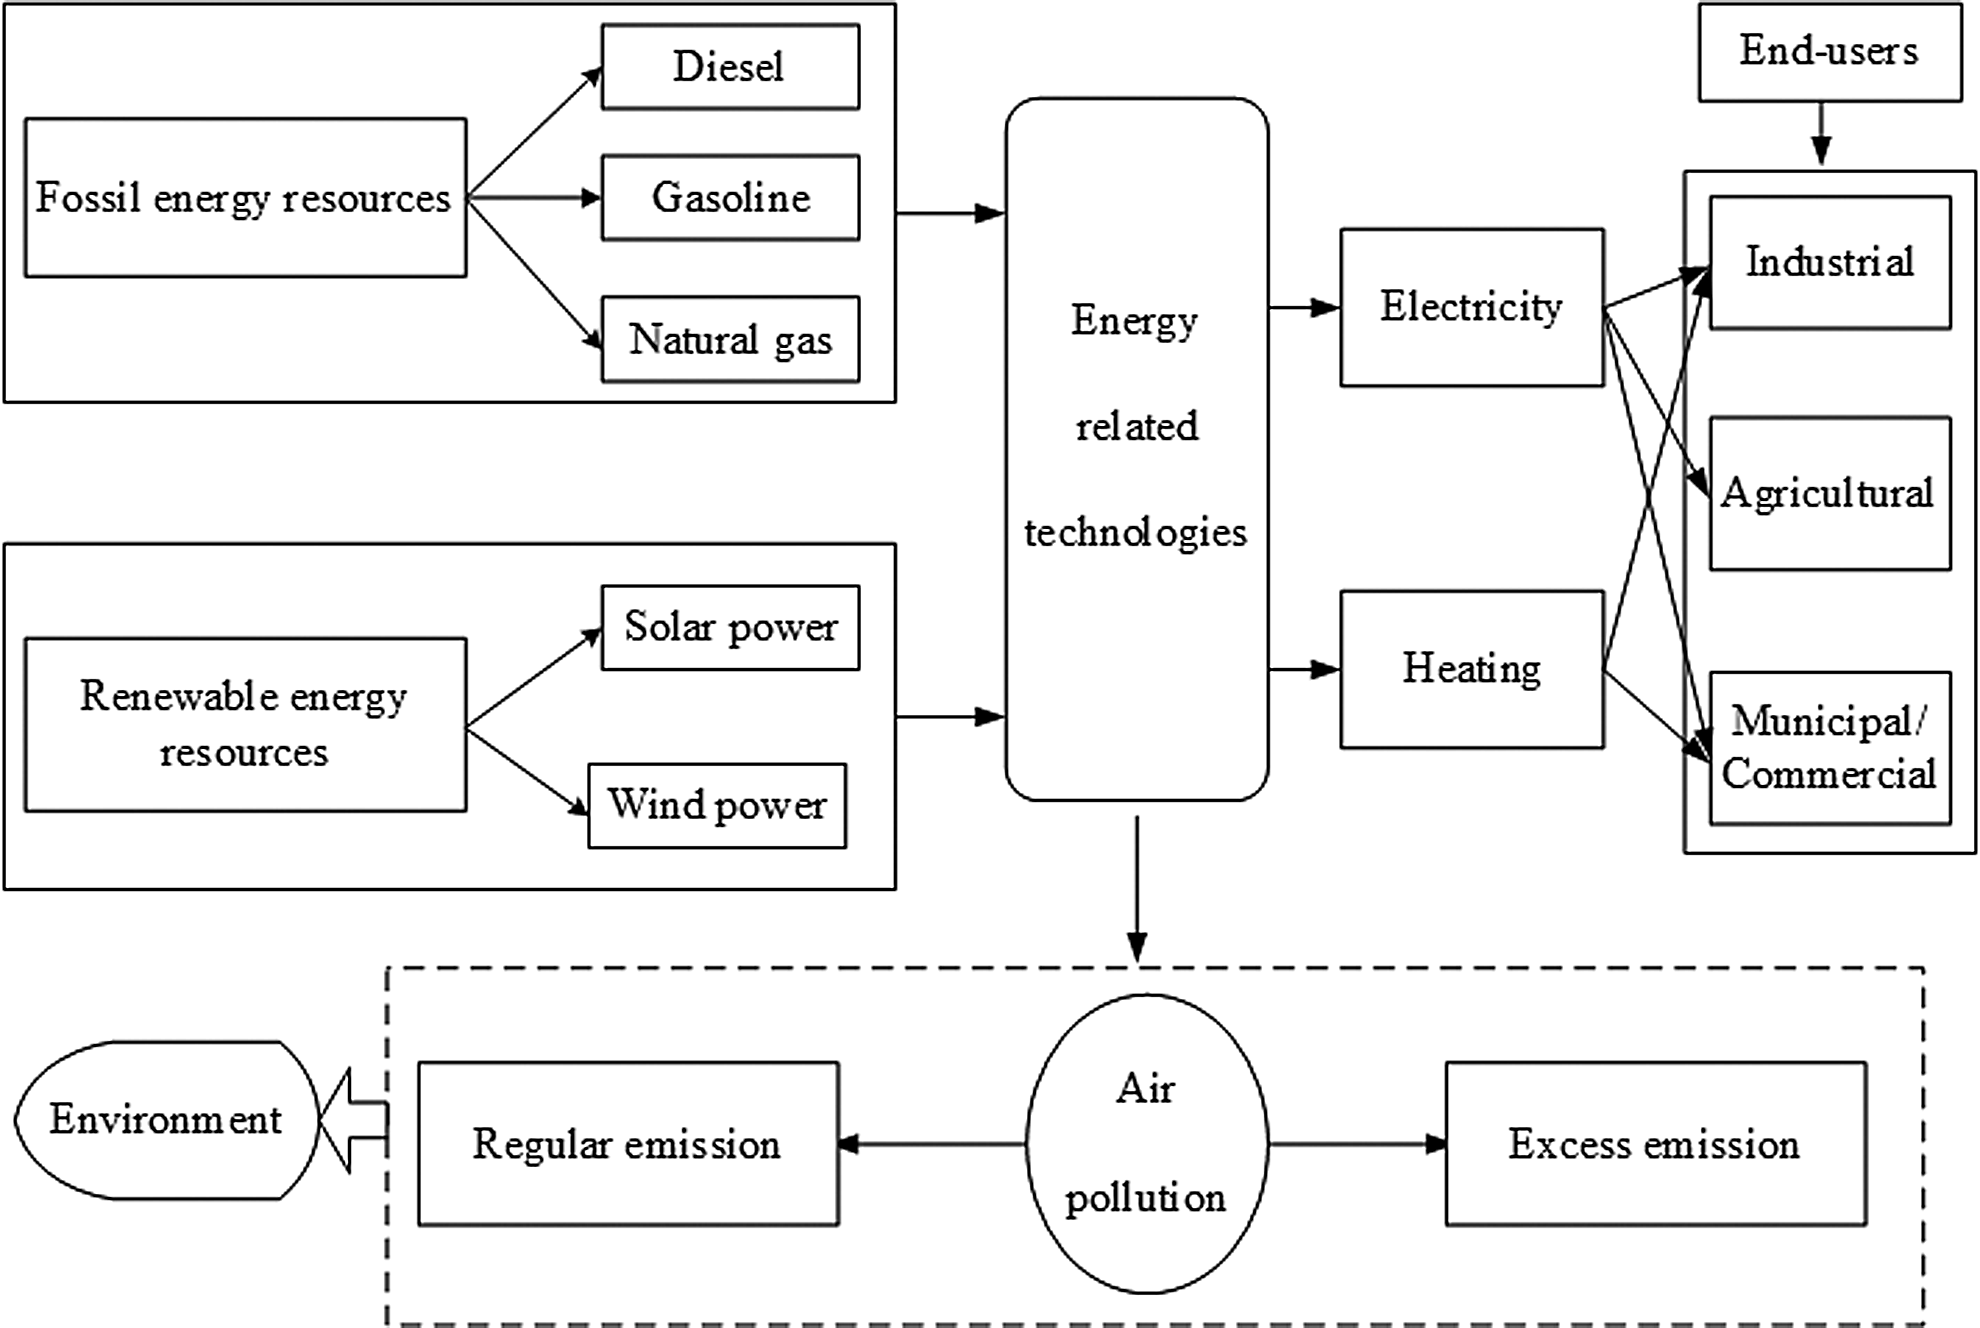
Interactive relationships of energy and environmental system.
In detail, three types of CHP plants based on burning coal, diesel, or natural gas are mainly employed for power and heating generation. The energy purchasing prices are expressed in Table 1. Wind power and photovoltaic energy are specific renewable energy undertaken in this case as supplementary electricity generation facilities. If electricity supply cannot sufficiently meet the end users' demand, decision makers have to consider other electricity production options, or invest in capacity expansions. Furthermore, during the heating period, if the CHP facilities cannot provide adequate thermal energy, backup thermal power plants based on diesel or natural gas could be enabled. The input data are uncertain. Table 2 shows the operating cost for electricity and heating generation. Coal-fired power unit is out of scope due to control the total coal output policy in recent years. In this study, SO2 is selected as representative contaminant and total quantity control is taken as environmental constrain. Assume off-gas decontamination facilities could deal with certain amount of SO2 generated, accompanying power generation activities. When it could not satisfy the environmental standard, handling excess emission would lead to a penalty, which normally is significantly higher than the regular costs (Table 3). The probability of excess emission is defined as 0.4, 0.3, and 0.3. Thus, an optimal solution with energy resource demand, technology selection, capacity expansion, and pollution emission situation should be proposed to balance the tradeoff between economic and environmental benefit. In general, the problems under consideration are as follows: (1) how to effectively assign electricity and heating generation schedule according to power demand, as well as minimize the system cost; (2) how to coordinate energy and environmental policies under rising expectation and stricter emission standard; and (3) how to balance the optimized expansion options and discharge penalties within planning horizon.
CHP, combined heat and power.
Model development
According to the background, an optimization management model can thus be addressed. In detail, the IPP method is used for addressing random variables in the system. TSP method is used for emission management process. Initial pollution control target can be expressed as the first stage, and excess emission and correlated penalty would be formulated as the second stage. Therefore, depending on the proposed method, the objective function is getting the minimum system cost. It can be formulated as a sum of the following:
(1) Purchasing cost for primary energy supply:
(2) Fixed cost for CHP facilities:
(3) Fixed cost for backup heating facilities:
(4) Cost for capacity expansion:
(5) Cost for controlling contamination:
The system constraints are as follows:
(1) Mass balance
(primary energy supply should not be less than demand).
(2) Availability of energy resources
(power generation should not be greater than resources availability).
(3) Electricity constraints
(electricity generation should not be less than demand).
(4) Heating constraints
(thermal energy generation should not be less than demand).
(5) Capacity limit

(total power generation should not be greater than facility capacity).
(6) Constraints for controlling contamination
(emission should not violate the environmental standard).
(7) Capacity limit for backup heating boilers:
(thermal energy provided by backup boilers should not be greater than facility capacity).
(8) Technical constraints
(nonnegative constraints).


Detailed nomenclatures for all the variables and parameters are provided in Appendix Table 1. The objective of the proposed model is to minimize the system cost. The constraints are a number of inequalities that define relationships among various decision variables and system conditions. In this study, a preregulated SO2 discharge amount is set at the first stage. If the actual discharge excesses the target, a penalty would be addressed and it could impact the system cost. Specifically, pollutant discharge
Result analysis
Primary energy supply scheme
Figure 3 shows the optimized primary energy supply proportions; it also is the minimized purchasing amount to meet the demand. In this study, coal was the major source of energy supply, accounted for 57% at the lower bound, and 66% when at the upper bound. Coal reserves are very large. It is relatively accessible, easy for storing, and utilizing. Thus, it could save system cost. Diesel fuel was also widely used in this situation, which contributed 23–32% energy consumption. Normally, compared to coal- or oil-fired facilities, natural gas could achieve very low emission. Of the gross energy supply, total purchasing quantity of natural gas could reach 11–12%. The detailed energy purchasing scheme is showed in Table 4. The proposed method could only acquire a minimum purchasing amount. In reality, decision makers would usually need additional orders for security, but the interval solutions could also reflect the requirements in system condition. In detail, the coal supplies calculated during planning horizon were [542, 715], [525, 698], and [505, 902] × 103 tonnes. The operating cost for coal-based facilities was much lower compared to other technologies, while the emission rate was also notably higher. Due to the stricter emission standard, there was an obvious decrease in purchasing trend. Similarly, purchasing amounts for diesel fuel also went through the shrinkage. The particular data are as follows: [340, 383], [298, 337], and [256, 290] × 103 tonnes. However, natural gas supplies increased significantly along with the planning period, which were [54, 76], [96, 123], and [139, 166] × 103 tonnes at each period, respectively. In consideration of the higher calorific value compared with coal, the power supply contribution of natural gas would be even greater. The result conforms to the present energy supply situation: substitute coal by gas is the current development tendency worldwide.
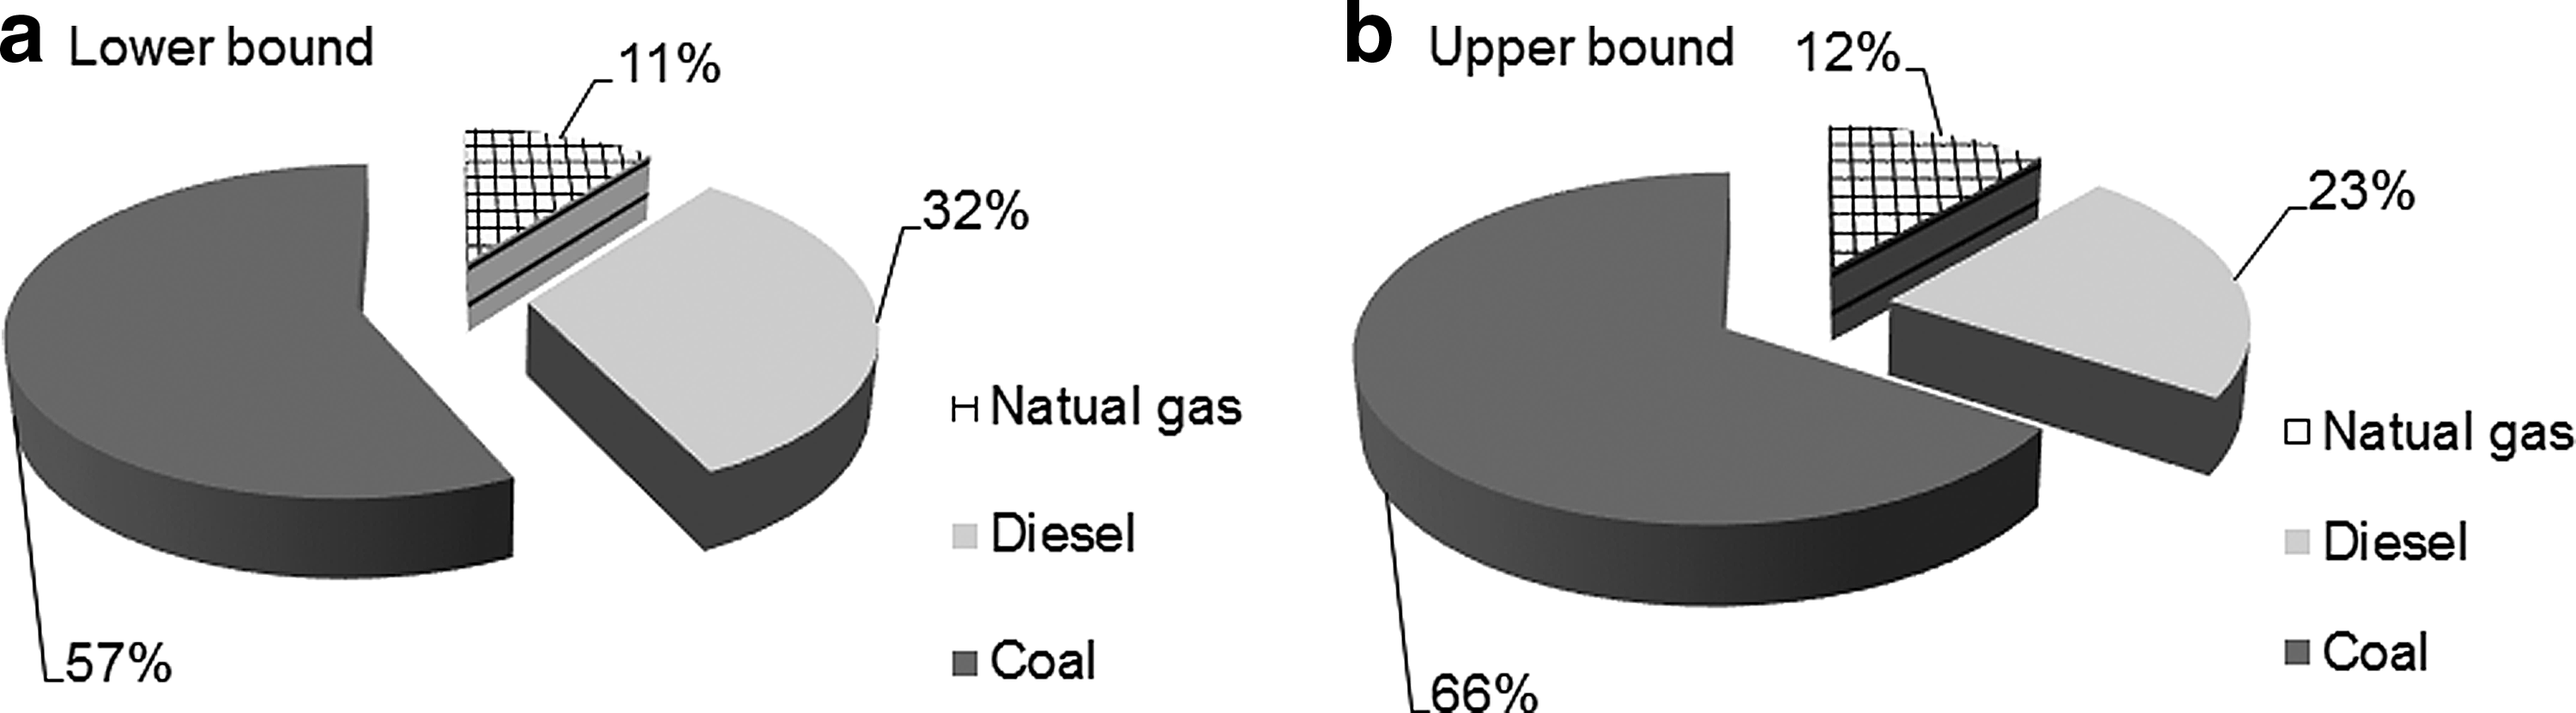
Primary energy supply proportions at the lower bound
Power generation
In this study, power generations were divided into two relevant activities: electricity generation and heating production. The CHP facilities could generate electricity as well as thermal energy during heating seasons. The possible heat supply shortage could be provided by backup thermal power plants or through capacity expansion of CHP plants. Power generation plan could be adjusted according to end users' energy demand.
Figure 4 presents the electricity demand as well as power generation plan for fossil fuels. Electricity demand was increasing during the planning period. The figure indicates that electricity generated by natural gas would rise prominently. It would be only [241, 288] GWh during period 1, but it significantly rose to [475, 571] GWh in period 2, and would even reach [729, 730] GWh in period 3. A threefold increase accrued compared to initial generation. However, inside the system, the proportion of gas-fired electricity was still relatively low. The coal-based electricity generation schemes would be [1,406, 1,650], [1,398, 1,650], and [1,385, 1,650] GWh, respectively, meanwhile, the electricity generated by diesel would be 1,328, 1,197, and 1,059 GWh at each period. The figure shows that diesel-based electricity declined slightly during planning period, while coal-fired electricity remained firm. It indicates that technologies with a lower cost would be the first priority. That also means market regulation is not an efficient way of reducing coal use; administrative measure like total quantity control must be taken.
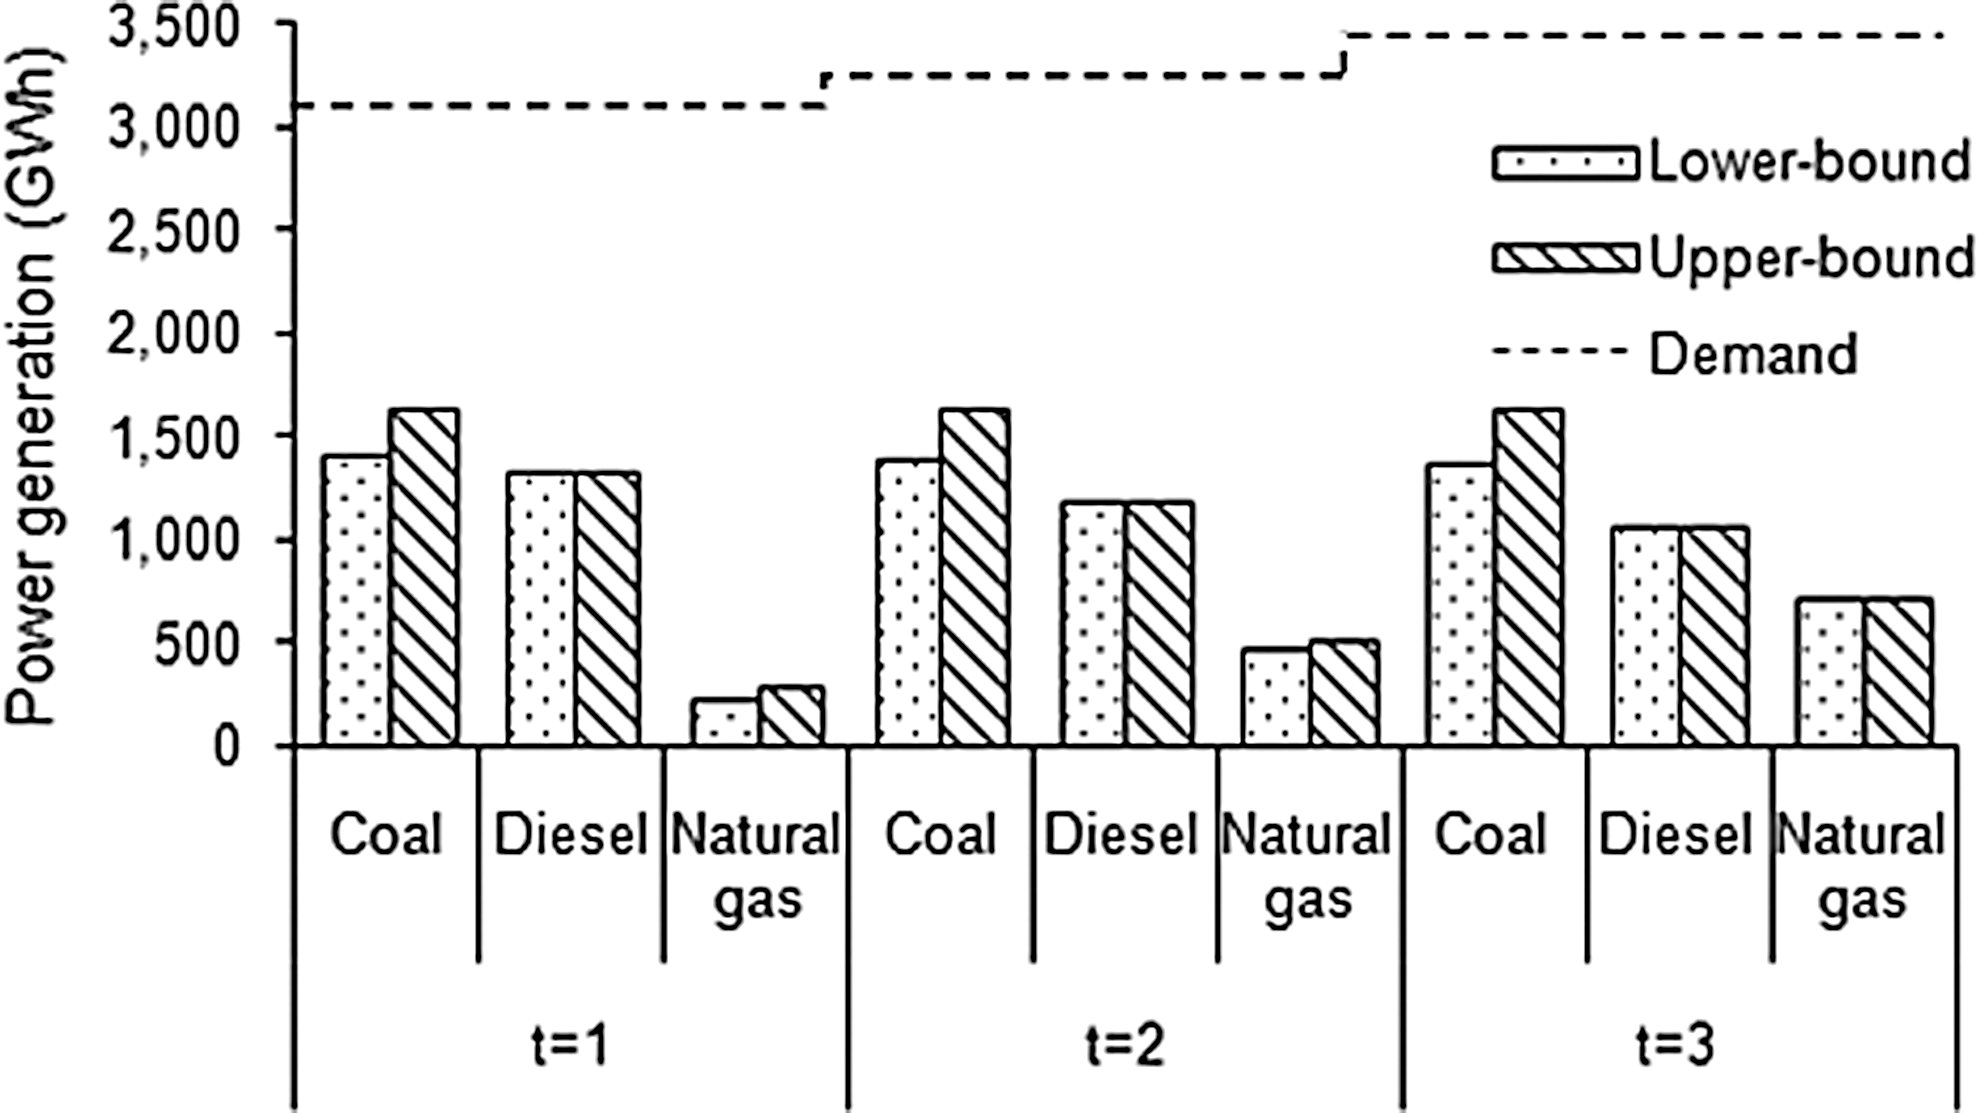
Electricity demand and power generation results for fossil energy.
The installed capacity of renewable energy like wind power or solar energy is relatively smaller, with no more than 20 MW, thus they are treated as supplement facilities of electricity generation (Fig. 5). The detailed generation by wind power would be [15, 19] GWh, 20 GWh, and [16, 44] GWh, respectively, while the photoelectricity would be [8, 14], [9, 15], and [9, 16] GWh. With a stricter environmental standard, renewable energy was effectively utilized. In the long term, capacity expansion and taking full advantage of the great potential of renewable energy could be a valid way to reduce emission and system cost.
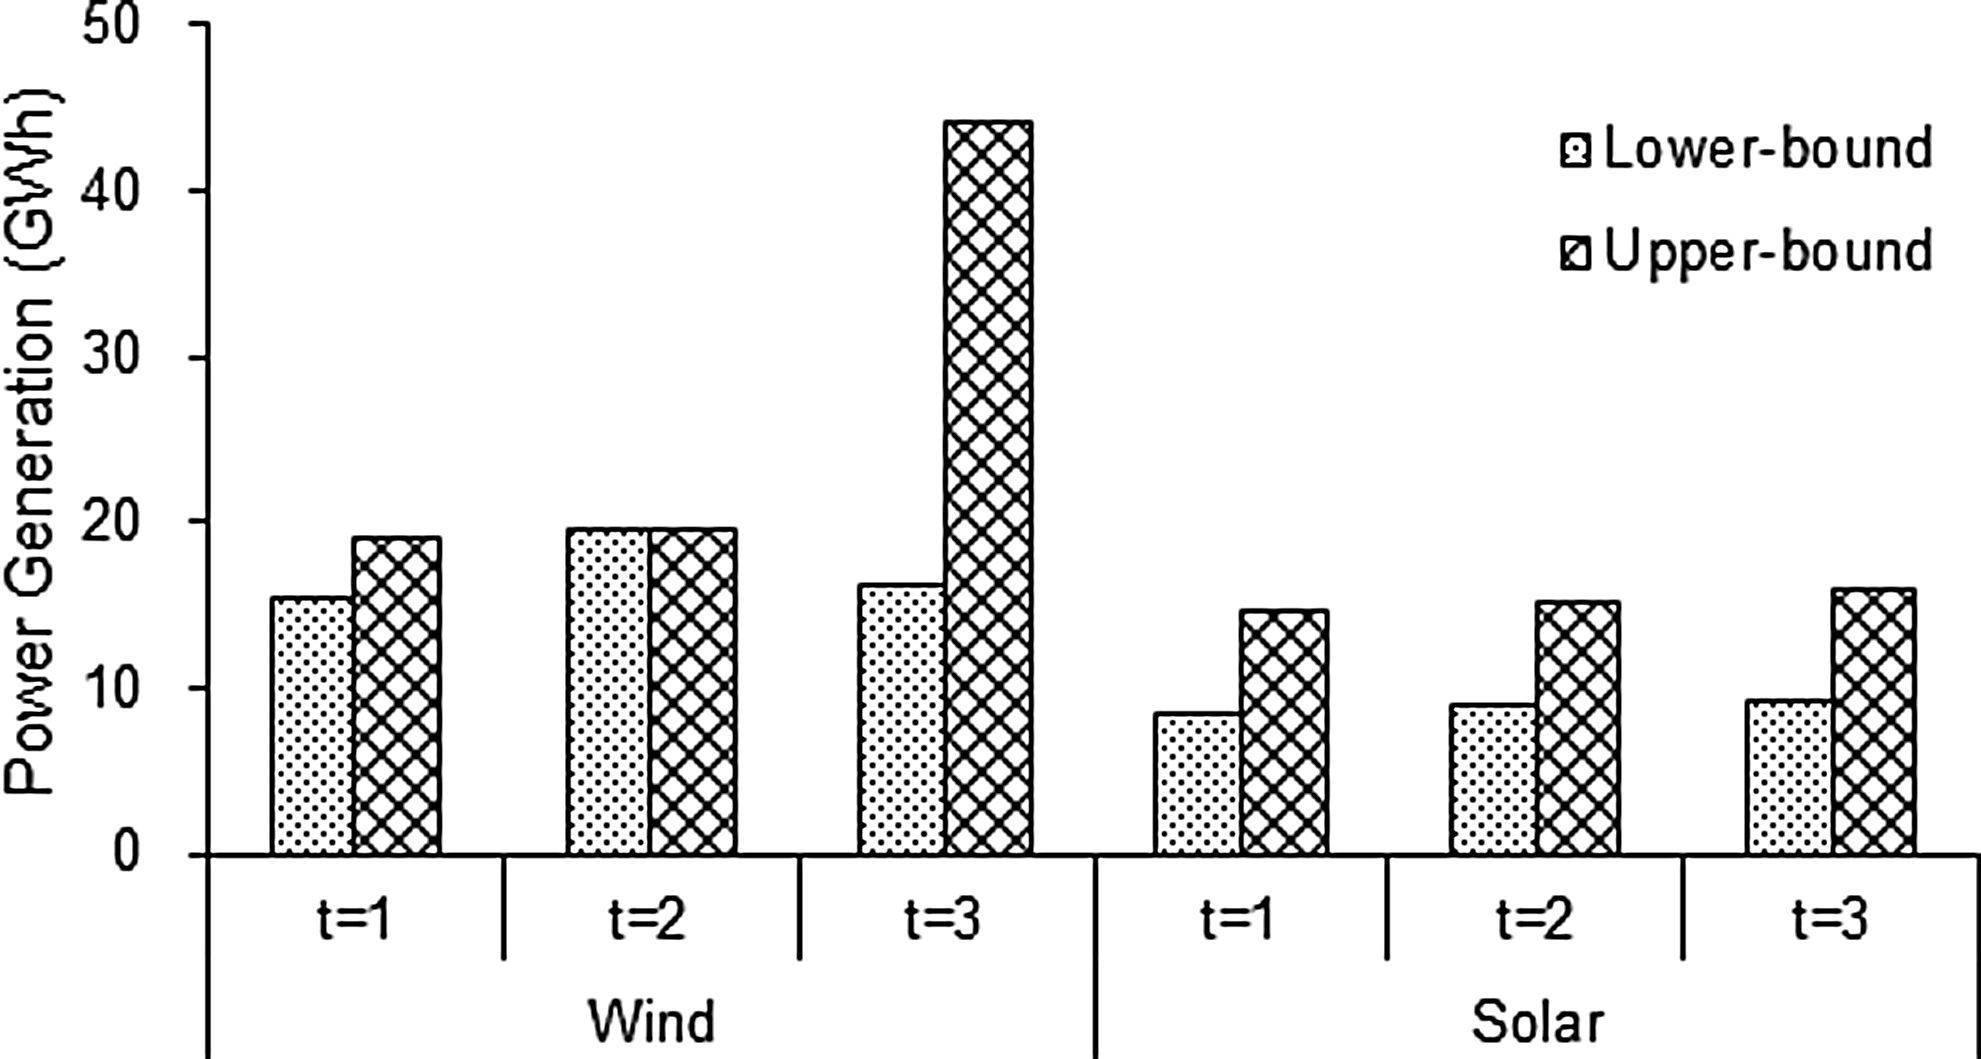
Electricity generation results for renewable energy.
There is also a heating shortage, the optimized results indicate that enabled backup thermal power plant would be a lower costing way than large-scale capacity expansion. The backup gas-fired thermal power plant would provide [231, 366], [201, 328], and [141, 381] × 103 GJ to the end users at each period, respectively. Along with the rising electricity demand, power generated form CHP facilities would also increase, thus thermal energy provided by backup boilers would decrease accordingly.
In comparison of the results under planning period, coal-fired power conversion technology would play the most important role in the electricity generation activities. Diesel-based power would be the secondary important electricity supply source. Gas-fired electricity also played an important role in energy supply, and it was treated as the most important manner to control containment. Wind power and photovoltaic energy were treated as supplement energy supply source, with barely emission discharge. At a current level, environmental standard in this study was moderate, but it caused an evident rise of gas-based electricity. It will be reasonable when with a stricter environmental standard, substituting coal/petroleum to natural gas would be an efficient mode to reduce air pollution. In view of immense potential of wind/photovoltaic energy, expanding their portion of at electricity market at appropriate conditions would also be an effective methods to emission reduction, as well as saving system cost.
Capacity expansion
Generally, shortage would occur if the power demands are continuously high, and capacity expansion would be an option to avoid insufficient energy supply. Particularly in this study, when electricity supply failed to keep up with the demand, capacity expansion of CHP facilities must be taken. While heating shortage occurs, three different options could be taken: (1) expand the capacity of CHP facilities; (2) enable backup thermal power plants with diesel-based or gas-based conversion technologies; and (3) when severe lack of thermal energy took place, expand the capacity of backup boiler would also be acceptable. The detailed expansion options are described in Table 5. It shows that the maximum expansion should not exceed twice the initial capacity. The optimized objective would be addressing the shortage with the lowest system cost. Coal-fired technologies would no longer be expanded. Figure 6 displays the initial installed capacity and expansion solutions of each conversion technology at the lower and upper bound of the system. At the lower bound, only the capacity of wind farm would be expanded with option 1, which is 2 MW. Compared to installed capacity of fossil energy, the capacity expansion would be rare. At the upper bound, with greater energy demand, both gas-fired facility and wind farm are expanded. In specific, natural gas facilities would expand under option 2 with 300 MW capacities. Wind farm would be expanded by 20 MW under option 3. It empowers wind farm with doubled ability, making it possible to take full advantage of wind energy. Thus, in Fig. 5, it could raise an evident wave in period 3 of wind-based electricity. Capacity expansion of backup thermal energy plant would not be conducted since it would not be an environmental friendly nor cost saving way. With the above expansion plan, the power generation facilities could meet the heating demand. With strict environmental standard, capacity expansion for boilers with small capacity and high emission would not be feasible.
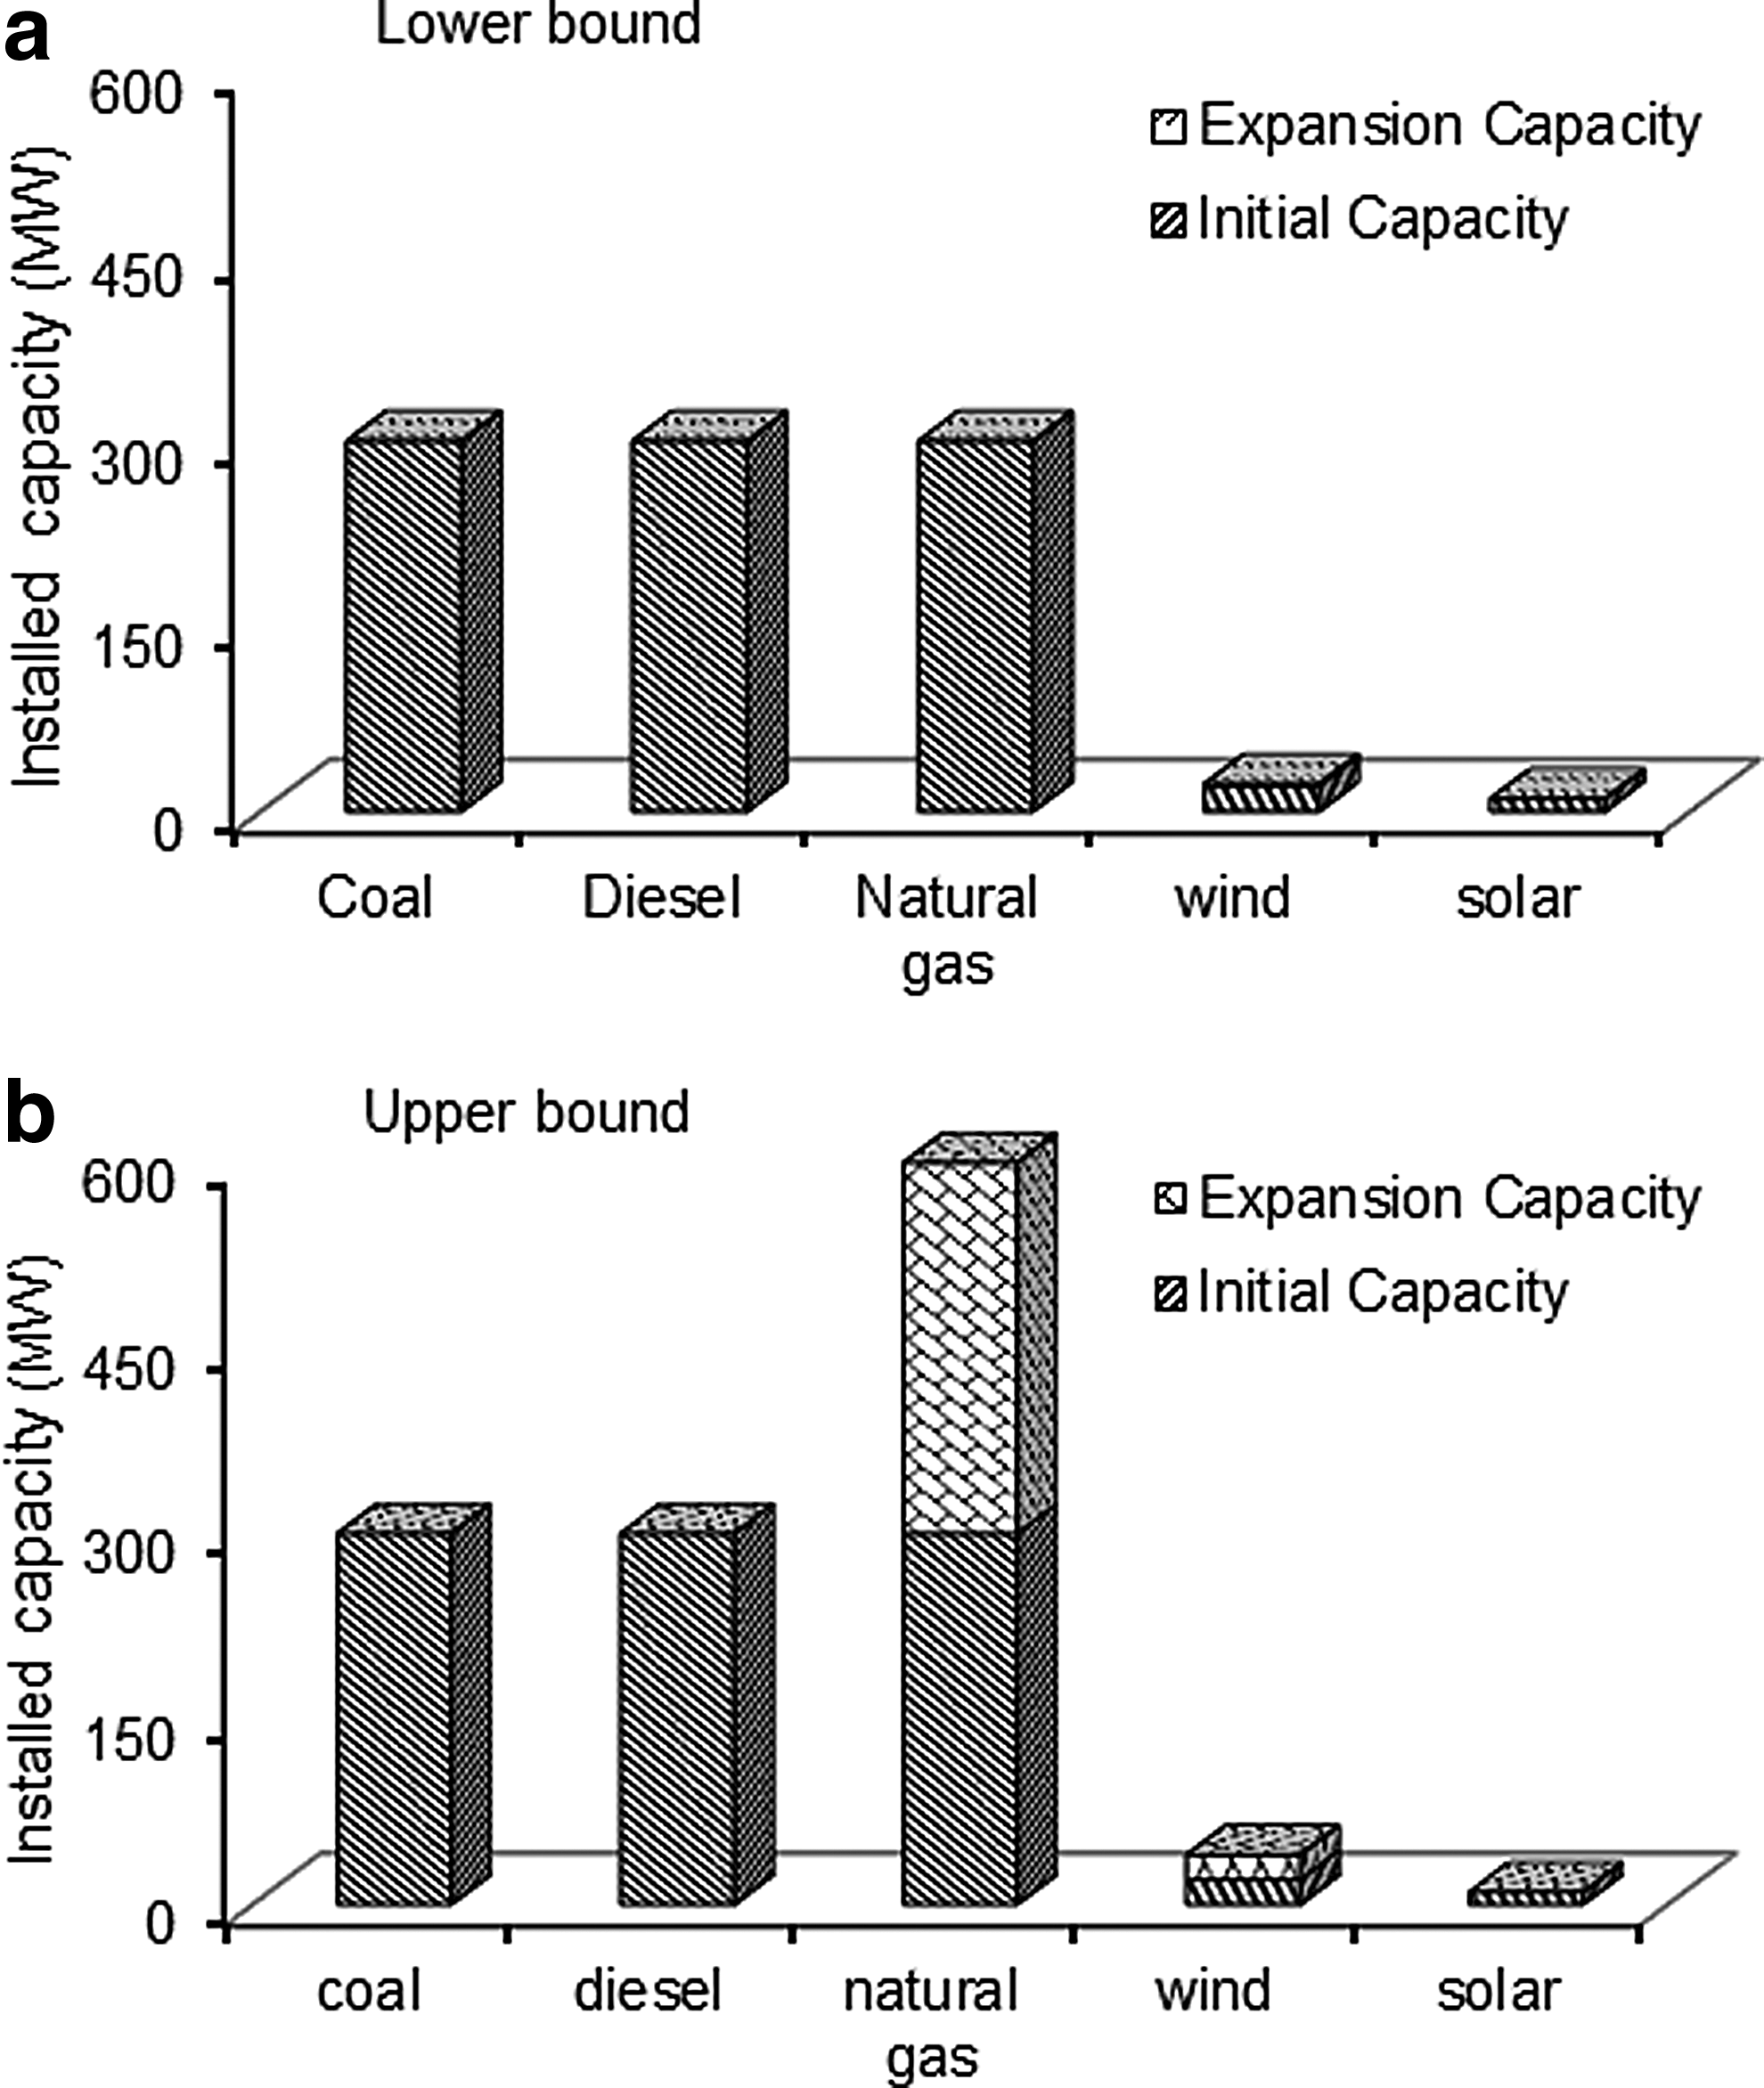
Installed capacity of CHP facilities before expansion
Air quality control
In this study, a project of air pollution control was considered. A preregulated amount of SO2 produced by power generation could be computed from energy production and discharging coefficient of each power conversion technology. If it could not meet the environmental standards, a penalty would be taken to process excess emission. A relatively more rigorous standard was set to inspect the effectiveness of the proposed model. Energy generation could not be cut down since meeting the energy demand is the first priority. Thus, excess pollution control had to be taken. The particular SO2 emission is showed in Fig. 7. For coal-based conversion technology, total SO2 calculated with the proposed method would be [6.7, 10.1], [6.5, 9.8], and [6.2, 9.5] × 103 tonnes. Off-gas treatment efficiency is [85%, 90%]; the figure indicates that the actual discharge amount at each period would be around 1,000 tonnes. The diesel discharge scenario is similar to coal. As the power generation declines gradually, SO2 discharge would also decrease. In particular, total SO2 generated by diesel0based generation activities would be [3.3, 6.0], [2.8, 5.6], and [2.4, 4.5] × 103 tonnes. After residual gas treatment system, final quantity discharged by diesel technologies would be [498, 602], [434, 527], and [371, 452] tonnes. Integrating with the total energy generation amount, it demonstrates that oil-fired power plants are also high-emitting technologies. SO2 generated by natural gas-based facilities would not exceed 20 tonnes, it is a relatively small amount, thus not expressed in the figure. In addition, the figure also indicates that with stricter environmental standard, current treatment measures could not meet the demand. Contamination discharge should be reduced by almost half. In detail, the excess emission of coal-based facilities would be 505, [487, 490], and [465, 475] tonnes, respectively; for diesel, the number would be [197, 249], [162, 208], and [127, 168] tonnes at each planning period. In view of the large amount of excess production of SO2, severe penalty should be taken. Improving processing efficiency would also be a valid way to reduce air pollution. In this study, a 1% higher efficiency would reduce coal-based SO2 emission by [600, 1,000] tonnes, and reduce diesel-based emission by [300, 600] tonnes.
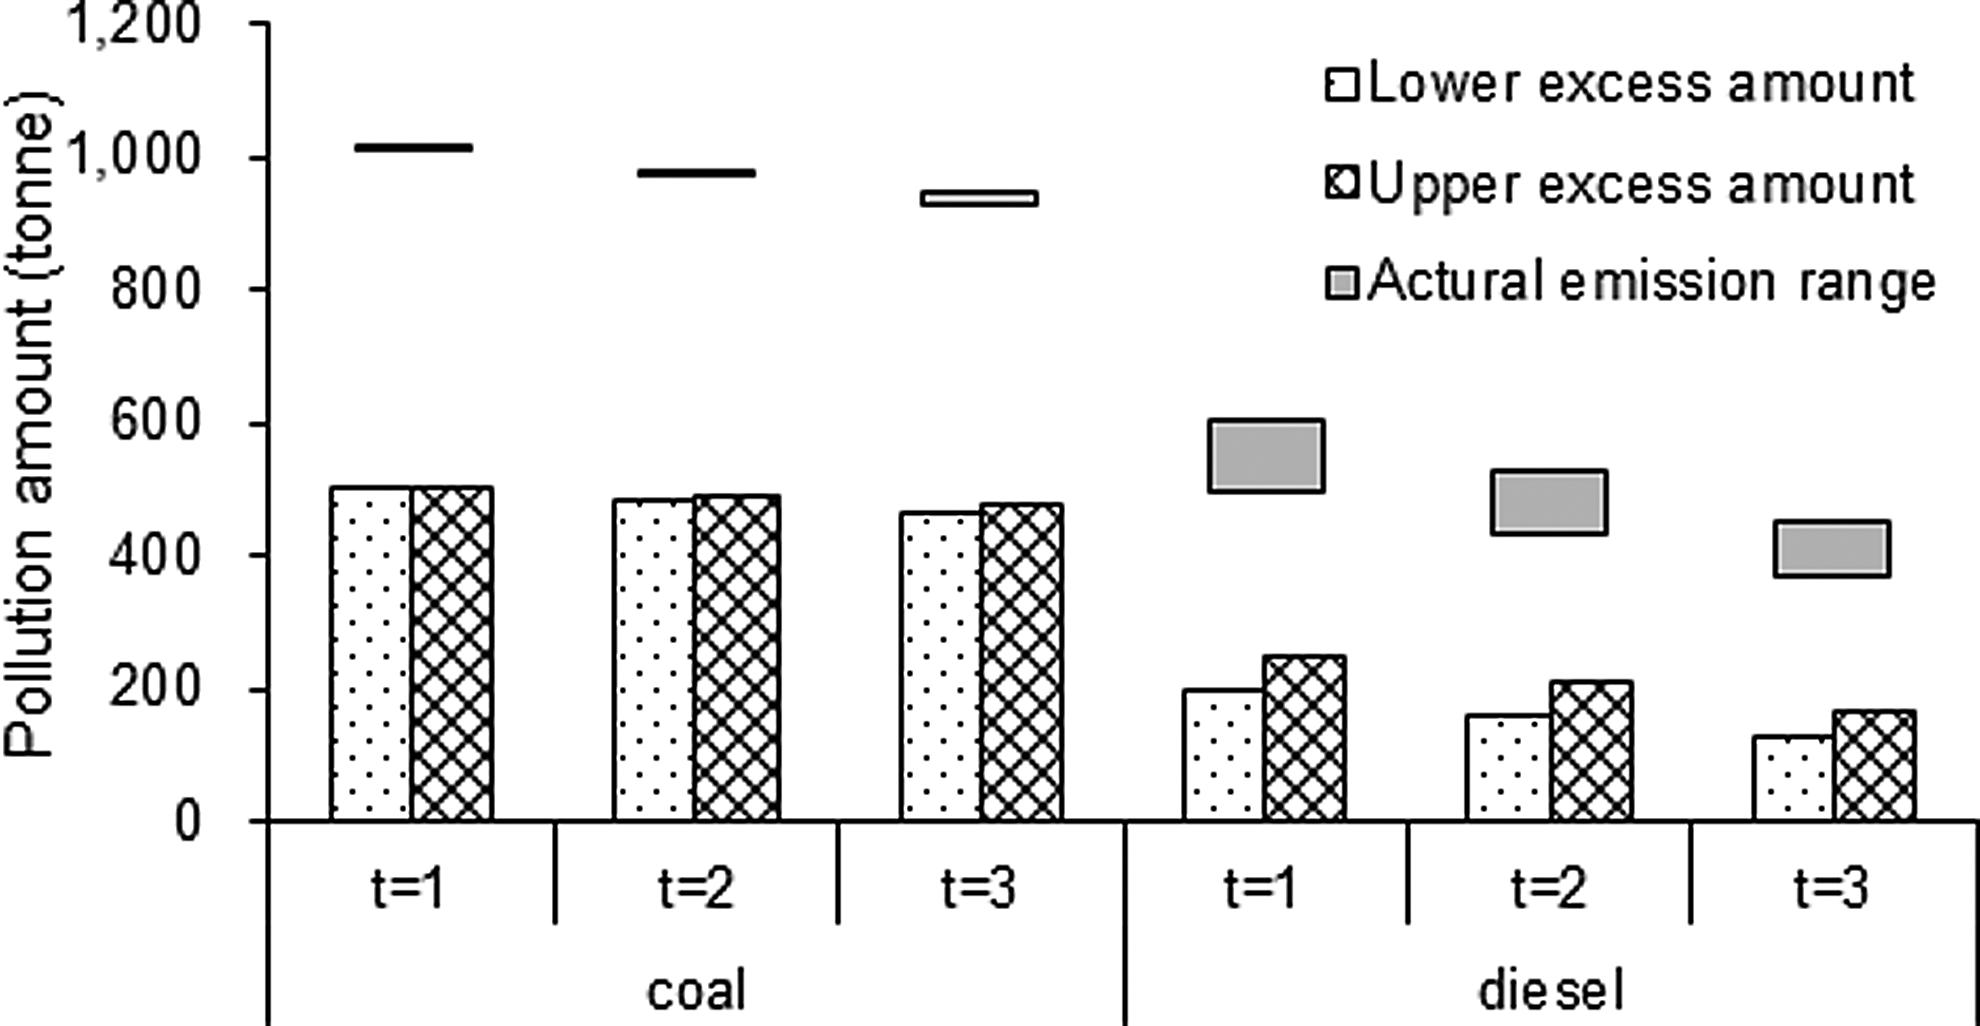
Optimal SO2 mitigation results under required emission standard.
With a general energy and environmental system model, it could make planning for power generation, capacity expansion, and pollution emission under different policy scenarios with multiple uncertainties. However, it hardly deals with impact analysis within the system. To gain better insight into the system and better understanding of the variation effects in uncertain parameters, examinations of these uncertain parameters and their interactions are necessary. The method of factorial analysis is therefore introduced into the optimization framework. It could be used to provide a trade-off analysis between the economic objective and the system variables. A better energy and environmental policy could be made if the impact level for each uncertain variable could be addressed. It could also be used to determine whether the designed method is effective for reducing system cost and emission. In this study, six factors are selected. They are all economic factors and directly influence the SO2 emission process. Table 6 shows the selected uncertain factors from the proposed model, these factors were denoted as A–E and F, respectively. For each factor, it was presented at two levels corresponding to the lower bound and upper bound of interval number. For a certain full factorial design with six factors, it would require 64 experimental runs for estimating the joint effects of each factor. The primary concerns in this study would be analyzing and evaluating the factors influencing the total system cost and emission amount.
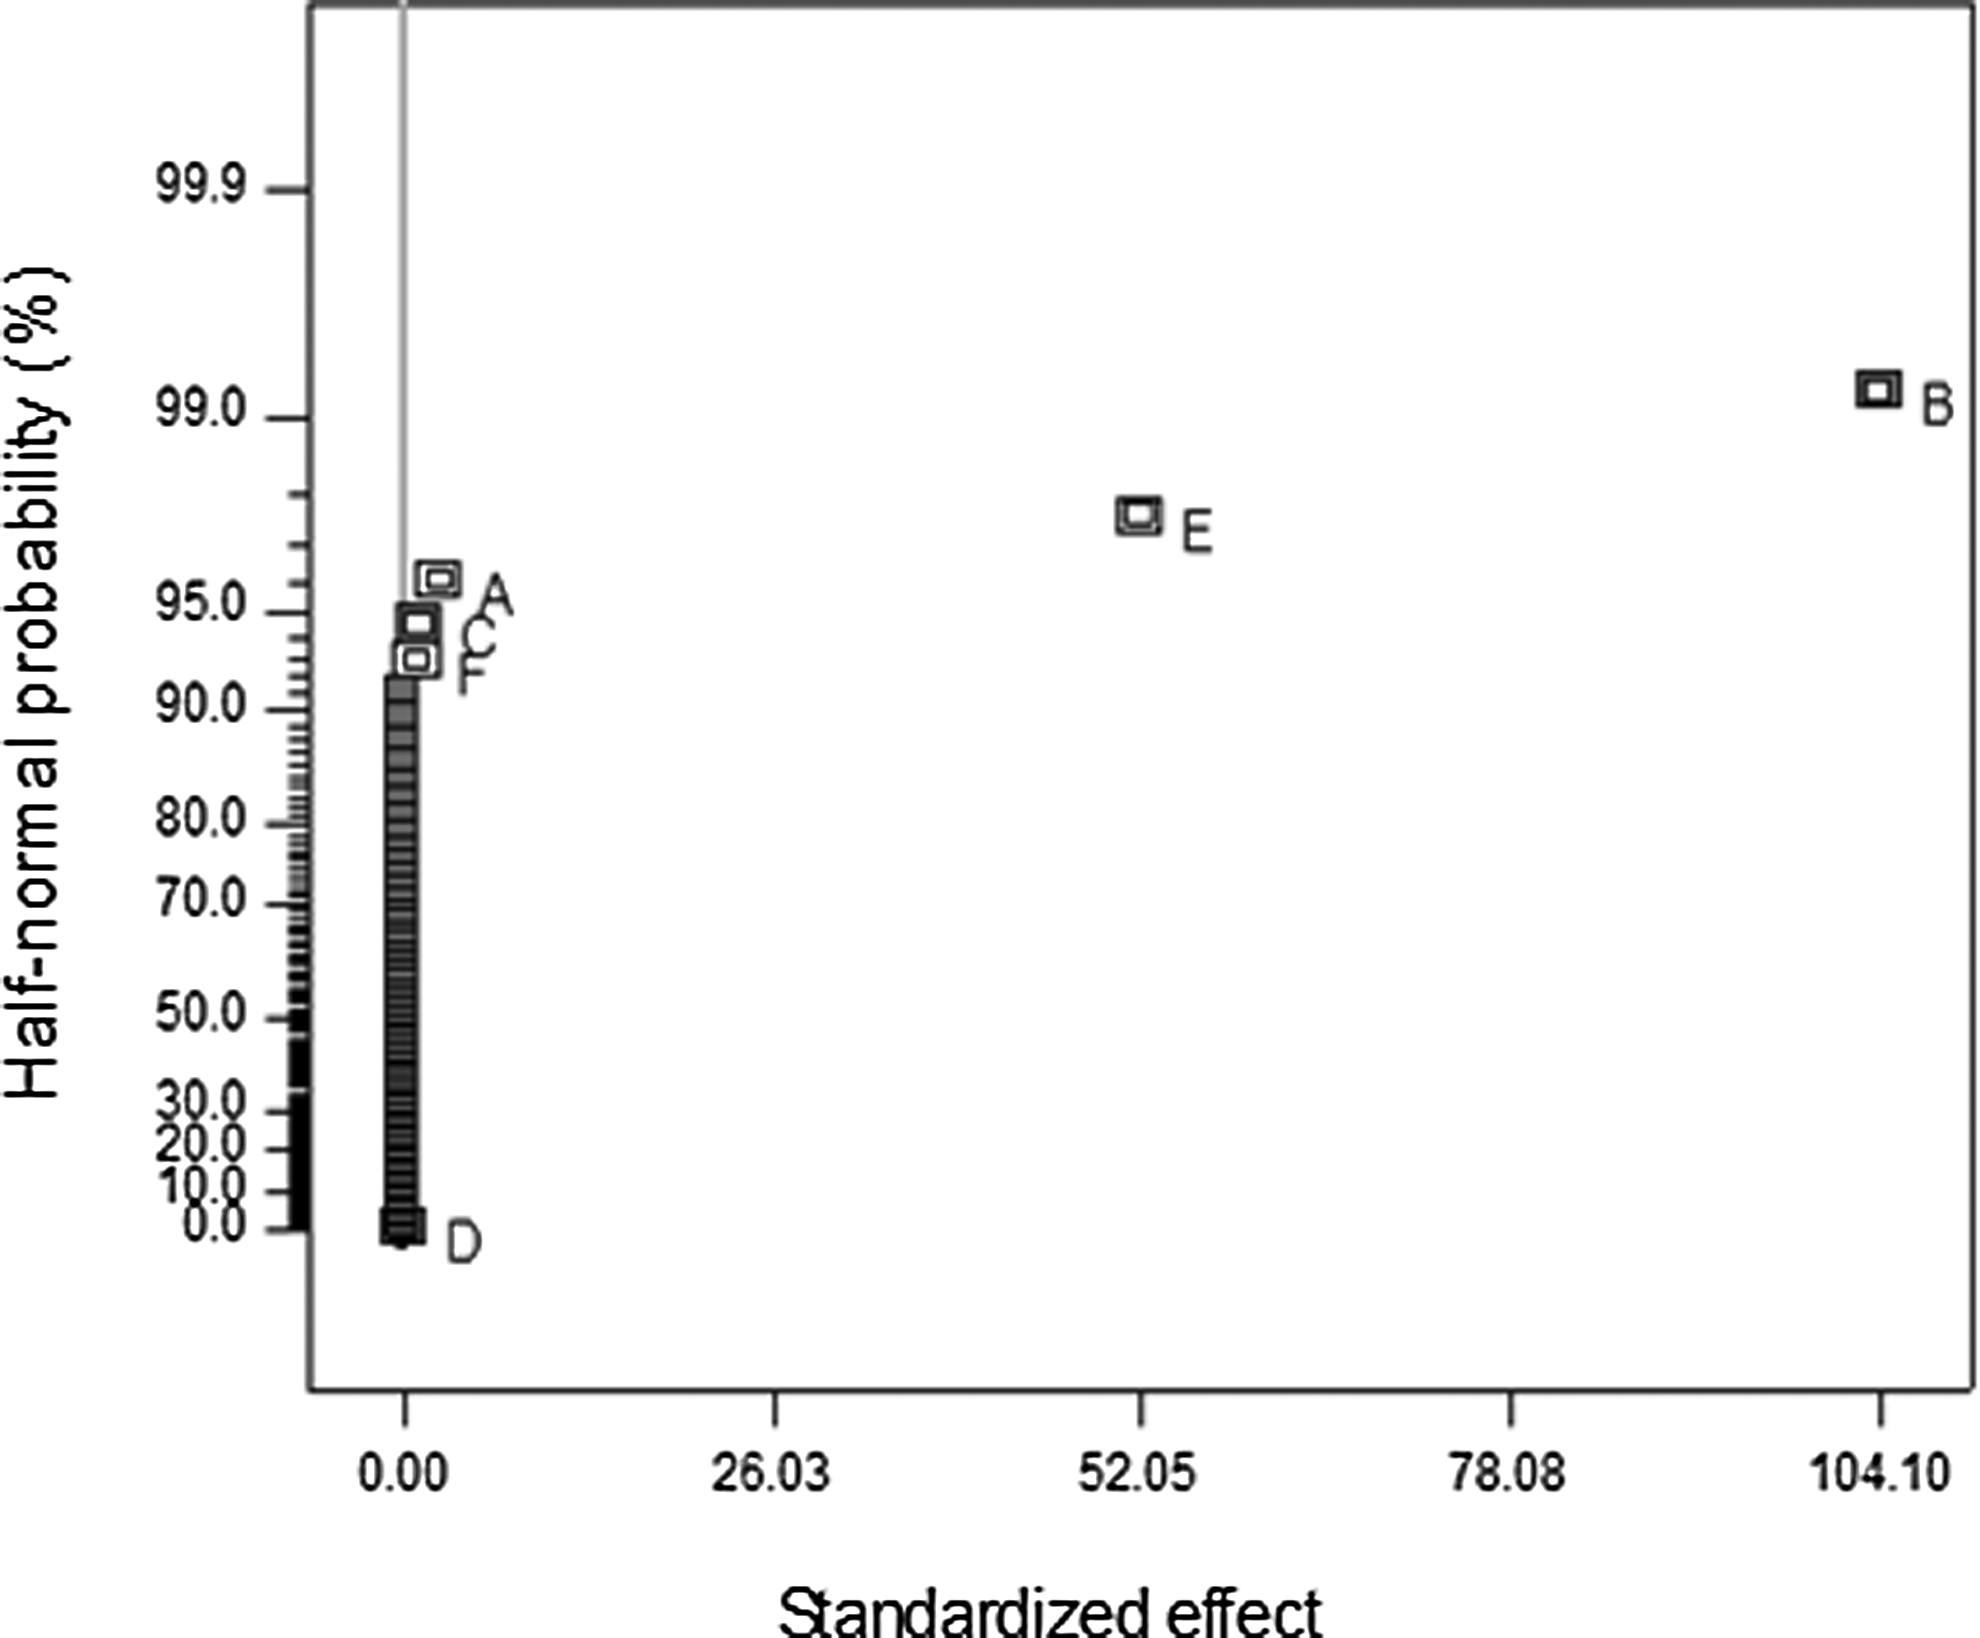
Figure 8 shows the half-normal plot of the effects for total system cost resulting from the determined variables. It is the absolute values of effect estimates against their cumulative normal probabilities. All of the effects that lie along the line are negligible, while significant effects are far away from the line. As illustrated in this figure, factors A and B would be significant factors, and the impact of factor A would be most distinct. Factors E and D could also be treated as relatively significant factors, but with much fewer impacts. The influence of factor C, F, and their interactions were infinitesimally small and could be neglected. Since coal and diesel generate more than 70% of energy in the system, it was reasonable that the regular operating cost for coal- and diesel-fired facilities lead to the greatest impacts for total system cost. Considering the apparent greater impact of regular operating cost than penalty, it also implied that the designed forfeit of excess emission was too low to be effective. Although penalty cost was almost three times higher than the regular cost, profit produced by overwhelming power generation could counteract the relatively weak penalty. The figure also suggests that penalty based on power generation amount could be a more effective way to reduce excess emission. Figure 9 presents the half-normal plot of effects for total SO2 emission. It shows that factors B and E are the most significant factors under the circumstances. Both factors are diesel-related economic activities. The effect of other factors would be much smaller or even nearly nonexistent. It indicates that the total usage amount of diesel fuel is the key impact factor for SO2 emission. Figure 10 presents the factor interaction effects plot matrix for actual emission. X axis represents the interval values of chosen factors. The interval values of the corresponding factor are expressed with two separated lines. Y axis represents the actual emission in the system. Since factors are expressed with their lower and upper bound, a full permutation of the observed value for actual emission could be captured in each plot. For example, the oblique line only exists in the subfigure for factor B and E interaction, the rest are nearly all horizontal lines. The lowest emission would occur when regular cost for diesel was addressed at the lower bound and penalty cost was evaluated at the upper bound. It further illustrates an obvious impact of diesel-related activities, and other factors only had less significant influence on SO2 emission. The results fit the power generation and SO2 emission outcome: power generation and pollution emission by coal remained basically stable during planning horizon; generation activities of diesel facilities were slashed due to stricter emission standard and its relatively higher operating cost. Reduced capacity was substituted by gas-based power plants; natural gas could achieve very low SO2 emission, thus had very little effect on total system emission. These figures also demonstrate that the environmental standards were strict, but design penalty was too low to effectively regulate and control SO2 emission. Relevant regulation should be adjusted to prevent, control, and reduce the pollution from the very origins.
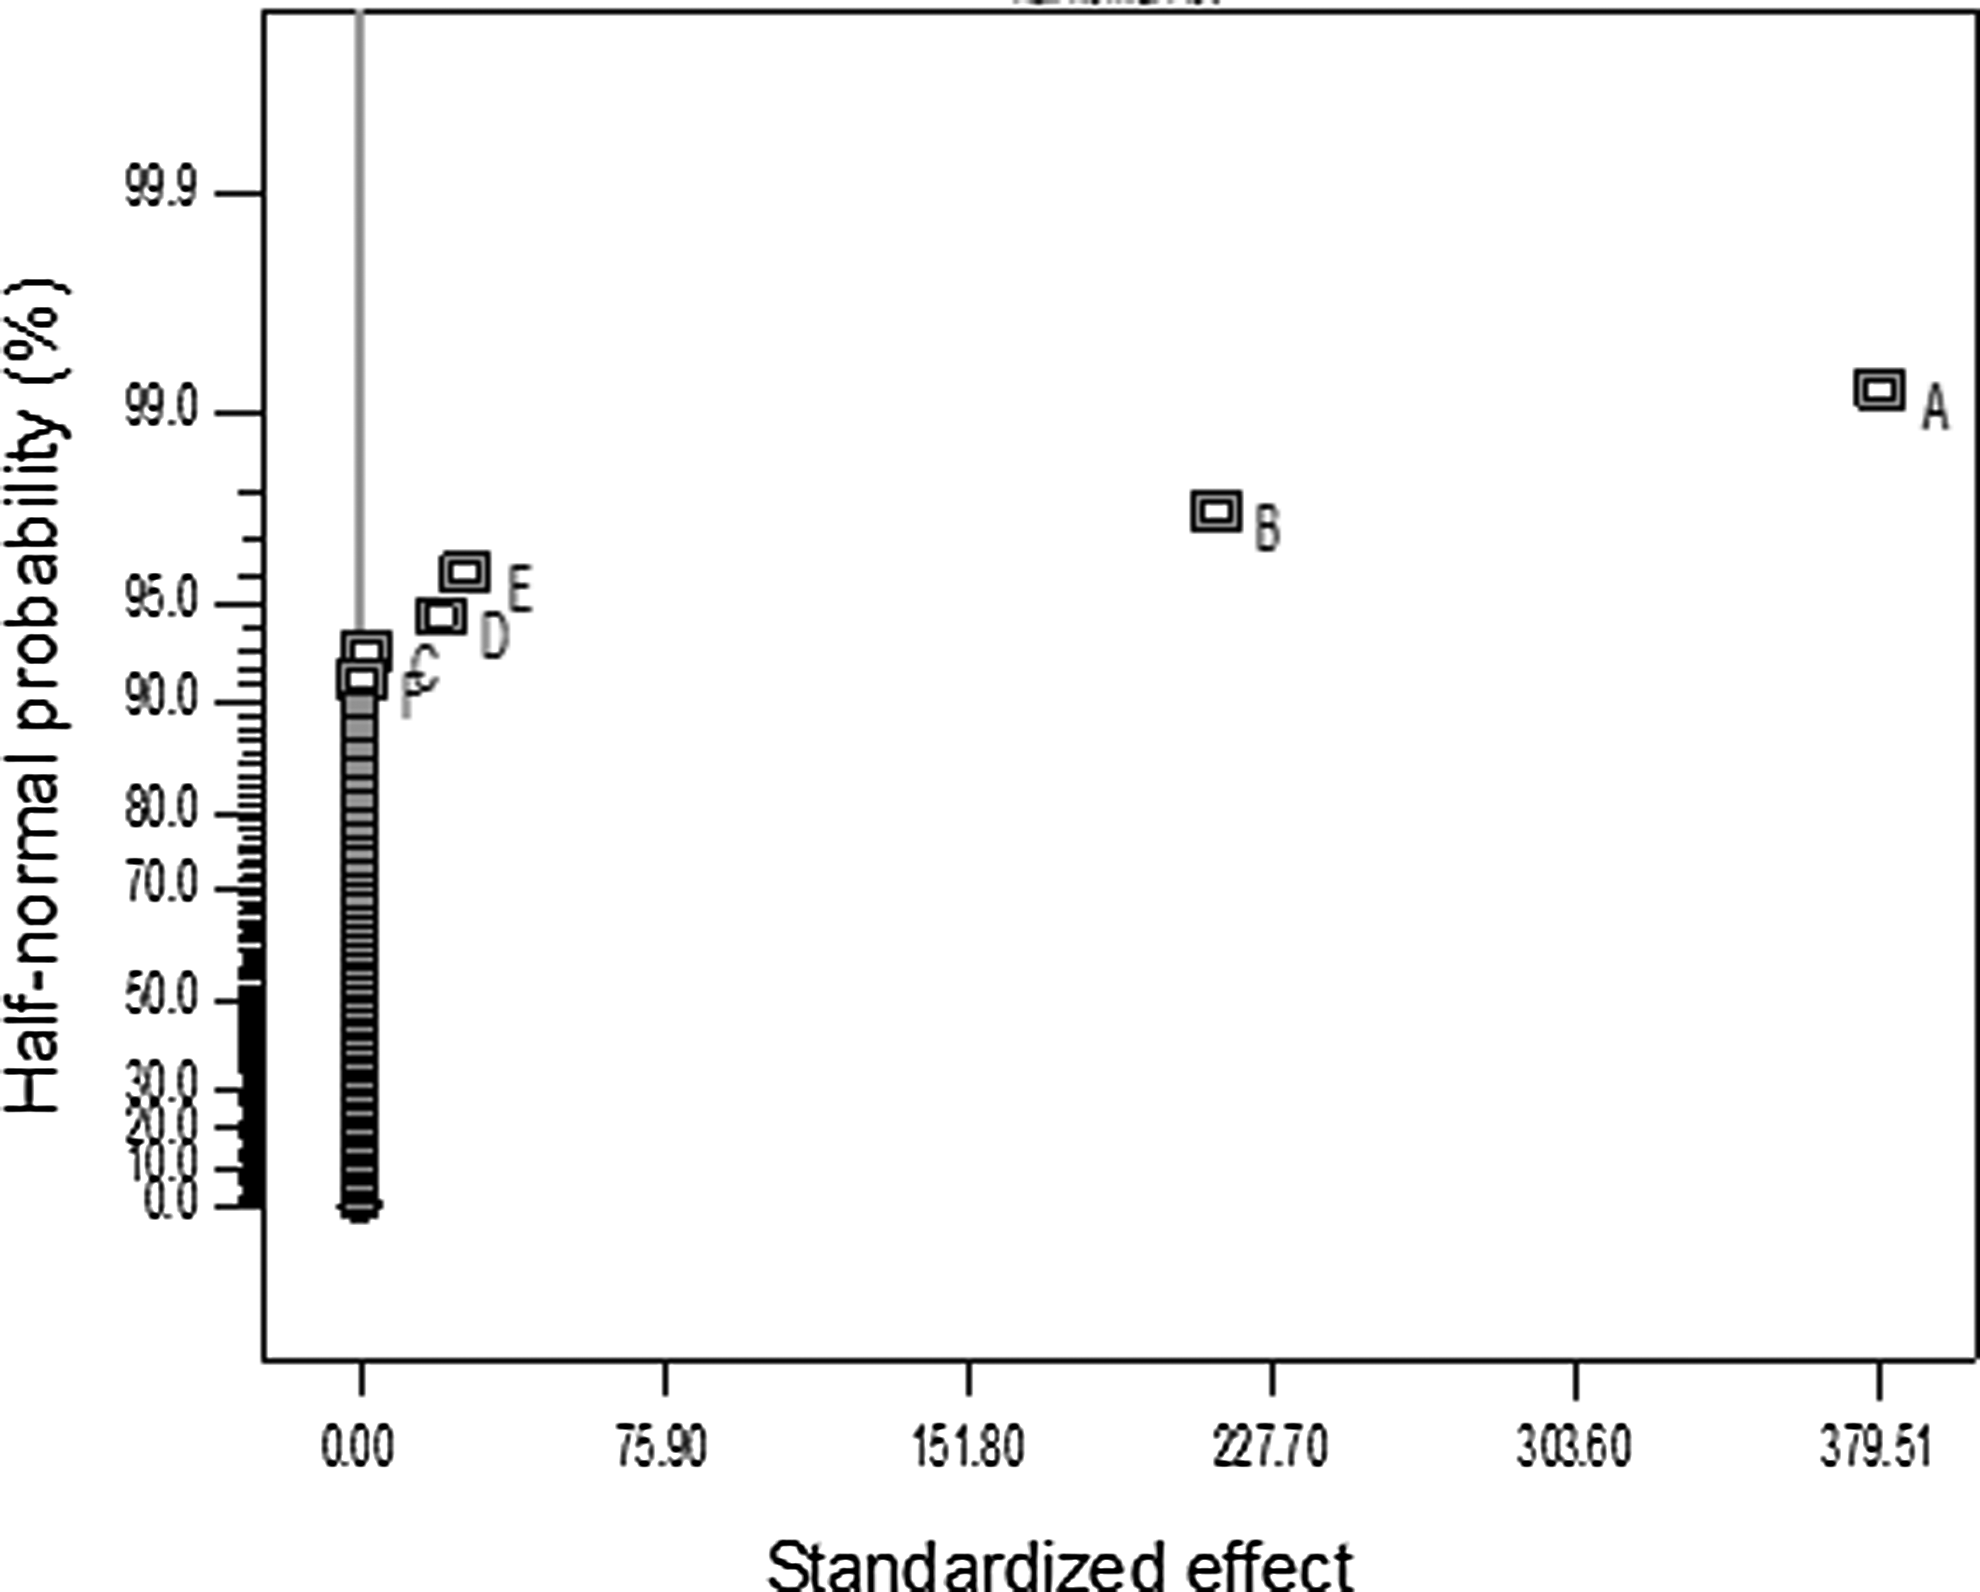
Half-normal plot of effects for total system cost.
Half-normal plot of effects for gross emission discharge.

Factors interactions effect plot matrix for actual emission.
From the above analysis, it could come to the conclusion that the proposed method is capable to deal with the uncertainties in the energy and environmental system, and provide effective planning for primary energy supply, power generation, capacity expansion, and emission control. It could also display the small imperfection in penalty design, thus provide reference for future decision-making.
Conclusions
In this study, a factorial based inexact stochastic programming was proposed for supporting energy and environmental system management under uncertainty. It can be used for examining various decision options associated with different levels of economic penalties when the promised policy targets are violated. Moreover, it can obtain optimal decisions of primary energy supply, electricity and thermal power generation, capacity expansion, and emission control schemes with the lowest system cost. The developed model has been applied to a case within a multifacility, multiperiod, and multidemand-level context to demonstrate the feasibility of the proposed method. A number of decision alternatives were generated under different scenarios of excessive emission, which could be used to provide an in-depth trade-off analysis between the economic objective and the system variables. Factorial analysis has been introduced into the optimization framework to address the key factors and their potential interactions within the system, and reveal the impact on system cost and pollution emission.
Compared with the conventional optimization methods, the proposed method could not only handle the uncertainties and complexities in the energy and environmental systems but also provide more detailed information regarding the effects of uncertain parameters and their interactions with the system performance. The results indicated that the proposed method can incorporate valuable uncertain information into the process of decision-making and generate flexible management schemes with different levels of system reliability. It also demonstrates that economic measures are not efficient for reducing coal usage due to the natural advantage of low cost and administrative regulation like total quantity control must be taken. Thus, the model would be helpful in specifying the planning for energy and environmental systems under social–economic–environmental requirements, as well as identifying the effectiveness of current regulations.
The proposed method has limitations when uncertainties are expressed as various forms such as probability distributions. In addition, impact factors at multiple levels could exist in large-scale problems within the systems. It thus suggests introducing multiple optimization methods and mix-level factorial designs into the framework. This will then extend the approach and facilitate further application.
Footnotes
Acknowledgments
This research was supported by the Fundamental Research Funds for the Central Universities (002/JB2016187), the Program for Innovative Research Team in University (IRT1127), the 111 Project (B14008), and the Natural Science and Engineering Research Council of Canada. This research was also supported by China Scholarship Council (CSC) during the visit of Z.L. to University of Regina. The authors thank the anonymous reviewers for their comments and suggestions that helped in improving the article.
Author Disclosure Statement
No competing financial interests exist.
Appendix
| Variables | |
| i | Energy resources, represents coal, diesel, natural gas, wind power, solar power, respectively |
| t | Index for time period |
| n | Capacity expansion options |
| m | Excess emission level |
| j | End user, represents industrial, agricultural and municipal/commercial, respectively |
| Parameters | |
|
|
Cost for purchasing energy i in period t ($/tonne) |
|
|
Average maintenance costs for CHP plant of energy type i in period t ($/kWh) |
|
|
Average heating costs for energy type i in period t (104$/GJ) |
|
|
Allocated amount for energy i in period t (tonne) |
|
|
Electricity generation from energy type i in period t (kWh) |
|
|
Thermal energy generation from energy type i in period t (GJ) |
|
|
Average capital costs of CHP facilities expansion for energy i with option n (103$/MW) |
|
|
Average capital costs of heating facilities expansion for energy i with option n (103$/MW) |
|
|
Expansion capacity of CHP plant for energy i with option n (MW) |
|
|
Expansion capacity of backup heating plant for energy i with option n (MW) |
|
|
Binary variables of CHP plant expansion for energy i with option n |
|
|
Binary variables of backup heating plant expansion for energy i with option n |
|
|
Average capital costs for SO2 disposal of energy i in period t ($/tonne) |
|
|
Penalty costs for excess SO2 emission in period t ($/tonne) |
|
|
SO2 removal efficiency for energy i |
|
|
Quantity of SO2 discharge of energy i in period t (tonnes) |
|
|
Quantity of excess SO2 discharge of energy i at level m in period t (tonnes) |
| qm | Probability of excess emission level m occurrence |
|
|
Generation efficiency for CHP plant of energy i in period t (tonne/kWh) |
|
|
Generation efficiency for backup heating plant of energy i in period t (tonne/GJ) |
|
|
Conversion ratios from energy i to electricity in period t (TJ/GWh) |
|
|
Calorific value of energy i |
|
|
Availabilities of energy resources i in period t (TJ) |
|
|
Electricity demand for end user j in period t (kWh) |
|
|
Heating demand for end user j in period t (GJ) |
|
|
Heat-to-electric ratio for energy i |
|
|
Installed capacity of CHP plant for energy i before expansion (MW) |
|
|
Installed capacity of backup heating plant for energy i before expansion (MW) |
|
|
Conversion coefficient of power generation capacity to electricity |
|
|
Conversion coefficient of power generation capacity to thermal energy |
|
|
Pollutants producing coefficient for energy type i |
| MP | SO2 emission standard at level m in period t (tonnes) |
CHP, combined heat and power.