




Abstract
Abstract
The work presents the results of the measurements of mass concentrations of fine particulate matter (PM2.5) and water-soluble ions (sulfates SO42−, nitrates NO3− as well as ammonium NH4+, sodium Na+, chlorine Cl−, potassium K+, calcium Ca2+, and magnesium ions Mg2+) in PM2.5. The analysis regarded PM2.5 samples collected in three different measurement sites in Poland: Trzebinia (urban background), Szczecin (urban background), and Złoty Potok (regional background). The research was conducted during heating (Jan–Mar) and nonheating (May–Jul) seasons of 2013. PM was sampled by the medium-volume samplers, and the concentrations of the ions in PM2.5 were analyzed by ion chromatography. Clear spatiotemporal variability of PM2.5 concentrations was observed, with higher levels recorded during the heating period. Average PM2.5 concentrations over the entire measurement period equaled 17.11, 25.21, and 25.16 μg/m3 in Szczecin, Trzebinia, and Złoty Potok, respectively. Ionic composition of PM2.5 from all stations was dominated by SO42−, NO3−, and NH4+ ions. The total share of these ions was ∼78%, ∼85%, and ∼89% of the mass of all analyzed ions, and it was ∼34%, ∼30%, and ∼18% of the PM2.5 mass in Szczecin, Trzebinia, and Złoty Potok, respectively. Contribution of secondary inorganic ions in the PM2.5 mass was relatively stable in the heating and nonheating seasons, although the shares of individual inorganic ions in PM2.5 displayed seasonal differences. It was found that seasonal variability of PM2.5 concentrations, as well as concentrations and contributions of PM2.5-related components was related with the impact of weather conditions and the changes in the intensity of the emission sources of PM2.5 and its precursors.
Introduction
A
Although the influence on the amount and properties of the first type is possible through the control particle emissions, the features, both physical and chemical, of the second type are very difficult to control. Secondary aerosol is formed as a result of physicochemical, including photochemical, reactions (Seinfeld and Pandis, 2006) and, therefore, its amount in ambient air can be influenced only through regulation of the amounts of gaseous precursors emitted into the air (Alastuey et al., 2004; Squizzato et al., 2012; EEA, 2015).
Sulfur dioxide (SO2), ammonia (NH3), and nitrogen oxides (NOx) are the precursors for sulfuric acid (H2SO4), ammonium hydrogen sulfate (NH4HSO4), ammonium sulfate ((NH4)2SO4), and ammonium nitrate (NH4NO3) (Seinfeld and Pandis, 2006; Squizzato et al., 2012). The listed compounds are the main components of the secondary inorganic aerosol (SIA). Volatile organic compounds also undergo transformation, mainly in photochemical reactions, in which secondary organic aerosol (SOA) particles are formed; some of them aggregate and create bigger particles (Castro et al., 1999; Zhang and Ying, 2012).
Formation of SIA and SOA in the air is, to a great extent, dependent on the availability of gaseous precursors (Alastuey et al., 2004; Squizzato et al., 2012). The formation mechanism of a secondary aerosol is also strongly influenced by meteorological conditions, including wind velocity, air temperature, atmospheric pressure, and precipitation (Pay et al., 2012; Squizzato et al., 2012).
Previously conducted research has revealed that the share of SIA in the mass of fine aerosol particles (PM2.5; particles with aerodynamic diameter ≤ 2.5 μm) in the cities located in southern Poland averaged ∼33% during an entire year; whereas in the cities of northern Poland, it did not exceed 25% (Rogula-Kozłowska et al., 2014a). It has also been shown that higher SIA and SOA contents in PM2.5 mass are observed usually in nonurban regions, rather than in big cities (Rogula-Kozłowska and Klejnowski, 2013; Witkowska et al., 2016).
To determine the statistical relationships between the emission, topographical and meteorological conditions, and the contents of SIA in the air of various regions, it is necessary to collect a great amount of data, with the highest time resolution possible. In Poland, regarded in Europe as a significant “emitter” of secondary aerosol precursors (Spindler et al., 2013; Pokorná et al., 2015), the investigation of SIA and SOA contents in PM should be carried out at least in all measurement sites where air quality is routinely monitored.
Numerous research studies conducted during the past decades within Europe have shown that PM2.5 chemical composition is determined mainly by the following emission sources: combustion of fuels in vehicle engines, local industrial activity, and chemical transformations of PM in the atmosphere (Viana et al., 2008; Putaud et al., 2010; Belis et al., 2013; Calvo et al., 2013; EEA, 2015). In Poland, regardless of localization, the main source of primary fine particulate matter and its gaseous precursors is energy production based on coal and lignite combustion (EMEP, 2013; EEA, 2015). In addition to large point sources, small combustion sources, for example, households, strongly influence air pollution by aerosol particles in various areas of the country (EMEP, 2013).
It should be noted that the combustion processes in households include not only coal combustion but also combustion of other materials, such as biomass or domestic wastes. This is observed especially within rural areas, where, due to the increasing prices of oil, electricity, and natural gas, people tend to return to traditional and cheaper fuels (Braniš et al., 2007; Rogula-Kozłowska and Klejnowski, 2013; Kupri et al., 2016; Błaszczak et al., 2016b).
The earlier mentioned emission sources result in considerably different chemical characteristics of PM from Polish measurement sites in comparison with other European sites (Błaszczak et al., 2016b). Moreover, the clear seasonal pattern of the emission sources activity should be kept in mind. In Poland, the increased energy demand in the cold (heating) season (October–March) results in the increase of PM and its gaseous precursor emissions from fossil fuel combustion and biomass burning (Rogula-Kozłowska et al., 2014a).
With regard to the earlier considerations, the main goal of this work was to analyze daily concentrations and ionic composition of PM2.5. The research was oriented at the assessment of the secondary inorganic matter contents in PM2.5 samples from selected locations, representing both urban (Szczecin, Trzebinia) and regional (Złoty Potok) background sites. The spatial and seasonal variability of SIA was investigated as well as its relationship with other PM2.5 components and selected meteorological parameters.
Methods
The research material included archival PM2.5 samples collected at three measurement stations, belonging to the National Environment Monitoring network (Fig. 1), and located in Szczecin, Trzebinia, and Złoty Potok (Table 1). The sites selected for the analysis differ significantly with regard to their topographical and emission conditions:
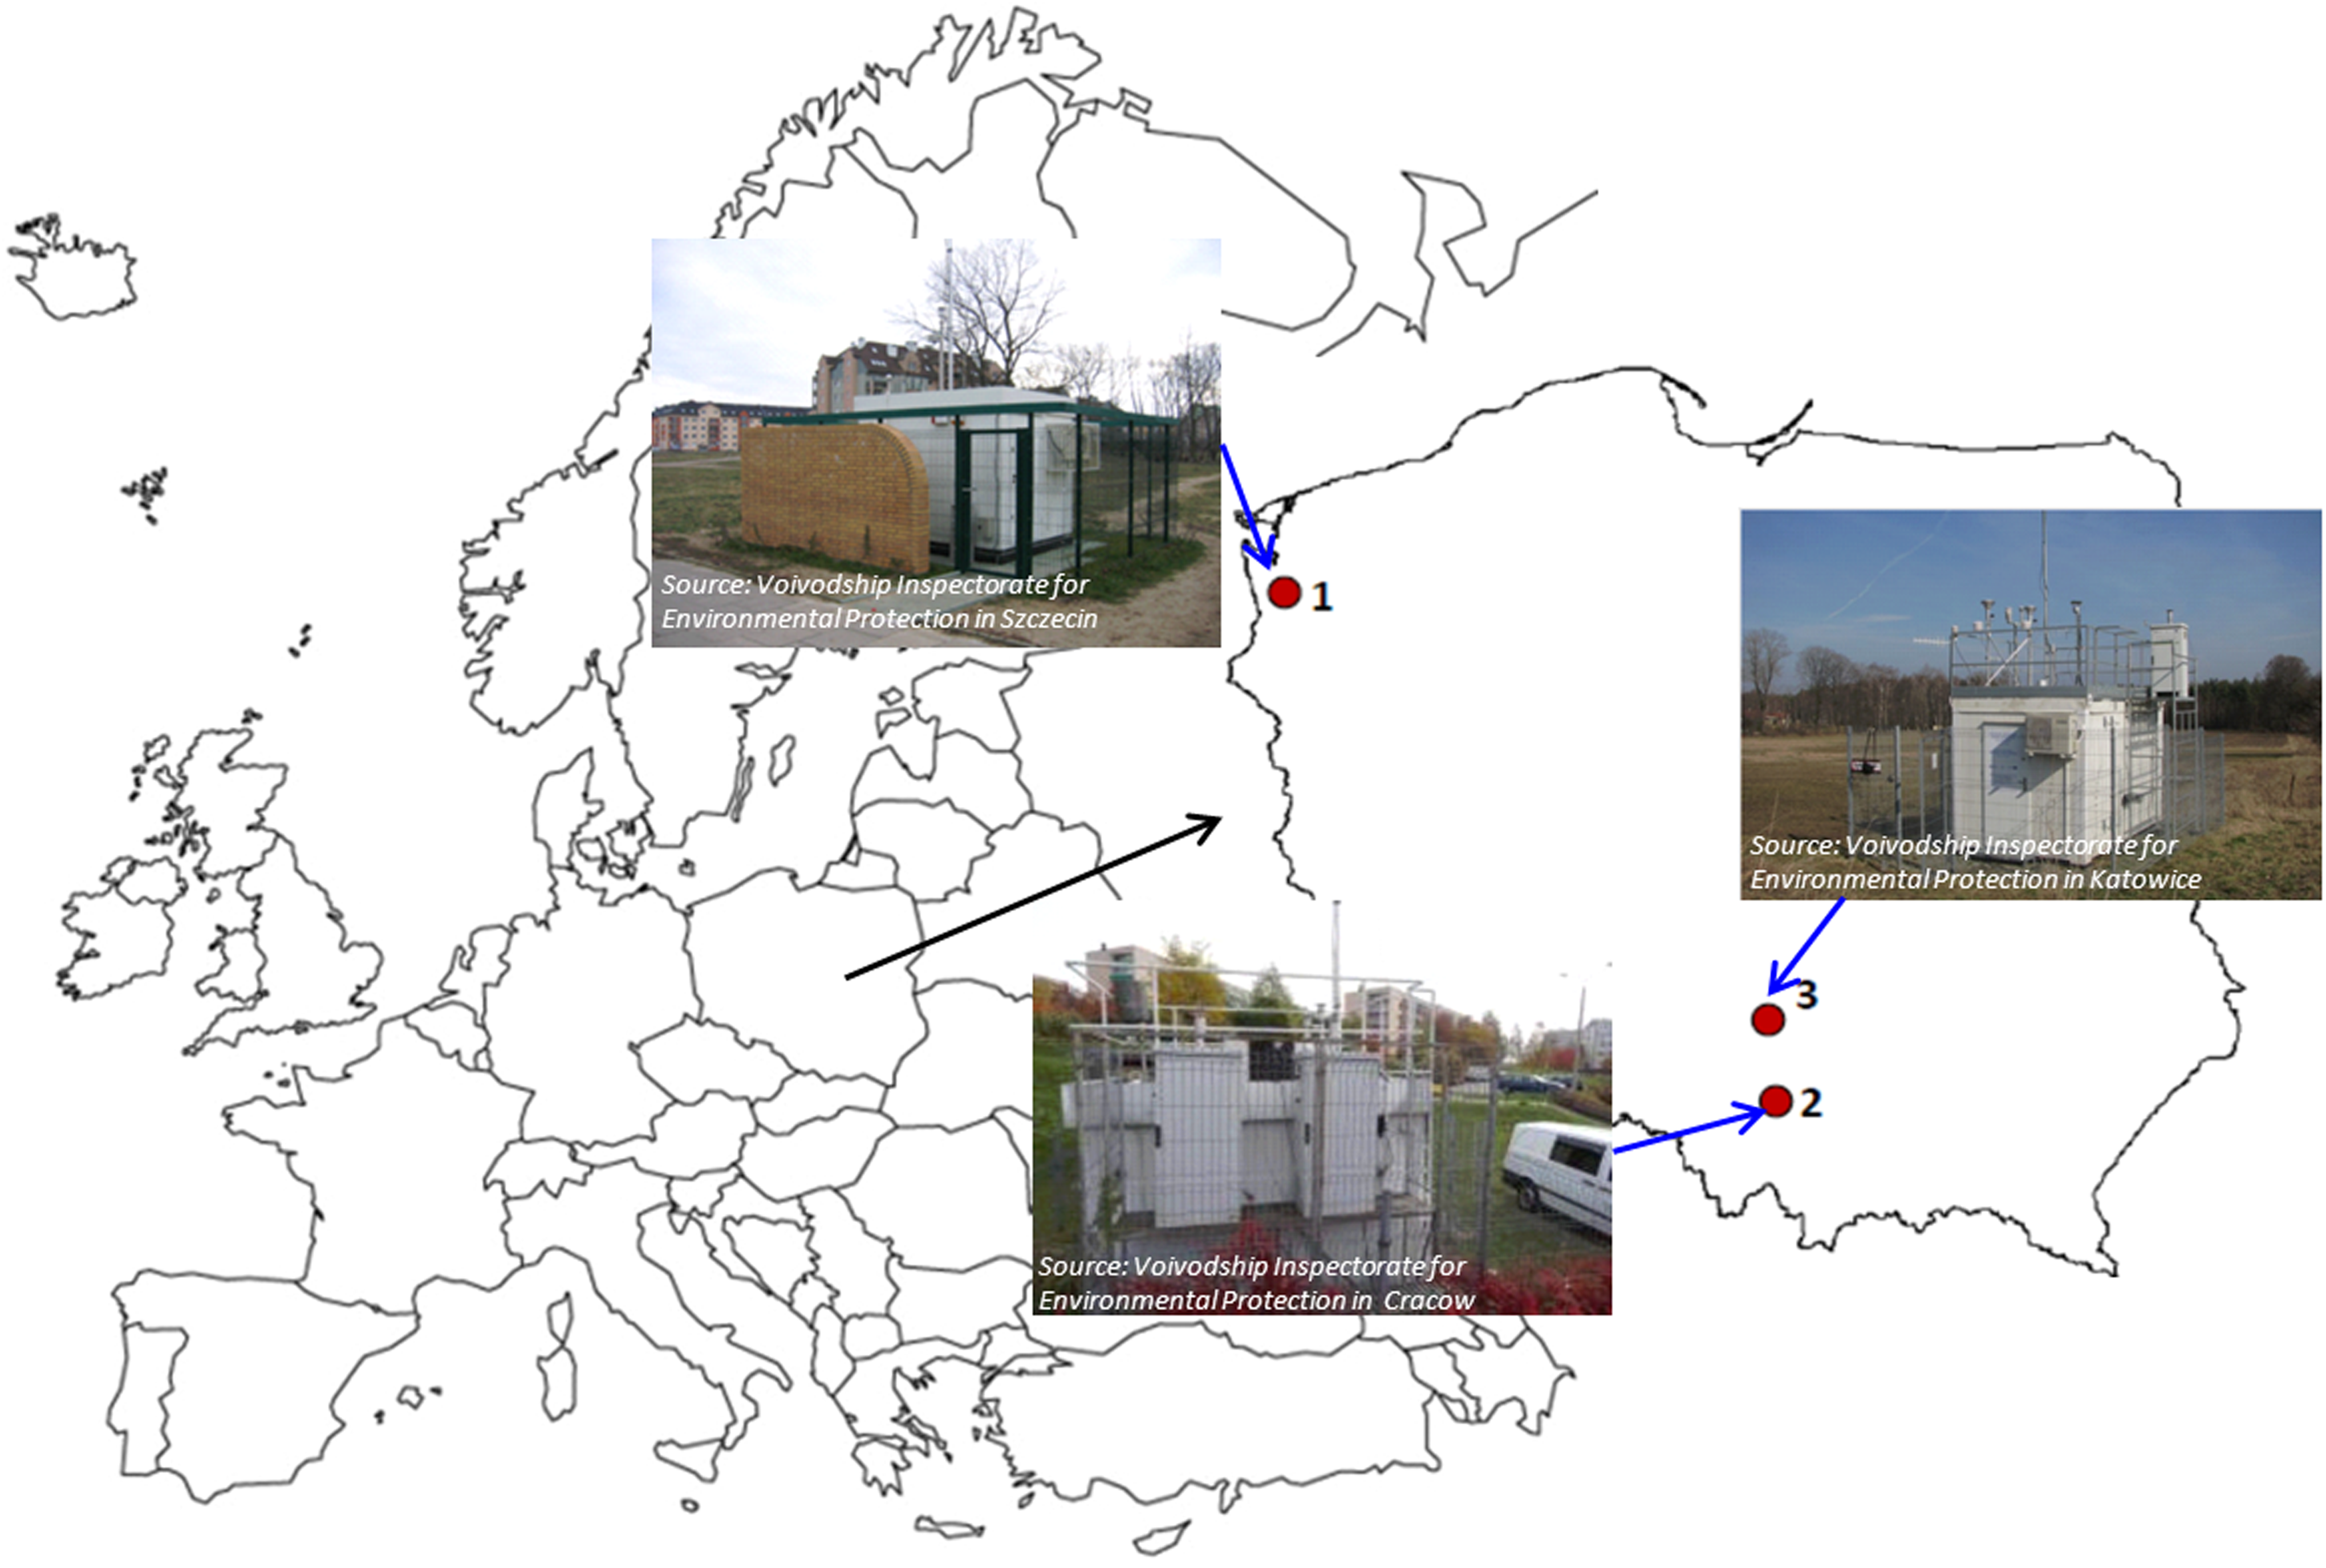
Location of measurement sites. (1–Szczecin, 2–Trzebinia, 3–Złoty Potok).
The values of meteorological parameters are given separately for the two periods: heating season/nonheating season.
n, number of samples.
Trzebinia is an industrial city located in the north-western part of the Lesser Poland voivodship, not very distant from big economic centers: Katowice (36 km) and Cracow (37 km). The surroundings of the station consist mainly of single-family and multi-family housings, and, therefore, the main local sources of pollutants are the household furnaces.
The station in the suburbs of Szczecin is located in the area that is influenced by industry, local heating sources, road transport, and the Baltic Sea. In the closest neighborhood, there are multi-story residential buildings, built along access roads.
The station located in Złoty Potok is under the influence of urban-industrial pollutants from various areas of the Upper Silesian Agglomeration. In the proximate surroundings of the station, there are grasslands and agrarian fields.
Analyses included two measurement periods, covering the first part of the year 2013 and representing the heating (Jan–Mar) and nonheating (May–Jul) seasons (Table 1). Rationales for such division are the differences of ambient air temperatures between the seasons and the related difference in energy consumption (Błaszczak et al., 2016b).
PM2.5 samples were collected in daily cycles on quartz-fiber filters (Whatman QMA, 47 mm in diameters), with the use of medium-volume samplers: MicroPNS15 (Umwelttechnik MCZ GmbH) (Trzebinia, Szczecin) and PNS 3D15 (Atmoservice) (Złoty Potok). Meteorological conditions for the three measurement sites have been described based on observational data from stations belonging to the Institute of Meteorology and Water Management–National Research Institute (IMWM-NRI), which are representative for Szczecin, Trzebinia, and Złoty Potok. Wind speed and direction data were available on an hourly basis, and 24 vector averages were computed to be able to compare wind direction data with daily concentrations of PM2.5 and its chemical constituents.
Meteorological conditions during the study, presented in Table 1, were typical for considered areas and do not differ from the values of the reference series for the years 1981–2010. The wind roses for the sampling sites (Fig. 2) indicated the two main wind regimes. Winds blowing from the NE (Szczecin, Trzebinia) and E (Złoty Potok) prevail during the heating period, and winds from SW (Szczecin, Trzebinia) and NW (Złoty Potok) prevail during the nonheating period.

Wind roses for each location per heating and nonheating period.
Mass concentrations of PM2.5 were analyzed gravimetrically, in the laboratories of the respective Voivodship Inspectorates of Environmental Protection, according to the requirements of the PN-EN 14907:2006 standard. The contents of selected ions (NO3−, SO42−, NH4+, Cl−, Na+, K+, Mg2+, Ca2+) in PM2.5 were measured by ion chromatography. An ion chromatograph equipped with a conductometric detector, produced by Metrohm (Herisau Metrohm AG), was used for the analysis. The details regarding the analysis, as well as the parameters obtained during the validation process of the research procedure are described by Rogula-Kozłowska et al. (2014a).
For analyses of the OC and EC contents in the 24-h PM2.5 samples, the thermal-optical method was used (carbon analyzer manufactured by Sunset Laboratories, Inc.; “eusaar 2” protocol). The results have been presented in Błaszczak et al. (2016a) and partially in Błaszczak et al. (2016b). The details of the thermal-optical method were specified elsewhere (Rogula-Kozłowska and Klejnowski, 2013; Rogula-Kozłowska et al., 2014a).
To examine the seasonal variation of concentrations of PM2.5 and of the related compounds, the nonparametric U Mann–Whitney test was used (α = 0.05). The relationships between PM2.5, its main components, and meteorological parameters in three measurement stations were investigated by using the Spearman's rank correlation (α = 0.05). For all statistical analyses, the software package Statistica 12.0 (Stat Soft company) was used.
Discussion of the Results
Concentration and ionic composition of PM2.5
Average daily PM2.5 concentrations ranged from 4.54 to 77.55 μg/m3, from 7.66 to 88.79 μg/m3, and from 8.90 to 120.77 μg/m3, respectively, for the sites in Szczecin, Trzebinia, and Złoty Potok. The lowest concentrations of PM2.5 were recorded in Szczecin (averaging 17.11 μg/m3), which can be explained by the location of a measurement station in the coastal area and the impact of clean marine air masses, which have lower aerosol loadings (Czarnecka et al., 2011).
PM2.5 concentrations in the urban background site in Trzebinia and the regional background site in Złoty Potok were comparable. The mean values for the entire measurement period equaled 25.21 μg/m3 (Trzebinia) and 25.16 μg/m3 (Złoty Potok), and they slightly exceeded the limit value for the average annual concentration of PM2.5 (25 μg/m3), established by the European Commission (Directive 2008/50/EC).
Clear seasonal patterns of PM2.5 have been observed in all of the three measurement sites (Table 2), with higher levels occurring during the heating season, similar to many other locations in Europe (Putaud et al., 2010). The nonparametric U Mann–Whitney test (α = 0.05) has shown that the differences between the daily PM2.5 concentrations in both measurement periods were statistically significant.
Concentrations expressed in ng/m3.
H, heating season; NH, nonheating season; H/NH, the ratio of the average concentration in the heating season to the concentration in the nonheating season (bold and underlined type indicates statistically significant differences between daily averaged concentrations recorded during heating and nonheating period, the nonparametric U Mann–Whitney test; α = 0.05); nss-SO42−–nonsea salt sulfates; ([nss-SO42−] = [SO42−]–0.246·[Na+] (Sillanpää et al., 2006); SIA, secondary inorganic aerosol, [SIA] = [nss-SO42−] + [NO3−] + [NH4+] (Sillanpää et al., 2006); SOC, secondary organic carbon; POC, primary organic carbon (the methodology briefly describing the determination of SOC and POC content was presented in the section Evaluation of the secondary inorganic aerosols share in the PM2.5 mass).
The cause of the observed variability lies in the increased activity of stationary emission sources (combustion of fossil fuels and biomass) in the cold season, as well as in unfavorable weather conditions during this period (shallow mixing layer, frequent temperature inversions), which hinder the diffusion and removal of contaminants (Pastuszka et al., 2010; Rogula-Kozłowska et al., 2014a, 2014b; Reizer and Juda-Rezler, 2016). Low concentrations of PM2.5 during the nonheating season are likely associated with the occurrence of more frequent and intense precipitation (Table 1), and a deeper mixing layer (Cong et al., 2011; Pateraki et al., 2014).
Figure 3 shows the percentage of the analyzed ions in PM2.5 along with the carbon compounds contained in PM2.5; carbon matter concentrations in these locations are described in Błaszczak et al. (2016a, 2016b). It has been found that besides the total carbon (TC) (expressed as the sum of elemental [EC] and organic carbon [OC]), the ions have a predominant share of the total mass of PM2.5 in each location.

Contribution of selected ions in PM2.5 mass, along with other PM2.5 constituents, for each location per heating and nonheating season (Other mass is calculated as the difference between the measured PM2.5 mass and OC, EC, and inorganic ions.).
The largest share of other substances, namely the matter unidentified neither as the carbon compounds nor as the analyzed ions, was noted for the PM2.5 samples from Złoty Potok (Fig. 3). Probably, in all locations, the unidentified part of the PM mass consisted of water particles associated with PM (Rogula-Kozłowska et al., 2013a), and of a number of elements not analyzed within the present work, that is, noncarbon elements associated with organic matter in aerosol (Putaud et al., 2010; Chow et al., 2015).
Total concentrations of the analyzed ions (seasonal average) in the heating season were more than two-fold higher in comparison to the nonheating season (Table 2). The differences between the average contributions of all the analyzed ions in PM2.5 mass during both measurement periods were also recorded. The seasonal difference was more visible in the case of Trzebinia, and it was less clear for Szczecin and Złoty Potok (Fig. 3). In the heating season, the ion concentrations were lower than the concentration of total carbon (OC + EC), in contrast to the nonheating period, in which the noted ion concentrations were slightly higher (except for the Złoty Potok site). For most ions (with the exception of sulfate ions in Szczecin and Trzebinia), the seasonal differences were statistically significant (U Mann–Whitney test, α = 0.05) (Table 2).
The greatest seasonal differences have been reported in the case of Cl− in Trzebinia and K+ in Szczecin. The mean concentrations of the earlier mentioned ions were more than nine times higher in the heating season than in the nonheating season. The Cl− ions bounded with PM2.5 may have come from a variety of sources; however, in the urban area, they are primarily of anthropogenic origin (e.g., Rogula-Kozłowska et al., 2011, 2013a, 2013b; Pant et al., 2015). Numerous scientific publications highlighted that important sources of Cl− ions in PM2.5 are combustion processes, including coal and waste combustion, as well as wood burning (e.g., Richard et al., 2011; Rogula-Kozłowska et al., 2013b; Pant et al., 2015; Shen et al., 2016).
The water-soluble potassium is used as a tracer for biomass burning (Röösli et al., 2001; Vasconcellos et al., 2007; Pant et al., 2015). Fresh wood smoke contains, apart from K+ ions, also Ca2+, Mg2+, Na+, NH4+, Cl−, NO3−, and SO42− (Jacobson, 2002; Vasconcellos et al., 2007). Taking into account these considerations, the results of this study suggest an important role of combustion sources, including biomass burning, for the air quality in considered areas.
PM2.5 in the selected locations differed with regard to the ionic composition; the highest concentrations of ions were recorded in Trzebinia, located in a highly industrialized and populated area, and the lowest concentrations were recorded in Złoty Potok. Despite the spatial differences in the ion concentrations, there is a clear dominance of three ions, that is, sulfate (SO42−), nitrate (NO3−), and ammonium (NH4+), in the mass of detected compounds in the PM2.5 samples from all locations (Table 2 and Fig. 3). The mean concentrations of other analyzed ions were significantly lower and did not exceed 1 μg/m3 (Table 2). Attention should be paid to the relatively high concentrations of Cl− in Trzebinia, especially during the heating season.
Total shares of the sulfate, nitrate, and ammonium ions, averaged over the entire measurement period, were equal to ∼78%, ∼85%, and ∼89% of all the analyzed ions in Szczecin, Trzebinia, and Złoty Potok, respectively. Among them, the highest concentrations in the air were observed for the SO42− ions, with average shares in PM2.5 mass amounting to 11.14% and 19.01% (Szczecin), 11.38% and 21.70% (Trzebinia), and 8.99% and 11.34% (Złoty Potok) during the heating and nonheating seasons, respectively (Table 2 and Fig. 3).
The concentration of NO3− was generally lower, and its average share ranged from 4.31% (nonheating season, Złoty Potok) to 13.47% (heating season, Szczecin). The concentration of NH4+ was generally low, as compared with SO42− and NO3− (except from the nonheating season in Trzebinia), with an average share ranging from 1.78% (nonheating season, Złoty Potok) to 7.26% (heating season, Trzebinia).
Evaluation of the SIA share in PM2.5 mass
Due to the fact that the amount of ammonium ions in the air is the major limiting factor in the formation of SIA, as they neutralize both NO3− and SO42− ions in the air (Erisman and Schaap, 2004), the evaluation of the SIA contents in PM should be carried out after the assessment of the ion balance between the sum of nitrate and sulfate ions, and the ammonium ions. It is worth mentioning that in the assessment of the SIA content in PM, the concentration of nonsea salt sulfates (nss-SO42−) should be taken into account, thereby eliminating the impact of the sea-salt sulfates (ss-SO42−) on the results. In the present work, the amount of nss-SO42− was calculated according to the following formula (Sillanpää et al., 2006):
Average concentrations of nss-sulfates, separately for heating and nonheating periods, were presented in Table 2, for each location. During the whole measurement period, the concentrations of nss-SO42− averaged: 2.05 μg/m3 (Szczecin), 3.83 μg/m3 (Trzebinia), and 2.25 μg/m3 (Złoty Potok). The analysis of the graph of the linear regression between the sum of the NO3− + nss-SO42− ions and the NH4+ (in μeq/m3) † for the entire measurement period reveals that there is a strong (high determination coefficients [R2]) linear relationship between these two parameters (Fig. 4). The value of the linear regression coefficient for all locations is close to 1, which indicates that the ammonium ions almost completely neutralize the NO3− + nss-SO42− ions. Therefore, it allows the calculation of SIA concentration as the sum of the NH4+, NO3−, and nss-SO42− concentrations (Erisman and Schaap, 2004; Squizzato et al., 2012).
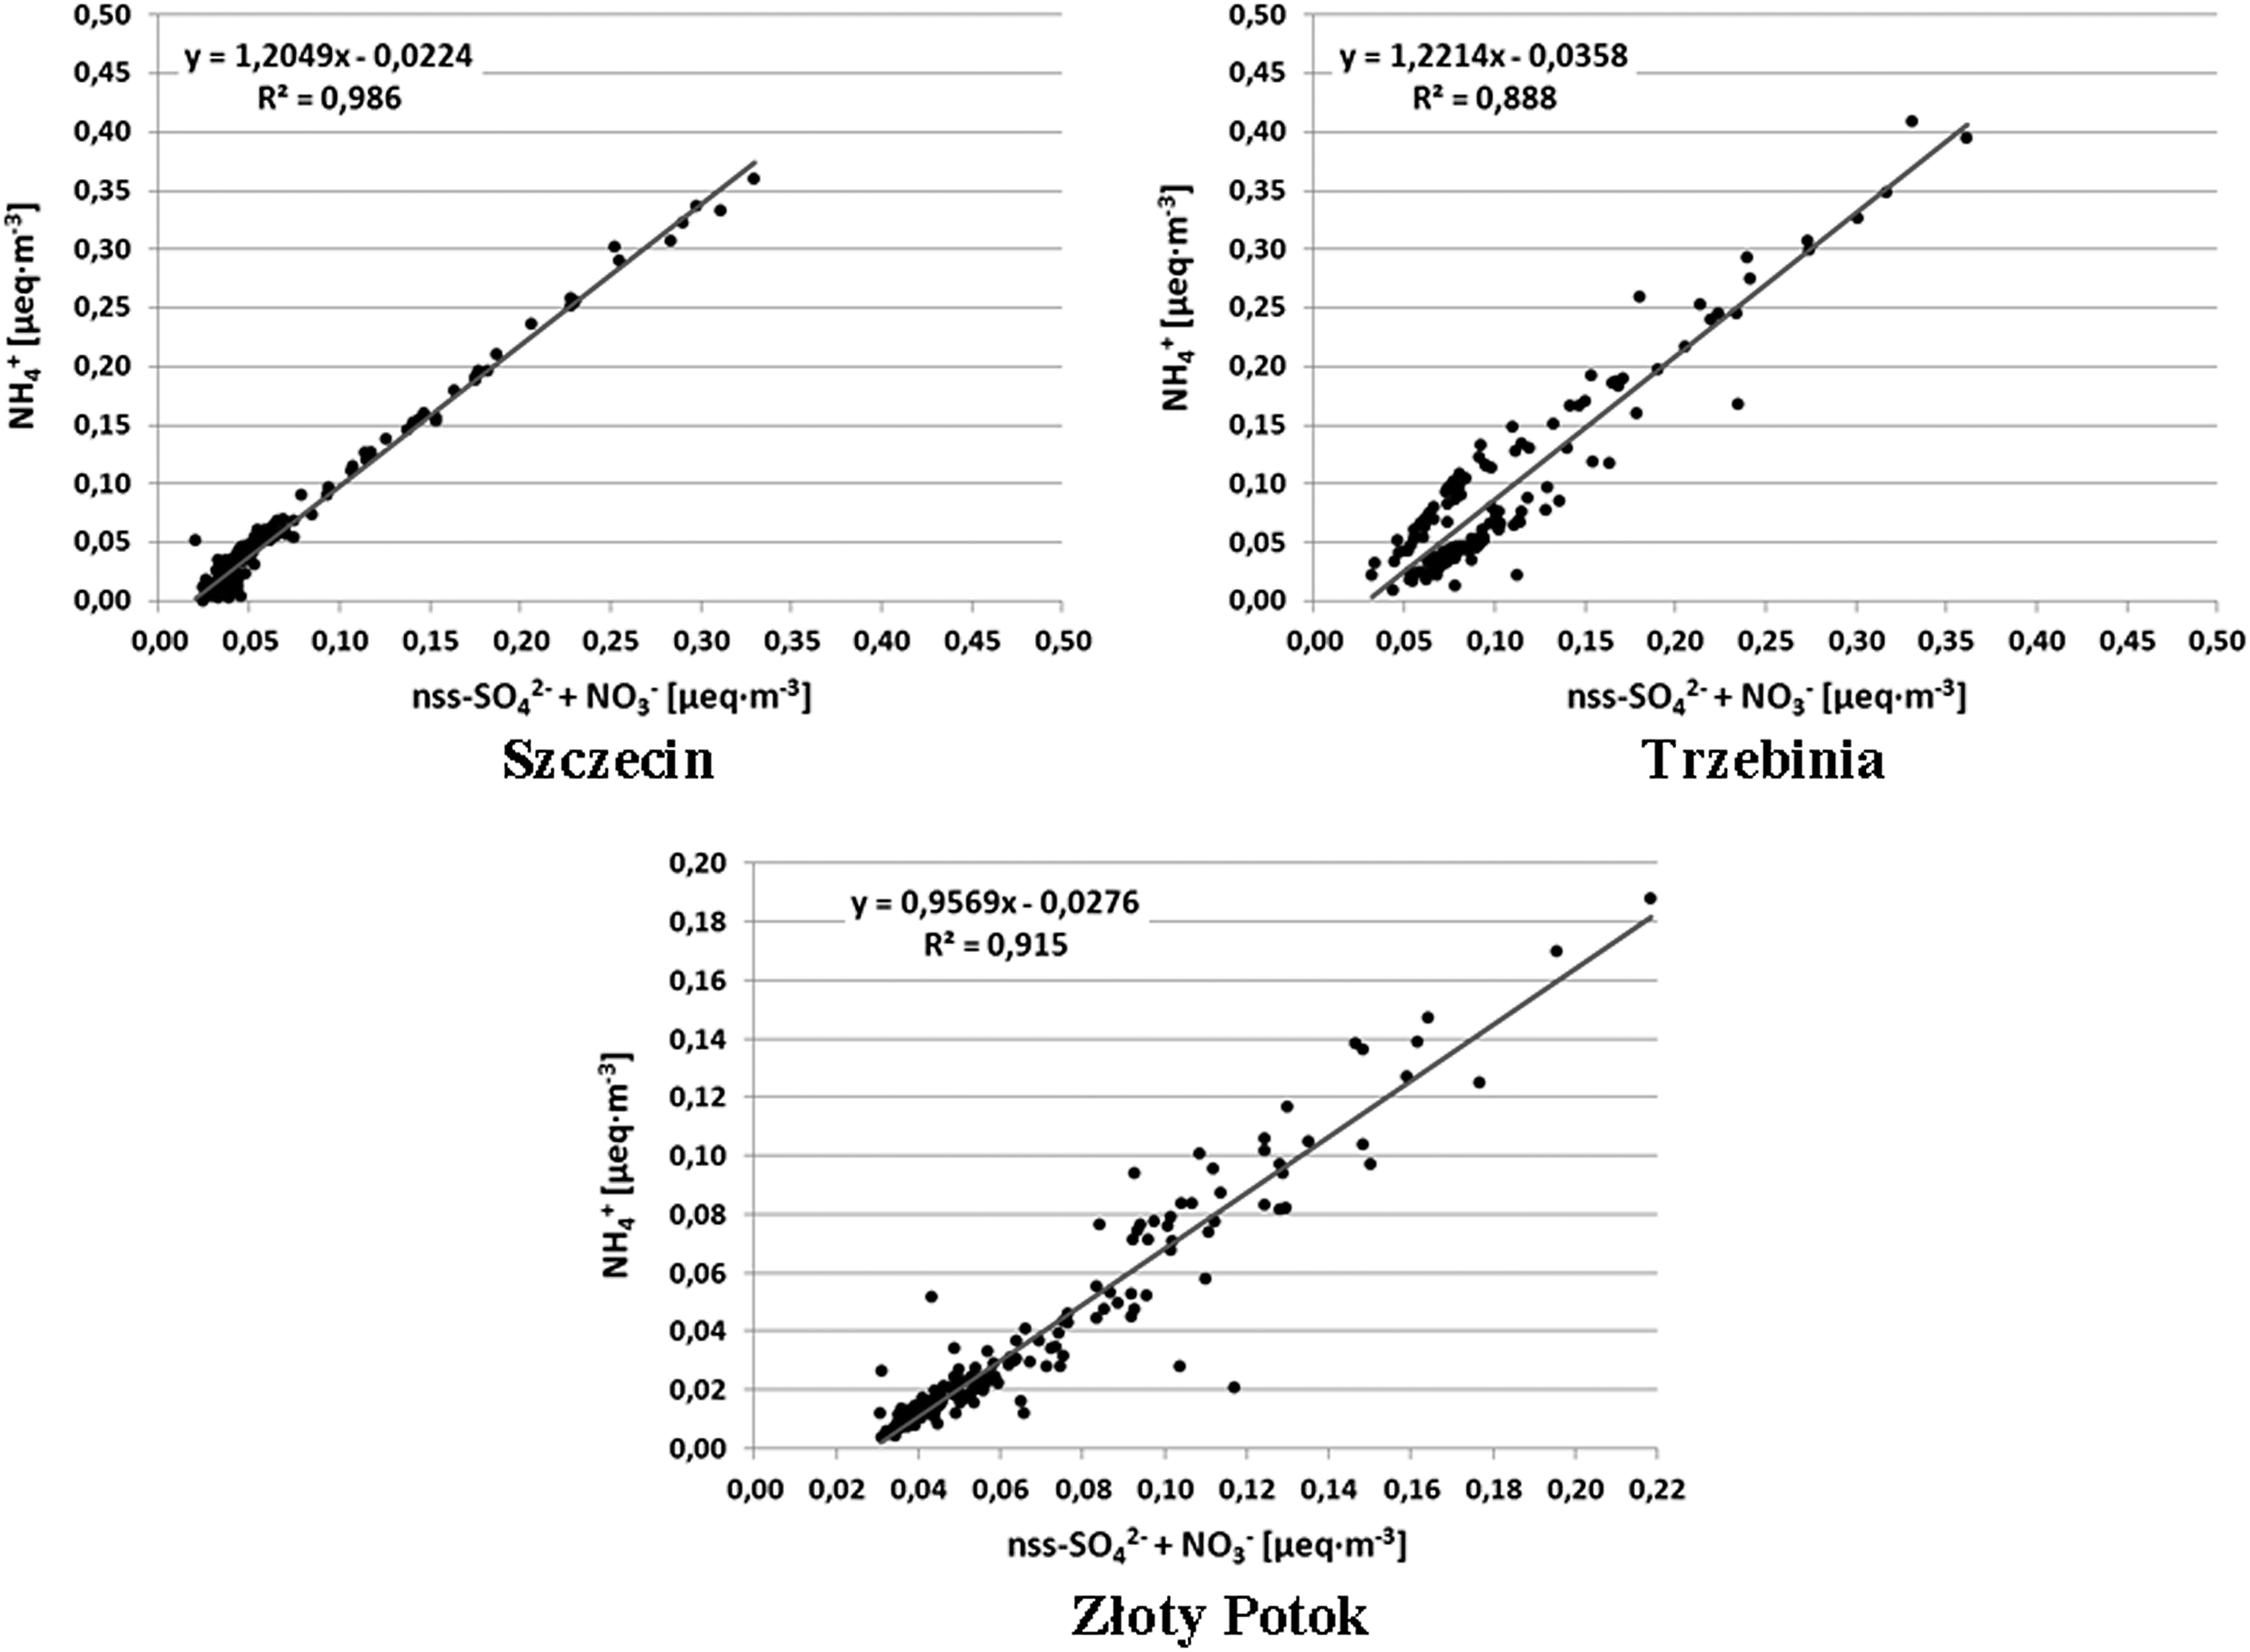
Linear relationship between the NH4+ ions and the sum of nss-SO42− + NO3− for each location.
The concentrations and shares of SIA in PM2.5 were compared with secondary organic carbon concentrations and contributions. The levels of the secondary and primary organic carbon (SOC and POC, respectively) were calculated according to the methodology proposed by Castro et al. (1999):
where (OC/EC)pri is the ratio of primary OC to EC. To estimate (OC/EC)pri, the least-squares regression was performed for 10% of the samples with the lowest 24-h OC/EC ratio (Strader et al., 1999) (Fig. 5). The regression slope represents the ratio of the primary OC to EC (OC/EC)pri. The results of SOC and POC determination in PM2.5 from selected measurement sites have already been presented in Błaszczak et al. (2016a, 2016b).
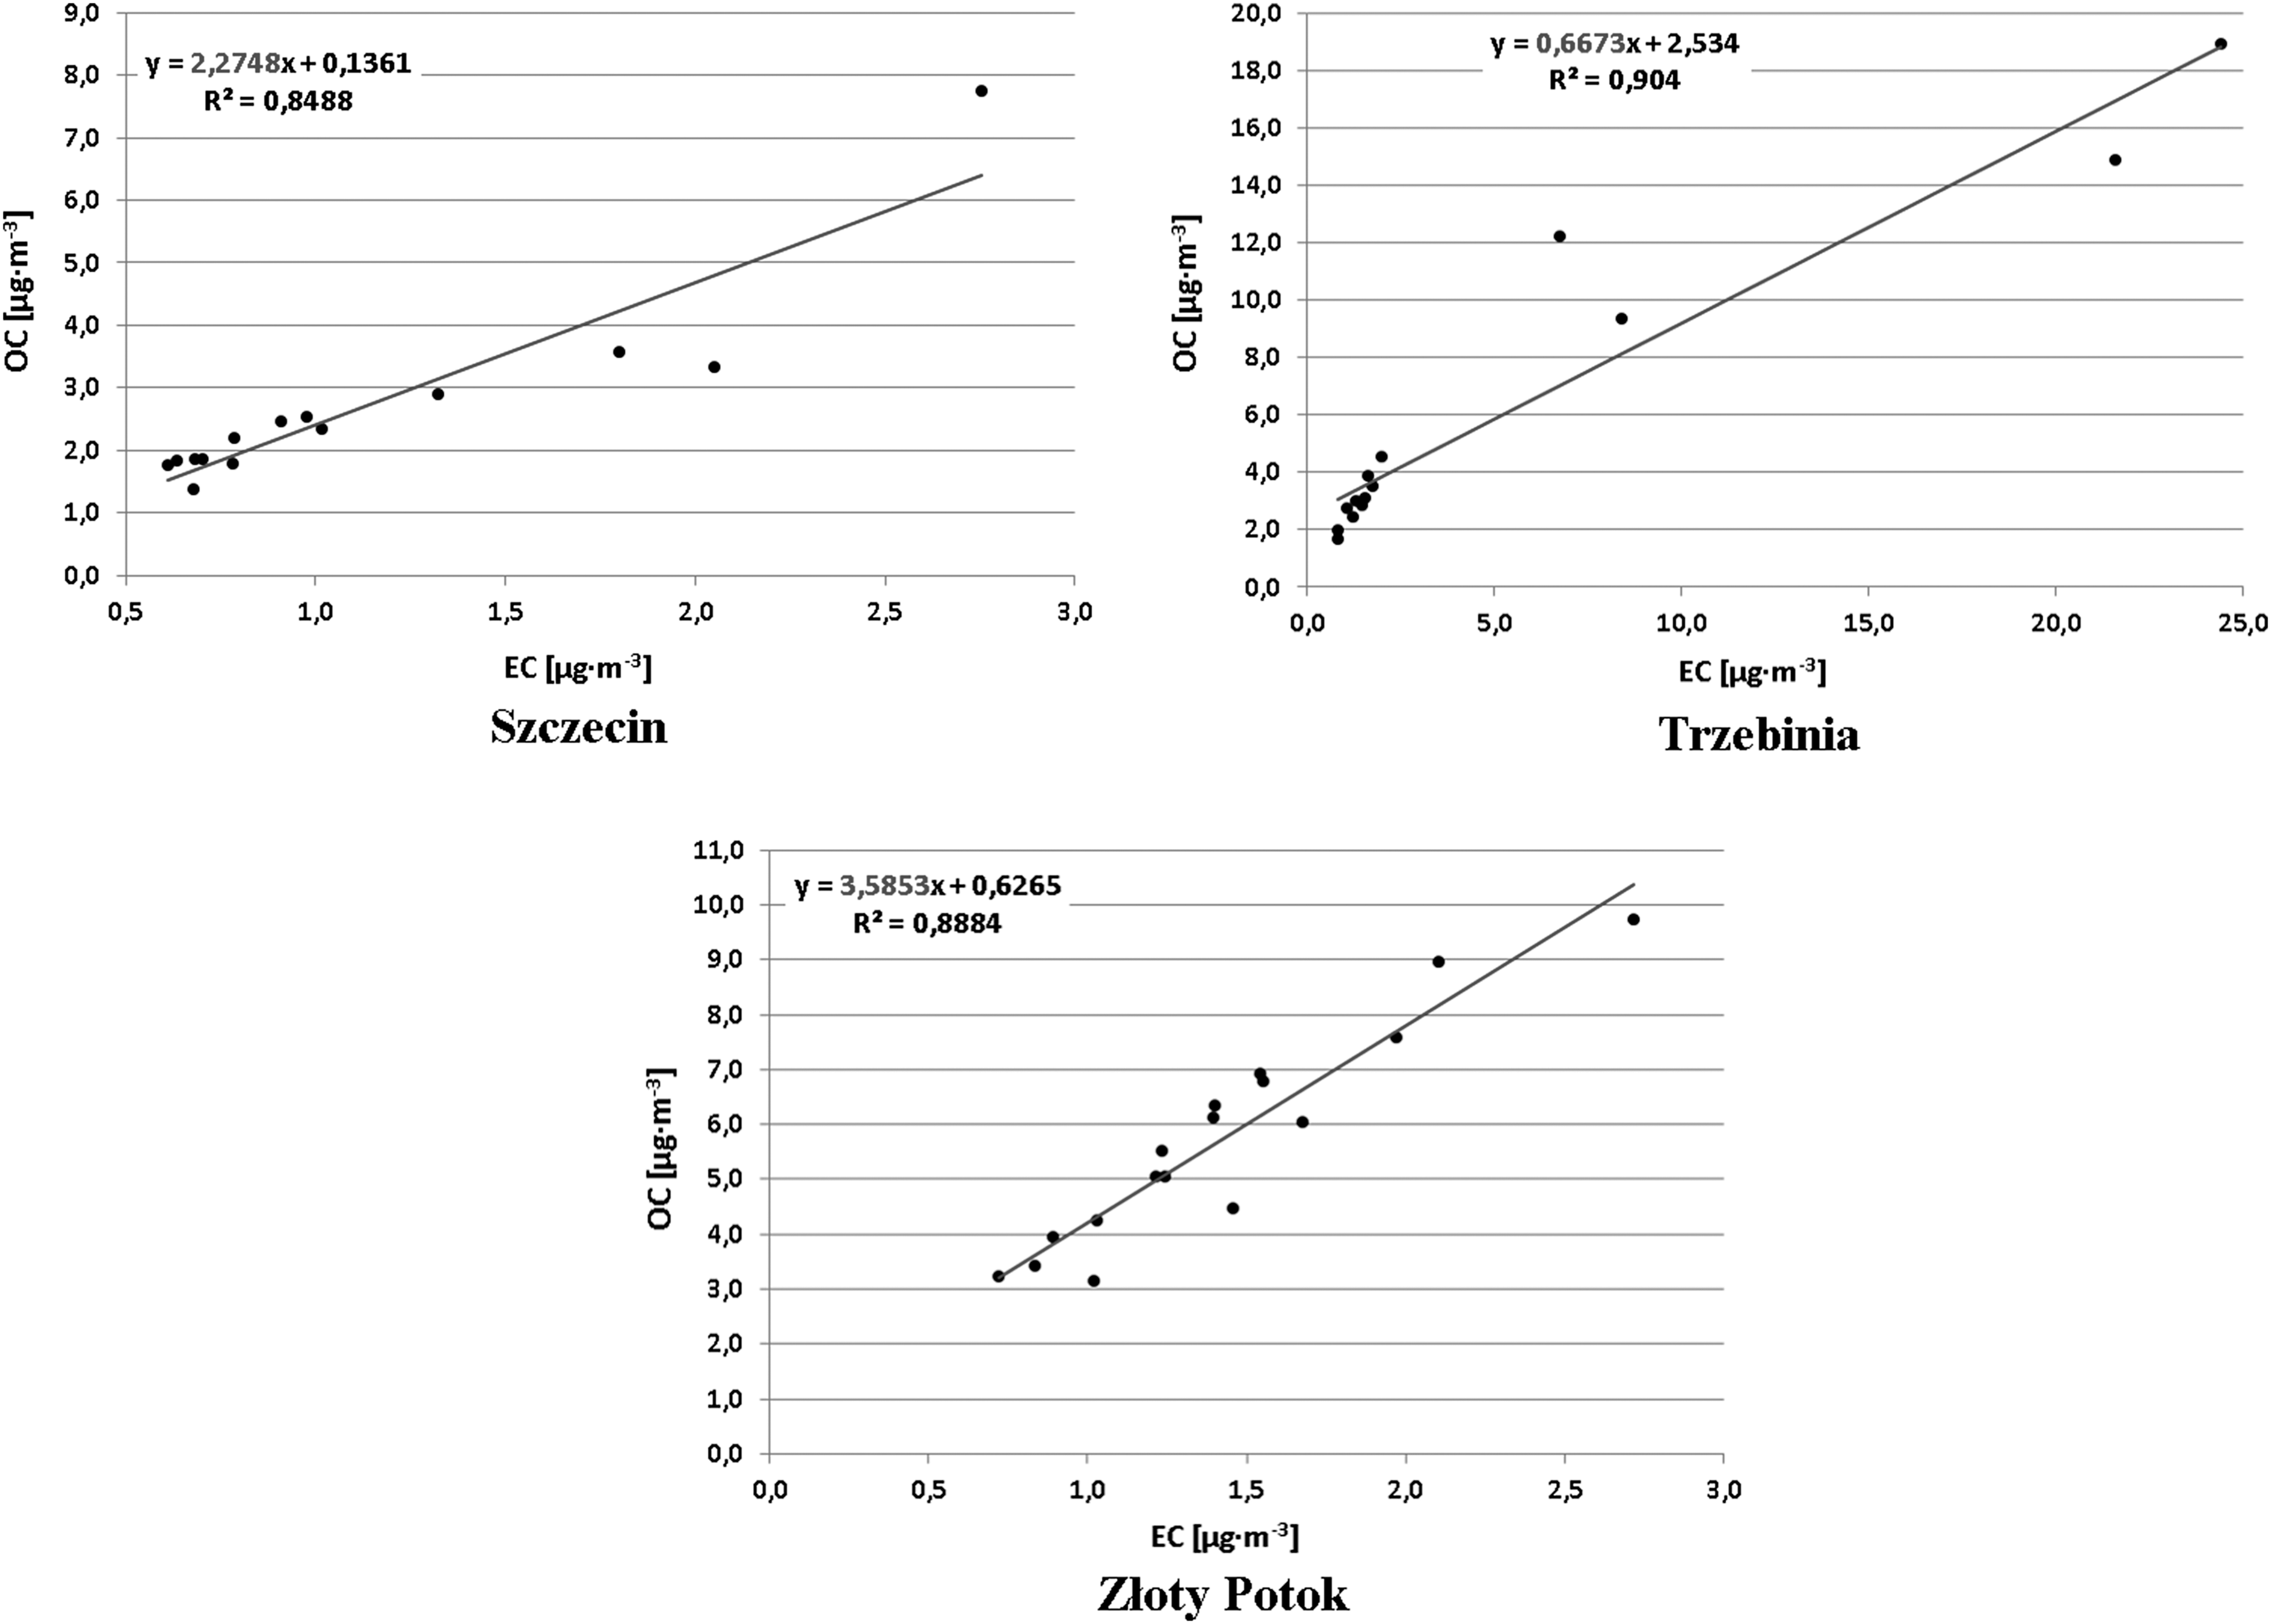
Ratio of primary OC to EC (OC/EC)pri, calculated for each location.
Average concentrations of SIA in the air in the whole measurement period were equal to 5.28 μg/m3 (Szczecin), 7.22 μg/m3 (Trzebinia), and 4.30 μg/m3 (Złoty Potok). The concentrations of SIA as well as of individual secondary ions recorded during the heating period were high compared with the nonheating period (Table 2), contrary to the results recorded at different measurement sites in Europe, for example in Elche (southeastern Spain) (Galindo et al., 2013) and in Thessaloniki (Greece) (Tolis et al., 2015).
The seasonal variability of the secondary ions concentrations observed in this work was probably caused by the enhanced intensity of the local emission sources during the heating period (emission of gaseous precursors of SIA) and atmospheric conditions that were unfavorable to dispersion and favorable to the formation of secondary inorganic compounds. The obtained results also indicate the dominant role of fossil fuel combustion sources and wood burning in the affecting of SIA and PM2.5 concentrations in the air of considered sites, similar to other areas in Poland (Rogula-Kozłowska and Klejnowski, 2013; Rogula-Kozłowska et al., 2014a, 2014b; Reizer and Juda-Rezler, 2016).
Average daily shares of SIA in the PM2.5 mass varied within a wide range (Fig. 6): from 12.93% to 54.18% in the urban background site in Szczecin, from 10.44% to 62.73% in the urban background site in Trzebinia, and from 8.33% to 32.12% in the regional background site in Złoty Potok. The share of SIA in PM2.5 was generally higher than the share of the SOC (Błaszczak et al., 2016a); the exception is the heating period at the urban background station in Trzebinia (the average share of SOC: 33.78%, and the share of SIA: 26.54%).

Daily average contribution of nss-SO42−, NO3−, and NH4+ ions and SOC in PM2.5 recorded in Szczecin
It should be noted that both concentrations and contributions of SIA in PM2.5 mass were visibly higher in the case of urban background stations (Szczecin, Trzebinia) than in the regional background station (Złoty Potok), in contrast to most of the literature data (Minguillón et al., 2012; Squizzato et al., 2012; Rogula-Kozłowska and Klejnowski, 2013). This could be explained by the higher concentration of emission sources in urban areas, and hence the greater availability of gaseous precursors of SIA (Alastuey et al., 2004; Seinfeld and Pandis, 2006).
Results showed that the average shares of SIA in PM2.5 mass were similar during the heating and nonheating seasons (Fig. 6). The biggest differences in the mean share of SIA in PM2.5 were found in Trzebinia (26.54% [heating season] against 31.47% [nonheating season]). However, particular ions included in SIA differed with regard to their shares in PM2.5 in all averaging periods, which can be interpreted as an expected phenomenon, according to the data previously published (Rogula-Kozłowska et al., 2013a, 2014a).
The mass shares of SO42− ions in PM2.5 were higher in the nonheating season; this refers to PM2.5 in each of the three locations. It is caused by higher air temperatures, an increased amount of sunlight, and high concentrations of hydroxyl radicals (HO·) in this period, which accelerate the oxidation of SO2 and its conversion into sulfate ions (Seinfeld and Pandis, 2006; Pay et al., 2012). Conversely, clearly higher percentages of nitrate and ammonium ions in the PM2.5 mass were recorded during the heating season. This can be associated with the occurrence of low air temperatures in winter and more stable weather conditions that favor the formation of ammonium nitrate (Squizzato et al., 2012).
Comparing the obtained results with data collected in other rural and urban background sites in Europe (Squizzato et al., 2012; Mirante et al., 2014; Moroni et al., 2015), it was found that the share of SIA in PM2.5 in the studied areas is lower or comparable, whereas the share of SOC is relatively high. In the latter case, it stems from the fuel consumption structure typical for Poland, with the dominance of solid fossil fuels and the extensive use of biomass in the low-efficient household furnaces. Consequently, combustion favors emissions of organic carbon-rich substances (Pastuszka et al., 2010; Juda-Rezler et al., 2011; Rogula-Kozłowska et al., 2014a).
Relationship between PM2.5, ions in PM2.5, and meteorological parameters
PM2.5 concentrations showed strong positive correlations with OC, EC, and SIA (Table 3). Significant positive correlations between the concentration of PM2.5 and the concentrations of particular ions in PM2.5, except from Ca2+ and Mg2+, were observed in Złoty Potok, where the concentration of these ions was abnormally low. The concentration of NH4+ was significantly correlated with the concentrations of NO3−, nss-SO42−, and K+. The lack of a significant correlation between the concentrations of NO3− and nss-SO42− at the site in Trzebinia, as well as the poor correlation of these ions in the case of Szczecin, suggests that precursors of the two species were released from different emission sources (Huang et al., 2011). Besides, it would be an effect of photochemical reactions in the atmosphere and temperature dependence, especially in the case of nitrates (Alastuey et al., 2004; Squizzato et al., 2012).
Bold type denotes correlation coefficients statistically significant at p < 0.05, while italic type denotes correlation coefficients statistically insignificant at p < 0.05.
Considering the two urban stations, NO3− revealed a strong correlation with PM2.5, EC, and OC, contrary to nss-SO42− (Table 3). A different situation was observed for the regional background station in Złoty Potok. NO3− and nss-SO42− were relatively highly correlated, with the coefficient of 0.64, and they displayed a similar correlation coefficient with PM2.5, EC, and OC. It may be due to the significant content of aged particles in the air, which is typical for this type of areas, where the variations in nss-SO42− and NO3− associated with the regional pollution are more readily observed (Chan and Mozurkewich, 2007).
Results also showed that NO3− ions were strongly correlated with Cl− ions, especially in the case of urban background stations (Table 3). This may indicate a common origin of these ions from the combustion processes in the open air, waste incineration, or wood combustion (Rogula-Kozłowska et al., 2014b). Cl− was also strongly correlated with K+, suggesting their presence in the air in the form of KCl. The strong correlation between Cl− and K+ may also imply that power generation based on coal combustion as well as biomass burning are sources of both ions (Vasconcellos et al., 2007; Rogula-Kozłowska et al., 2013b; Pant et al., 2015). In Złoty Potok, K+ and Cl− were poorly correlated; however, a strong correlation between K+ and nss-SO42− was found, which may point to biomass burning as an emission source of PM2.5.
Interestingly, a poor correlation between Cl− and Na+ in PM2.5 collected in Szczecin was found; therefore, the presence of these ions is related to sources other than sea salt, such as combustion processes (Rogula-Kozłowska and Klejnowski, 2013; Pant et al., 2015; Błaszczak et al., 2016b). Finally, the negative correlation of Mg2+ and Ca2+ with other PM2.5 constituents was probably due to the very low concentrations of these two ions, often not exceeding their detection limits.
Concentrations of PM2.5 and the associated main components exhibited a significant, generally negative correlation with wind speed (Table 3). Both OC and EC, as well as all the analyzed ions, showed a negative correlation with air temperature; the strongest one concerns the NO3− ions (correlation coefficient r ≥ −0.80).
The analyzed PM2.5 components showed positive correlations with relative humidity, but this relationship was not as strong as in the case of air temperature. Low temperatures and wind speeds favor the phenomenon of the inversion temperature formation, stable atmospheric conditions, and low thickness of the mixing layer, which leads to the accumulation of pollutants in the atmosphere (Deshmukh et al., 2010; Pateraki et al., 2014; Blaszczak et al., 2016b). Moreover, higher relative humidity in winter accelerates the formation of secondary compounds from the gaseous precursors (Deshmukh et al., 2010), thus worsening air pollution levels.
Correlation coefficients between PM2.5 variables and meteorological parameters were also checked separately for heating and nonheating periods. Not surprisingly, during the heating period, meteorological parameters generally displayed the negative correlation with PM2.5 concentrations and concentrations of its chemical constituents. During the nonheating period, the PM2.5 variables analyzed within the study were much less correlated with meteorological parameters, and the values of the correlation coefficients were often statistically insignificant and generally lower than r = (±) 0.55.
It may be suggested that in the nonheating period the impact of other factors, that is, long-range transport sources, would have a great influence on concentrations of PM2.5 and its constituents (Galindo et al., 2011; Mancilla et al., 2015). The impact of meteorological conditions is crucial, especially in winter when the low height of the mixing layer and frequent temperature inversions prevent propagation of pollutants in the atmosphere (Juda-Rezler et al., 2011; Rogula-Kozłowska et al., 2014a; Reizer and Juda-Rezler, 2016).
It is worth noting that the wind speed and direction are the basic parameters that allow for some estimation regarding the possible sources of emissions of particulate matter on a local scale (Fleming et al., 2012). The examination of wind-rose plots for daily samples is an approach commonly used in many scientific publications (e.g., Viana et al., 2006; Xiao et al., 2012; Majewski and Rogula-Kozłowska, 2016). However, it should be kept in mind that wind speed and direction are very sensitive parameters that may present considerable daily variability. Therefore, the assessment of possible source regions of PM2.5 in considered areas based on the wind direction data has only a preliminary nature.
Concentration roses created for the SIA (Fig. 7) showed that during the heating season, high SIA concentrations in the air above the analyzed measurement sites were primarily related to the winds blowing from the north-eastern directions, that is NNE, NE, NEE, and in addition from the E, N, and SEE. In Szczecin, the likely source areas of the highest concentrations of SIA were the northern and eastern parts of the West-Pomeranian Province. In the case of Trzebinia, the highest concentrations of SIA would be related to the inflow of air masses from the north-eastern part of the Lesser Poland Province, as well as from Świętokrzyskie Voivodship. In Złoty Potok, the probable source regions of the highest SIA concentrations would be the Łódzkie and Świętokrzyskie Voivodships, and the northern parts of the Silesian Province.
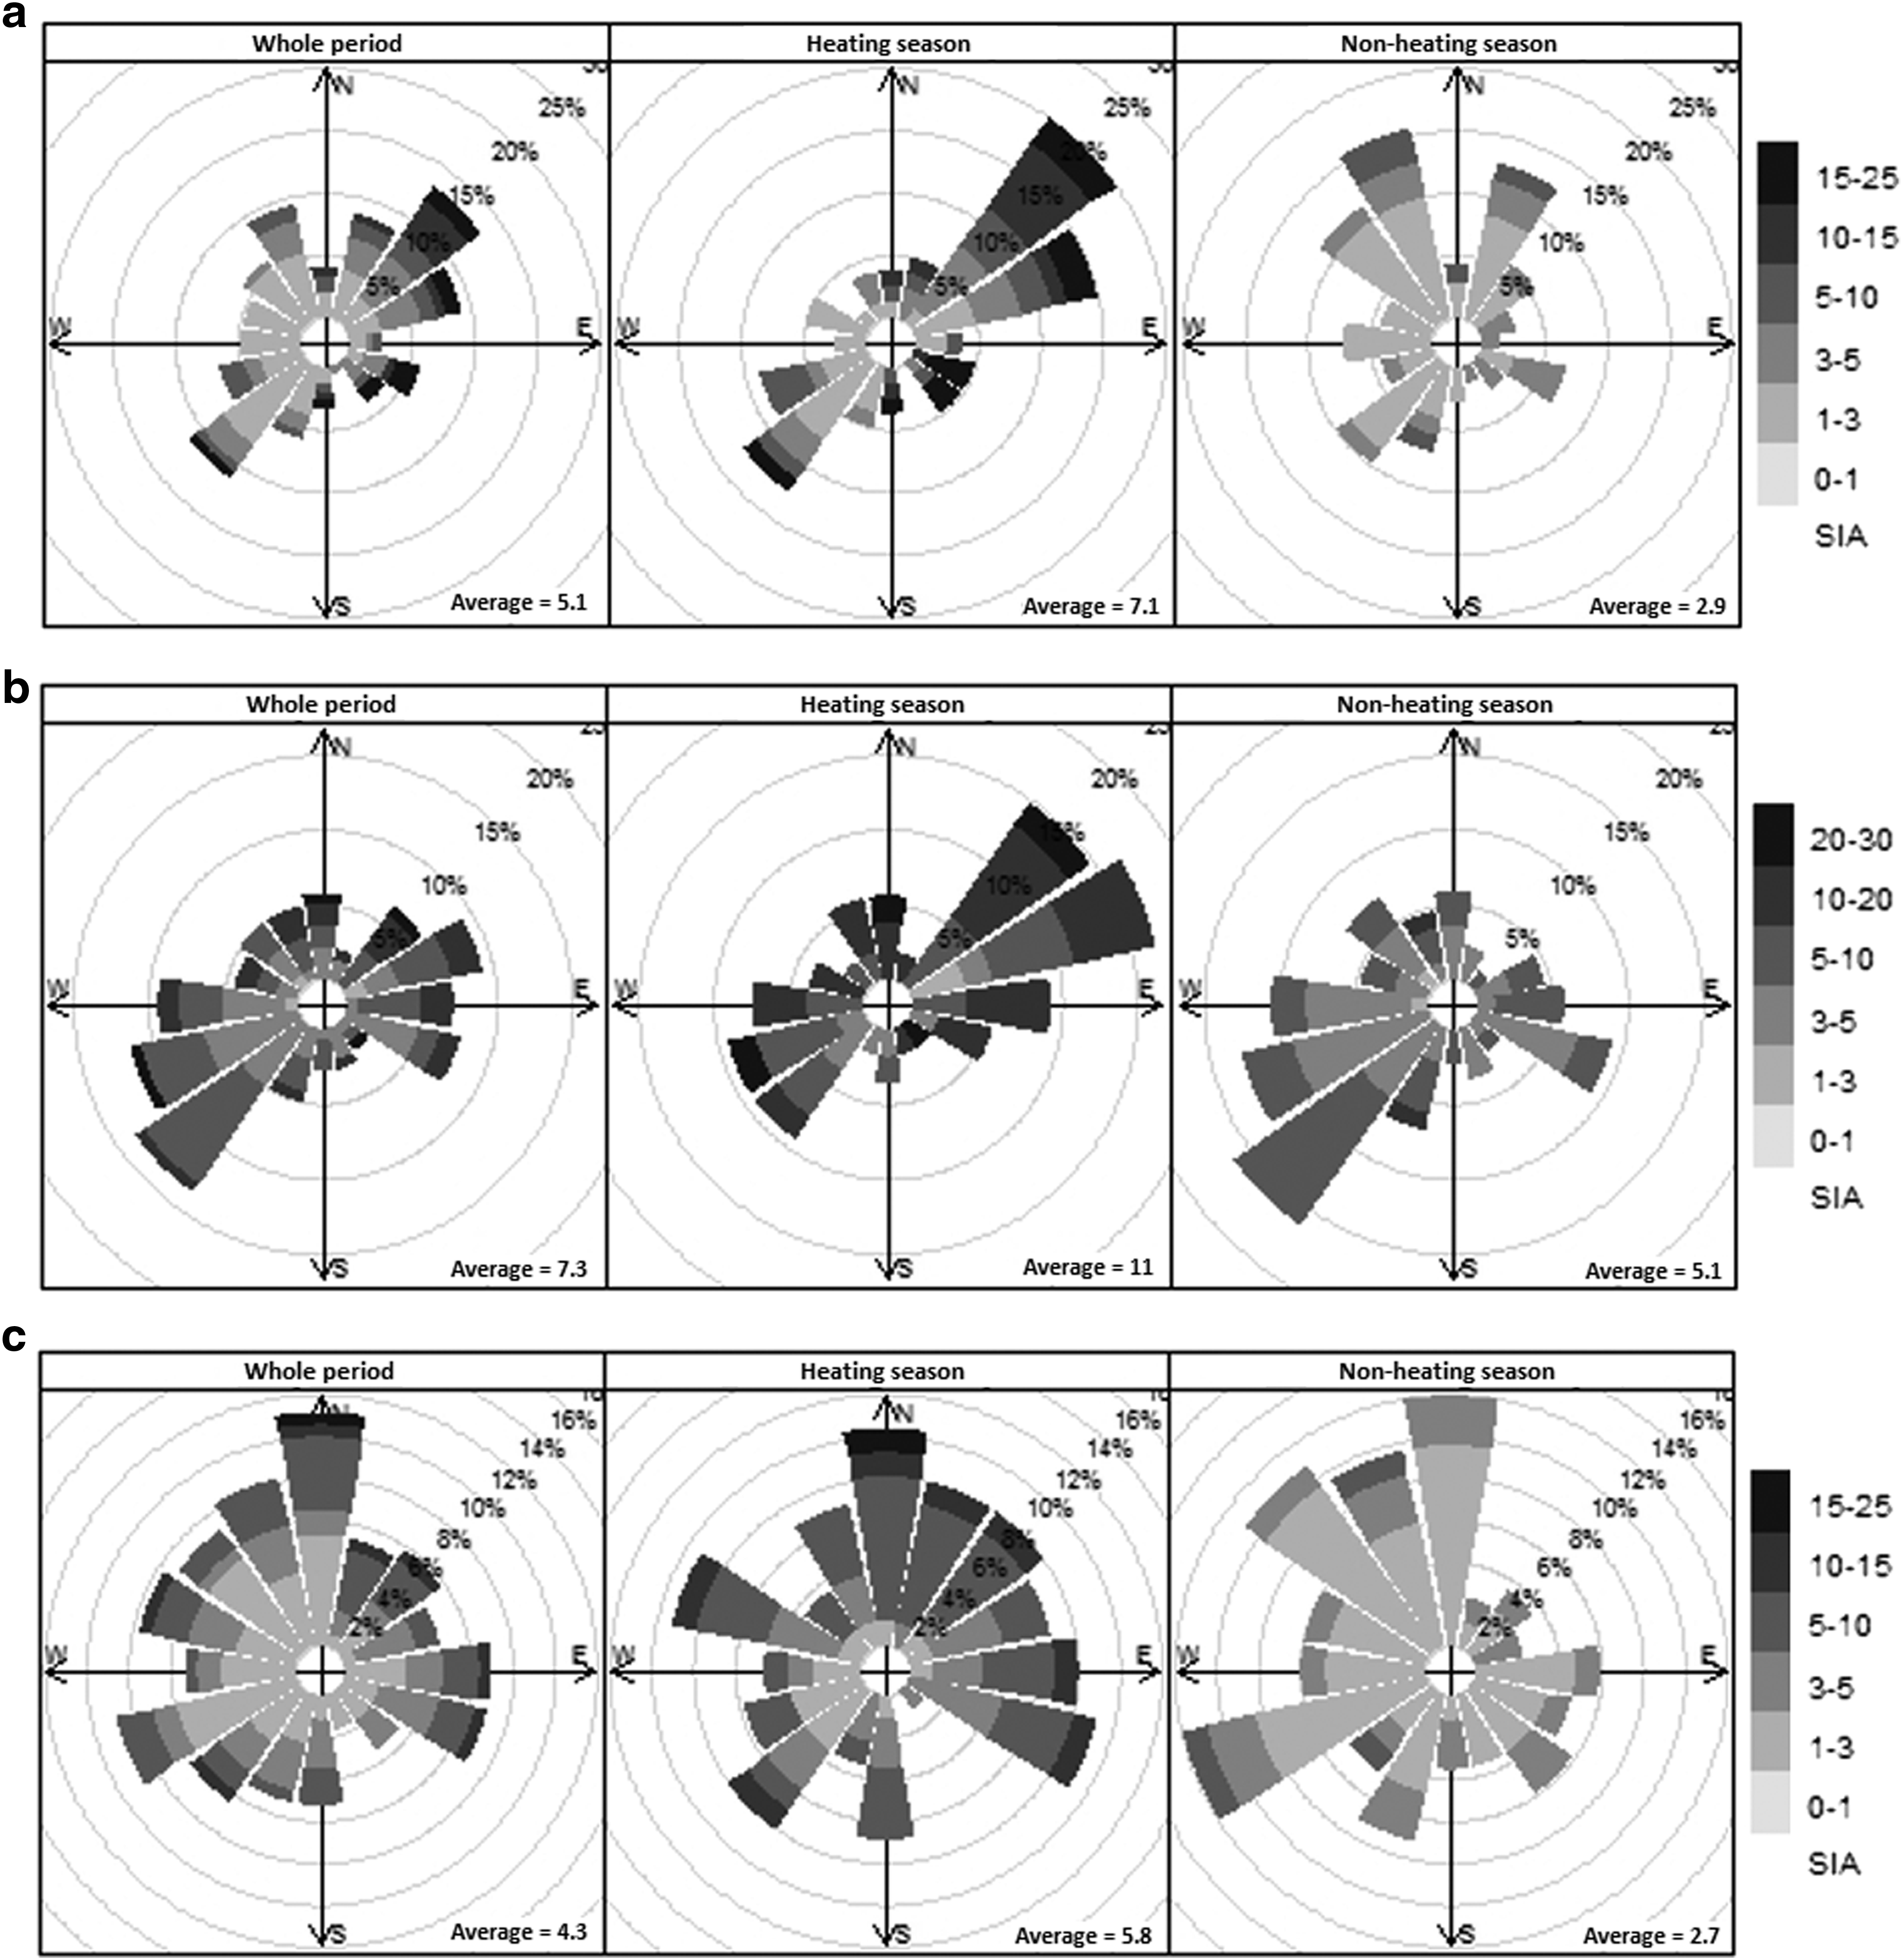
Concentration roses of secondary inorganic aerosol for Szczecin
A different situation was observed during the nonheating season. The highest concentrations of SIA in the air appeared most commonly during the inflow of air masses from the western directions, namely the NNW (Szczecin), SW and SWW (Trzebinia), and SWW, NW, and NNW (Złoty Potok).
For Trzebinia, the probable source area of the highest SIA concentrations would be the western and southern parts of the Silesian Province, as well as the southern and south-eastern parts of the Lesser Poland Province. In Złoty Potok, the likely source regions of the highest SIA concentrations would be, in general, various parts of the Silesia Province, as well as the southern parts of Łódzkie Voivodship. In the case of Szczecin, the highest concentrations of SIA would be related to the inflow of air masses from the northern parts of the city and from the West-Pomeranian Province, as well as from the Baltic Sea and from northern Germany.
Summary and Conclusions
Concentrations of PM2.5 and its chemical components showed strong seasonal and spatial variability. Higher and more varied concentration levels were observed in the heating season, which is the result of intensive energy production in this period, as well as of the unfavorable weather conditions (low height of the mixing layer, low air temperature, and frequent temperature inversions). The lowest concentrations of PM2.5 were recorded in Szczecin (northern Poland), due to the location of the measurement station in the coastal zone. The concentrations of PM2.5 at the sites in Trzebinia and Złoty Potok (southern Poland) were comparable and significantly higher than in Szczecin. The reason for this is the high degree of industrialization and urbanization of the southern Poland, as compared with other areas of the country.
Besides carbon, water-soluble inorganic ions were major components of PM2.5 mass. Sulfate, nitrate, and ammonium ions clearly dominated the PM2.5 samples from all sites. The share of these ions, together referred to as the SIA, averaged throughout the entire measurement period equaled ∼78% (Szczecin), ∼85% (Trzebinia), and ∼89% (Złoty Potok) of the total mass of all analyzed ions. The highest contents of SIA in PM2.5 were recorded at the urban background station in Trzebinia, located in a highly industrialized and populated area, whereas the lowest contents were recorded at the regional background station in Złoty Potok.
The average shares of SIA in PM2.5 mass were similar during the heating and nonheating seasons. However, particular secondary ions displayed different seasonal variations, which agreed well with data previously published. The mass shares of sulfate ions in PM2.5 were higher during the nonheating season (because of enhanced photochemistry), conversely to nitrate and ammonium ions, with higher percentages during the heating season (due to the thermal instability of the ammonium nitrate).
Relationships observed between the concentrations of PM2.5 and its components, and selected meteorological parameters allowed a rough assessment of their origins. Results indicated the important role of combustion sources, including biomass burning, combustion of coal and wastes, on the air quality in considered areas, especially during the heating season.
The poor correlation between the concentrations of NO3− and nss-SO42− at the urban background sites, or even the lack thereof, suggests that precursors of the two species were released from different emission sources. Moreover, it would be an effect of photochemical reactions in the atmosphere and temperature dependence, especially in the case of nitrates. A different situation was observed for the regional background station in Złoty Potok, probably due to the significant content of aged particles in the air, which is typical for this type of areas.
During the heating season, the likely source area of the highest concentrations of SIA for Szczecin was the northern Poland; for Trzebinia, it was the southern and central eastern part of Poland; and for Złoty Potok, it was the area of the south-eastern Poland. A different situation was observed during the nonheating season. For Trzebinia and Złoty Potok, the probable source area of the highest concentrations of SIA was almost the entire area of Poland, with the exception of the eastern and northern parts of the country; whereas for Szczecin, it was the nearest surroundings of the city as well as northern Germany.
Footnotes
Acknowledgments
The work was financed within two projects of the National Science Centre, No. 2011/03/N/ST10/05542 and No. 2012/07/D/ST10/02895.
Author Disclosure Statement
No competing financial interests exist.