




Abstract
Abstract
Ethylenediamine-functionalized reduced graphene oxide (GO) was synthesized by reacting chlorine-functionalized reduced GO and ethylenediamine. Chlorine atoms in reduced GO are susceptible to substitution by ethylenediamine, thereby causing their elimination. The product exhibits improved efficiency in methylene blue (MB) removal. Adsorption kinetics of the reaction fit a pseudo-second order model. Adsorption isotherms of MB on the product could be well described by the Langmuir model; physisorption may dominate the adsorption process. Batch experiments show an adsorption capacity of 143.6 mg/g, which is superior to those of reduced GO (77.2 mg/g) and activated carbon (AC, 46.5 mg/g).
Introduction
S
GO and RGO contain numerous functional groups that can react with various compounds. The epoxide groups and carboxyl groups of GO can react with amines, secondary amines, and other N-containing compounds (Ai et al., 2014; Yang et al., 2014; Xu, et al., 2016). During transformation of the hydroxyl and epoxide groups in GOs into other functional groups, these functional groups can also react with other compounds having C–Cl bond (Kumar et al., 2014; Li, et al., 2015; Mangadlao et al., 2015). The hydrogen atom of the hydroxyl group in GO can be substituted by other compounds (Wang et al., 2013, 2014a, 2014b). When growing a polymer with GO and RGO, the hydroxyl group is used as the anchor site (Zhao and Liu, 2014; Liu et al., 2015c; Qin et al., 2015; Rajender and Suresh, 2016). To form the derivatives of carboxyl and hydroxyl functional groups, isocyanates are applied to create the anchor site on GO (Gupta et al., 2006).
The C = C bond of GO is functionalized by cysteamine hydrochloride through a thiol–ene click reaction (Luong et al., 2015). Carbene can also react with the C = C of graphene (Sainsbury et al., 2016). Another approach for the functionalization of graphene is the addition of aryl radicals (Liu et al., 2015b; Fortgang et al., 2016; Voylov et al., 2016). GO and RGO can also be functionalized by cycloaddition (Ko et al., 2015). The siloxane coupling agent is also used to modify GO sheets (Madadrang et al., 2012; Liu et al., 2015a). The fluoro-functionalized graphene is a useful intermediate compound (Dubecký et al., 2015; Zhan et al., 2015; Xing et al., 2016). This compound can react with amine, alcohol, and sulfur nucleophiles (Whitener et al., 2015).
Likewise, chlorine-functionalized reduced graphene oxide (ClRGO) has been prepared (Wang et al., 2015). The preference for organic compounds, such as halogenoalkanes, of the C–Cl bond in ClRGO has yet to be determined. The carbon and chlorine bond in halogenoalkanes may react with nucleophiles, such as amines. To the best of our knowledge, such occurrences have not been reported. In this work, ethylenediamine-functionalized reduced graphene oxide (ERGO) was prepared.
Materials and Methods
Materials
Methylene blue (MB) was purchased from the Beijing Chemical Reagents Company (Beijing, China). Natural graphite, with a mean particle size of 44 μm, was purchased from the Qingdao Zhongtian Company (Qingdao, China). Other chemicals were supplied by the Guangfu Industry of Fine Chemicals Institute (Tianjin, China). All chemicals were used without further purification. GO used in this study was synthesized from natural graphite powder based on the Hummers method (William et al., 1958). ClRGO was synthesized according to literature (Wang et al., 2015).
Synthesis of ERGO and RGO
Ethylenediamine (1.0 mL, 0.015 mol) and Na2CO3 (1.59 g, 0.015 mol) were added to a mixture of ClRGO (0.5 g) and acetonitrile (30 mL). The mixture was stirred at room temperature for 1 h. The mixture was heated under reflux for 8 h and poured into a container with water (50 mL). The product was collected by filtration and washed with deionized water. The black product was dried at 50°C for 1 day to produce ERGO (0.37 g).
The RGO was prepared according to the literature (Wang et al., 2014b).
Characterization of ERGO
Scanning electron microscopy (SEM) and energy-dispersive X-ray (EDX) spectroscopy were performed with a FEI-Quanta 200 scanning electron microscope. High-resolution scanning electron microscopy (HRSEM) was performed on a JEOL JEM-2011 electron microscope operating at 200 kV with a Gatan 794 camera. Fourier-transform infrared spectrometry (FTIR) were obtained with an FTS-40 (Bio-Rad, CA). Raman spectra were recorded on a Renishaw InVia multi-channel confocal microspectrometer with a 532 nm excitation laser. X-ray diffraction (XRD) measurements were obtained on an X'pert PRO diffractometer with Co Kα radiation. X-ray photoelectron spectroscopy (XPS) with monochromatized Al Kα X-ray (hν = 1486.6 eV) radiation (ESCALAB 250; ThermoFisher Scientific Co.) was used to investigate the surface properties of ERGO. The shift in binding energies was corrected, with the C1s signal at 284.6 eV as internal standard.
MB adsorption
Batch adsorption experiments were performed in 250 mL glass bottles with a mixture of the adsorbent (∼2 mg) and MB solution (200 mL, 4 mg/L to 12 mg/L). The glass bottles were sealed with Teflon. The experiments were performed at 180 rpm for 12, 24, and 48 h, and other time periods. The temperature of the solution was set to the desired value, with a variation of ±0.02°C, by adjusting the flow rate of the thermostatically controlled water running through an external glass-cooling spiral. The mixture was sampled in a series of intervals, and the concentration of the remaining MB in the mixture was measured after centrifugation. The absorbance was obtained with a UV/vis spectrophotometer. The concentration was calculated by the standard spectrophotometric method at a maximum absorbance of MB. All the samples were centrifuged at 10,000 rpm for 10 min.
Results and Discussion
Structural features of ERGO
Morphologies and microstructures of ERGO were characterized by SEM and HRTEM, as shown in Fig. 1. The graphene sheets are wrinkled and twisted, which might be a characteristic feature of the few-layered sheets in Fig. 1a–c. The corresponding EDX spectrum revealed the presence of C, O, N, and Cl, thereby implying that some chlorine atoms in ClRGO were possibly substituted by ethylenediamine.
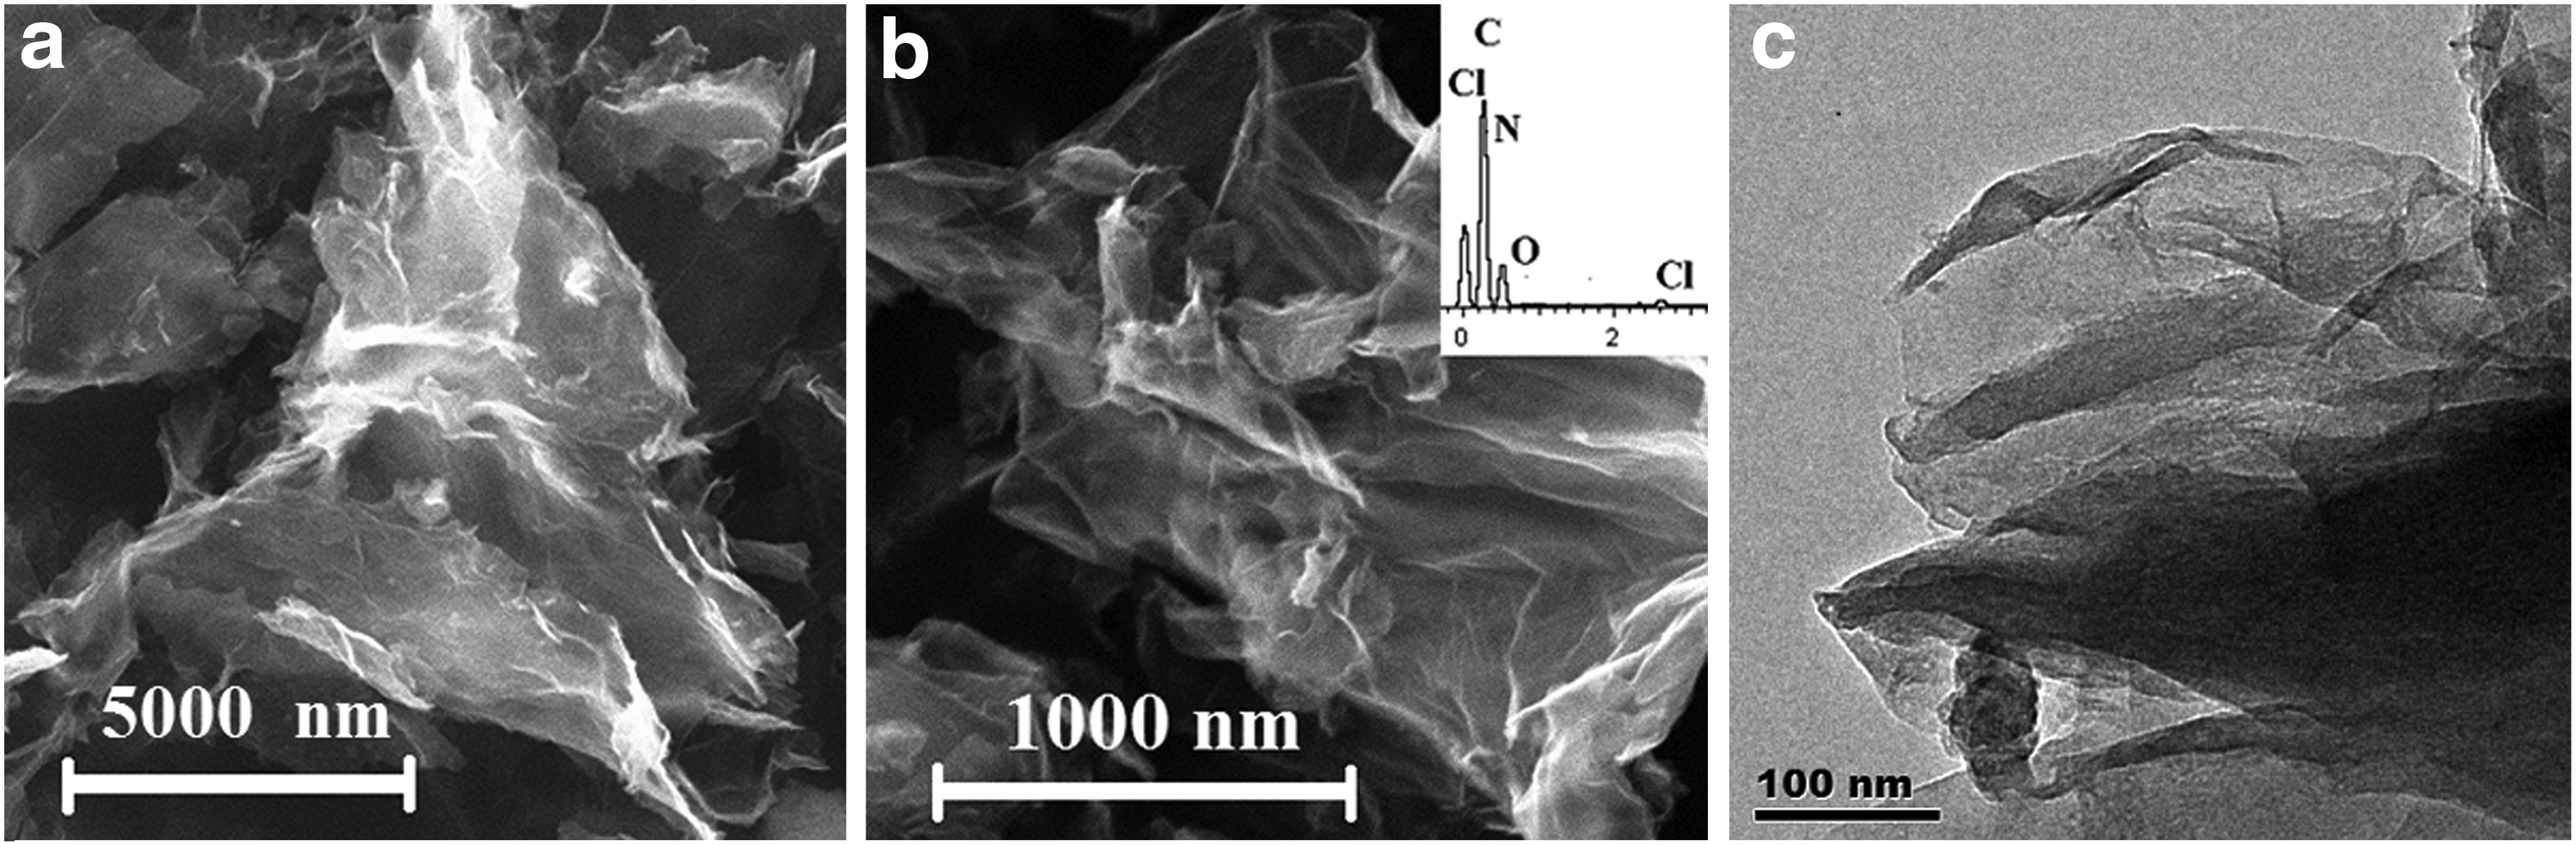
Images and EDX spectrum of ERGO.
The FTIR spectra of RGO, ClRGO, and ERGO are shown in Fig. 2a. The characteristic peaks of RGO are present at 3,410, 1,560, and 1,040 cm−1. The peaks of ClRGO can be observed at 1,713, 1,580, 1,092, and 653 cm−1. ERGO displays an evident peak at 3,390 cm−1, which might have originated from the stretching vibrations of −NH2,–NH–, and the residual −OH groups. The skeletal vibration of unoxidized graphite is represented by the peak at 1,581 cm−1. The peak of C–H is at 1,452 cm−1; this peak was caused by the–CH2–group of ethylenediamine. The peak of C–N is located at 1,221 cm−1, which also implies the substitution of C–Cl and ethylenediamine.

FTIR spectra
Raman spectra of RGO, ClRGO, and ERGO are presented in Fig. 2b. The G band of RGO at ∼1,565 cm−1 is associated with the vibration of sp2 carbon atoms. The G band of ClRGO is at 1,587 cm−1. ERGO shows a G band at 1,598 cm−1, which was caused by the formation of a conjugated system. This result implies that more graphene domains were formed in ERGO. Some chlorine atoms were possibly eliminated in the process, that is, ClRGO was continuously reduced by ethylenediamine. The D band of RGO at ∼1,348 cm−1 is related to the vibration of defective and disordered sp3 carbon atoms. The D band of ClRGO is present at 1,346 cm−1. The intensity of the D band at 1,354 cm−1 of ERGO substantially increased, thereby indicating the increased size of sp3 domains, which was possibly caused by extensive substitution. The chlorine atoms were probably substituted by ethylenediamine, and the intensity of the D band might have been further increased. Ethylenediamine may have caused defects and disorderliness in ERGO. More sp3 carbon atoms can be observed in ERGO than in RGO because of the substitution reaction.
Figure 3a shows the XRD patterns of the RGO, ClRGO, and ERGO. The peaks of RGO and ClRGO are at 27.6° and 24.8°, and their average interlayer spacings are 0.36 and 0.41 nm, respectively. ERGO has a strong peak at 26.9° (0.38 nm) and a weak peak at 12.6° (0.72 nm). The average interlayer spacing of ERGO is slightly wider than those of graphite (0.334 nm) and RGO (0.36 nm). The N-containing groups, along with some residual chlorine and oxygenated functional groups, are attached on both sides of the ERGO sheets. These groups acted as spacers and/or as pillaring agents; the sheet might be thicker than graphene. The broad peak implies poor ordering of the sheets along the stacking direction, thereby indicating that ERGO might be composed of a few layered sheets.

Composites of ERGO were also analyzed by XPS. The XPS survey spectra of ERGO show the presence of C, O, N, and Cl elements, as shown in Fig. 3b and Table 1. The carbon and oxygen content of RGO, ClRGO, and EGRO are similar. ERGO has a higher nitrogen content than ClRGO, which implies the substitution of C–Cl and ethylenediamine. Theoretically, the nitrogen content should be twice as much as the chlorine content of ClRGO. As observed, the nitrogen content of ERGO is lower than the chlorine content of ClRGO. A similar result was reported in literature (Whitener et al., 2015). Some chlorine atoms in ClRGO have a structure similar to that of primary halogenoalkanes; these atoms may be substituted by ethylenediamine. The epoxide group in RGO can also react with ethylenediamine. Other chlorine atoms in ClRGO have structures similar to those of tertiary halogenoalkanes; most of the atoms may be eliminated, and some parts of the ClRGO sheet may be reduced, thereby producing conjugated system form. Meanwhile, a third set of chlorine atoms in ClRGO have structures similar to those of secondary halogenoalkanes; a fraction of these chlorine atoms may be substituted by ethylenediamine, whereas other atoms could be eliminated (Whitener et al., 2015).
ClRGO, chlorine-functionalized reduced graphene oxide; ERGO, ethylenediamine-functionalized reduced graphene oxide; RGO, reduced graphene oxide.
The core-level XPS signals of C1s are shown in Fig. 3c. The peak observed at 282.9 eV is assigned to the–CH2–group of ethylenediamine. The peak at 284.6 eV was caused by graphitic sp2 carbon atoms. The peak at 287.6 eV originates from C–N and C–O. The peak at 294.3 eV is associated with C = O in carboxylic acids. The peak at 399.6 is assigned to N1s in Fig. 3d, which implies that N-containing groups were attached to the graphene sheet.
MB adsorption and its adsorption mechanism
Effect of pH
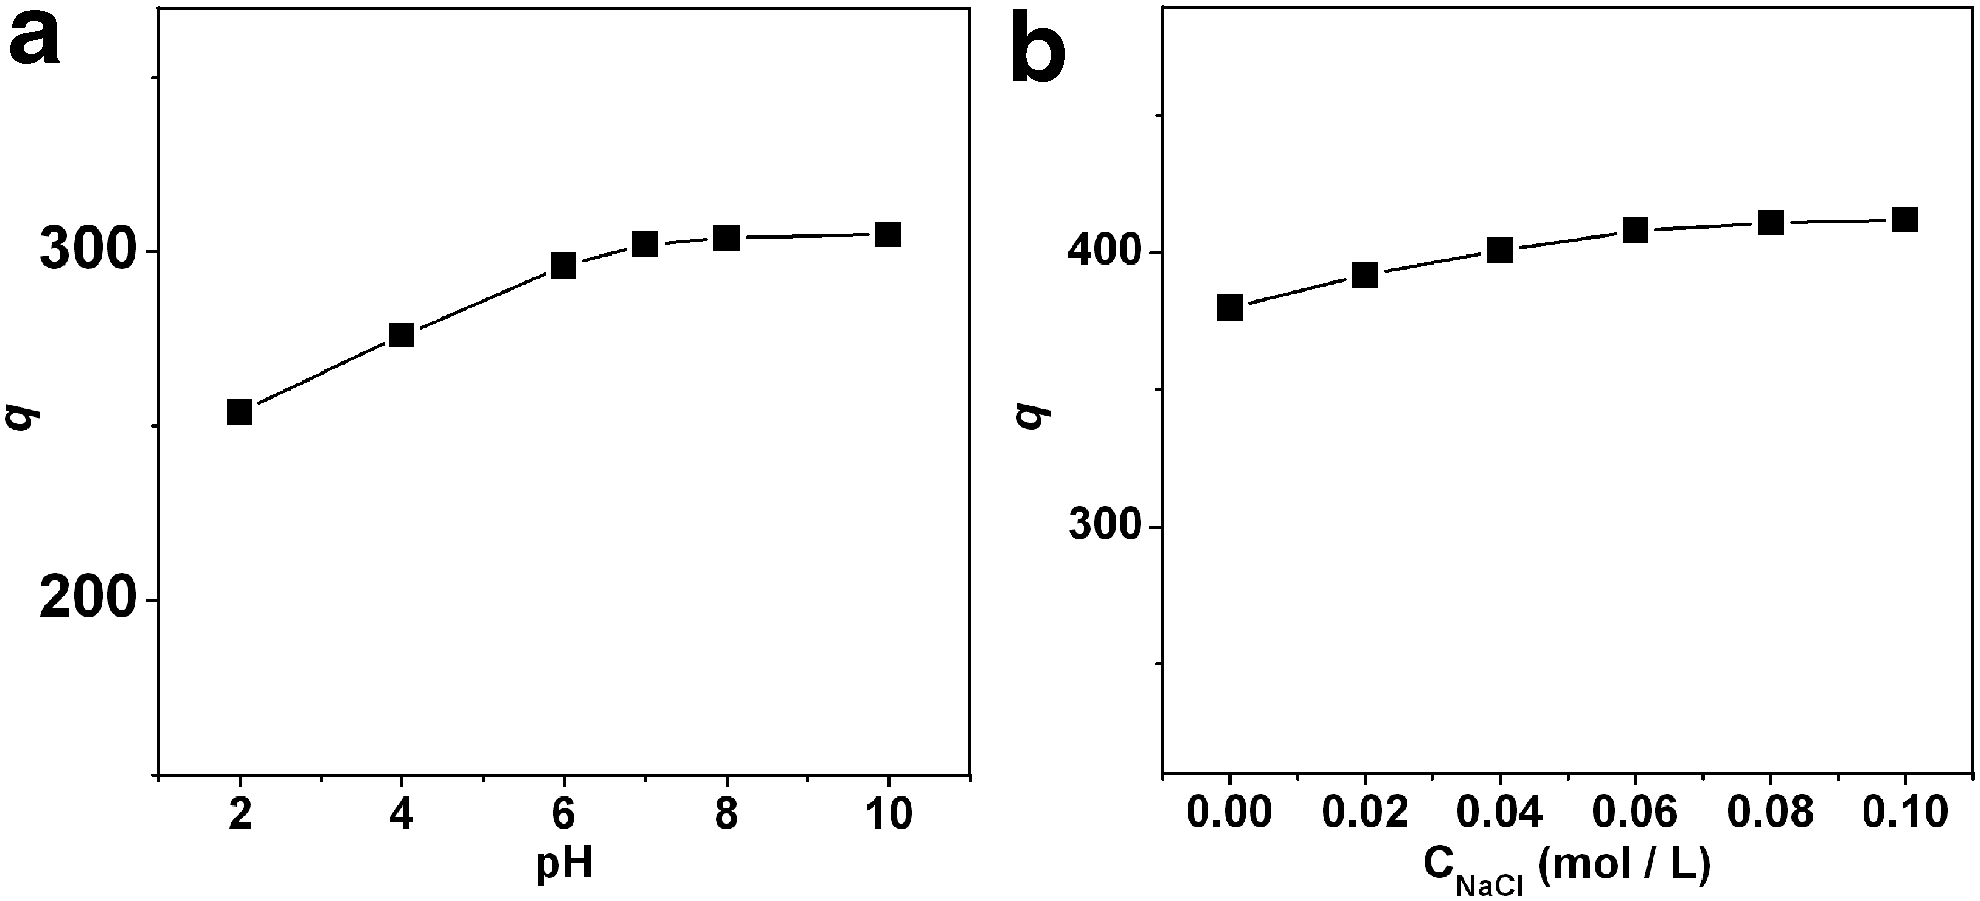
The pH of a mixture is an important parameter that controls the ion adsorption process. To investigate the effect of pH, a series of experiments were performed at 293 K for 24 h using 200 mL of MB, with an initial concentration of 8 mg/L and 2 mg of adsorbent. The protonated form MBH2+ dominates when pH = 1. The monomer MB+ is dominant in the pH range between 2 and 10. At high pH conditions, the dimer (MB+)2 and trimer (MB+)3 are dominant (Saad et al., 2015). The pH range between 2 and 10 was used in this study, and the results are shown in Fig. 4a. The values of qe increased as the increasing initial pH increased from 2 to 6. The optimum MB adsorption was observed at pH 7–10. The adsorption capacity increased with the increasing pH, which can be attributed to the electrostatic attraction of positively charged MB with the negatively charged surface of ERGO. With the decreasing pH, the concentration of H+ increased, whereas the ionization of –COOH and −OH also decreased, that is, the number of negatively charged functional groups decreased. A coordinate bond can also form between H+ and the nitrogen atom of –NH–and–NH2. MB competed with the hydrogen ions among the adsorption sites. Therefore, the adsorption capacity decreased. Furthermore, the pH of the ERGO solution without adjustment by HCl or NaOH was approximately eight in this study. Therefore, pH = 8 was selected in the succeeding experiments.
Effect of pH
Effect of ionic strength
Dyehouse waste commonly includes dyes and electrolytes; thus, the effect of electrolytes should be tested to estimate the actual adsorption capacity of ERGO in the removal of MB. To investigate the salt effect on the adsorption of MB, NaCl was used to adjust the solution salinity (Jia et al., 2015). A series of experiments were performed at 293 K for 24 h using 200 mL of MB with an initial concentration of 12 mg/L and 2 mg of adsorbent. The salt can greatly improve the ionic strength, which might have influenced the adsorption of MB by the adsorbent. As shown in Fig. 4b, the ability to absorb MB slightly increased as the NaCl concentration increased from 0 to 0.1 mol/L. This result indicates that MB is relatively more competitive than metal ions and can be adsorbed in the presence of high salt concentrations.
Comparison of absorption capacity
Adsorption capacities of ERGO, RGO, and commercial AC were compared by MB adsorption. Figure 5a presents the adsorption curves of MB by ERGO, RGO, and AC. The adsorption capacity of ERGO for MB is 143.6 mg/g, which is much larger than that of RGO (77.2 mg/g) and approximately thrice as much as that of AC (46.5 mg/g). ERGO contains several functional groups, such as −OH, −COOH, −NH, and −NH2. The hydroxyl group of phenols and–COOH can form negatively charged groups; these groups may absorb MB. A coordinate bond could also form between cationic dyes and nitrogen atom of −NH and −NH2.

Adsorption kinetics
Adsorption kinetics to describe MB uptake rate is one of the important characteristics that control the adsorbate uptake rate at the solid–liquid interface. To clarify the adsorption behavior of ERGO, the kinetics of MB removal was observed. The available kinetic models include pseudo-first order models, pseudo-second order models, and intraparticle diffusion models (Liu et al., 2012; Chao et al., 2013; Zhai et al., 2013).
The correlation coefficient (R2, which is almost 1) was used to evaluate the suitability of the different models. A more applicable model for the kinetics of MB adsorption is the use of high-R2 indicators. The related parameters of the different models are shown in Table 2. The pseudo-first order models have high correlation coefficients (0.949, 0.983, 0.974, 0.928, and 0.991). However, significant differences between the calculated qcal and experimental qexp values were observed. For MB adsorption with high R2 values (0.999, 0.997, 0.997, 0.999, and 0.997, as shown in Fig. 5b), the pseudo-second order model proved to have good correlation for ERGO; the differences between the calculated qcal and experimental qexp values were small. The correlations for the intraparticle diffusion models are low (0.845, 0.929, 0.919, 0.854, and 0.972), thereby implying that MB adsorption on ERGO does not fit the model.
Concentration = 8 mg/L.
Adsorption isotherms
Freundlich, Langmuir, and Dubinin–Radushkevich (D–R) isotherm models are widely used to simulate and understand the adsorption mechanism (Liu et al., 2012; Chao et al., 2013; Zhai et al., 2013). These models were also adopted in the present study.
Constants (b, qm) for the Langmuir isotherm are obtained from the slope and intercept of the plot between Ce/qe and Ce (Fig. 5c). The Langmuir model parameters and the statistical fits of the adsorption data to this equation are compiled in Table 3. The regression coefficient is high; the adsorption isotherms of MB on the product are well described by the Langmuir model. The adsorption process occurs in the monolayer at the ERGO surface. The parameters (RL) are within the favorable limit (between 0 and 1), thereby implying a favorable process. The qm and Langmuir constant (b) increased with temperature. Thus, these data clarify the endothermic nature of the existing process.
The Freundlich model is an empirical model that allows multilayer adsorption with nonuniform distribution of the heat of sorption on the surface. The values of KF and 1/n were calculated from the intercept and slope of the plot of ln qe versus ln Ce; these values are given in Table 3, with the regression coefficients at the studied temperatures. The parameters of KF and n are related to the adsorption capacity and adsorption intensity, respectively. The value of 1/n is lower than 1, thereby implying a normal Langmuir isotherm.
To distinguish between the physical and chemical adsorption of MB, the D–R model was also applied (Vasudevan and Lakshmi, 2012). The values of the constants (qs, B) calculated from the intercept and slope of the plot of ln qe versus ɛ2, with the regression coefficients, are shown in Table 3 and Fig. 5d. The constant B indicates the mean sorption energy (E). The value of E is lower than 8.0 kJ/mol for all the tested temperatures, thereby indicating that physisorption probably dominated the adsorption process (Luo et al., 2010, 2016; Vasudevan and Lakshmi, 2012; He et al., 2016). At the initial adsorption stage, partial chemical adsorption may also occur because of the strong chemical interactions between the amine and negatively charged groups of ERGO and MB. By increasing the MB loadings, the number of active adsorption sites greatly decreased. The van der Waals and hydrophobic interaction might be important factors that affect adsorption. At this stage, ERGO tends to physically absorb MB.
Conclusions
Some chlorine atoms in RGO can be substituted by ethylenediamine, whereas other atoms may be eliminated. ERGO could be an important intermediate for graphene-based materials and other compounds. The product exhibits improved efficiency in MB removal. Moreover, the adsorption process fits the pseudo-second order rate model. Adsorption isotherms of MB on the product are well described by the Langmuir model, which implies the occurrence of monolayer adsorption. The physisorption process possibly dominated the adsorption of MB.
Footnotes
Acknowledgments
This work was supported by the Science and Technology Department of Henan Province (No. 162300410015 and 162102110028), the Education Department of Henan Province (No. 12B210022), the Science and Technology Bureau of Xinxiang (Nos. 13SF39 and ZG15022), and the Xinxiang University Fund (No. 15ZP05).
Author Disclosure Statement
No competing financial interests exist.