




Abstract
Abstract
Power generation and desalination performance of microbial desalination cells (MDCs) were compared using two different catholytes; (1) Nannochloropsis salina, a marine algae and (2) potassium ferricyanide. Three chambered MDCs were constructed. Desalination efficiencies were 45%, 79%, and 46% when the algae was used as catholyte and 46%, 73%, and 16% when KFe(CN)6 was used as the catholyte at (35, 17.5, and 8.25 g/L of NaCl) respective salt concentrations. Chemical oxygen demand removal of anolyte substrate was 85% with algae as the catholyte and 83% with KFe(CN)6 as the catholyte, after 24 h of operation. MDC with the marine algae catholyte produced 384 ± 5 mW/m3 during the first hour of operation while the MDC with KFe(CN)6 catholyte generated 1,532 ± 14 mW/m3. Denaturing gel gradient electrophoresis of partial 16S rRNA genes showed clear differences between desalinating and nondesalinating microbial communities. Microbial community analysis reveals the shape and type of bacteria. Cyclic voltammetry showed reduction peaks for algae −250 mV at a reduction current of −6 mA and for potassium ferricyanide −50 mV and −250 mA. Results successfully demonstrated that the marine algae-assisted biocatholyte can be used for efficient desalination in MDCs, but generates low power compared to the chemical catholyte.
Introduction
M
In both systems power production mainly depends upon how efficiently electrons are delivered from the anode to the cathode and reduced by the redox species in the catholyte. The search of alternatives to chemical catholytes has led researchers to study air cathodes and bio-catholytes (Gouveia et al., 2014; Kakarla and Min, 2014; Mink et al., 2014). The study of microbial communities at cathode for development of biocathode provides an opportunity to improve simultaneous bioremediation, recourse recovery and energy harvesting applications of MFCs (Pandey et al., 2016).
Removing salts from salt water to make it a freshwater resource is important in those areas of the world where fresh water is scare. Currently for commercial desalination thermal and membrane, technologies are in use, but the drawbacks are high energy consumption and operational costs (Shannon et al., 2008). In microbial desalination cells (MDCs), when bacteria on the anode produce current, ionic species in the middle chamber move into the two electrode chambers, desalinating the water in the middle chamber (Cao et al., 2009; Luo et al., 2012). The three-chambered MDC contains salt water to be desalinated in the middle chamber and anion exchange membrane toward anode and cation exchange membrane toward cathode. The process of desalination occurs by movement of ions into the catholyte and anolyte solutions due to the difference of concentration gradients across the separating membranes. The integration of reverse osmosis and MFCs to work as MDCs could be a step toward low cost desalination technologies (ElMekawy et al., 2014).
In MDCs toxic chemicals and expensive catalysts used in cathodic chamber are replaced by environmentally sustainable catholyte (Kokabian and Gude, 2015). The use of biocathodes allows MDCs to utilize an abundant and sustainable source of catholyte such as algae for microbialy catalyzed reduction (Yuan et al., 2011; Juang et al., 2012; Gajda et al., 2013; Patil et al., 2015). Algal growth in the cathodic chamber is self-sustaining, and algae produce O2, a terminal electron acceptor. Algal biomass can be cultivated in the cathode chamber by passively capturing CO2 from the atmosphere or by artificially sparging CO2 into the cathode chamber for production of high value byproducts (Kokabian and Gude, 2013). Sunlight is provided naturally or by grow lights under laboratory conditions. Carbon (glucose, acetate, cellulose, etc.) substrate in the anolyte can be provided by a variety of media; however, some studies have used dry algae biomass as the anolyte substrate. Light intensity and duration (Juang et al., 2012), temperature (Mohan et al., 2014), and CO2 supply (González del Campo et al., 2013) are some of the parameters that strongly affect power generation and efficiency in algal MFCs.
The objective of this work was to replace redox active salts in the catholyte with a biological system, maximize power production and develop an environmentally sustainable power production technology. This study compared the power production and desalination potential of a biocatholyte (algae) and a redox active salt [KFe(CN)6], as the chemical catholyte to support the hypothesis that biocatholyte-based MDC technology provides benefits such as CO2 capture, algal biomass production, partial desalination, and sustainable end products.
Materials and Methods
Microorganisms and medium
Microorganisms selected for inoculation into the anodic chamber were rumen consortia (Rismani-Yazdi, 2007). Standard anaerobic techniques were used throughout the study. Ruminal contents were collected via a cannula from the rumen of a fistulated Holstein cow maintained at the Waterman research farm of the Ohio State University in Columbus, Ohio. Rumen microorganisms (10% v/v) were obtained by squeezing the collected rumen contents through four layers of cheesecloth followed by immediate transfer in head space-free screwcap bottles to the laboratory. The medium (anolyte) used to grow the rumen microbes in the anodic compartment contained (per liter): 450 mg K2HPO4, 450 mg KH2PO4, 900 mg NaCl, 900 mg (NH4)2SO4, 120 mg CaCl2·2H2O, and 90 mg MgSO4. Cysteine-HCl (500 mg/L) was added initially as an oxygen scavenger (Rismani-Yazdi, 2007). Glucose (5 g/L) (Sigma Chemical Co., St. Louis, MO) 15 g tryptone, and 5 g yeast extract are substrates and electron donor throughout the experiments. The medium was purged with CO2 for 1 h to remove the oxygen and adjusted to pH 6.8 with NaOH. Finally, Na2CO3 (4 g/L) was added to increase buffering capacity before autoclaving.
MFCs assembly and operating conditions
Three identical MDC assemblies were constructed. Each system consisted of a three chambered MFC (Fig. 1). The MDC assembly was fabricated from cast acrylic tube stock that had a 9 cm inch outer diameter purchased from AIN Plastics (Columbus, OH). This tube stock was cut into three 2.5 cm wide rings for three chambers with two 1 cm holes and one 0.3 cm hole drilled within 7.6 cm along the perimeter for check valve insertion (Fig. 2). The anode chamber was closed with the rubber stopper for one hole and a check valve for the second. The cathode chamber and the middle desalination chamber were identical to the anode chamber, however, no stoppers were placed in the drilled holes, and the smaller hole that passed the electrode wiring was not sealed. The working volume of each chamber was 100 mL. Membranes of 0.45 mm thick Strong Acid Cation Exchange and Anion Exchange were purchased from Membranes International (Ringwood, NJ). The Buna-N rubber gaskets (Durometer hardness rating of A55) were used to support and seal the membranes between chambers. The two equal-sized electrodes used in the MFCs were EC-12 grade EDM (5 × 3.5 × 0.5 cm) blank graphite plates (GraphiteStore.com). Electrode pretreatment was performed as described by Bond and Lovely (2003). The Ohmic resistance of the electrodes was measured as 0.8 ± 0.3 Ω. Resistances of 2,500 Ω with 0.1% variation provided by decade box were used as external resistances between anodes and cathodes. Six MDCs were used for treatment, three replicates for algal desalination system and three for KFe(CN)6 desalination systems. A two chamber MFC with same configuration was constructed as control.

Photo schematic of three chamber desalinating MDC identifying MDC components () and process outputs ( ). MDC, microbial desalination cell.
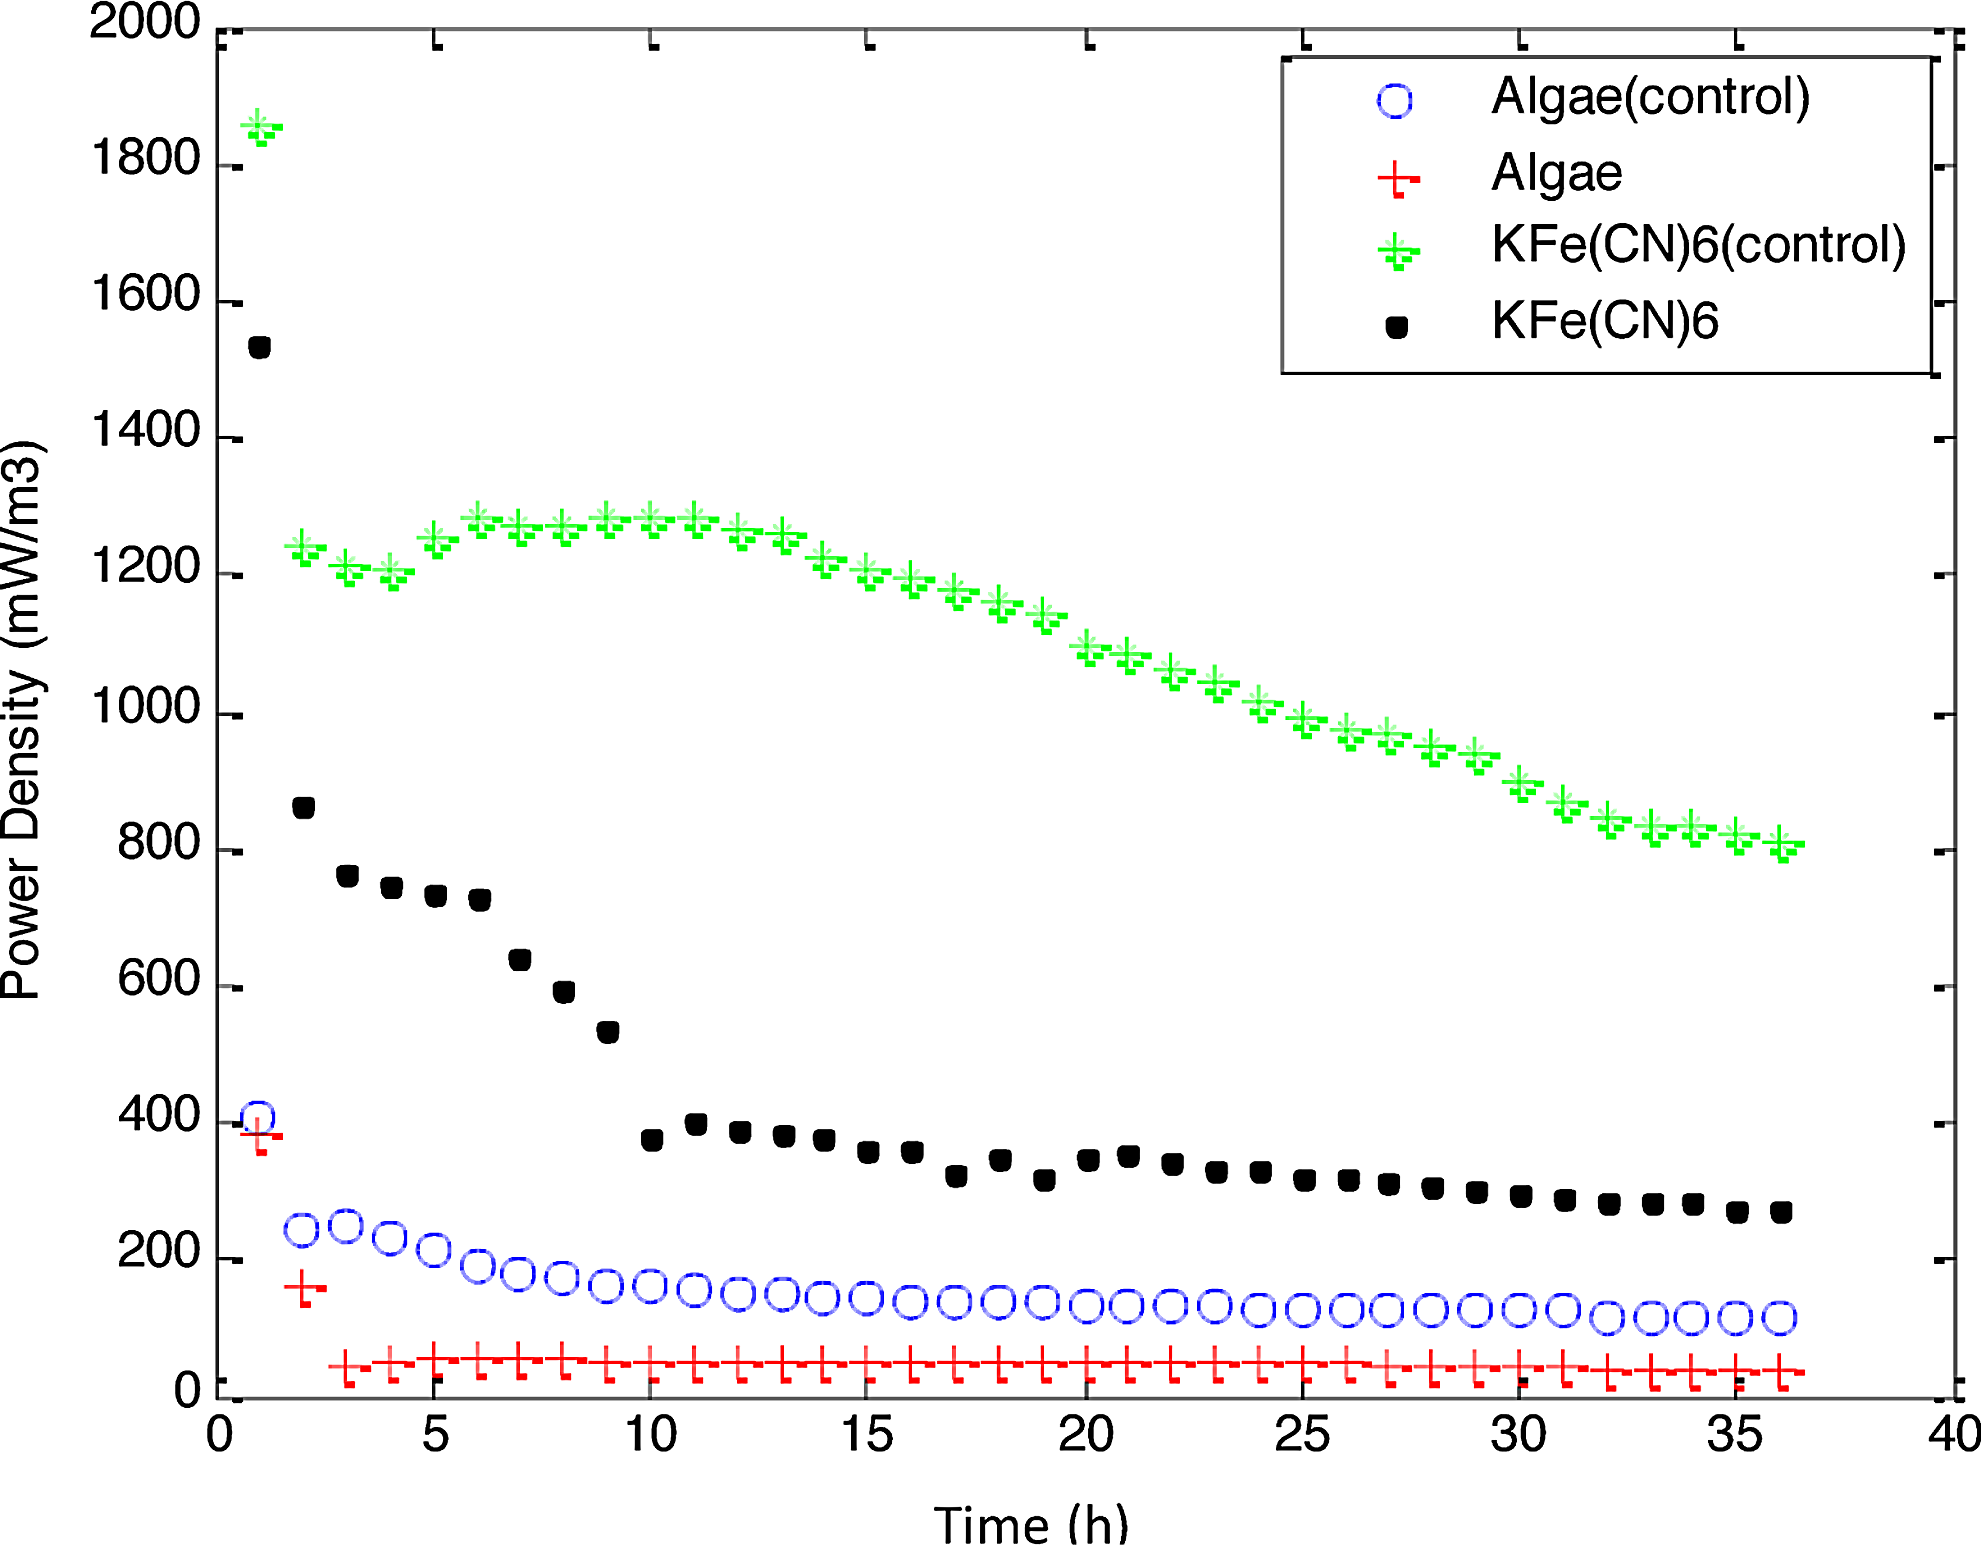
Power production potential of both catholytes.
The anode chamber of each MDC was filled with the medium and rumen fluid (10% of final volume, v/v) in an anaerobic chamber that had atmosphere of N2 (85%), H2 (10%), and CO2 (5%). An aerobic solution of potassium hexacyanoferrate (MDC 1) as described in Rismani-Yazdi et al. (2011) was used as the chemical catholyte; a Nannochloropsis salina culture (10%) of the cathode compartment (v/v) that has been grown for 15 days (MDC 2) was used as the biocatholyte. The MFCs were incubated at 39°C ± 1°C on a shaker at 100 rpm.
Six MDCs were operated under batch mode for 1 week with 5 g/L glucose as the sole substrate in the anode compartment to allow buildup of microbial biomass, and then operated under fed-batch conditions for 2 months. During fed-batch operation, the microorganisms in the anode compartment were fed with fresh 10 mL anolyte after 24 h by removing 10 mL of previous anolyte. The catholyte was also replenished simultaneously. In the middle chamber NaCl solutions (35, 17.5, and 8.25 g/L) was added to mimic seawater composition. As control experiments distilled water in the middle chamber and a two chamber MFC were used.
Polarization tests were performed after 6 weeks. For DNA extraction and denaturing gradient gel electrophoresis (DGGE) analysis, periodic samples of every 24-h treatment were collected. The same samples were used for chemical oxygen demand (COD) removal efficiency and protein content analysis.
Biofilm analysis
Before starting partial desalination in the MDC, biofilm growth was analyzed and compared for different electrode materials. Five 2-chambered MFCs with potassium hexacyanoferrate as catholyte were used for biofilm growth experiments, each with 100 mL working volume and proton exchange membranes as described in Rismani-Yazdi et al. (2011). Five different materials (carbon cloth, carbon paper, graphite plate, graphite felt, and steel mesh coated with graphite powder) were analyzed for biofilm development using above mentioned rumen microorganism and growth media. Biofilm growth on electrode materials was quantified by protein content of extracted microbial biomass using a Bicinchoninic acid (BCA) protein kit (Fisher Scientific) under current and no-current conditions using 1,000 Ω external resistance. For microbial biomass of biofilm extraction a procedure described by Williams et al. (2009) was followed. Maximum biofilm growth was observed under constant current conditions on graphite plate. This configuration was used for subsequent MFC experiments.
Electrical measurements
Electrical output of each MDC was monitored by measuring the potential difference (voltage) between the anode and cathode across a known resistance (R) (2,500 Ω) using a data acquisition unit (DataQ Instrument, Akron, OH) connected to a computer. Electrical measurements were recorded after every 10 s. The power density (W/m3) was calculated according to the equation, P = I × V/L3, where V is the voltage (V), I (I = V/R) the current (amps), and L3 volume of electrolyte used in the anodic chamber (m3). Polarization characteristics were determined by varying the external resistance between the electrodes stepwise from 1 MΩ to 9.9 Ω with a 30 min pause at each resistance to allow the voltage to reach a stable value.
Cyclic voltammetry was performed using a potentiostat (VMP3B-5; Biologic) interfacing with a personal computer. Voltammograms were measured between −2.5 V and 2.5 V at 20 mV/s. Three cycles (n = 3) were collected for each measurement. The working and counter electrodes were made of graphite plates while Ag/AgCl was used as the reference electrode.
DNA extraction and DGGE
Suspended microorganisms in the anode compartment were sampled from each MDC. The microbial biomass was pelleted by centrifugation at 12,000 g for 15 min at 4°C. The pellets were stored at −80°C to preserve the microbial biomass until DNA extraction. Genomic DNA was extracted from the pellets using repeated bead beating and column purification methods as described by Yu and Morrison (2004a). The DNA recovered from each sample was quantified fluorospectrometrically using a Quant-iT broad range DNA assay kit Q33130 (Molecular Probes, Eugene, OR) and then diluted to 10 ng/μL with Tris-EDTA buffer.
Differences in the anode chamber microbial communities between MDC 1 and MDC 2 were analyzed using DGGE as described previously by Yu and Morrison (2004b). Briefly, the 16S rRNA genes were polymerase chain reaction (PCR) amplified with universal primer GC EUB357f and EUB519r. Following confirmation by agarose gel electrophoresis, the PCR products were resolved using DGGE. The rumen sample used initially to inoculate the MFCs was not available for DGGE and phylogenetic analysis.
Isolation and identification of culturable bacteria
Diluted MFC culture was distributed on the same medium plates previously used to feed MFCs and incubated at 39°C for 2–3 days for colony growth. Colony PCR technique was used to identify culturable bacteria in MFC with universal bacterial primer sets to amplify 16S rRNA gene from randomly picked colony isolates. PCR amplification was performed with primer set of 25f (5′-GAGTTTGATCMTGGCTCAG-3′) and 1525r (5′-AAG GAG GTG WTC CAR CC-3′) to amplify 16S rRNA gene. The PCR reaction programmed as follows: an initial denaturation step at 95°C for 5 min; 35 cycles of 95°C for 30 s, 55°C for 45 s, and 72°C for 1:40 min; and a final extension for 10 min at 72°C. Agarose gel electrophoresis was used to confirm the PCR products and further purification was done by using a PCR purification kit (Qiagen) and quantified. The purified PCR products were then submitted for sequencing at the DNA Genotyping/Sequencing Unit at The Ohio State University. The sequence identity was determined by comparison with similar sequences of all reference microbes using BLAST search (Altschul et al., 1990). The neighbor-joining phylogenetic trees were constructed with the Molecular Evolutionary Genetics Analysis package (MEGA version 6.0) using the Jukes-Cantor algorithm (Zhang et al., 2012) and bootstrapped with 1,000 repetitions. Identified bacterial species have been deposited in GenBank database under accession number (KT906191–KT906214). Fluorescent live bacterial biofilm staining was performed using dyes SYTO 9 and analyzed under Leica TCS SP6 confocal scanning microscope with digital camera for imaging. The excitation/emission maxima for these dye is about 480/500 nm for the SYTO 9 stain.
Salinity measurements
Desalination was monitored after every 24 and 48 h, and a fresh solution was replenished after every 48 h. A conductivity meter (Orion model 125) was used on the salinity mode for determining the salinity percentage in the middle chamber of the MDC. The salinity meter was calibrated each time with 12.9 mS, 1,413 and 100 μS Orion standards. The salinity was measured by placing the conductivity probe cell in the 15 mL of sample taken from middle chamber, slightly agitating the cell to remove air bubbles and allowing the reading to stabilize. The salinity readings were displayed in units of parts per 1,000.
COD removal
COD was measured to check treatment efficiency in terms of substrate utilization. COD was measured using acid digestion method. COD removal efficiencies were calculated by using:
where CODi = the COD concentration of the influent flow (mg/L), and CODe = the COD concentration of the effluent (mg/L).
Results and Discussion
Power generation
Power generation in MDCs greatly depends upon the efficient transfer of electrons generated by microbes to the surface of the anode electrode. Maximum current and the mass of biofilm on electrode surfaces are positively correlated (Zhu et al., 2013). The efficiency of rumen culture to make biofilm MDCs with different electrode materials was evaluated to select a system that produced high currents, which translates to high power. Table 1 presents protein content of biofilm growth per cm2 of electrode material. Results show two to five times increase in protein content under closed circuit (1,000 Ω) conditions. Meanwhile, rumen culture growing with electrode material only without external load did not produce a biofilm. Rismani-Yazdi et al. (2011) also showed differences between anodes with attached and suspended planktonic communities.
In closed circuit conditions, microbes directly transfer their electrons (mediator less). By maintaining favorable conditions within the MDC, those microorganisms that do not need mediators can be isolated and enriched. Reguera et al. (2006) also proved that biofilm formation and nanowire (pilli) production leads to increased current up to (10-fold) generation in MDCs. Kumar et al. (2013) analyzed different set potentials (−0.3, −0.2, and +0.2 V) for performance of biofilms and found that +0.2 V among the selected potentials produced maximum current density and induced the most biofilm growth. In this study our results showed that biofilm interacts with a variety of materials differently under the same physico-chemical and electrical conditions. Graphite plate was used because it gives more durable connections with copper wires as compared to paper; also, the biodegradation of graphite plate was minimal compared to other materials. Further investigation is needed in this area to explore what are the conditions and materials that support more biofilm development than others.
Figure 2 showed power generation in the MDCs. The power density with KFe(CN)6 (MDC 1) under desalination conditions in the middle chamber was high in the first hour of operation (1,532 mW/m3, 51 mW/m2), and a sharp decrease was observed reaching 379 mW/m3 after 10 h. Power generation was calculated based on the anolyte volume (100 mL). The power generation attained at equilibrium (10 h) is similar to or higher than other published authors (Bond and Lovely, 2003; Chaudhuri and Lovely, 2003; González del Campo et al., 2013). The power density of algae catholyte (MDC 2) under desalination condition was started at 384 mW/m3 or 13 mW/m2, a very fast drop of power density in first 2 h was observed and then it attained equilibrium. Maximum power at equilibrium was 51 mW/m3, which is in accordance with results of Bond and Lovely (2003) and González del Campo (2013) in two chamber MFCs. So these results are similar in comparison of power generation, and improved by the additional benefit of desalination.
Algae take some time to adapt to new environmental conditions after each feeding. Steady power production was maintained from 3 to 24 h and then lost. The same results were observed for algae biomass production, which achieved equilibrium at 30 g/L from 3 to 24 h and then biomass production declined. The profiles of power density under desalination were compared to the nondesalination conditions using distilled water as the control. MDC 1 and MDC 2 both attained equilibrium 2 h after feeding, producing 1,855 mW/m3 or 61 mW/m2 and 244 mW/m3 or 8 mW/m2 respectively. The results suggested that the power production potential of the algal MDC 2 is three to four times lower than chemical MFC 1 but stable over a longer time. However, the presence of salt solution in the middle chamber poses a stress on power production and a reduction in power was observed in both MDCs. Presence of a salt concentration gradient across the membranes increased the area resistance of the membrane (Geise et al., 2014). No salt precipitates was observed in the cathode chamber. As control a two-chambered MFC was also constructed and it shows relatively higher power production (428 mW/m3) in first hour of operation and reduces to 156 mW/m3 in 24 h. Two-chambered system with chemical catalyst gives high power output compared to biocatholyte MDC but replanishment and disposal of chemical are big issues.
Treatment efficiency
Salinity removal in the three-chambered MDCs has been documented with an efficiency of 90% from 35 g/L NaCl solutions which is similar to sea water (Kim and Logan, 2013). However, for salt removal efficiencies to reach 90%, high volumes and low concentrations of anolytes and catholytes are required (Mehanna et al., 2010; Jacobson et al., 2011). The volumes of anolyte and catholyte required for complete desalination ranges from 55 to 133 times of salt water in stacked MDCs (Chen et al., 2011). Kim and Logan (2013) achieved partial desalination (40–60%) with a wastewater to saltwater ratio of 3:1 by volume. The present study used equal volumes of anolyte, catholyte, and salt water. Salinity removal was measured from effluents of the middle chamber. Partial desalination efficiencies of 41–45% using KFe(CN)6 and 43–45% using algae were achieved in a 24-h cycle when 35 g/L NaCl solution was used as salt water (Fig. 3). After reducing the initial concentration by half (17.5 g/L), 72% and 79% salt removals were achieved by KFe(CN)6 and algae catholytes respectively (Fig. 3). While further reducing salt concentration (8.25 g/L) less than 20% of desalination was observed. The reason may be that at the low concentration salts could not move toward anode chamber as its total dissolve solids were higher than 8.25 g/L. In brackish water (10 g/L) NaCl, Luo et al. (2011) reported 80% salt removal.

Desalination efficiency (%) comparison.
Mehanna et al. (2010) observed 43–67% salinity removal with 20 g/L of NaCl. Results indicate that the presence of rumen culture in concentrated anolyte (5 g/L glucose) and marine algae catholyte supports desalination even when equal volumes of salt free water to salt water are used. Three chamber MDCs with algal catholytes are better at salt removal than chemical catholytes when treating brackish water. The extent of desalination is not sufficient to achieve drinking water status, but partial desalination performance makes this a potential pretreatment technology. Table 2 summarizes literature review to compare desalination potential of MDCs with previously published studies.
COD, chemical oxygen demand; MFC, microbial fuel cell; PBS, phosphate-buffered saline.
Treatment efficiency of the three-chambered MDCs was measured in terms of COD removal. Table 3 summarizes treatment characteristics of the MFCs. COD removal efficiency of substrate in the anodic chamber was monitored over a 24-h cycle.
sCOD, soluble chemical oxygen demand.
Bacteria present in the anodic chamber act as biocatalysts to break chemical bonds of organic substrates and release energy. The influent soluble chemical oxygen demand (sCOD) was very high in the anodic chamber (18,893 mg/L) and cathodic chamber (21,827 mg/L). The effluent sCOD indicated that 80% had been removed in MDC 1 using KFe(CN)6 as the catholyte; that value was 85% when algae were used as the catholyte under desalination condition. Removal efficiencies rose to 82% and 91% under no salt conditions. Similarly, cathodic chamber sCOD removal was observed to be 69% ± 3% and 70% ± 4% respectively. Luo et al. (2012) observed 54% COD removal in their three-chambered MDC. These results indicate that simultaneous biotreatment and bioelectricity production with desalination can be achieved in three chamber MDCs. Wastewater treatment and algal cultivation with simultaneous power production are the additional benefits of this technology.
Microbial community analysis
Microbial communities in MDC 1 and MDC 2 were compared using DGGE analysis following 8 weeks of continuous electricity generation under a fixed circuit load. The banding patterns developed during desalination were quite similar to control in all MDCs with a few additional bands under desalinating conditions (Fig. 4), suggesting that a variety of microbial communities had developed based on chloride ion tolerance. The DGGE profiles for the MDCs operated with different catholytes were also different in both the MDC 1 and MDC 2 consortia, demonstrating that microbial communities changed in response to the types of catholytes used as electron acceptors in each MDC.
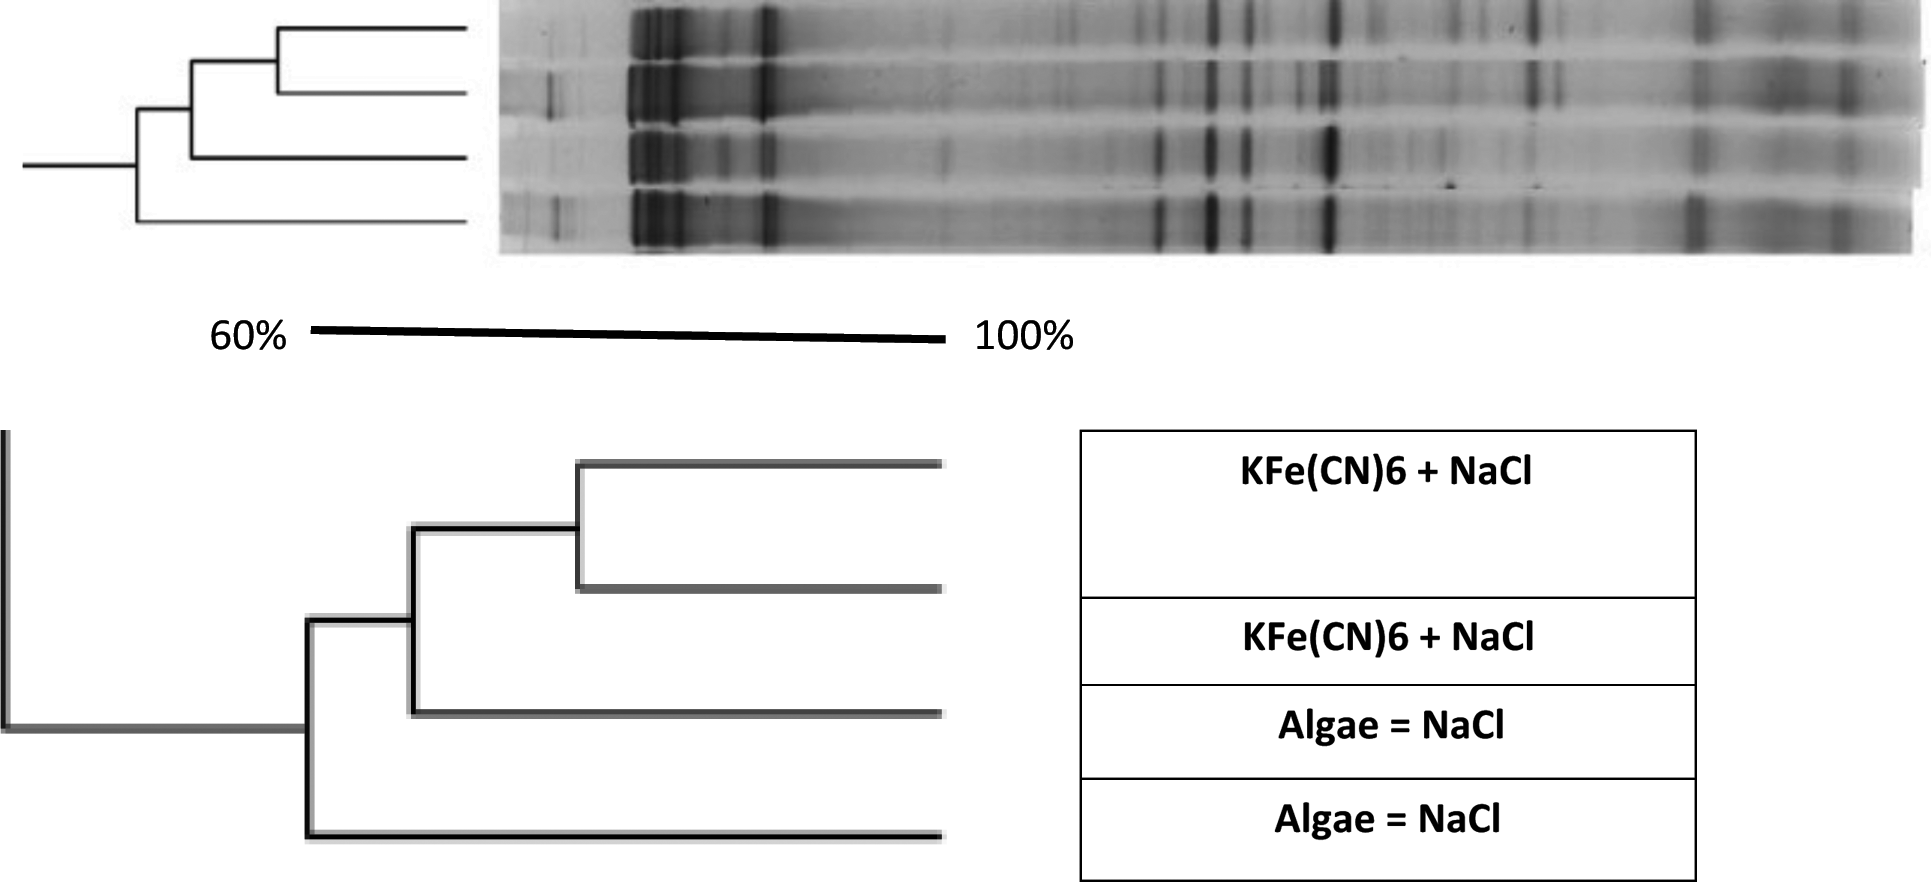
KCN+salt and Algae+salt dendograms constructed using Jaccard's similarity coefficient generated from DGGE profile. DGGE, denaturing gradient gel electrophoresis.
Unweighted Pair Group Method with Arithmetic Mean (UPGMA) dendograms with Jaccard's coefficients revealed differences in the DGGE profiles (Fig. 4). A greater consistency was observed among DGGE fingerprints of the biocatholyte communities (58%) during desalination as compared to the chemical catholyte. The banding patterns and dendogram revealed an effect of salt on the microbial communities.
The reason behind the observed patterns under salt and no-salt conditions in the desalination chamber may be due to differences in anode potential, which is directly affected by the type of catholytes used. Additionally, the presence of salt ions gives a competing environment with already existing ions. Varying the external resistance in turn changes the microbial community (Srikanth et al., 2010; Rismani-Yazdi et al., 2011) and colonization characteristics of anode-reducing bacteria (Liu et al., 2008; Torres et al., 2009). Similarly, varying the internal resistance has also produced changes in diversity of the anode-reducing microbial community. The effect of anode potential on enzymatic modulation and respiratory activity of bacteria has also been demonstrated (Lee et al., 2009; Lyon et al., 2010). Presence of additional chloride ions may also build a competing environment in the anode chamber affecting redox potential regimes (Liu et al., 2005; Oh and Logan, 2006; Luo et al., 2012).
In this study, we isolated 12 distinct colony units randomly picked from MDCs under desalinating conditions and 12 distinct colony units under nondesalinating conditions. The pyrosequencing data revealed that under desalinating conditions the colonies of microbes mainly comprises of three different families Clostridiaceae (20%), Lactobacillaceae (60%), and Enterococcaceae (20%). Among them 60% of the colonies belong to Lactobacillaceae family and they include Lactobacillus and Pediococcus species. Identification of sequences suggest that among 12 isolated colonies 50% were isolated twice although their colony shape was visibly different. While, under nondesalinating conditions species from four different families exists, which includes, Eubacteriaceae, Clostridiaceae, Lactobacillaceae and Enterococcaceae. Under nondesalinating conditions, Clostridiaceae and Lactobacillaceae shared majority (66%) equally while the others were 18% of the total isolated species. Organisms from Eubacteriaceae are only visible under nondesalinating conditions. The results suggested that MFC enriched inoculum is very different from initially fed inoculum previously studied (Rismani-Yazdi et al., 2013). Table 4 summarizes identified names of bacterial species present in the anode chamber. The resemblance with already published species based on 16SrRNA was >90%. Enrichment in the MFCs plays a vital role in selections of exoelectrogenic species. Overall species identification shows that anode chamber inhabiting bacteria are obligate anaerobes, fermenters (clostridia spore formers) nonmethanogens, and gram positive.
Rabey et al. (2004) suggested Pseudomonas sp. Ochrobactrum sp. and Clostridium sp. poses capacity to generate electricity. Pseudomonas sp. produces some metabolites which can function as electron shuttles (mediators) (Rabey and Verstraete, 2005). Absence of Pseudomonas sp. can suggest that the isolated species may have direct electron transport mechanism. Species of the genus Clostridium are considered to be obligate anaerobes and can dissimilate glucose to acetate, butyrate, lactate, ethanol, H2, and CO2 (Rainey et al., 2009). Characteristic fermentation products of Enterobacteriaceae include format, succinate, lactate, acetate, ethanol, H2, and CO2 (Brenner and Farmer, 2005). Most electrons derived from supplemental glucose are recovered in lactate (Wüst et al., 2011); therefore, presence of Lactobacillaceae species was not surprising. Consistent with previous studies MFC fed with organic waste sources, Bacteroides and Clostridium, are dominant exoelectrogens (Karluvali et al., 2015). Identified species were organized in a Phylogenetic tree (Fig. 5), more than 90% of accession numbers are matching with already identified species. The tree presents mix combination of identified species under desalinating and nondesalinating conditions. Figure 6 shows confocal image of laser microscope stained with SYTO 9 for live cells to identify shape of bacteria. The image reveals presence of rod-shaped bacilli and chain of cocci spread on the biofilm.

Phylogenetic tree of isolated species from MDCs. Sequences were aligned with CLUSTALW, and distances with the Jukes and Cantor algorithm. Bootstrap confidence levels greater than 50% are indicated above the nodes (replicate 1,000 times). Numbers in parentheses represent the sequences accession number in GenBank.
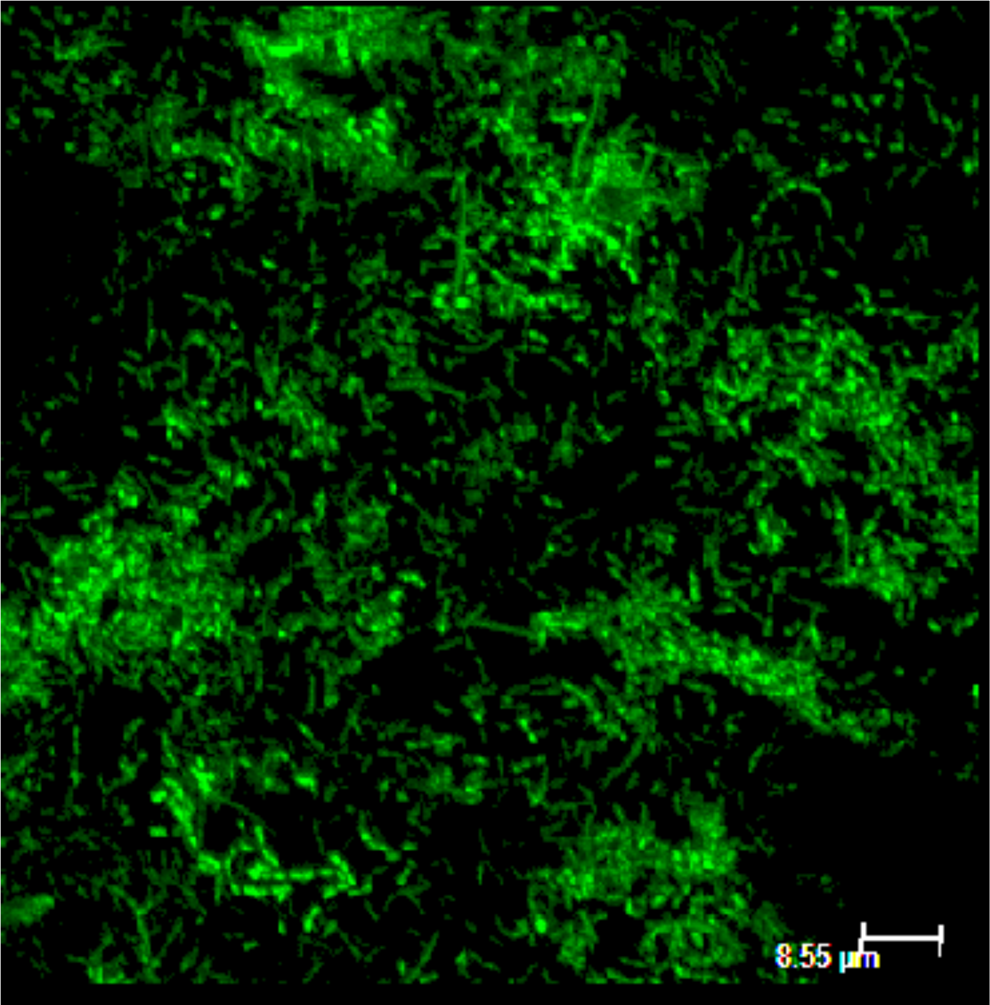
Confocal laser microscopic image of live biofilm on electrode surface.
Polarization characteristics
Polarization properties of the MDCs are shown in Fig. 7A and B. The polarization curve reflecting voltage-current and power-current characteristics was consistent with the expected properties of a typical fuel cell (Rismani-Yazdi et al., 2011). Polarization studies were conducted under two different catholytes. Open circuit potentials (OCP) were 720 ± 15 mV in MDC 1 and 445 ± 21 mV in MDC 2. During polarization testing the voltage of MFC 1 dropped from 720 mV (OCP) to 512 mV (at 1 MΩ load corresponding to 0.231 mA in current), which was a loss of 28%, while in MFC 2, voltage dropped from 445 mV (OCP) to 275 mV (1 MΩ load corresponding to 0.072 mA in current), which was 38% of the initial potential. Kakarla and Min (2014) observed 20% and 32% potential drop at 5 kΩ under no aeration and mechanical aeration using Scenedesmus obliquus algae as the catholyte.
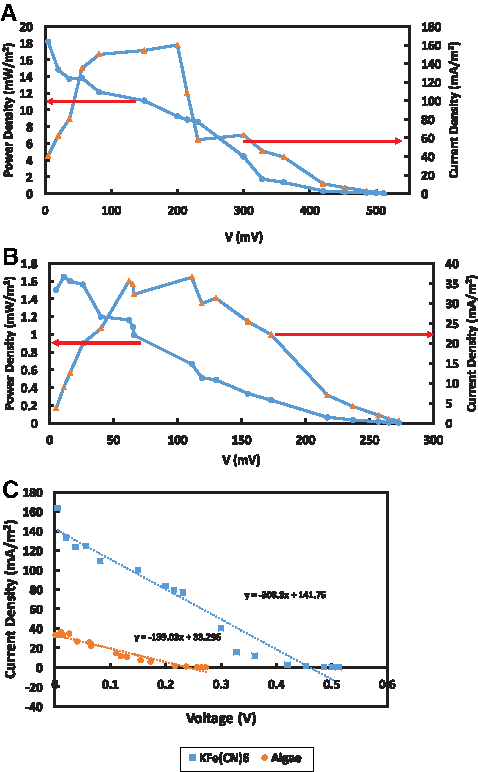
Polarization and internal resistance characteristics of catholytes
The higher cathode potential in MDC 1 may have been due to the higher oxidation capability of KFe(CN)6 and less internal resistance of the cathode (ohmic and charge transfer). Maximum power density reached 17,787 mW/m2 at a current of 77 mA/m2 with 1,000 Ω resistance for the KFe(CN)6 catholyte. In the algal MDC, the maximum was 1,564 mW/m2 at a current of 24 mA/m2 with 900 Ω resistance. MDC power generation is greatly influenced by internal resistance. The internal resistance was measured by the slope method after polarization testing (Logan, 2008; Vologni et al., 2013). The internal resistance of MDC 1 (Fig. 7C) was determined to be 308 Ω and MDC 2 was 139 Ω (Fig. 6). The internal resistance of algae was 54% less than KFe(CN)6 with the algae providing a sustainable source of oxygen for reduction reactions in the cathode chamber.
Cyclic voltammetry
Amount of available oxygen and reduction potential for MDCs with two different electrolytes were measured by cyclic voltammetry (Fig. 8). Voltammograms of the catholyte containing algae in the presence of mechanical aeration and no aeration, and potassium ferricyanide were collected on graphite plate electrodes. A Ag/AgCl was used as the reference electrode. The potential was scanned between −1 and 0 V. During mechanical aeration, an increase in the reduction current was observed at potential negative of −300 mV where the reduction current increases from −7 to −10 mA. The current from the aerated solution was 30% greater than the nonaerated solution. Mechanical aeration did not significantly enhance the reduction current. The reason may be that the suspension of N. salina microalgae was fully homogeneous and photosynthesizing at its full capacity so that mechanical aeration did not dissolve any additional oxygen or that the electron transfer rate of the redox species is not mass transport dependent. The reduction peak of potassium ferricyanide was observed at −50 mV and −250 mA. This higher reduction current was due to the high reduction potential of this chemical.
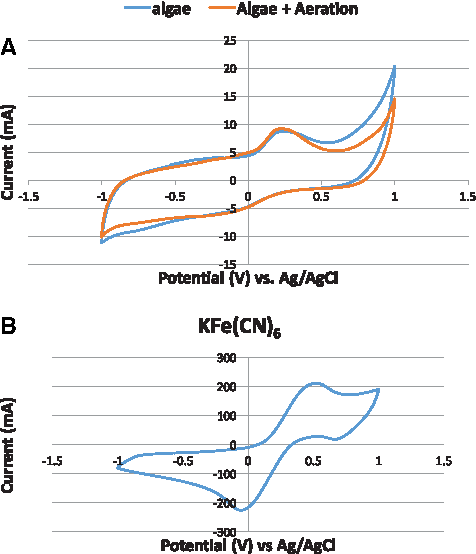
Cyclic voltammogram of
Formation of algal reduction peaks under aeration and no aeration conditions occurred at similar potentials, which shows that the same reducing species are involved. Reduction peaks in S. obliquus and Chlamydomonas reinhardtii were observed at −93 mV and −180 mA respectively (Liu et al., 2013; Kakarla and Min, 2014). Our selected algal specie N. salina had higher reduction potential then the above-mentioned algae. Oxidation peaks for algae with mechanical aeration, algae with no aeration and potassium ferricyanide were 200 mV at 10 mA, 200 mV at 9 mA, and 500 mV at 210 mA respectively. Very distinctive anodic peaks were observed as compared to cathodic peaks. Based on the cyclic voltammetry analysis, the chemical catholyte had higher electron holding capacity but the biocatholyte also performed well because of its additional benefits of logarithmic growth and no need of replacement.
Conclusion
MDC power generation and desalination performance were influenced by the type of catholyte. Marine microalgae N. salina were able to support MDC power generation at lower power generation rates but higher desalination rates when compared with KFe(CN)6 catholytes. Although the internal resistance of algae was lower than for KFe(CN)6 there are other factors that affect the power generation potential of MDCs. COD removal efficiency was almost the same for both catholytes as it mainly depends upon anolyte microorganisms and internal conditions of the anode chamber. Isolation and identification of microbes suggested presence of gram-positive facultative anaerobes from Firmicutes phylum. Use of algae as a catholyte has additional benefits besides power generation including wastewater nutrient removal, CO2 capture, sustainable biomass production, economic feasibility, and use of green technology.
Footnotes
Acknowledgments
The authors want to express their gratitude to Drs. Yebo Li and Jeffrey Firkins for algal cultures and rumen consortia, respectively, along with general advice and assistance. Kwan Leung for assistance in operating the potentiostat. We acknowledge the International Institute of Education for Fulbright funding for doctoral studies of Ms. Beenish Saba. Salaries and research were partially supported by state and federal funds appropriated to The Ohio State University/Ohio Agricultural Research and Development Center (OSU/OARDC). Mention of proprietary products does not constitute a guarantee or warranty of the product by OSU/OARDC and also does not imply approval to the exclusion of other products that may also be suitable.
Author Disclosure Statement
No competing financial interests exist.