
Abstract
Abstract
Many researchers have studied the importance of zeta potential control for algae separation by flotation processes. This study focused on measuring and comparing the zeta potential of bubbles and algae (Anabaena spp.) at varying pH with and without chemicals, and simulating the flotation model to estimate the effect of the zeta potential on the collision-attachment coefficients and removal efficiency at pH ≥9. The findings of this study are as follows: (1) at pH 2–12, the zeta potential of CO2 bubbles without surfactants ranged from −14.69 to −32.38 mV and the mean zeta potential of algae ranged from −16 to −31 mV. (2) Bubbles showed positive zeta potential values at pH <9 in the presence of a cationic surfactant, while negative zeta potential values increased in the presence of anionic and nonionic surfactants. Nonionic chemicals did not have a significant effect on the zeta potential of the bubbles. (3) Model simulation results at pH >9 showed the sensitivity of zeta potential and size of bubbles and algal particles on the collision-attachment coefficient and removal efficiency. Optimum algae removal was achieved with CO2 bubble zeta potential between −0.5 and +2.5 mV at pH ≥9.
Introduction
R
Previous studies have suggested the variation of zeta potential to achieve successful coagulation and improve algae removal efficiency in the flotation process. Taki et al. (2008) investigated the possibility of a flotation process combined with chemical compounds and an electrostatic bridge. The authors seek efficient removal of phytoplankton with high pH environments based on the zeta potential of phytoplankton surface in high pH (>9) water.
Kwak et al. (2006) have examined the behavior and removal characteristics of particles of clay and algae under various conditions and showed the sensitivity of zeta potential of blue-green algae, which fluctuated significantly with coagulant dosage in treatment conditions. Henderson et al. (2008) have conducted experiments for the coagulation of algae (Asterionella formosa, Melosira spp., Microcystis aeruginosa, and Chlorella vulgaris) in the flotation process and reported the importance of zeta potential control for algae removal. The optimum removal of algae is achieved with adjusting of zeta potential between −8 and +2 mV.
Several researchers have previously examined the zeta potential of bubbles in aqueous solutions and associated impact parameters, that is, pH, surfactant type and concentration, bubble size, and solution chemistry (Li and Somasundaran, 1992; Saulnier et al., 1996; Yang et al., 2001; Takahashi, 2005; Jia et al., 2013). The significant interaction mechanism between air bubbles and polymers causes flocculation in dissolved air flotation (DAF) for the wastewater treatment.
Electrophoretic mobility is measured to calculate the zeta potential of bubbles as the most common method for surface charge measurement of bubbles (Li and Somasundaran, 1992; Oliveira and Rubio, 2011). Li and Somasundaran (1992) have studied the electro-kinetic behavior of gas bubbles in aqueous electrolyte solutions. Oliveira and Rubio (2011) have determined the zeta potential of air bubbles in the absence and presence of different polyacrylamides, cationic, anionic, amphoteric, or nonionic polymers, at varying pH (2.0–12.0). The positive surface charges of the bubbles in the presence of cationic polymer are determined as being between pH 2.0 and 8.0, while the charge of the bubbles becomes more negative in the presence of anionic, amphoteric, and nonionic polymers.
This study investigates the effects of chemicals on the zeta potential of bubbles and algae particles in aqueous solution, comparing zeta potential of carbon dioxide bubbles (CO2) measured in this study and values obtained from the literature (Oliveira and Rubio, 2011), and evaluating electrostatic force as a function of zeta potential in the flotation model. A series of model simulations is conducted to evaluate the collision-attachment coefficient and removal efficiency as a function of size distribution and zeta potential at varying pH levels, using a population balance in turbulence (PBT) model associated with a single collector collision (SCC) model.
Methodology
Experiments were divided into two parts in this study; one for laboratory experiments to measure zeta potential and the other for mathematical model simulations.
Laboratory experiments for zeta potential measurement
Zeta potential of CO2 bubbles was measured in the absence and presence of surfactants at varying pH levels controlled by 0.1 M NaOH and HCl. Because bubble surface was negatively charged in pure water (Tabor et al., 2011), this study added three different types of surfactants into tap water in a saturator (or a CO2-/air-dissolved tank), which was operated under the pressure of 202.65 kPa to induce positive-charged bubbles as shown in Tables 1 and 2. The chemical composition of tap water was as follows: pH 7.0, total dissolved solids 45 mg/L, alkalinity 14 mg/L, turbidity 0.1 NTU, DO 10.5 mg/L, hardness 25 mg/L, no NH4+-N, and no heavy metals (Cu, Fe, Al, and Mn) except Zn about 0.005 mg/L.
IEP of CO2 bubble is pH 6.0 in natural water (Tabor et al., 2011).
CTAB, cetyltrimethyl ammonium bromide; SLS, sodium lauryl sulfate; TX-100, polyoxyethylene glycol octylphenol ethers (Triton X-100); FlotigamEDA3B, Alkyl methyl ether monoamine; SDS, sodium dodecyl sulfate; DAH, dodecylamine hydrochloride; DTAC, dodecyltrimethyl ammonium chloride; C448, cationic polyacrylamide; A100, anionic polyacrylamide; SNF920SH, nonionic polyacrylamide.
The three different surfactants used in this study were cationic cetyltrimethyl ammonium bromide [CTAB, CH3(CH2)15N(CH3)3Br, CAS no. 8001-54-5, 364.46 g/mol], anionic sodium lauryl sulfate (SLS, NaC12H25SO4, CAS No. 151-21-3, 288.38 g/mol), and nonionic polyoxyethylene glycol octylphenol ethers [Triton X–100, C14H22O(C2H4O)n (n = 9–10), CAS no. 9002-93-1, 647 g/mol]. Table 1 gives information for the absence of surfactants and Table 2 is for the presence of surfactants, at a constant ionic strength controlled by 10−2M NaCl, including information of other studies obtained from literatures (Yoon and Yordan, 1986; Li and Somansundaran, 1992; Yang et al., 2001; Najafi et al., 2007; Oliveira and Rubio, 2011; Jia et al., 2013; Calgaroto et al., 2014);) to compare with this study's results.
Method of bubble zeta potential (BZP) measurement was adopted from Image analyzing equipment, an Imagescope (Sometech, Inc.), including a measuring cell, video camera, and image analyzing software based on electrophoresis mobility as shown in Fig. 1. CO2 bubbles were generated when the dissolved CO2 was decompressed to the cell plate of microscope passing through an adjustable valve under an atmospheric condition (101.30 kPa) from a saturator (or a CO2/Air dissolved tank) under pressure of 202.65 kPa for 1 h.
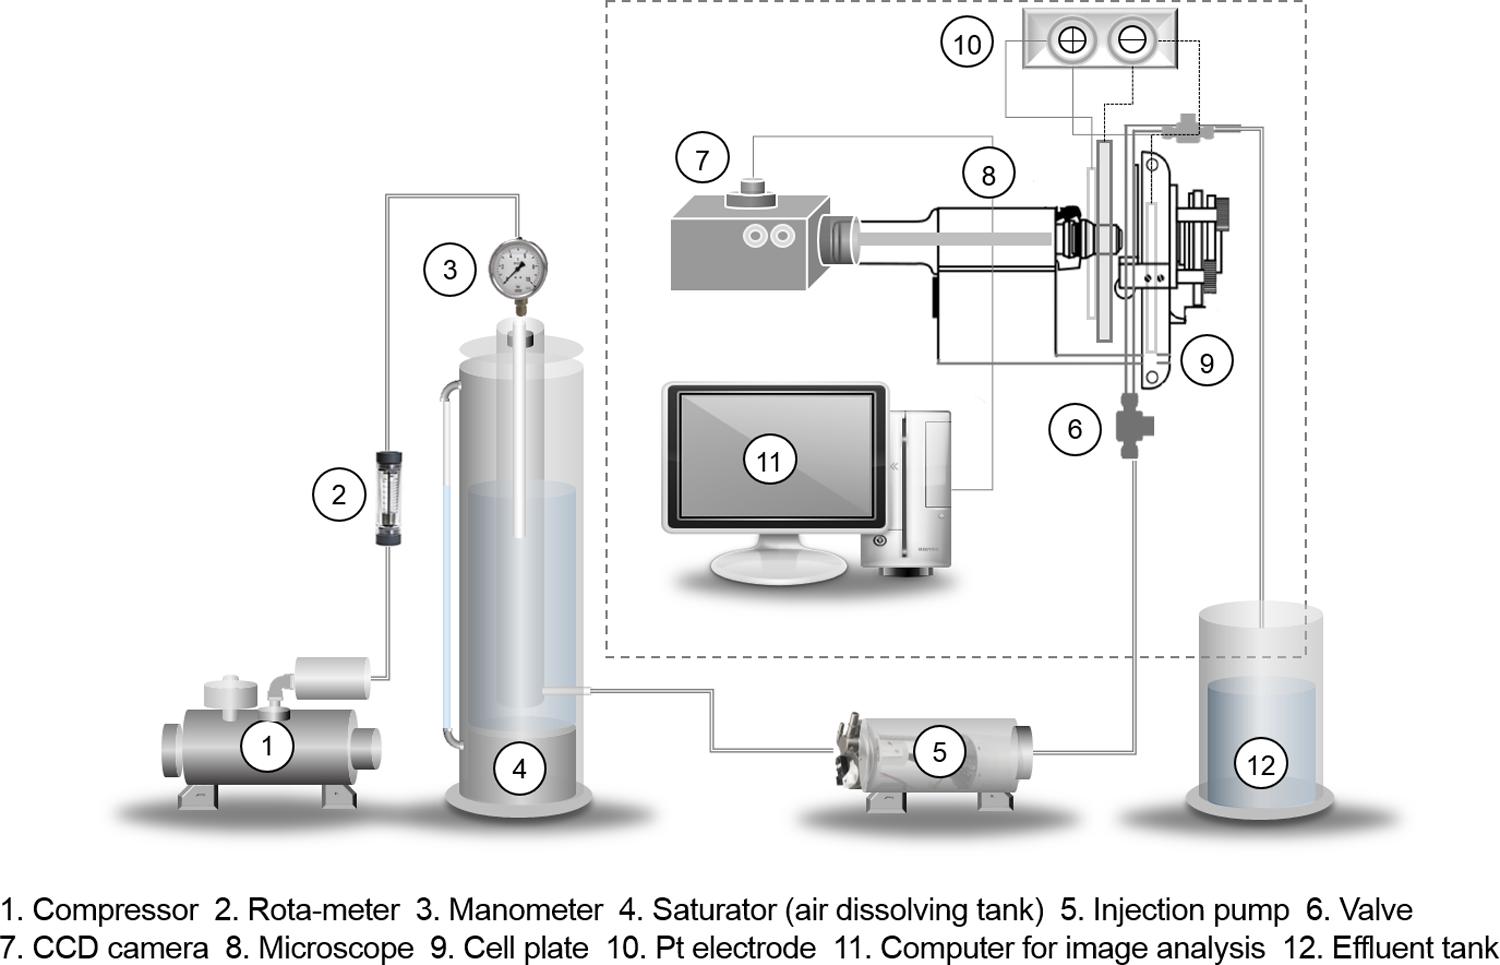
Schematic diagram to measure zeta potential of bubbles in dissolved air flotation process or dissolved CO2 flotation process.
When rising bubbles were passing through the cell plate of the microscope, movement of bubbles was changed in the opposite direction to the charge of bubbles by applying DC voltage electric fields (3–100 V) and recorded on the video tape. The video image through 0.033 s frame was decoded by the image analysis software to determine the horizontal and vertical (rising) velocity of bubbles. Focused on the stationary level in the cell of the microscope, a clear image of bubbles in the video tape is only measured in this study.
Meanwhile, the zeta potential values of algal particles were determined from electrophoretic mobility measurements in the absence of surfactants using a Photal Otsuka ELS-8000 (Japan) with a plate sample cell to investigate the surface charge of algal particle, to obtain an additional insight into the algal particle-water separation mechanism. Anabaena spp. (blue-green freshwater algae) obtained from the Korean Collection for Type Cultures was selected for zeta potential measurement after regular cultivation in a batch-scale photobioreactor for 15 days, with stirring, under the following conditions: 190–250 rpm, 30°C, and pH 7.4–8.4. Before the regular cultivation, 50 mL of Anabaena spp. was initially cultivated in a 1 L-Erlenmeyer flask equipped with a gauze stopper and autoclaved for 7 days.
Zeta potential was calculated using Smoluchowski's Equation (1) based on the electrophoretic mobility (Oliveira and Rubio, 2011).
where μ is the dynamic viscosity of the electrolyte solution (Pa·s), ɛr is the relative dielectric permittivity, ɛ0 is the dielectric permittivity of vacuum, ν is the horizontal velocity of bubble (m/s), K is the measured electrolyte conductivity (S/m), i is the measured electric current (A, Ampere), and A is the cross-sectional area of the electrophoretic unit (m2).
Model description
Flotation such as DAF or dissolved CO2 flotation (DCF) is a process that separates solids suspended in water by combining them with bubbles (air or CO2) injected from a saturator and flocs formed by flocculants. Major operation of flotation process includes bubble injection for particle separation, collision-attachment between bubbles and algal particles, bubble volume concentration (BVC), and hydraulic loading. Flocculation or autoflocculation of particles depending on particle size and particle zeta potential is extremely important for collision and attachment between bubbles and flocs (flocculated or autoflocculated particles) to separate the aggregate of bubbles and flocs (formed by flocculation or autoflocculation of particles) from water.
When bubbles are used as collectors to remove particles in water, the efficiency of the particle separation will also depend significantly on the bubble number concentration (BNC). Although the A/S (air to solid) ratio is an important operation parameter of the flotation process in the real fields, BVC instead of A/S ratio is considered in the model study because solid concentration is not varied. However, the BNC is a preferred operating parameter rather than the BVC when using CO2 bubbles instead of air as the collectors for particle separation in water (Kim and Kwak, 2014). The relationship of BNC (Nb) can be expressed by Equation (2) as a function of the bubble diameter (Db) and BVC (φb) as shown in Equation (3).
Numerous models use a concept of collision efficiency because it is an extremely important factor to determine the particle separation efficiency as providing a chance to attach bubbles on flocs. For a combination of particle and bubble induces, bubble particle collision-attachment efficiency can be determined by the SCC efficiency model, which is useful to understand particle deposition on a bubble's surface based on an extended DLVO theory related to the electrostatic, van der Waals, and hydrophobic force as a function of the major parameters influencing collision efficiency, the fluid (density, ionic strength, viscosity), particles (size, zeta potential, density, Hamaker constant, hydrophobic constant), and bubbles (size, zeta potential, density).
Recently, some parameters are studied such as effect of surface roughness and shape factor on interaction of particles (Hassas et al., 2016; Karakas and Hassas, 2015) and the effect of bubble size and velocity on interaction in particle–bubble related to collision efficiency (Hassanzadeh et al., 2016). To calculate the collision (
In Equation (4), rp is particle radius, rb is bubble radius, and Xc is critical distance. For further details related to the SCC model equations, one can refer to Kim and Kwak's previous studies (Kim and Kwak, 2014).
When considering an ideal plug flow in a batch reaction chamber, the PBT model assumes that all flocs have equivalent residence times in the reaction chamber and the flocs can be removed by bubble cloud due to a first-order reaction as shown in Equation (5). In the PBT model, Equation (2) can be converted into Equation (5) to calculate Equation (6), which describes the particle removal (or separation) efficiency (X) by the bubble.
where, Np,i is influent floc number concentration in unit volume, number m−3, Np,e is effluent floc number concentration in unit volume, number m−3, k is the turbulent collision rate constant, α0 is initial collision–attachment coefficient, Nb is BNC in unit volume, number m−3, and t is time interval (s). For further details related to the PBT model equations, one can refer to Kim et al. (2015).
Model simulation description
This study conducted model simulation using measured zeta potential values of CO2 bubble and algae (Anabaena spp.) as input parameters. The previous step utilized by Kim and Kwak (2014) was to develop flotation models (a PBT model associated with an SCC model), which described the flotation process by DAF and DCF. As a collector of particles in aqueous solutions, DAF used dissolved air bubbles and DCF applied dissolved carbon dioxide (CO2). These two kinds of bubbles presented different size distributions depending on pressure and different bubble characteristics in different pH conditions of solution.
In this study model, simulations were conducted to evaluate the sensitivity of model formulation for collision-attachment efficiency and removal efficiency as a function of zeta potential values of bubbles and algal particles under simulation conditions as shown in Table 3. The efficiency of the particle separation depends significantly on the BNC as well as size and zeta potential of bubble and particle. The BNC (Nb) 107 number m−3 effectively improved the removal efficiency of Npi. Thus, the initial number of algal particles (Npi) and bubbles (Nb) was selected as 1.0 × 10² number m−3 and 1.0 × 10⁷ number m−3, respectively. At the most, 178 bubbles in the supplied number of bubbles (i.e., Db of 150 μm) can be attached on the algal floc (i.e., Dp of 2.67 mm) based on Equation (7) formulized by Tambo et al. (1986).
Results and Discussion
Zeta potential of different types of bubbles
The zeta potential of different types of gas bubbles (air, N2 and CO2) in the absence of surfactants, as a function of varying pH (2.0–12.0) at a constant ionic strength of 10−2 M NaCl, is measured and compared as shown in Table 1 and Fig. 2. The zeta potential values of bubbles present the different distribution depending on the bubble types and their sizes at varying pH as shown in Table 2, Figs. 3, and 4. The CO2 in this study, labeled CO2-Present in Fig. 2, indicates measured zeta potential of CO2 bubbles in the absence of surfactants. The range of zeta potential is from −14.7 to −32.4 mV.
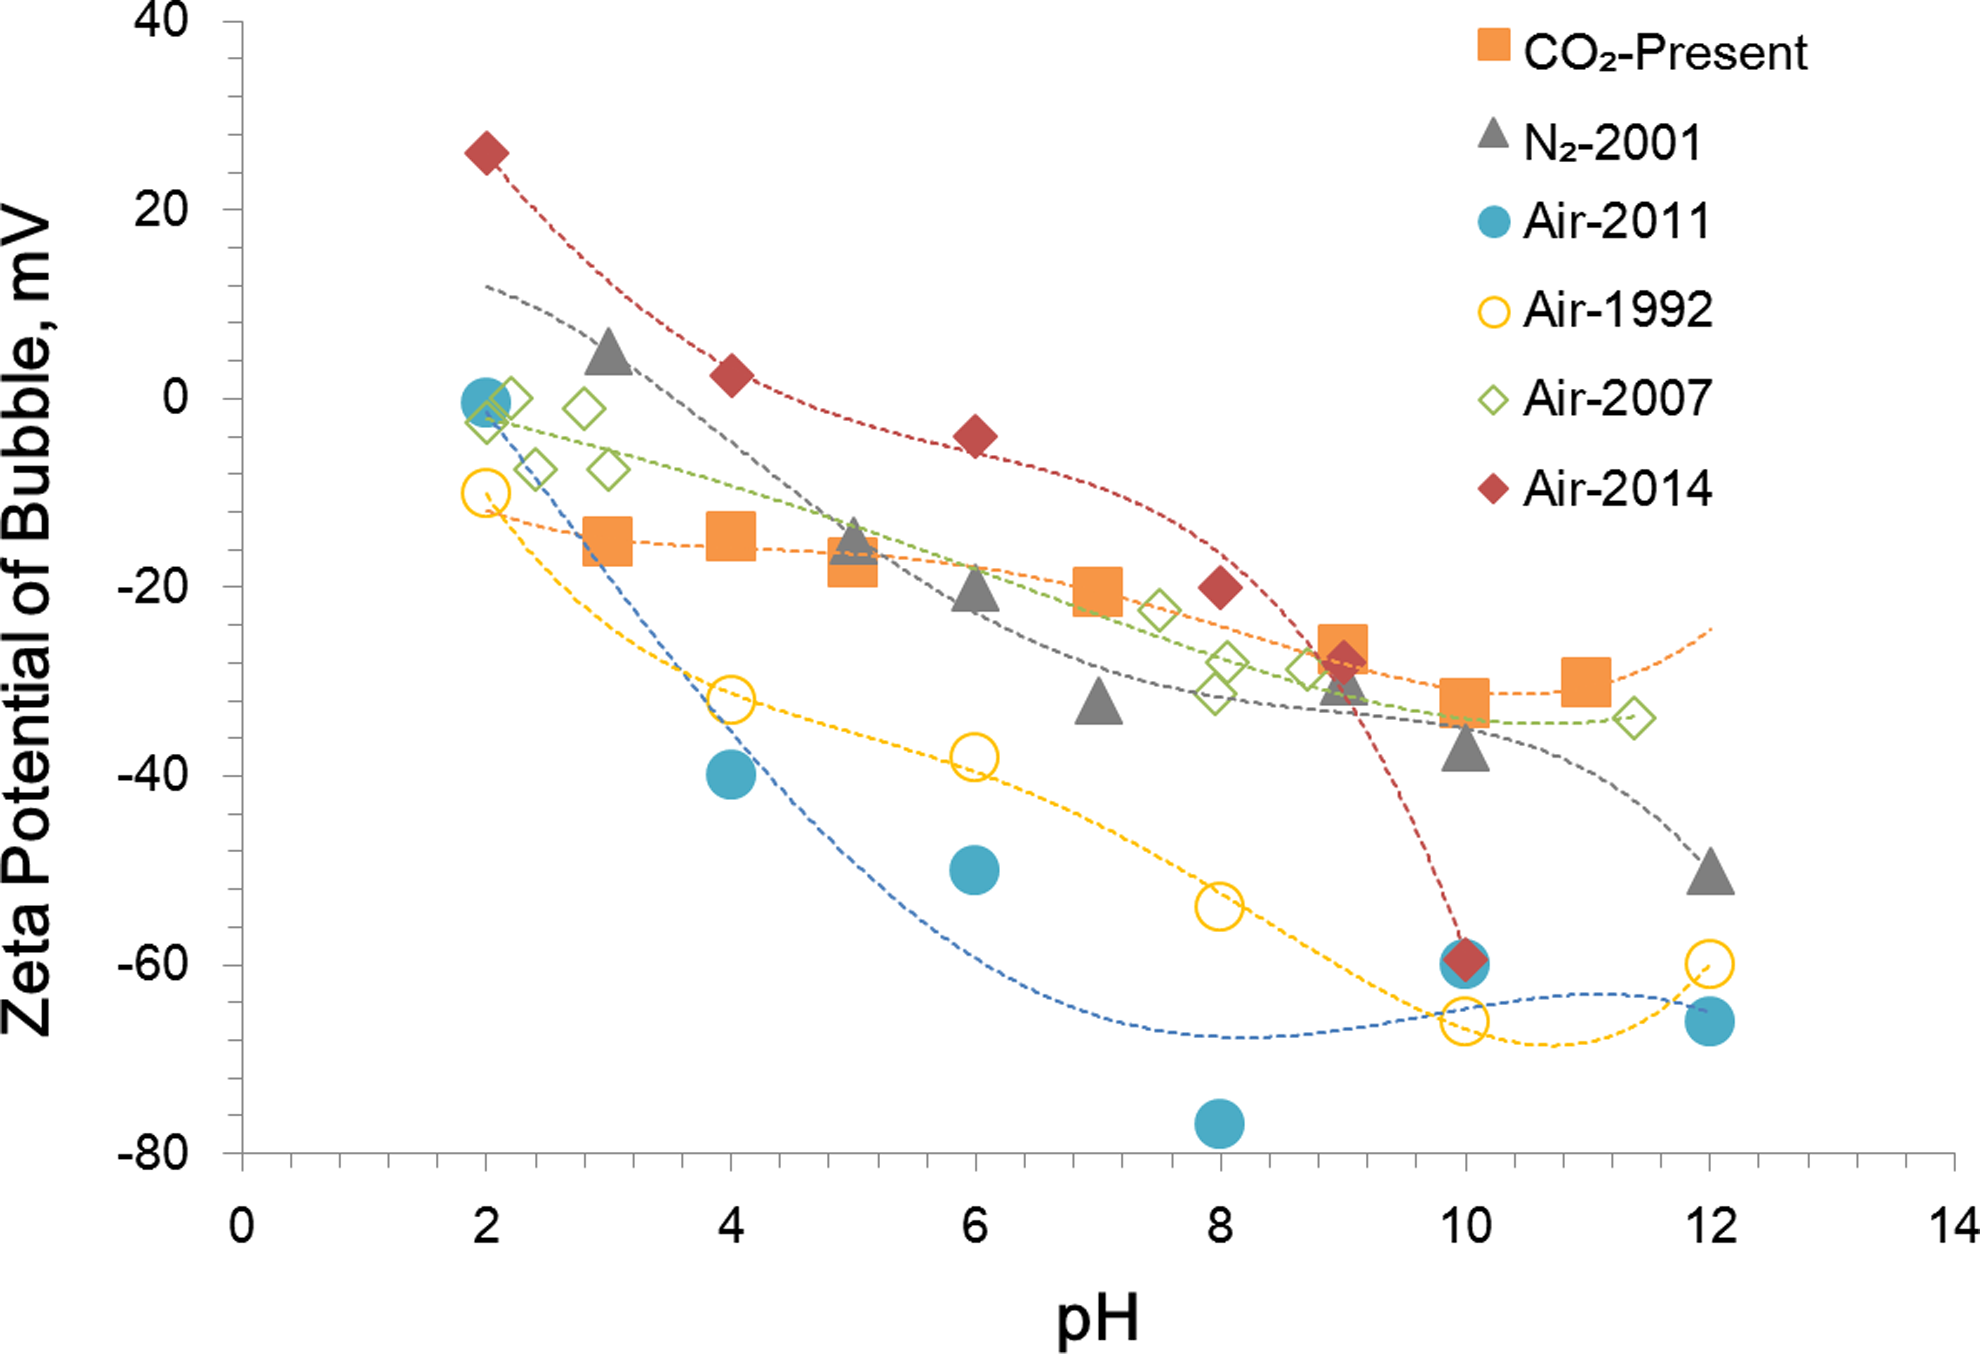
Zeta potential of different types of bubbles as a function of pH. Results from many studies with experimental conditions in Table 1: “CO2-Present” (■) for CO2 bubbles (>80 μm) measured in this study, “Air-2011” (•) for air bubble (30–60 μm) obtained by Oliveira and Rubio (2011), “N2-2001” (▲) for N2 bubble (>80 μm) measured by Yang et al. (2001), “Air-1992” (○) for air microbubbles (<5 μm) obtained by Li and Somasundaran (1992), “Air-2007” (⋄) for air nanobubbles (<0.1 μm) obtained by Najafi et al. (2007), and “Air-2014” (♦) for air nanobubbles (350–620 nm) obtained by Calgaroto et al. (2014).
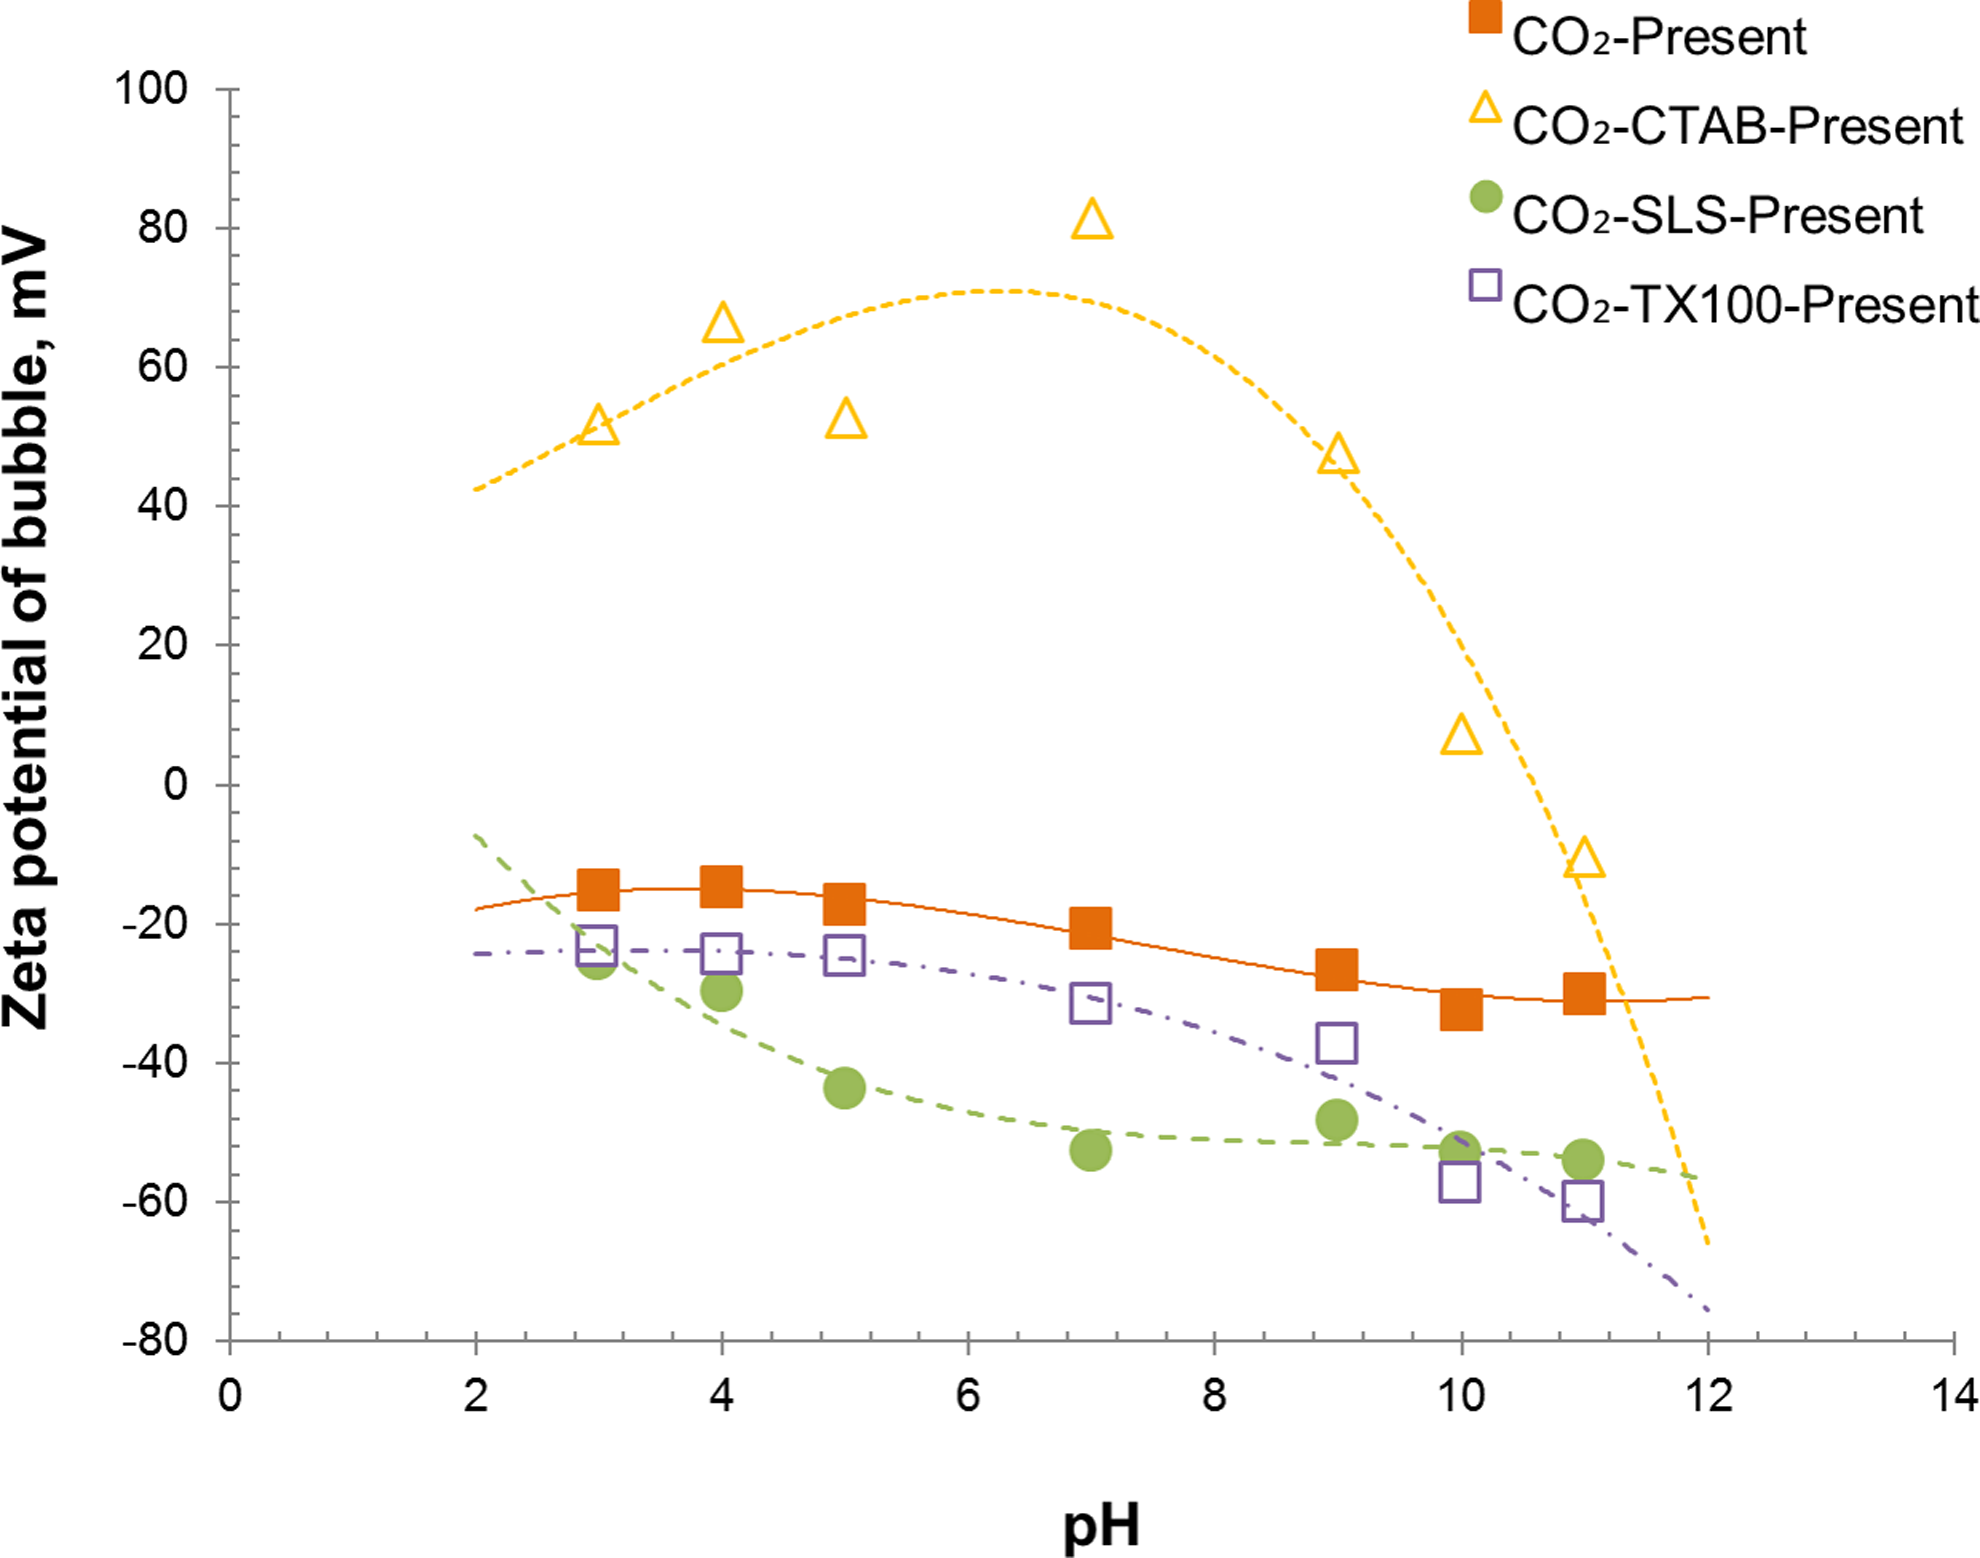
Zeta potential of CO2 in the absence (■) and presence of surfactants—cationic surfactant, CTAB (▵), anionic surfactant, SLS (•), and nonionic surfactant, TX100 (□). CTAB, cetyltrimethyl ammonium bromide; SLS, sodium lauryl sulfate.

Zeta potential of CO2 bubbles and air bubbles in the presence of chemicals. Results from many studies with experimental conditions in Table 2:
Theoretically, CO2 bubbles cannot be easily generated after pH 6.5 (IEP was pH 6) in natural water condition because the solubility of CO2 in water increases very highly with pH due to complex chemical equilibria involving the solvated gas, carbonic acid (H2CO3), dissociated protons, and bicarbonate (HCO3−) ions (Tabor et al., 2011). However, when using the high solubility of CO2 at a reduced power cost for the saturator under pressure in the flotation instead of air, numerous CO2 bubbles (larger than air bubbles) are generated. The dissolved CO2 is decompressed to the atmospheric condition (101.3 kPa) from a saturator (or a CO2-/air-dissolved tank) under pressure of 202.65 kPa.
N2-2001 is zeta potential of N2 bubbles (>80 μm) measured in aqueous solution using microelectrophoresis method by Yang et al. (2001) and ranged from +6 to −51 mV with IEP at pH 3.5.
The Air-2011 label applies to the zeta potential measured using an adapted microelectrophoresis technique by Oliveira and Rubio (2011). Zeta potential values of air bubbles (30–60 μm) range from 0 to −66 mV with IEP at pH 2. Air-1992 is the zeta potential measured by Li and Somasundaran (1992). The zeta potential values of air microbubbles (< 5 μm) are from −10 to −60 mV with IEP at pH 1.5 both in NaCl and AlCl3 solutions. Air-2007 is the zeta potential of air nanobubbles measured due to ZetaPals technique (Brookhaven Instruments) using Uzgiris electrodes coated with palladium by Najafi et al. (2007). The values of air nanobubbles (<0.1 μm) zeta potential are from +2 to −30 mV with IEP at pH 2.2–2.4. Finally, Air-2014 is the zeta potential of air nanobubbles measured using a lager-electrophoresis technique (Nano Zeta Sizer) by Calgaroto et al. (2014). The values of air nanobubble (350–620 nm) zeta potential are from +26 to −59 mV with IEP at pH 4.5.
All experiments were conducted using 10−2M NaCl solution to compare results of this study (CO2-Present) with published data obtained from previous studies (N2-2001, Air-1992, Air-2001, Air-2007, and Air-2014). The trends of the results followed the published data of previous studies at a constant ionic strength of 10−2M NaCl, but the BZP values were influenced by bubble type and bubble size as a function of temperature and pressure and made different results; that is, the higher values of BZP were measured when using pure gas (N2 or CO2) and smaller bubble size of air bubbles (Fig. 2).
According to the previous studies (Yang et al., 2001; Najafi et al., 2007), the negative charge on the bubble surface can be caused by adsorption of anion (OH− ions) and desorption of cation (H+ ions) as the function of pH regarding the origin of charge. Also, the adsorption of the H+ ions increases the BZP value because the concentration of H+ ions increases exponentially at low pH values. Even though the results show a similar tendency for the different types of bubbles, they do not match each other due to the different experimental techniques used as shown in Table 1.
Figure 3 shows the zeta potential values of CO2 bubbles in the absence and presence of cationic-(CTAB), anionic-(SLS), and nonionic-(Polyoxyethylene glycol octylphenol ether (Triton X-100, TX100) surfactants as a function of pH with experimental conditions in Table 2. The zeta potential distribution of CO2 bubbles is 67 to −10 mV in the presence of CTAB, −24 to −53 mV with SLS, and −23 to −60 mV using TX100. The CO2 BZP values with CTAB are positive at pH <11 and higher than CO2 BZP values without the surfactants, while the BZP values with SLS and TX100 are always negative at all pH ranges and lower than those without SLS and TX100 (CO2-Present).
Many researchers have examined a significant interaction mechanism between air bubbles and chemicals (surfactants and polymers) causing flocculation in DAF for the wastewater treatment. The zeta potential values of bubbles treated with chemicals (surfactants and polymers) and of collected from many studies as shown in Table 2 and Fig. 4, show similar distribution as a function of pH (2–12) with effects of surfactant molecules type and concentration on the surface charge of bubble and impacts of medium pH on the adsorption mechanisms. Figure 4 shows the zeta potential values of chemical-coated bubbles (air and CO2): (a) anionic chemicals, (b) nonionic chemicals, and (c) cationic chemicals.
Figure 4a represents the comparison of the zeta potential of treated CO2 bubbles with the anionic surfactant (anionic SLS, 6.9 × 10⁻⁵ M) measured in this study and air bubbles obtained from many authors using the anionic surfactants (sodium dodecyl sulfate, SDS, 1.0 × 10⁻⁴ M measured in 2014, 4.0 × 10⁻⁴ M in 2013, and 1.0 × 10⁻³ M in 2007 and 1986) and the anionic polyacrylamide (A100 in 2011). The results show a clear effect of the anionic chemicals (surfactants and polymers) charge making bubbles more negative than those without the anionic chemicals because the anionic chemicals neutralize the positive charge in the acidic medium and cause the negative charge of bubbles in reverse.
Calgaroto et al. (2014) have explained interaction among the surfactants, bubbles, and medium, including electrostatic forces to adsorb the surfactants with the polar head toward the bubble and hydrophobic forces for the molecules rearranged inversely, similar to micelle formation causing a change in the zeta potential of the bubbles according to their polar group charge. Hence, bubbles in the presence of the anionic chemicals are charged negatively as a function of pH as being covered by the macromolecules in the same manner as in adsorption at the air/water interface. Unlike showing the rapid change of BZP value by other chemical types and concentrations, SLS (6.9 × 10⁻⁵ M in this study) for microbubbles of CO2 and SDS (4.0 × 10⁻⁴ M in Jia et al., 2013) for nanosize air bubbles generated by the same method of Najafi et al. (2007) gently change the BZP value as a function of pH.
Zeta potential of air and CO2 bubbles in the absence and presence of nonionic chemicals (nonionic polyacrylamide, SNF920SH, for air bubbles and nonionic polyoxyethylene glycol octylphenol ethers (Triton X–100, TX100) for CO2 bubbles, respectively) as a function of pH is presented in Fig. 4b. The results of air bubbles in the presence of SNF920SH, (Air- SNF920SH,-2011) show the distribution of the zeta potential values from −12 mV at pH 2.0 to −93 mV at pH 12.0, which are close to those seen in Air-2011. Air-SNF920SH-2011 shows a tendency similar to that of Air-2011, but the difference between Air- SNF920SH-2011 and Air-2011 decreases with increasing pH.
Changes in zeta potential of CO2 bubbles in the presence of TX100 (CO2-TX100-Present) show the similarity with that of air bubbles: the distribution of the zeta potential values from −23 mV at pH 3.0 to −60 mV at pH 11.0, which are close to those seen in CO2-Present. The adsorption of nonionic chemicals charges the bubbles negatively because an excess of anionic groups is presented on the backbone of macromolecule chains and the effect of nonionic chemicals on the zeta potential of bubbles (air and CO2), Air-SNF920SH-2011 and CO2-TX100-Present, when comparing with Air-2011 and CO2-Present is not significant as shown in Fig. 4b.
In contrast to the previously studied anionic and nonionic chemicals, as shown in Fig. 4c, the cationic chemicals cause a reversal of bubble charge, from negative to positive with a maximum value of +70 and +50 mV at pH 2.0 (shifted IEP to pH 10.75) for 10−3 M DAH (−2007 and −1986), +25 mV at pH 2.0 (shifted IEP to pH 8.0) for 10−4M Flotigam EDA3B(2014), +20 mV at pH 3.5(shifted IEP to pH 9) for 4 × 10⁻⁴ M DTAC (2013), and +44 mV, at pH 4.0 (shifted IEP to pH 8.0) for cationic polyacrylamide, C448 (2011) for air bubbles, and +67 mV at pH 4.0 (shifted IEP to pH 10.75) for 5.5 × 10⁻⁵ M CTAB for CO2 bubbles in this study. As a result of adding cationic chemicals, the bubble surfaces are charged positively, and then the positive charges are adsorbed onto the negative charges until they are highly neutralized beyond the IEP.
The results show that DAH and CTAB are the effective surfactants for the positive charge of bubbles and CTAB is the most effective one because it needs the lowest concentration as shown in Table 2 and Fig. 4c. However, the CTAB dose used in this study is too much to be an economical alternative even if it is lower than 30 mg/L, an optimal alum dose based on results from both the pilot- and bench-scale units (Elder, 2011). Elder (2011) emphasizes no advantage to adding polymer in DAF for algal harvesting. Unlike alum, in general, only low amounts of surfactants are required because a monolayer is sufficient to alter the surface potential.
Zeta potential of algae
Figure 5 shows the distribution of microalgae (Anabaena spp.) zeta potential at varying pH values and cultivation time, days 3 and 11, after the cultivation at the initial stage for 7 days. The zeta potential values of Anabaena spp. for days 3 and 11 are compared with those measured by Taki et al. (2004). The zeta potential values of Anabaena spp. from Taki et al. (2004) range from −20 to −30.3 mV, while those measured in this study range from −15.5 to −29 mV for day 3 (Present-Day 3), from −17 to −32.5 mV for day 11 (Present-Day 11), and from −16 to −31 mV on an average. All three cases change similarly due to pH changes. The lowest value for each case is measured at approximately −30 mV at pH 9 and the zeta potential tended to increase at pH >9 and pH <9.
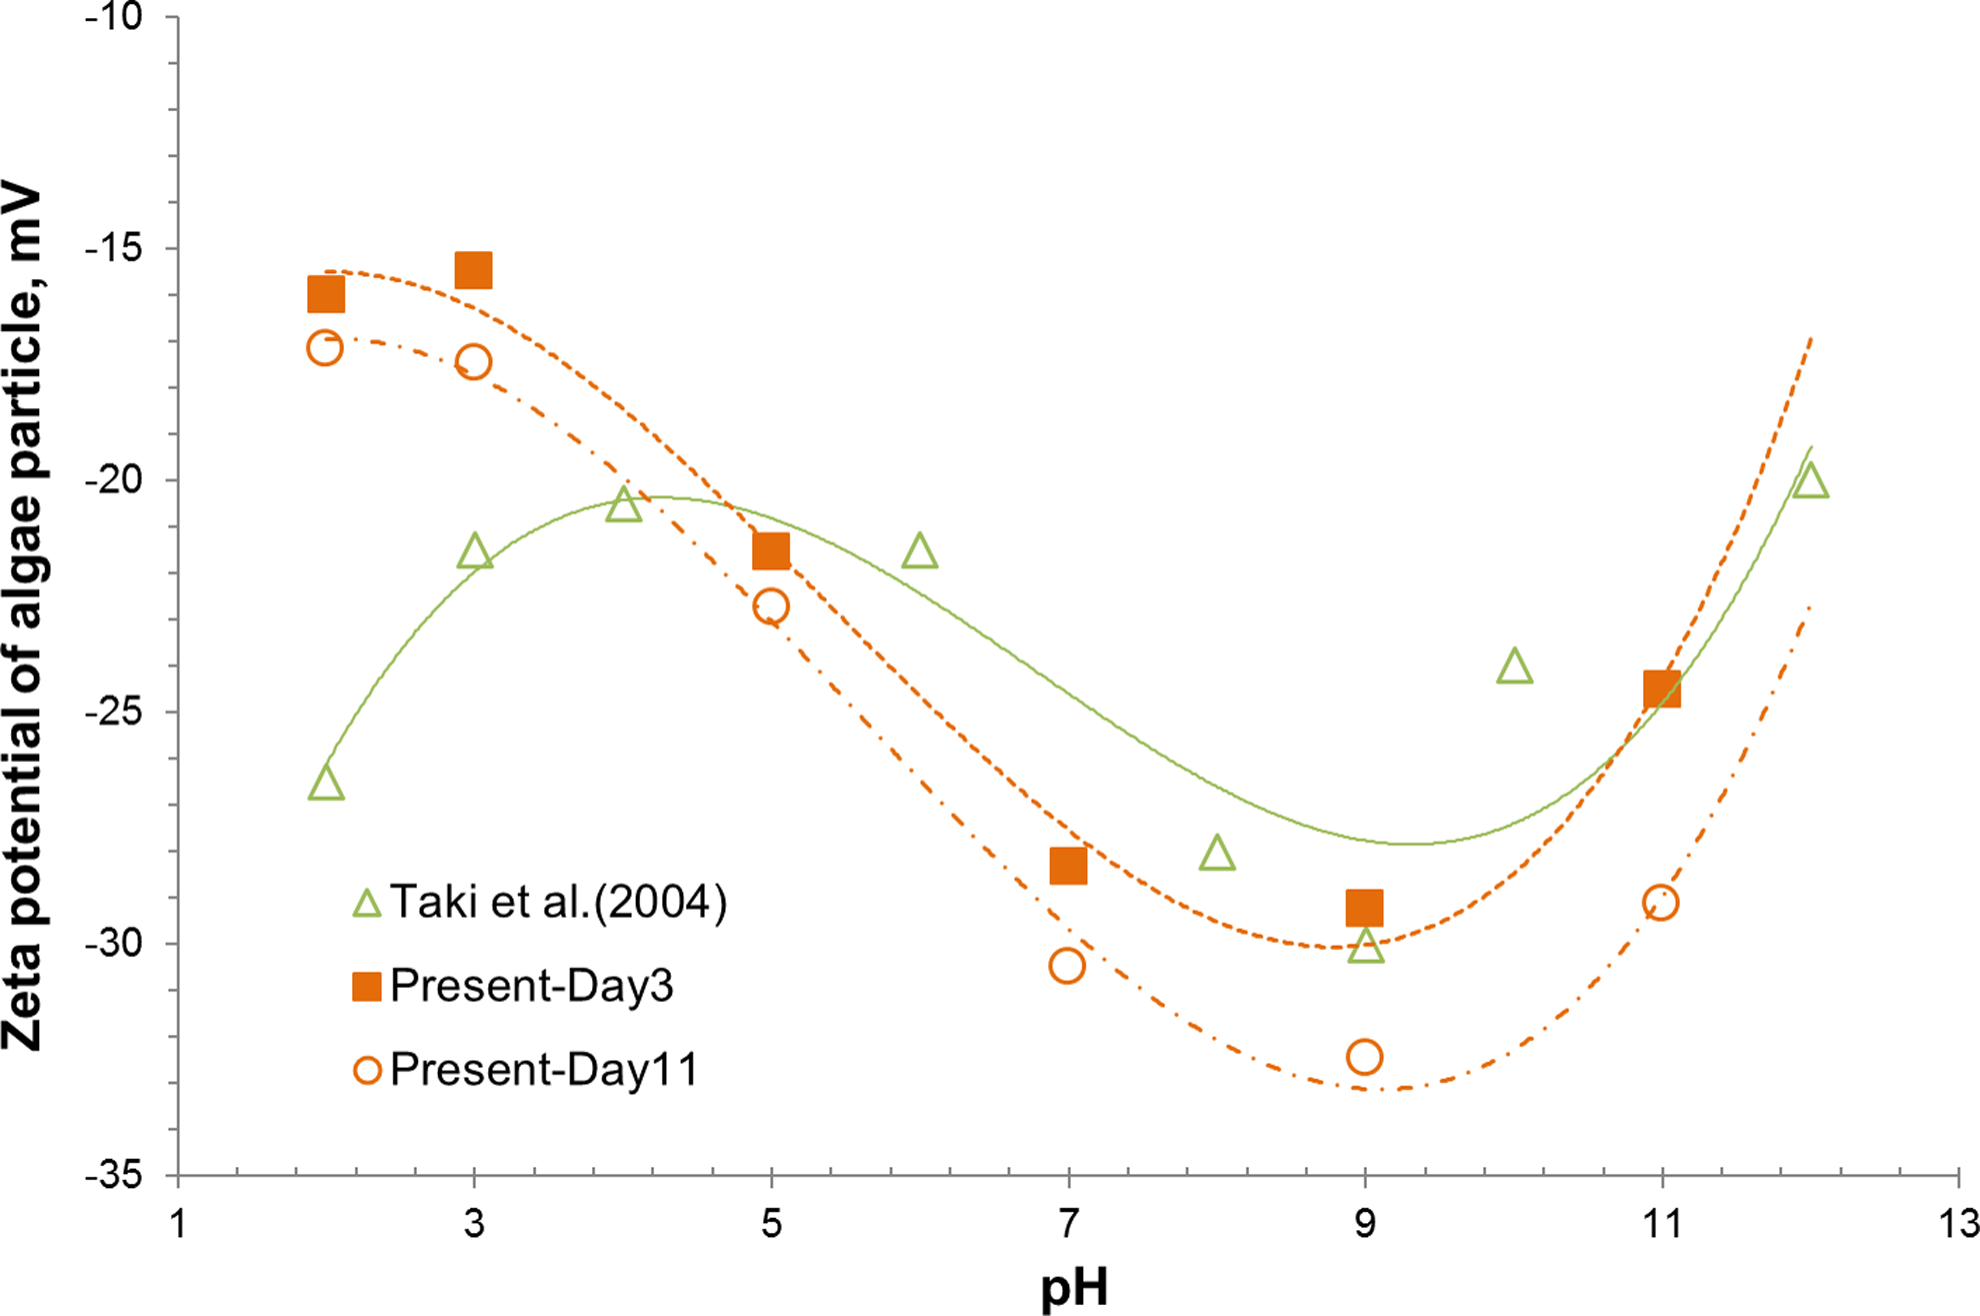
Zeta potential of microalgae (Anabaena spp.) as a function of pH and cultivation time: Taki et al. (2004) (▵), Present-Day 3 (■) and Present-Day 11(○) from this study.
Model simulation
Based on results of zeta potential measurement of bubbles, model simulations are designed with selected input parameters, including −30 mV of algal zeta potential (AZP), three algal floc sizes (50, 75 and 200 μm), two bubble sizes (30 and 100 μm), and various BZP values under the conditions described in Table 3 at pH ≥9.
Figures 6a, b and 7a, b provide the results of the model simulation of collision-attachment coefficient (α) and removal efficiency (X). The information in Table 3 was drawn from peer-reviewed literature and the experimental results of this study. Figure 6 shows α and X as a function of AZP, BZP, four ratios of bubble size (Db), and algal floc size (Dp) [50:30, 100:50, 100:75, 100:200] at pH ≥9. The collision-attachment coefficient (α) and removal efficiency (X), both increase in the positive BZP region. When Dp is greater than Db (100:200), X reaches ∼100% with α ranging 0.2–0.25 in the BZP region, −5.0–2.5 mV. The study finds that α is affected by the smaller bubble, while the higher X is dependent on the larger bubble.
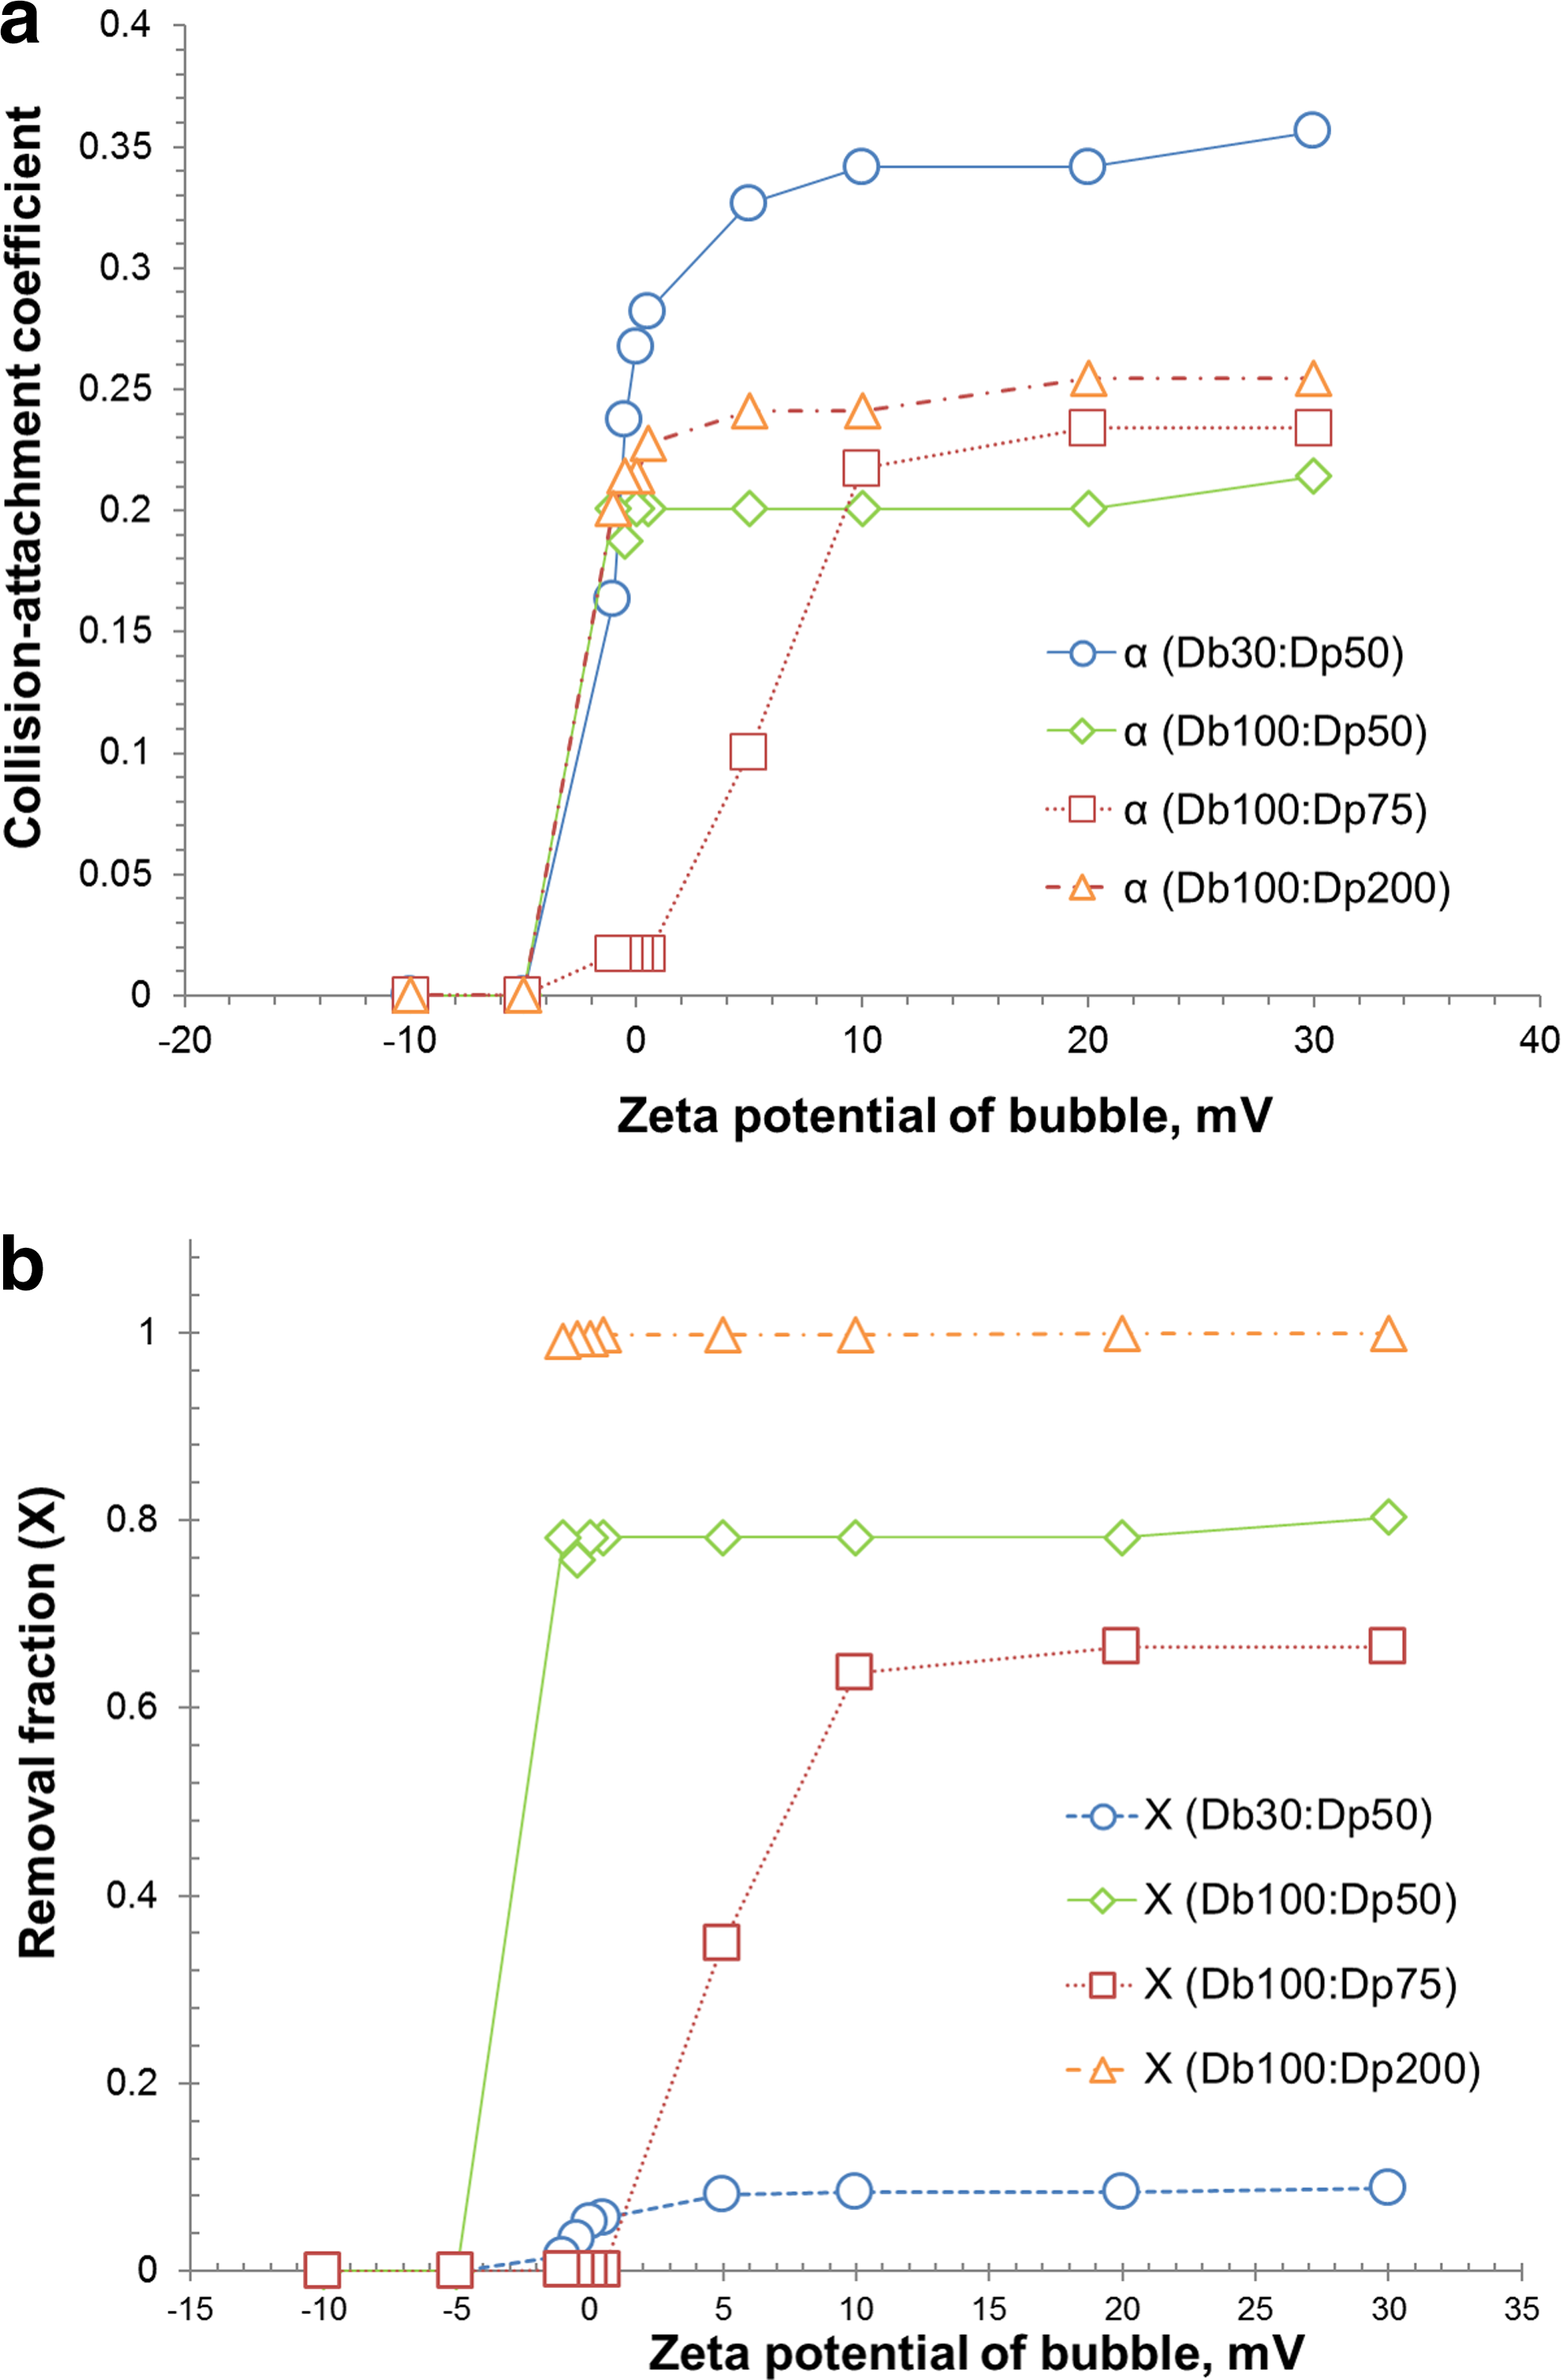
Effects of bubble zeta potential on
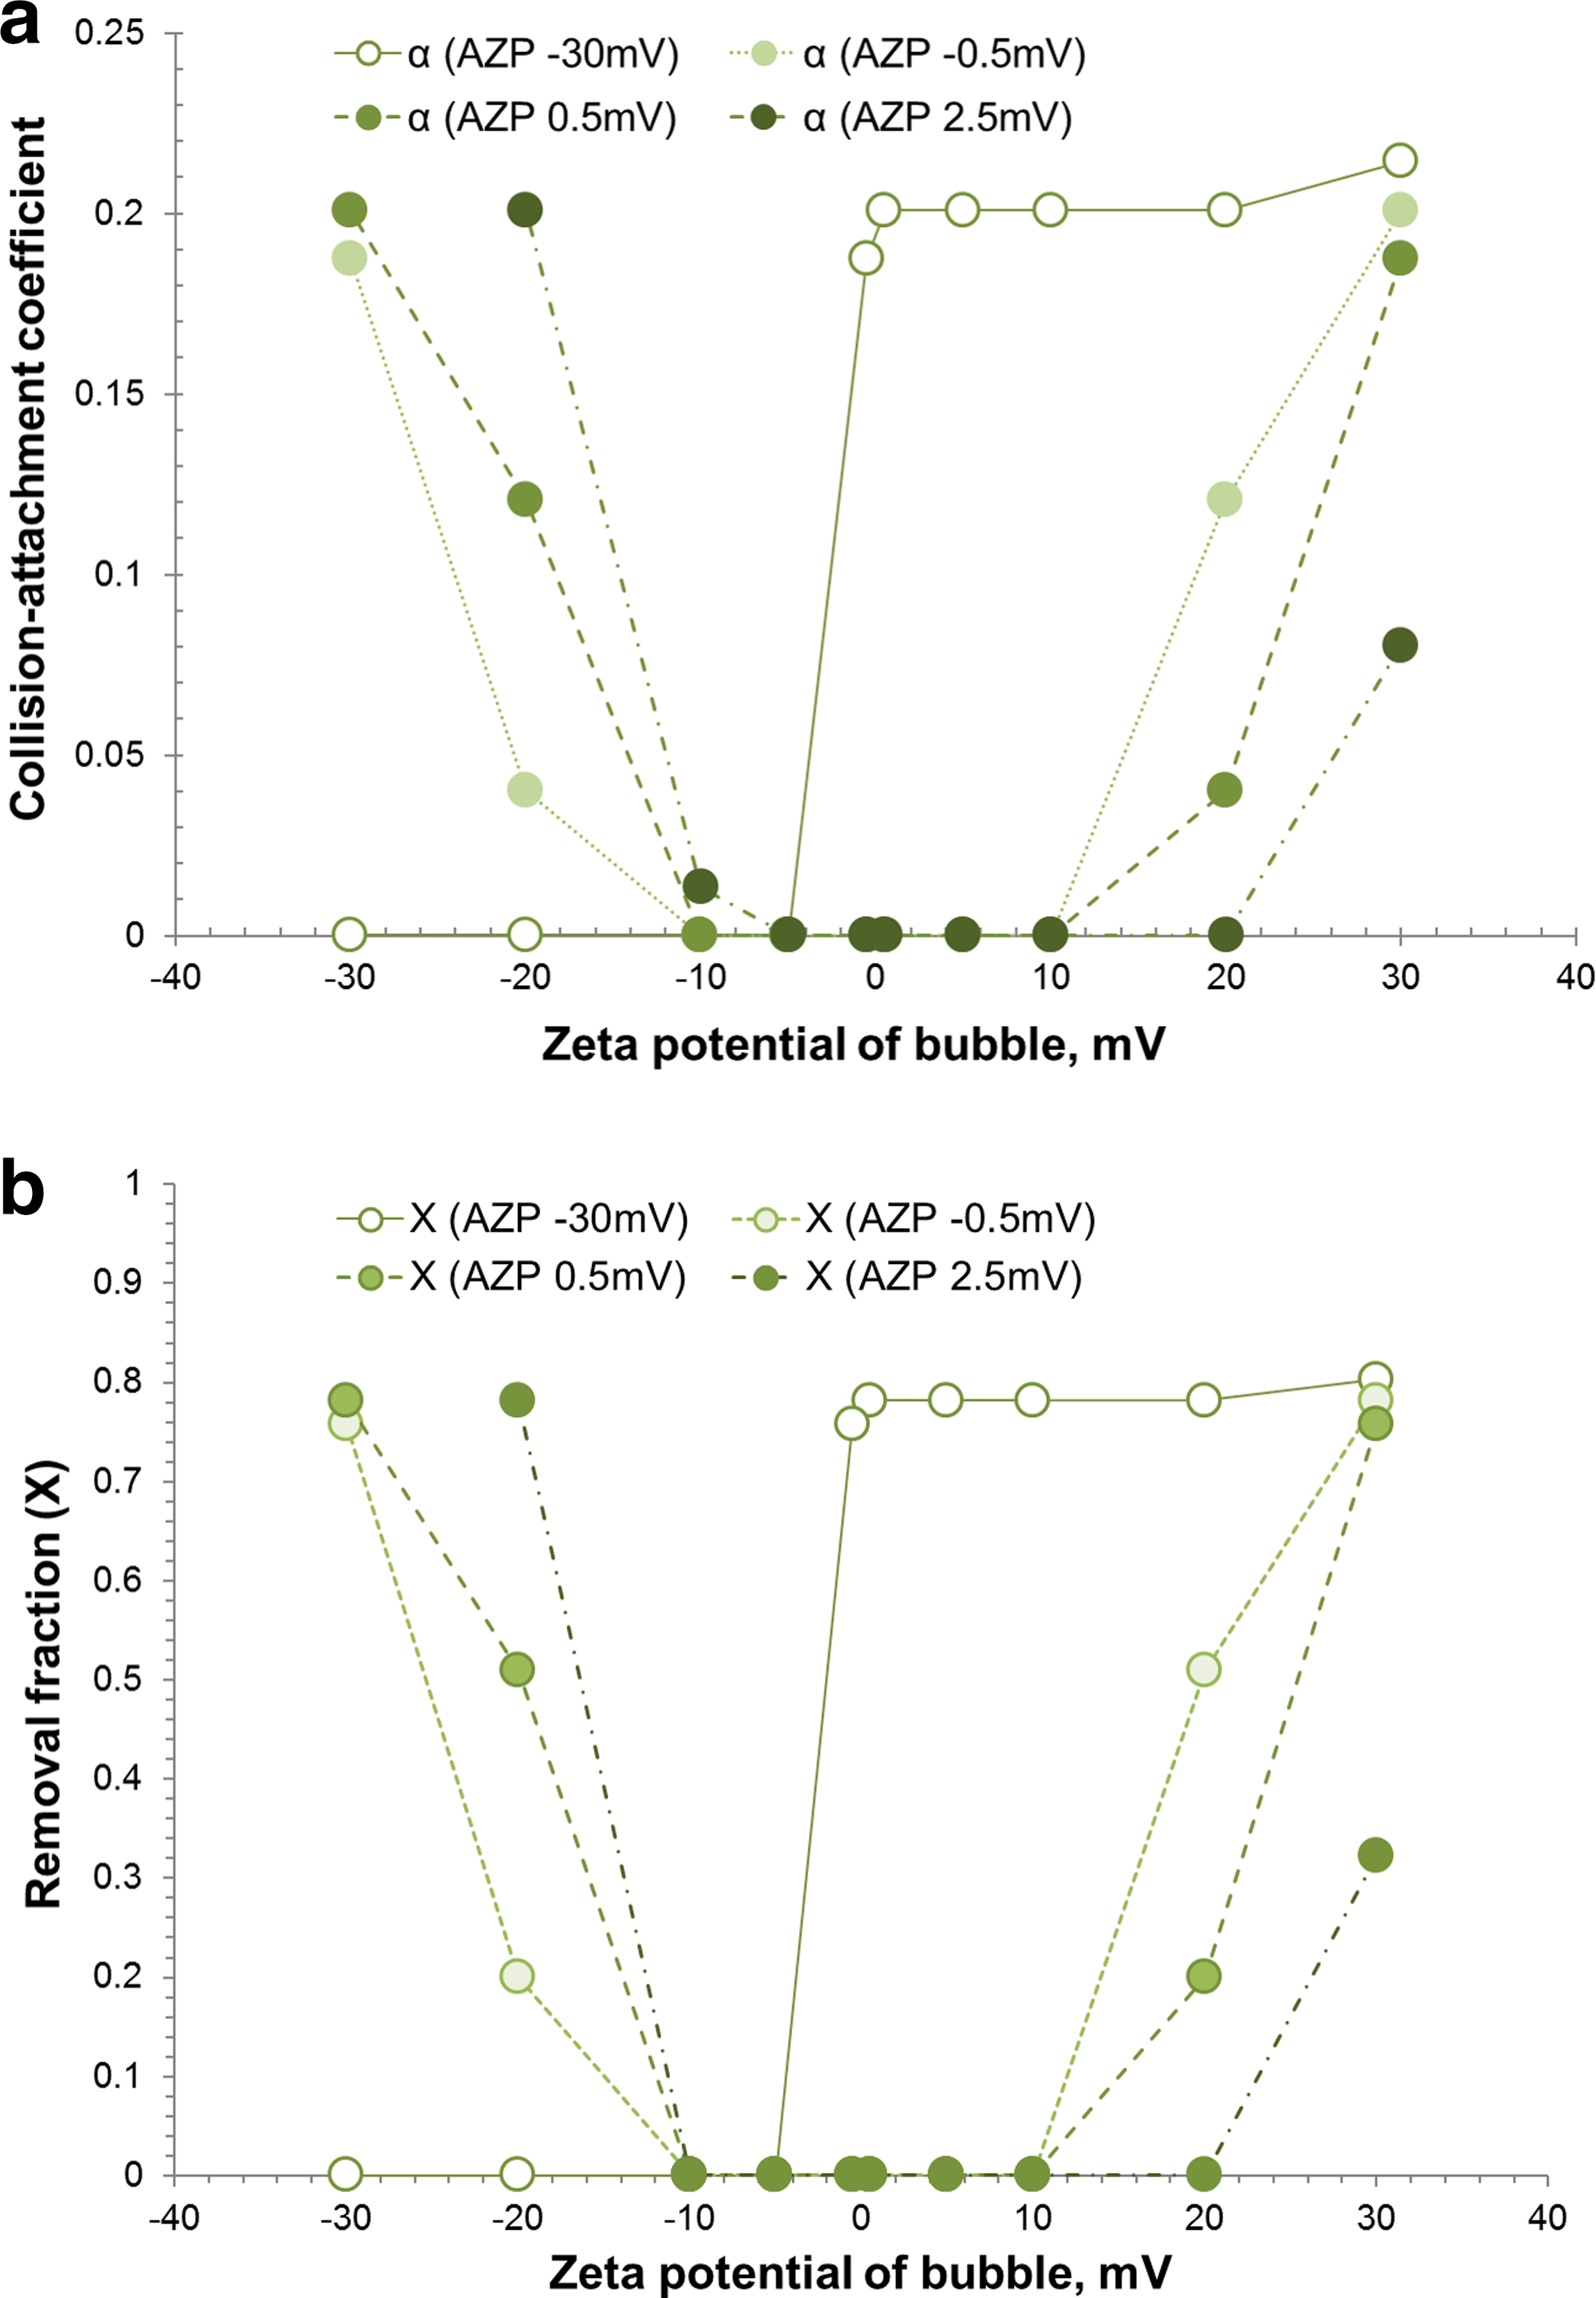
Effects of algae zeta potential [○ AZP −30 mV, • AZP −0.5 mV, • AZP 0.5 mV, and • AZP 2.5 mV] on
Patterns of α and X change similarly because the size of bubbles and algal particles are held constant for the purposes of the simulation. Given the bubble size 100 μm and the algal particle size 50 μm, α and X are affected by AZP in the various BZP region, as shown in Fig. 7. When the AZP is −30 mV, α and X both have high values in the positive BZP region, greater than −5.0 mV. If the magnitude of AZP is small, both α and X are activated at the BZP greater than
Conclusions
Microalgae, including blue-green algae, are considered a contaminant, producing metabolites of musty substances and toxins, as well as causing algal blooms in stagnant water bodies such as lakes and reservoirs. Recently, microalgae have been considered for their use as a biomass resource in biofuel production, livestock feed, and fertilizer. A solution of algal separation (removal or harvesting) from liquid remains to be found economically. Various researchers suggest flotation as an optimal technique. This study focuses on measuring and comparing zeta potential of bubbles and algae (Anabaena spp.) as a function of pH. The study also simulates the flotation model, PBT model linked with the SCC model, to estimate the sensitivity of collision-attachment coefficient and removal efficiency as a function of zeta potential of bubbles and algae, and their sizes.
Findings of this study are as follows: (1) in the absence of chemicals, the zeta potential of air and CO2 bubbles showed a tendency to become more negative, the zeta potential of CO2 bubble ranged from −14.69 to −32.38 mV; (2) the zeta potential of bubbles (air and CO2) was obviously influenced by the chemicals, positive values at pH <10 in the presence of cationic surfactants and negative values in the presence of anionic and nonionic surfactants; (3) the effective cationic surfactants for the positive charge of bubbles are DAH and CTAB. When considering an economical alternative, a low amount of CTAB is useful because a monolayer is sufficient to alter the surface potential, but still chemical consumption takes considerable cost in applying flotation process for algae harvesting.
(4) The zeta potential of Anabaena spp. was measured from −16 to −31 mV in this study and −20 to −30.3 mV in Taki et al. (2004) with similarity as a function of pH; (5) the model simulation in this study finds that α and X increase in the positive BZP region for the negative AZP (−30 mV); the α is affected by the smaller bubble, while the higher X is dependent on the larger bubble; and finally, (6) the optimum removal of algae was achieved with CO2 bubble of zeta potential between −0.5 and +2.5 mV at pH ≥9 in this modeling study with an assumption of algal autoflocculation. These modeling optimal values can be compared with the optimal removal values suggested by Henderson et al. (2008) for the experimental study with chemical flocculation, as mentioned earlier in the Introduction section.
In conclusion, the collision-attachment coefficient and removal efficiency are affected by the different charge of zeta potential values between bubbles and algae. The collision attachment is more significantly affected by the smaller bubbles and the removal efficiency is controlled by the larger bubbles in this study. Further study will focus on developing the flotation model, considering the soft surfaces of algae, including autoflocculation.
Footnotes
Acknowledgments
This research (NRF-2015R1D1A3A03020597) was supported by the National Research Foundation of Korea (NRF) with grants from the Ministry of Education in Korea, 2015.
Author Disclosure Statement
No competing financial interests exist.