
Abstract
Abstract
Production of algae as renewable resources has been pursued actively. Attention has so far been focused on phototrophic algae. Explored here is a completely different approach that harnesses the growth ability of phagotrophic algae on microorganisms such as bacteria, which are abundantly present in waste, including activated sludge generated in wastewater treatment plants. Escherichia coli, a common bacterium, was used as an example of bacterial feed for the oleaginous phagotrophic alga Ochromonas danica. Growth characteristics and lipid contents of O. danica were determined under various conditions. Algal doubling time could be as short as 7 h, but increased to >20 h at low starting E. coli-to-O. danica ratios. The alga was also sensitive to step changes of pH and darkness. Without these factors, phagotrophic growth was similar in a wide range of conditions, even under total darkness and in deionized water with washed E. coli as the only food source. O. danica grew on E. coli with an average yield of about 25% (w/w) and a lipid content of 27% ± 8%. As a food source for phagotrophic algal growth, bacterial cells provided excess nitrogen, which was released as ammonia. Glucose supplementation was studied to avoid ammonia release and produce more algae with higher lipid content (33–34%). Results supported feasibility of this new approach and identified suitable process conditions for further development and application in real wastewater systems. Besides algal production, the approach can remove harmful bacteria from wastewater.
Introduction
W
Ochromonas danica is a single-celled, motile golden-brown alga (Brown and Elovson, 1974) with heterotrophic, photoheterotrophic, photoautotrophic, and phagotrophic capabilities (Aaronson and Baker, 1959). The alga can survive and grow on various energy and nutrient sources such as dissolved and suspended (particulate) organic materials, light, and even smaller microorganisms (Aaronson, 1973). The effects of growth medium, light, and presence of live bacterial prey, Pasteurella sp., on the growth of another Ochromonas strain (BG-1) have also been studied (Sanders et al., 2001). More recently, the C-N-P stoichiometric ratios of O. danica cells growing in chemostats with a complex medium (containing glucose, yeast extract, tryptone, and liver extract infusion) have been measured at different dilution rates and temperatures (Simonds et al., 2010). There have been relatively few reports on lipid production by O. danica (Gellerman and Schlenk, 1965; Miyachi and Benson, 1966; Gershengorn et al., 1968; Elovson and Vagelos, 1969). The more recent ones have been for fatty acid characterization, particularly the more unique sulfolipids, chlorosulfolipids, and sterols (Kato et al., 2003; Darsow et al., 2007; Kawahara et al., 2009).
Explored in this work was the possibility of producing algal biomass and lipid by using O. danica's ability to prey on small microorganisms and accumulate intracellular lipids. O. danica has two flagella with unequal lengths. It has been proposed that the longer flagellum moves the surrounding water in a way that helps transport food particles to the sites of phagocytosis (Aaronson, 1974). Bacteria are ubiquitous in the environments and are produced in large quantities, for example, in processes treating waste and wastewater. Fed with bacteria produced from these processes, O. danica with its phagotrophic ability and versatile metabolism may have the competitive edge to grow as the dominant population in open culture systems. The process and application aspects of growing O. danica on bacteria have not been investigated. In addition, there have been no studies on the alga's lipid yield or productivity or any efforts associated with industrial production of lipids using O. danica.
The objective of this study was to examine the growth and lipid production of O. danica on small microorganisms, with and without sugar supplementation, and under different pH. The pH effect was studied because wastewater from different sources can have widely varying pH. Understanding and quantifying these characteristics were essential to evaluation of the feasibility and further development of phagotrophic algae-based processes. In this study, Escherichia coli was used as an example of small microorganisms. Pregrown E. coli cells were fed to O. danica. Besides being a common bacterium found in wastewater treatment systems (Paruch, 2011), E. coli cells have the desirable characteristics for the intended processes, that is, they are small and fast growing. In total, 19 experimental systems were investigated in this work. The factors varied in these systems included the growth media (with and without minerals and/or glucose), pH, light (versus dark) condition, feed E. coli concentration, and O. danica type (axenic or not) and concentration. Results obtained are reported and discussed.
Experimental Protocols
Cultures, media, and preparation of experimental systems
Two O. danica cultures were tested in this study. One culture was obtained from American Type Culture Collection (ATCC No. 30004), the other from the UTEX Culture Collection of Algae (University of Texas at Austin, No. 1298). The ATCC culture was axenic; the UTEX culture was not. The cultures were maintained in different media according to the providers' instructions. The medium used for inoculum preparation had the following composition (same for both ATCC and UTEX cultures), modified from Aaronson and Baker (1959): 5 g/L glucose, 0.45 g/L yeast extract, 0.45 g/L peptone, 0.5 g/L NH4Cl, 0.4 g/L MgCO3, 0.3 g/L KH2PO4, 0.2 g/L nitrilotriacetic acid, 0.1 g/L MgSO4·7H2O, 0.05 g/L CaCO3, 4.4 mg/L Na2EDTA (disodium salt of ethylenediaminetetraacetic acid), 3.15 mg/L FeCl3·6H2O, 0.97 mg/L H3BO3, 0.25 mg/L thiamine, 0.18 mg/L MnCl2·4H2O, 0.02 mg/L ZnSO4·7H2O, 0.01 mg/L CoCl2·6H2O, 6 μg/L Na2MoO4·2H2O, and 2.5 μg/L biotin. The medium was adjusted to pH 5 before autoclaving. Ten milliliters of seed culture was added to 90 mL medium in a 250-mL Erlenmeyer flask. The culture was grown at room temperature and constant ambient light for 3 days under about 150 rpm magnetic stirring and then used for inoculum preparation.
For preparation of E. coli cells (ATCC No. 11303) as feed to the alga, 100 mL E. coli seed culture was added to a 2-L flask containing 1 L LB (Luria-Bertani) medium (10 g/L peptone, 5 g/L yeast extract, and 10 g/L NaCl; pH 7). The culture was grown for 24 h in a shaker (New Brunswick Scientific Innova 4080) operating at 250 rpm and 37°C. The harvested culture had a cell dry weight concentration of 2–3 g/L.
For studying growth and lipid production of O. danica with E. coli cells as the main food source, the systems were prepared as follows: a pregrown O. danica culture (40 mL) was centrifuged at 8,000 rpm (Sorvall RC 5C Plus, 9,240 g) for 15 min. The supernatant was discarded and the cells were washed once with a sterile mineral solution (MS), pH = ∼5.4, containing 0.13 g/L KH2PO4, 0.3 g/L MgSO4.7H2O, 0.18 g/L CaCl2.2H2O, 0.01 g/L MgCl2.4H2O, and 5 g/L NaCl. Washed O. danica cells were resuspended in 40 mL sterile MS.
Different concentrations of E. coli were fed to the alga in different systems examined in this study. For preparation of the E. coli feed, different volumes (300–1,000 mL) of pregrown E. coli cultures were centrifuged for 15 min at 8,000 rpm (8,960 g; Beckman Coulter Avanti J-26 XPI, rotor JLA 8.1). The cells were washed once with sterile MS and then resuspended in 360 mL sterile MS.
The purpose of washing the O. danica and E. coli cultures was to avoid introducing organic substrates and nitrogen (N) sources present in the pregrown broths into the study systems. Note that the MS had no organic or N substrates. E. coli cells were therefore the sole source of C and N to support algal growth and lipid production observed in the study systems (unless designed and specified otherwise later).
Experimental design and setup
Washed E. coli and O. danica cells, typically in 360 and 40 mL sterile MS, respectively, were mixed in a 500-mL flask and then cultured at room temperature under 150 rpm magnetic stirring and 0.5 L/min bubbling with filter-sterilized (0.22 μm) air. Under this condition, the dissolved oxygen (DO) concentration in mixed cultures was maintained at above 4 mg/L. The factors varied in experiments are summarized in Table 1. These included the growth medium—deionized water or MSs with or without glucose supplementation; pH—uncontrolled or controlled at 4, 4.5, 5.5, or 7; light (versus dark) conditions; feed E. coli dry weight concentration—in the range of 0.3–8 g/L; initial algal number concentration—in the range of 0.25–10 × 106 cells/mL; and the type of O. danica culture—the axenic culture from ATCC or the nonaxenic culture from the UTEX culture collection.
Except for Experiment No. 1, all experiments were made in the same mineral salt medium (MS) containing different concentrations of centrifugation-collected and washed E. coli cells. For lipid extraction, Method 2 refers to the extraction done on washed cells, while Method 1 to the extraction of entire culture sample after drying.
ATCC, American Type Culture Collection; MS, mineral solution.
Deionized water was included as a growth medium in the study for two main purposes: (1) to evaluate whether the E. coli cell mass alone can provide all the necessary nutrients for growth of O. danica cells and (2) to investigate if O. danica growth on E. coli cells is affected by the osmotic stress associated with the use of deionized water. The pH range was chosen according to the preliminary observation that O. danica would stop growing or even lyse at lower (≤3) or higher (≥7.5) pH. The feed E. coli concentration was studied in a wide range; the higher end was limited by the broth volume that could be centrifuged in a reasonable period to collect E. coli cells from pregrown cultures. The initial O. danica concentration was also varied in a wide range; the upper limit was set at a level that would not cause potentially unclear determination of the algal growth amount supported by the fed E. coli cells (i.e., as a small difference between two large numbers).
For the pH-controlled systems, the culture flasks were equipped with pH probes for continuous measurement and automatic addition of 0.2 N NaOH or HCl. Most systems were cultured under constant light by the fluorescent ceiling light that was always left on in the laboratory and an additional benchtop 18-W white fluorescent light tube. To check if light had significant effects, some systems were wrapped with aluminum foil to create the completely dark growth condition.
Lipid extraction
In earlier experiments, the algal lipids were extracted after the cells in a 10-mL sample were collected and washed once with 10 mL deionized water by centrifugation (9,240 g, 15 min) (referred to as Method 2 in Table 1). Repeated centrifugation, however, introduced the risk of breaking some algal cells and, thus, losing lipids to the supernatant. To avoid this risk, in the latter experiments, the whole culture sample was dried and then lipids were extracted (Method 1 in Table 1). The procedure for Method 1 is described in the following.
A 10-mL culture sample in a glass vial was dried overnight at 70°C under filtered air. The vial with dried biomass was added with 10 mL 2:1 chloroform–methanol (Bligh and Dyer, 1959), sealed, and then mixed for 24 h on a rotary mixer (Glass-Col Rotary Mixer, Terre Haute, IN). The vial was added with 5 mL deionized water and 100 μL HCl (5 M) and vortexed for 5 min (Vortex-Genie 2, Model G560). The mixture was centrifuged at 9,240 g (8,000 rpm) for 15 min. Two liquid phases formed, an upper aqueous phase and a lower organic phase, with the cell debris accumulated in a thin layer above the organic phase. The organic phase was carefully pipetted to a preweighed glass vial, moving as much volume as possible without collecting any cell debris. The remainder (aqueous phase, cell debris, and a small amount of organic phase) was further extracted with 5 mL chloroform by vortexing for 5 min. The organic phase was again collected into the same preweighed glass vial, which was then dried to a constant weight with filtered air at room temperature. The algal lipid concentration in the sample was calculated from the measured dry lipid weight.
Method 2 differed from Method 1 only in two steps. (1) The cells were collected and washed by centrifugation and then only the washed cells were solvent extracted. (2) There was no addition of 5 mL deionized water and 100 μL HCl (5 M) to the extracted organic phase. This addition of aqueous phase in Method 1 removed cell debris from the organic phase (into the aqueous phase). Without this step, extreme care was needed in Method 2 to avoid getting any cell debris into the organic phase collected for drying and weighing.
Analytical methods
Cell concentration
The culture samples in this study had both algal and bacterial cells. Different methods were used to separately track the changes of these two populations in the experiments. To determine the number concentration of O. danica, the sample was added with an equal volume of 2% glutaraldehyde to stop cell movement. Algal cells were then counted under a microscope using a Petroff-Hausser counting chamber (Catalog No. 3900, cell depth: 0.02 mm, ruling pattern: improved Neubauer, 1/400 mm2). The average percentage error of the counted number concentration was 11.4% ± 6.1%. The change of O. danica number concentration with time was plotted semilogarithmically to determine, at the exponential growth phase, the specific algal growth rate (μmax, h−1) by phagotrophy. The doubling time was calculated from μmax [τd = ln(2)/μmax] and compared for different growth conditions.
The number concentration of live E. coli cells was measured by plate counting after serial dilution. The sample was diluted 104, 105, 106, 107, and 108 times and 200 μL of each diluted sample was spread on an LB agar plate with 1.5% agar. These plates were incubated at 37°C for 20 h, and then the colonies were counted. The average percentage error in the number concentrations of viable E. coli cells obtained in this study was 13.2% ± 9.5%.
The culture sample was also measured for the total cell dry weight concentration to follow the overall trend of weight-based conversion of E. coli cells to algal cells along the phagotrophic growth. A 2-mL sample was centrifuged at 9,200 g for 1 min and the supernatant was discarded. The cell pellet was washed once and then resuspended in deionized water. The cell suspension was transferred to a preweighed aluminum pan and dried to a constant weight at 70°C.
Glucose and ammonium concentrations
Glucose concentration was measured by the dinitrosalicylic (DNS) colorimetric method. Ammonium concentration was estimated using Aquacheck (No. 2755325) water quality test strips for ammonia.
DO concentration
The DO concentration in culture broth was measured in situ by an optical microsensor PSt3 (PreSens Precision Sensing GmbH), which was attached on the inside wall of the culture flask. The microsensor contained an immobilized oxygen-sensitive dye in polymer matrix. DO of the broth in contact with the sensor was measured optically through the flask wall. The tip of an optical fiber was directed to the sensor matrix; the other end of the fiber was connected to an oxygen meter (Fibox 3-trace v3; PreSens Precision Sensing GmbH), which was connected to a computer for signal translation and data recording.
Results and Discussion
O. danica growth on E. coli cells as the only C and N source
In water only
In System 1, the E. coli and O. danica cells were added to deionized water without any mineral or organic supplementation. The system was also not pH controlled. Results obtained in this system are shown in Fig. 1. The alga used was the nonaxenic UTEX culture. It was clearly shown that O. danica can grow on E. coli cells alone as the source of all nutrients. According to the algal growth profile, the maximum specific growth rate (μmax) and the corresponding doubling time [τd = ln(2)/μmax] in this system were calculated: μmax = 0.064/h and τd = 10.9 h. As shown in the next section, where τd values from various growth conditions are summarized in Fig. 2, the growth of this alga in pure water with washed E. coli cells was comparable with the growth in the MS with E. coli cells. In addition, the extremely low osmotic pressure of deionized water did not cause apparent stress to affect O. danica's phagotrophic growth.
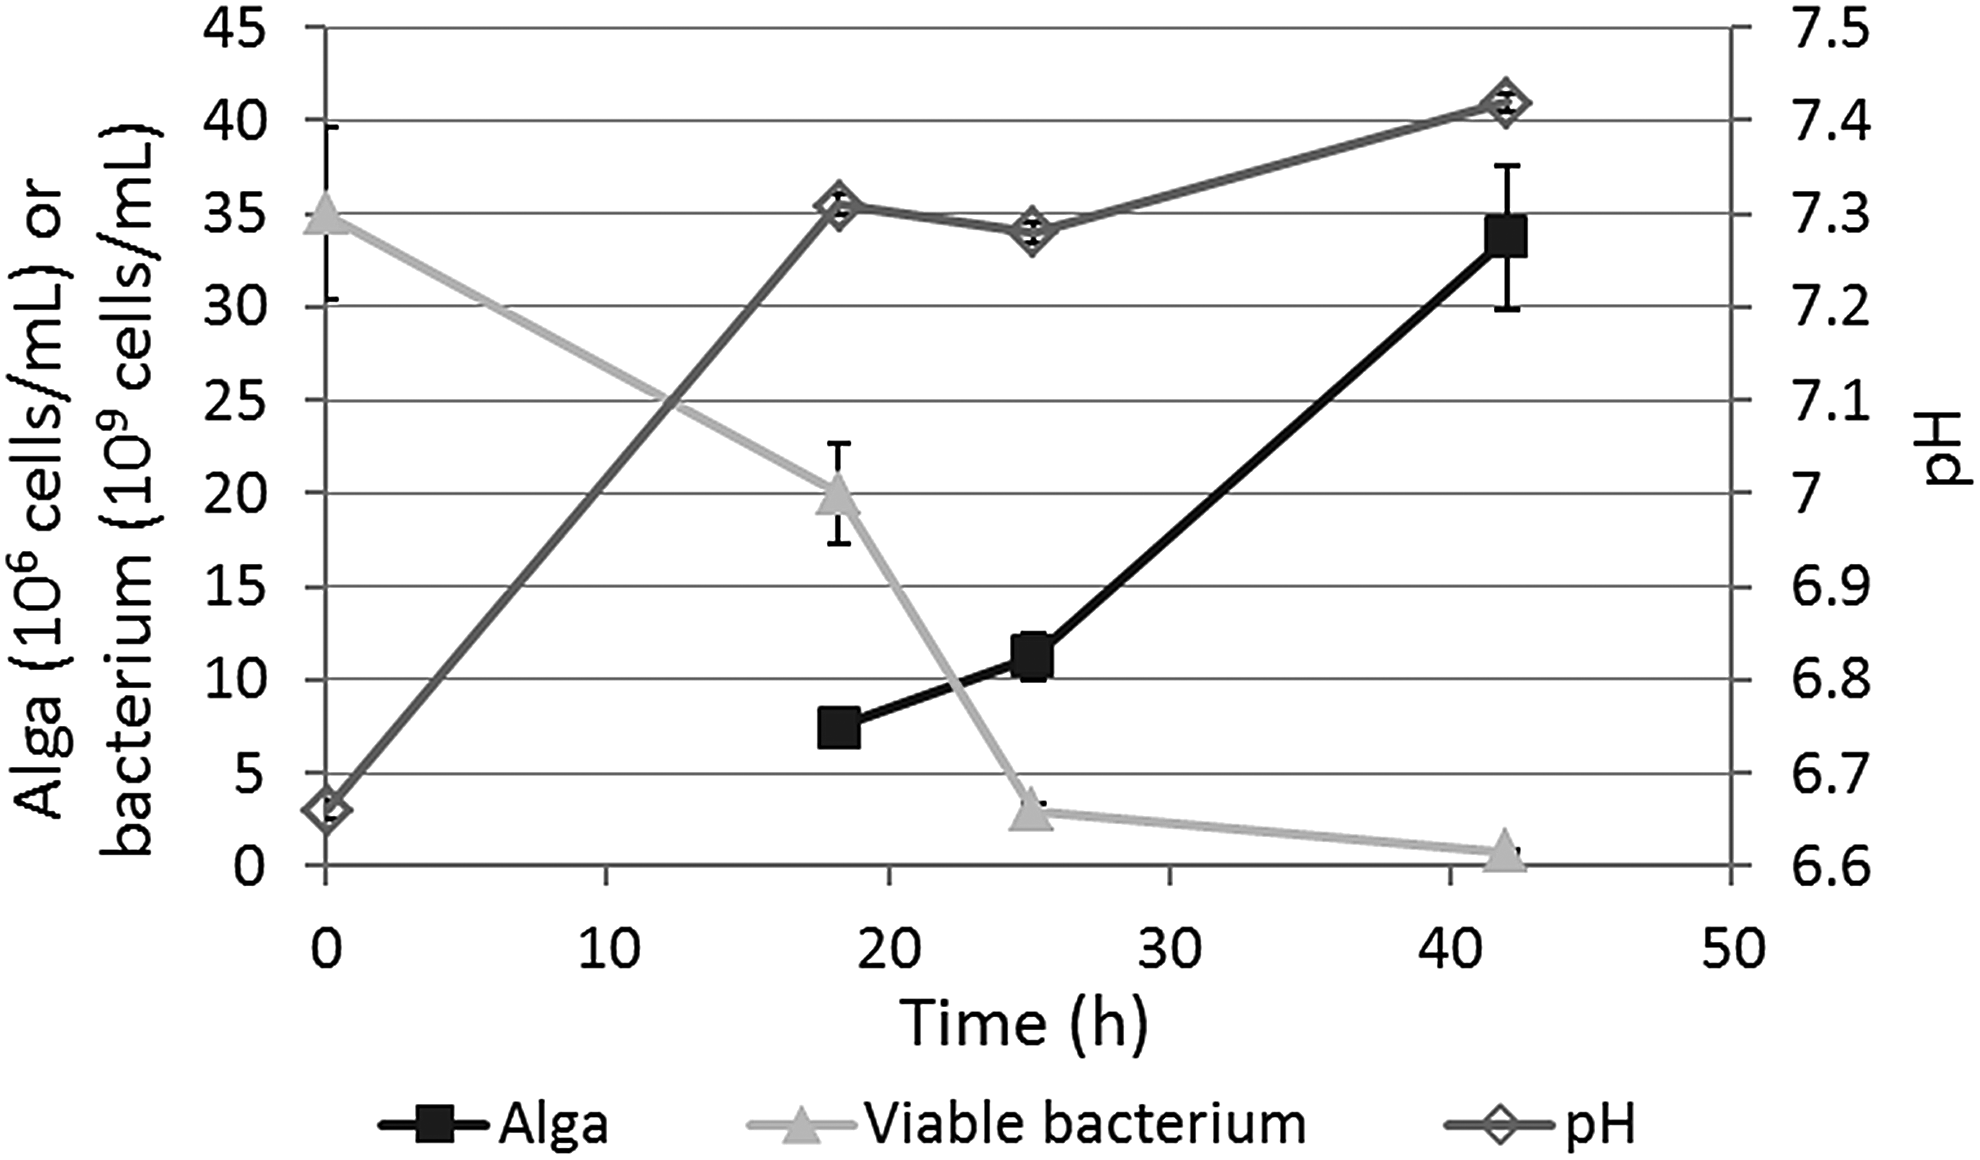
Profiles of Ochromonas danica growth, viable Escherichia coli concentration decrease, and pH change observed in water only, without any supplements other than washed E. coli cells.
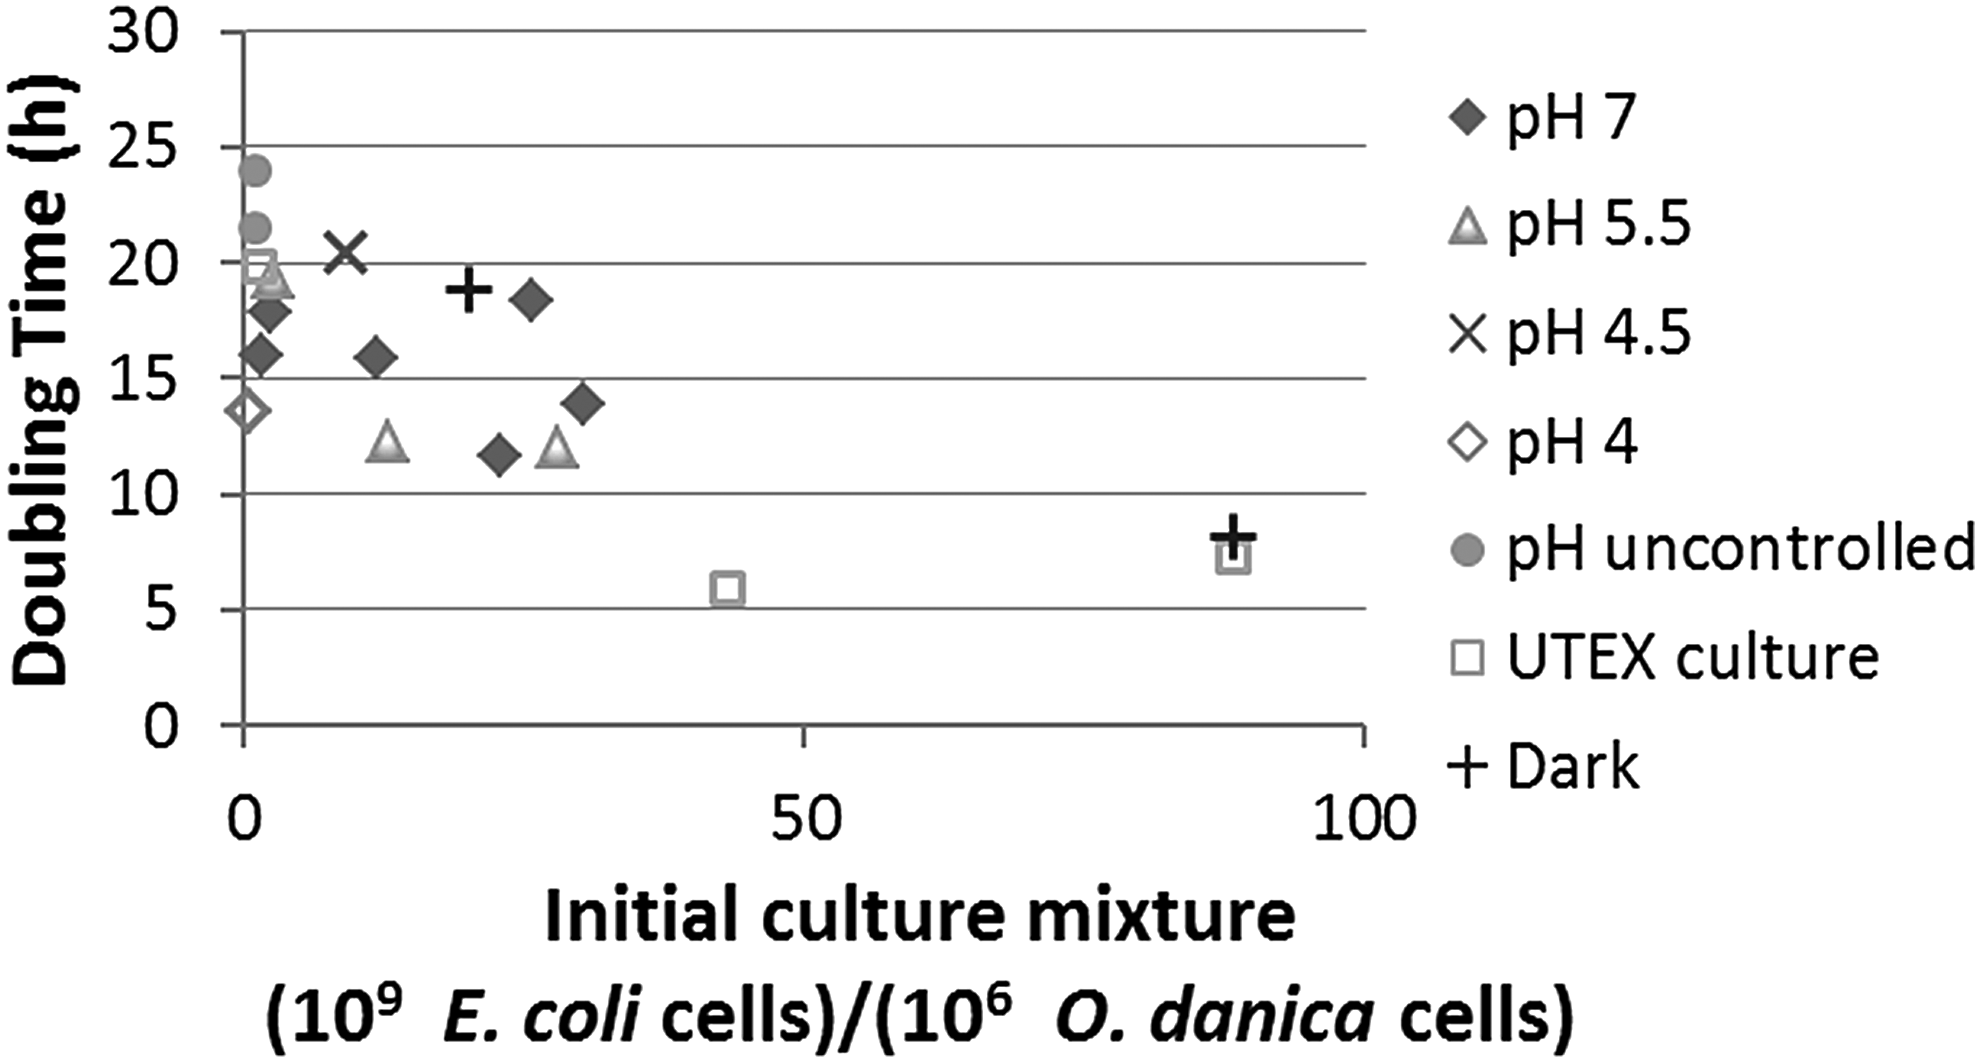
Doubling time of algal growth obtained under different conditions, plotted against the ratio of bacterial to algal cell numbers in initial culture mixture, which was found to have a most significant effect on algal doubling time (R2 values for μmax reported in this figure were in the range of 0.84–1.00. Doubling time was calculated from μmax).
Without control, the pH increased as the alga consumed the E. coli cells, presumably because ammonia was released from metabolism of bacterial proteins. (Ammonium concentration was not measured in this experiment, but the increase of ammonium concentration was confirmed in some later experiments, e.g., as those shown in the Effect of Glucose Supplementation section.) In addition to being ingested by alga, E. coli cells might also be dying due to the absence of any external organic food/energy source in the system and the osmotic stress of deionized water, contributing to the decline of viable E. coli concentration. This latter starvation effect on O. danica growth remains to be evaluated. So far, there has not been any study on how bacterial viability may or may not affect the growth of O. danica preying on them.
Factors affecting algal growth doubling time
Time profiles of O. danica growth from all other experiments were similarly analyzed as described in the previous section to obtain the algal growth doubling times. The results are summarized in Fig. 2. Among all the factors that varied, the limiting substrate availability, that is, the ratio of E. coli cell number to O. danica cell number, in the initial medium was the most important factor affecting the doubling time. The shortest doubling time, 6–8 h, was observed when at least 40 × 109 to 60 × 109 E. coli cells were provided per 106 algal cells. Clear conclusions cannot be drawn for effects of other factors, including the axenic versus nonaxenic culture, without or with pH control at different values in the range of 4–7, and light or dark condition. The uncertainty may be partially attributed to the less accurate measurement of E. coli concentrations by plate counting. It should be noted that while pH in the range of 4–7 did not show a clear effect on O. danica growth, pH at ≤3 and ≥7.5 had been found in preliminary experiments to stop the growth and even cause death of the alga, particularly at pH higher than 7.5. It is possible that the high pH effect was compounded by the known ammonia toxicity effect to algae. For example, for a unicellular green alga, Nephroselmis pyriformis, the toxicity of ammonium–water systems was found to be strongly pH dependent (more toxic at higher pH) and ammonia (instead of the ammonium ions), present in higher fractions of total ammonium concentrations at higher pH, was predominantly responsible for the toxicity (Källqvist and Svenson, 2003). The ammonia toxicity effect to O. danica was not closely examined in the current study, but it was noticed to occur in O. danica fermentations with ketchup as C source (Lin et al., 2014). In the fermentations, even at a low pH of 5, O. danica cells were found to lyse at 1,500 mg/L total ammonium-N and the optimal operation was to maintain the total ammonium-N concentration at lower than 150 mg/L.
Lag phase of O. danica growth caused by step change of pH or dark condition
While pH in the range of 4–7 and the light/dark conditions did not show significant effects on the doubling time of O. danica growth, step changes of these conditions caused longer lag phases, as shown by semilogarithmic plots in Fig. 3. The pH of autoclaved MS was about 5.4; the pH of O. danica seed culture for inoculation was about 5. In earlier experiments with pH control, MS was added with E. coli cells and adjusted to the studied pH before the algal inoculum was added. As shown in Fig. 3, for the systems of pH 4 and 7, the step change of pH experienced by inoculated O. danica cells (originally at pH 5) caused significant portions of algal cells to die (before the growth could recover). (This long lag phase or cell death did not appear in the pH 5.5 system. The data for the pH 5.5 system are not shown to avoid cluttering the figure with too many lines.) In later experiments, to minimize this cell death by pH shock, medium pH was not adjusted to the studied value initially. Instead, the culture was adjusted to the studied pH over a few hours by gradually changing the pH set point (no more than 0.5 units each time). No apparent lag phase was observed in these later experiments.

O. danica growth profiles showing clear initial lag phase or cell death caused by step changes of pH and/or light condition experienced by the inoculated cells, which were prepared at about pH 5 under constant light and were inoculated to medium of pH 4 or 7, or to media under dark condition.
As shown in Fig. 3, clear lag phases were also observed in the two dark systems studied. As the seed culture was grown in light conditions, the lag phase might be also reflecting the alga's sensitivity to sudden environmental changes. This sensitivity was particularly supported by the lag phase observed in the dark pH-uncontrolled system, which had an initial pH of about 5.5. Although the lag phase in this system was shorter than those in other systems shown in Fig. 3, the parallel pH-uncontrolled, but light, system made in the same batch of experiments did not show any lag phase. Nevertheless, the alga could resume normal growth after adjusting to environmental changes.
O. danica growth yield from consumption of E. coli cells
The O. danica growth yield using E. coli cells as the sole C and N source was estimated first in Fig. 4 by plotting the maximum algal number concentrations produced, that is, (maximum–initial) algal number concentrations, against the initial E. coli concentrations added. As expected, more O. danica cells were produced from higher initial E. coli concentrations. The increase of algal yield seemed to level off for the two far right points with very high initial E. coli concentrations, more than 50 × 109 cells/mL. These two systems were done without pH control and the pH increased to beyond 7.5, presumably because more excess ammonia was released from the consumption of high concentrations of E. coli cells. As the pH rose beyond 7.5, the upper limit suitable for O. danica growth, the algal growth slowed and then stopped before all viable E. coli cells were consumed. For these systems, this pH-limited growth is believed to have caused the lower than expected algal yield as per the initial E. coli concentrations provided.
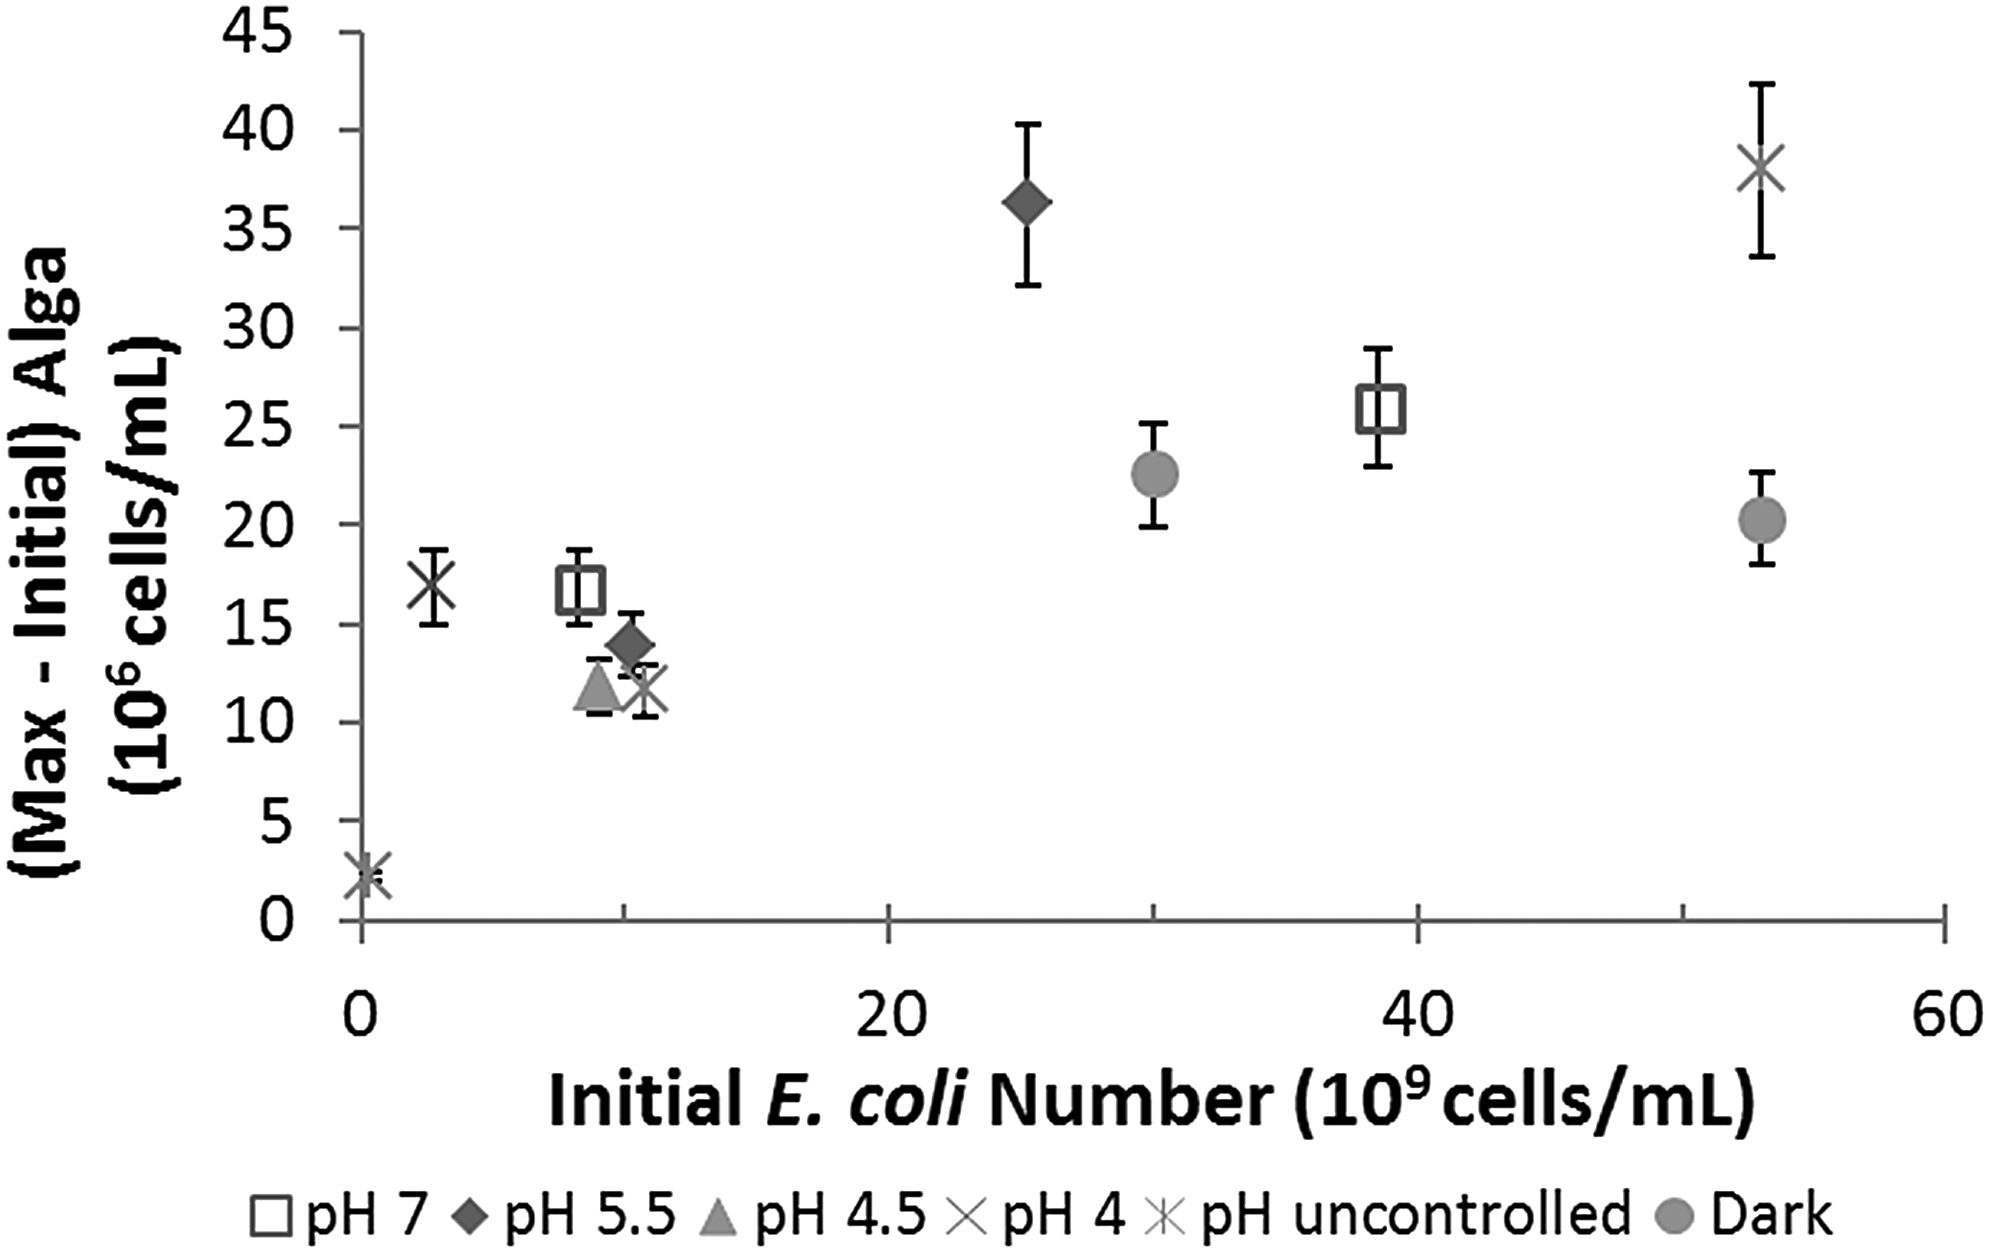
Maximum number concentrations of O. danica cells produced (y-axis) from different initial viable E. coli number concentrations (x-axis).
The data of algal growth yield, excluding the two aforementioned systems, are replotted in Fig. 5 against the initial E. coli dry weight concentrations, which were more accurate than the viable E. coli number concentrations obtained from plate counts. The best-fit equation gave an estimated yield of 4.43 × 10⁶ O. danica cells/mL from 1 g/L E. coli (dry weight) fed to the alga (or 4.43 × 10⁹ O. danica cells per gram E. coli cells).
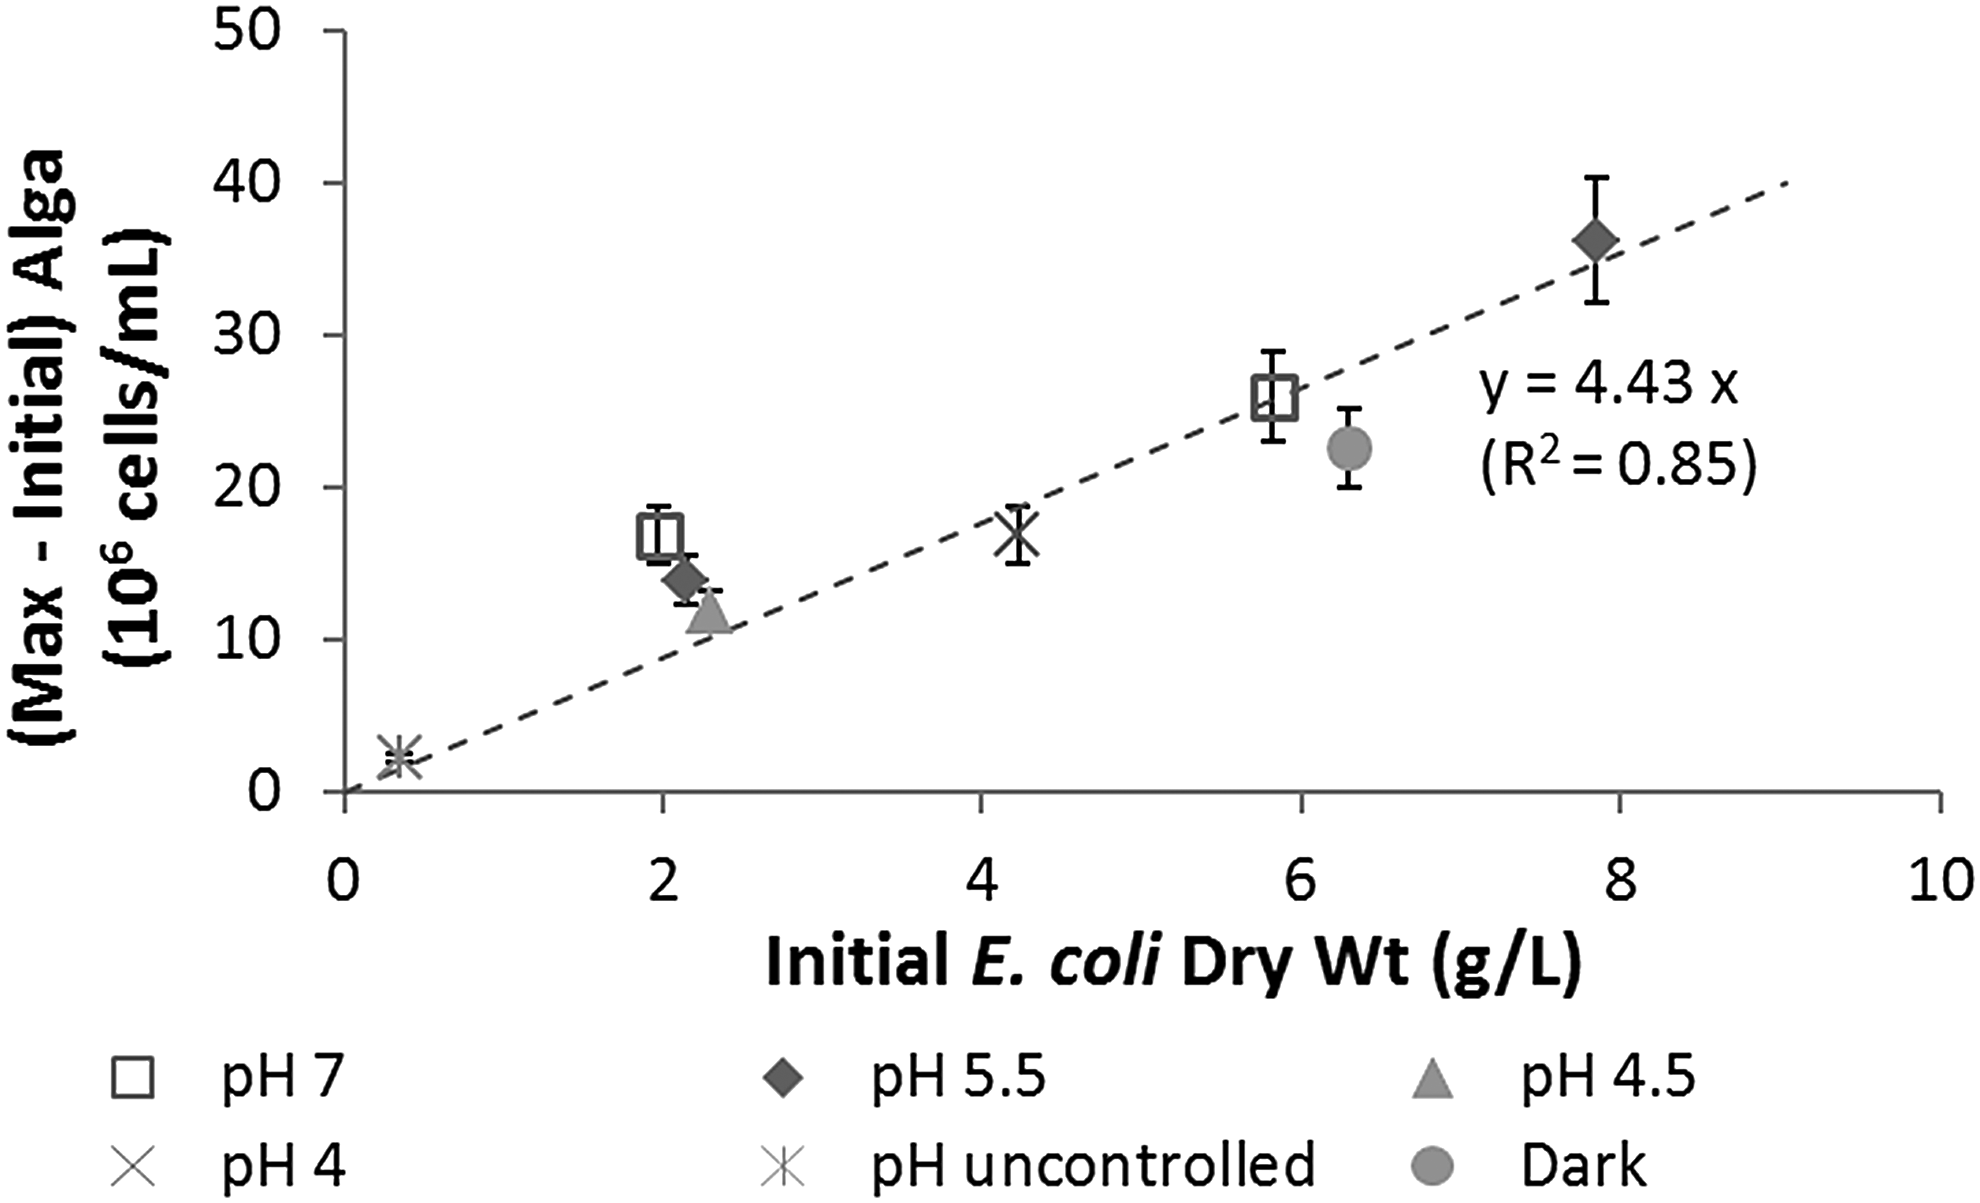
Maximum cell number concentrations of O. danica produced from E. coli cells of different initial dry weight concentrations.
Dry weight of a single O. danica cell was estimated from all experiments by dividing the total dry weight concentrations by the algal cell number concentrations near the end of experiments, where the dry weights came almost exclusively from algal cells. The result was (5.6 ± 1.8) × 10−11 g per O. danica cell grown on E. coli. Using this average single-cell weight, the algal cell yield can be estimated as (4.43 × 109) × (5.6 × 10−11) = 0.25 g per gram of initial E. coli cells, that is, 25%. This is likely an underestimated value because it is estimated at the end of experiments when the algal cells had already entered the endogenous maintenance phase. For comparison, the growth yield of O. danica on glucose under similar conditions was about 38%.
Algal lipid content and production from E. coli cells
The culture's lipid content (%) was calculated by dividing the lipid concentration by the cell dry weight concentration. The lipid contents of initial mixed cultures were 7.5% ± 2.7%, averaged from measurements in multiple experiments. The initial cultures contained predominantly washed E. coli cells. The small amounts of lipids present in the E. coli cells were harder to measure accurately, causing a large standard deviation in the above initial lipid content. Presumably, phospholipids of cell membranes made up most of the bacterial lipids. As the algal population grew, the lipid contents increased; in different light experiments, the maximum lipid content was in the range of 19–41% with an average of 27.2% ± 7.6%. The results did not show clear correlations between the maximum lipid contents obtained and any of the culture factors studied. The time profile of lipid content was also followed in one of the experiments made under the dark condition. The maximum lipid content in this experiment was 12.6%, lower than the lipid content found in any light experiment.
Effect of glucose supplementation
In the above experiments with only E. coli cells as the C and N sources, it was observed that the ammonium concentration would accumulate with time. This observation was partly because E. coli cells had a higher N content than the O. danica cells did; for example, the C:N ratio for stationary-phase E. coli cells at 37°C was reported as 4.6 ± 0.2 (Fagerbakke et al., 1996), while the C:N ratio for O. danica cells growing at 0.06/h at 25°C was reported as 9.5 ± 0.8 (Simonds et al., 2010). While the C:N ratios of cells can change with growth media and conditions, the above values for E. coli and O. danica differ very significantly. The much higher N contents of E. coli than O. danica means that there would be excess N released as ammonia when E. coli biomass was converted to O. danica cells. In addition, it is expected that part of the bacterial organics would be oxidized for generating the energy required for growth and maintenance, while the external N substrates would be consumed almost only for assimilation. E. coli cells were therefore unbalanced sources of C and N to the O. danica growth, providing N in excess. Accordingly, O. danica could grow till all metabolizable C substrates provided by the E. coli cells were exhausted, and then the algal population would decline (as shown in Fig. 3). Two sets of additional experiments were done to investigate the effect of glucose supplementation to make use of the excess N source.
In the first set of experiments, glucose was added at the beginning of the experiments, 0 g/L in System 15 (control), 2 g/L in System 16, and 5 g/L in System 17. This method of glucose supplementation did not turn out well. E. coli cells were alive when glucose was added. They consumed the added sugar rapidly and produced large amounts of organic acids. (Due to the absence of N source, sugar was consumed for generating energy to maintain bacterial survival without appreciable growth.) The acids triggered significant and rapid addition of base (up to 70 mL of 0.2 N NaOH in 15 h) and then acid (up to 40 mL of 0.2 N HCl), presumably when the organic acids were later being consumed. The rapid base addition damaged the algal cells and prevented algal growth in the first 3 (System 16) or 4 (System 17) days.
In the second set of experiments, glucose was not added until 44 h when the viable E. coli cells were almost depleted. By this way, the glucose added was not expected to be consumed significantly by E. coli, so the above problem of active acid production could be avoided and glucose could be mostly used by O. danica for growth (coupled with depletion of excess ammonium released from algal consumption of E. coli). Two additional adjustments were made in these experiments. First, the starting E. coli concentration was lowered by about half, from 3.1 or 3.2 g/L in the previous experiments to 1.4 g/L. Second, the glucose concentration added was increased to 7 g/L. The adjustments were made according to results from the previous set of experiments (Systems 15–17) to ensure that the glucose added was sufficient to support maximum algal growth by consuming all the released ammonium as N source. In the previous experiments, it was found that about 300 mg/L NH3-N would be released in System 15 (without glucose supplementation) and the addition of 5 g/L glucose (in System 17) could reduce the final NH3-N concentration to about 150 mg/L. Therefore, with about half of the starting E. coli concentration, addition of 5 g/L glucose would be just about enough to deplete the released ammonium and 7 g/L glucose would not only ensure the exhaustion of ammonium but also provide some additional glucose for potentially increased lipid synthesis.
In System 18, all of the 7 g/L glucose was added in one step. In System 19, glucose was continuously added at a rate of 0.1 g/L·h during 44–114 h, causing the glucose concentration to slowly increase and then maintain around 0.6 g/L. Results of algal growth, lipid production, and ammonium release-then-consumption observed in these systems are shown in Fig. 6. For comparison, the results of System 8, which had same pH and similar initial O. danica and E. coli concentrations, are also shown in Fig. 6. (NH3-N concentrations were not measured for System 8.) It is clear that glucose supplementation allowed the algal cells to grow to higher concentrations, that is, 38 (±19) or 47 (±16) × 106 cells/mL for the system with continuous or single-step glucose addition, compared with about 18 × 106 cells/mL obtained in the system without glucose addition. The additional algal growth also depleted the ammonium released from consumption of E. coli cells (Fig. 6c). In addition, more lipids, up to 0.53 (±0.02) and 0.85 (±0.04) g/L for continuous and single-step addition, were produced along the glucose-supported growth, while the lipid concentration (<0.18 ± 0.06 g/L) decreased slightly in the system without glucose supplementation.
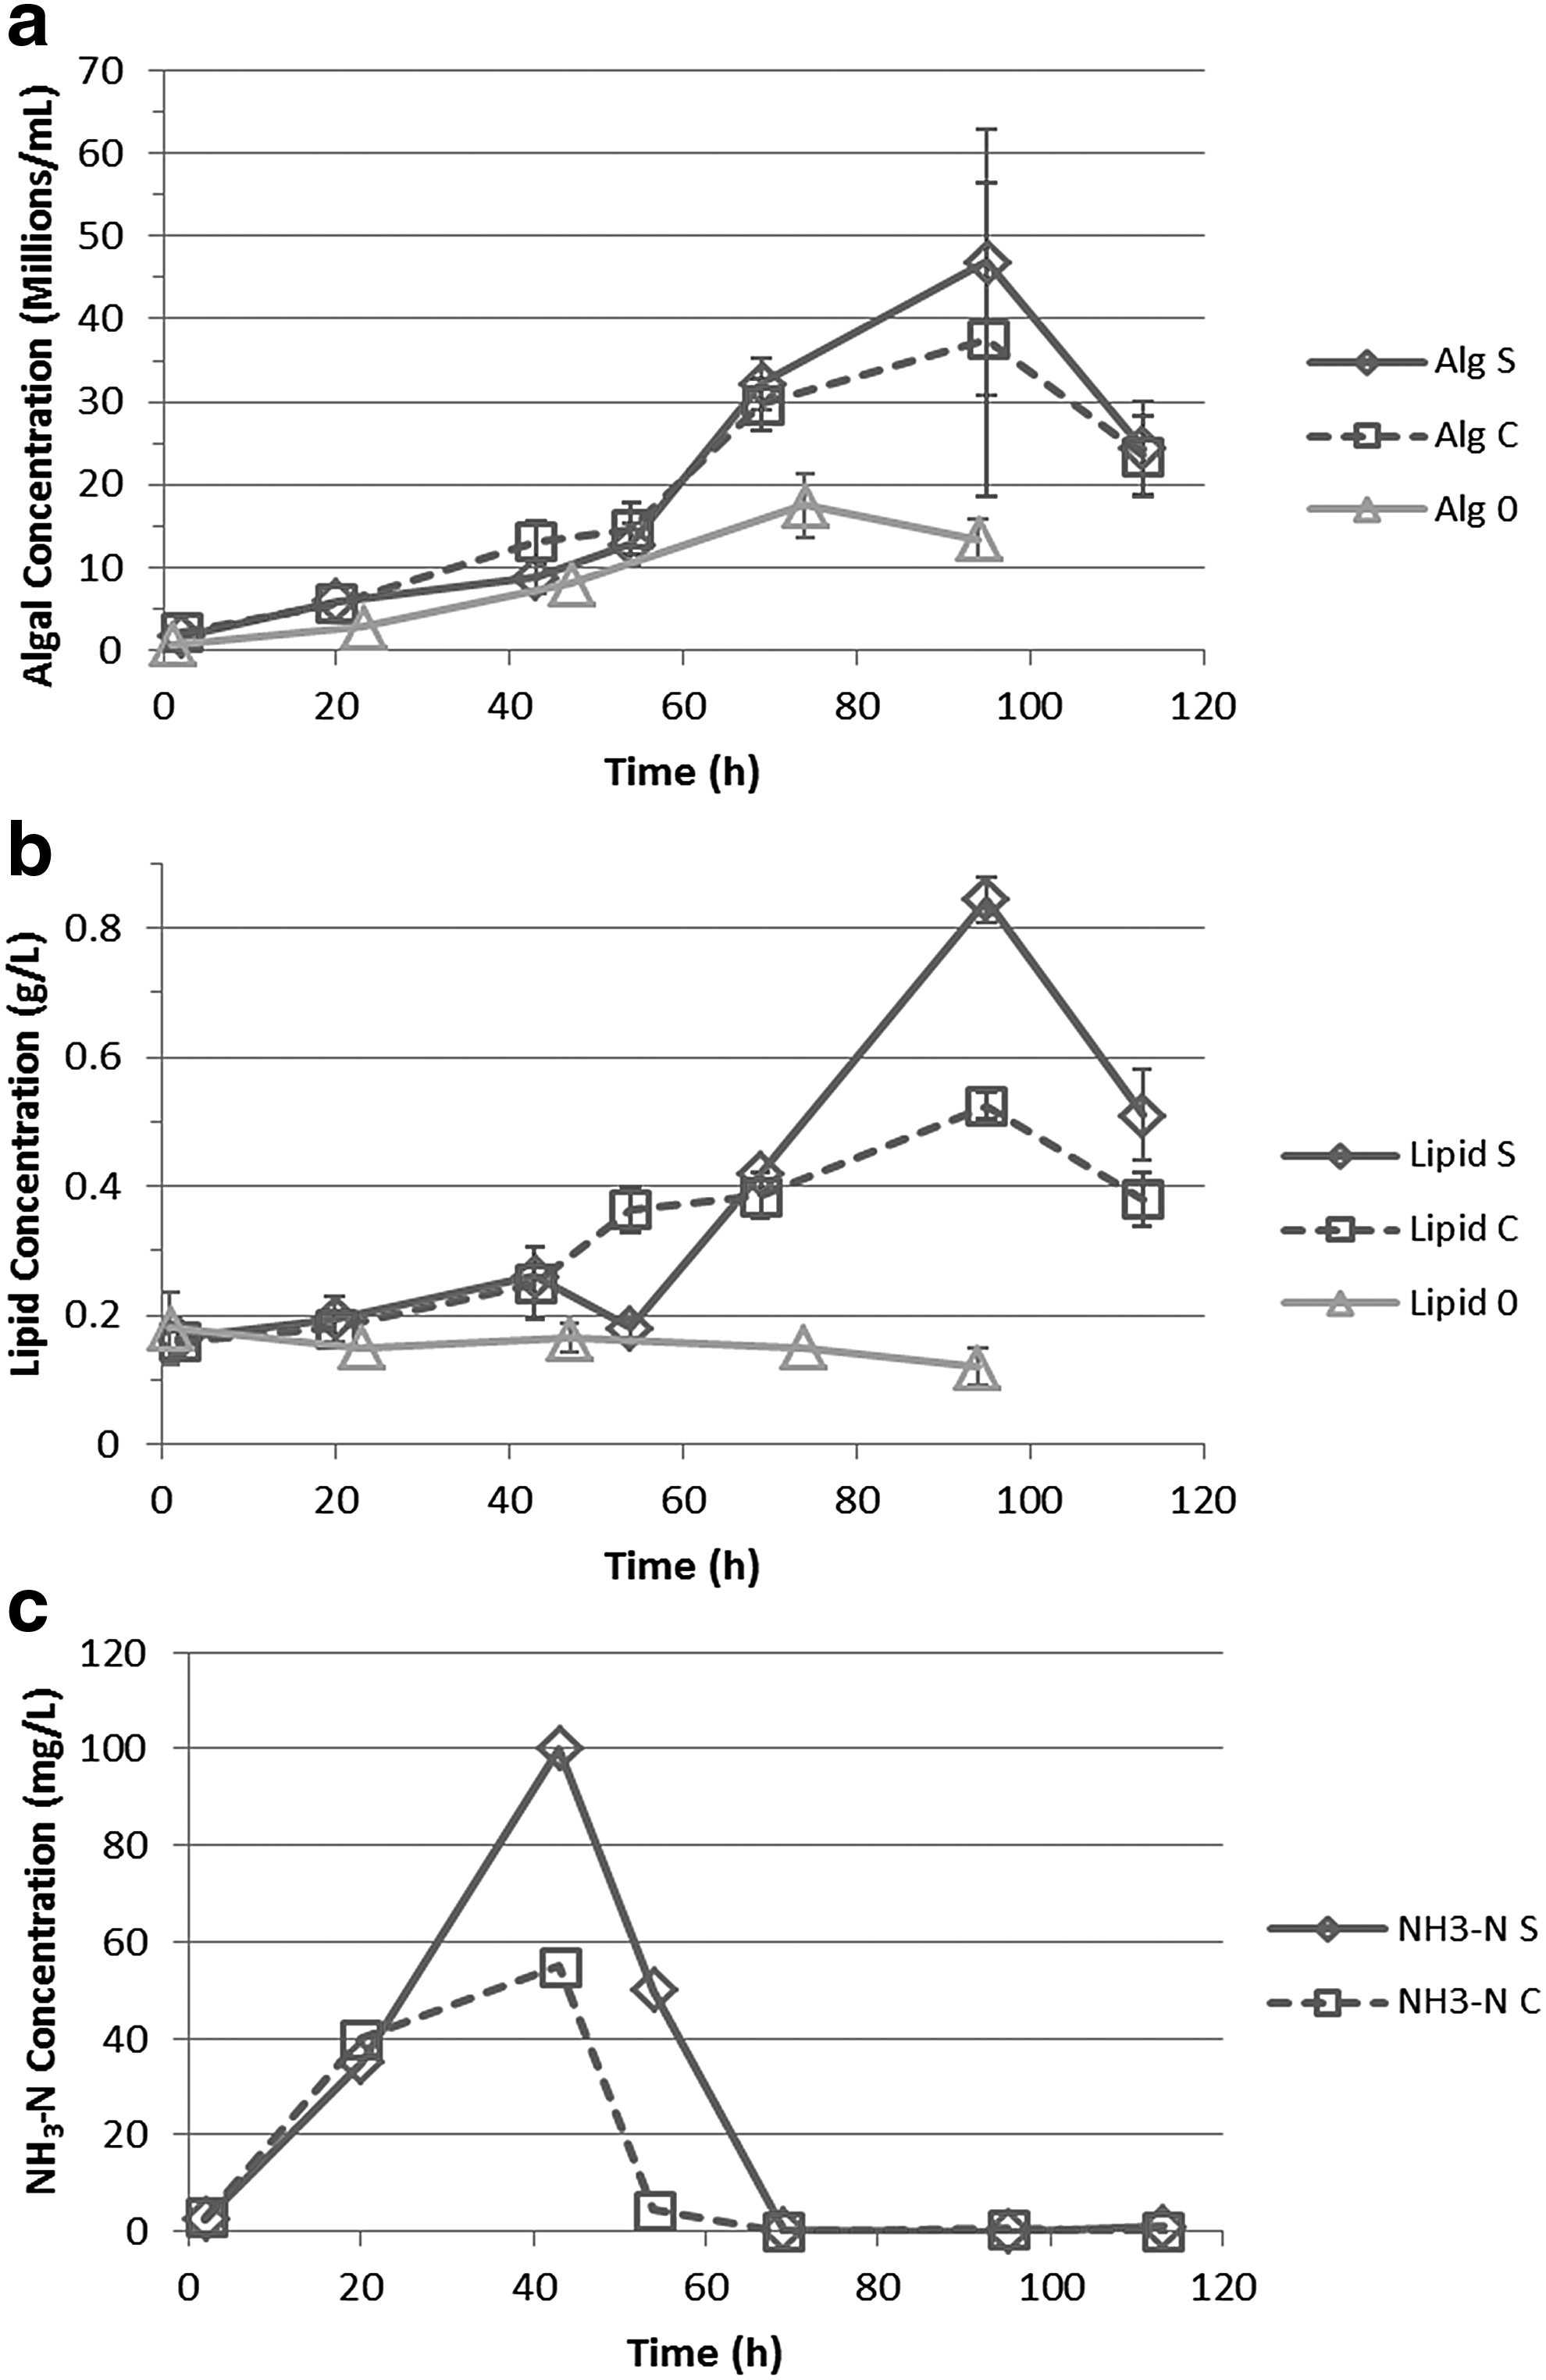
Algal growth
Maximum lipid contents in the O. danica cells were 33–34% in the glucose-supplemented systems. These lipid contents were higher than the average, that is, 27.2% ± 7.6%, but within the wide range, 19–41%, observed in the systems without glucose supplementation. For the system with continuous glucose addition, the 7 g/L glucose supplementation increased O. danica population by 20 × 106 cells/mL, corresponding to an increase of 1.1 g/L algal dry weight; for the system with single-step glucose addition, the 7 g/L glucose supplementation increased O. danica population by 29 × 106 cells/mL, corresponding to an increase of 1.6 g/L algal dry weight. According to a 38% algal cell yield from glucose, the additional algal growth would have consumed about 2.9 or 4.3 g/L glucose (of the 7 g/L supplemented) in the continuous or single-step addition system, respectively. The additional lipids (increased from 0.18 to 0.53 or 0.85 g/L) produced from the rest of glucose corresponded to a lipid yield of 9% in the continuous addition system and a yield of 25% in the single-step addition system.
Summaries
O. danica grew well on E. coli cells under various conditions. Growth rate depended on the feed E. coli-to-O. danica ratio. O. danica was very sensitive to pH shocks, but, once adapted, grew well in pH 4–7 without control. The phagotrophic growth of O. danica was similar in deionized water and mineral medium, indicating that all growth substrates were available from E. coli cells and that the alga was not very sensitive to the potential osmotic stress associated with very low ionic strength in water. The alga also grew similarly well in light or dark conditions. Lipid yield could be improved by glucose supplementation. Results supported the feasibility of producing algal biomass and lipid by using phagotrophic algae-based processes with small microorganisms as food source.
Footnotes
Acknowledgments
This work was supported by the Ohio Water Development Authority (Grant No. 5300). The authors thank Dr. Donald Ott (Department of Biology, The University of Akron) for assistance in microscopic examination and acknowledge the contribution of Dr. Qin Zhang and Mr. Jacob Kohl in establishing many of the experimental procedures in preliminary experiments.
Author Disclosure Statement
No competing financial interests exist.