
Abstract
Abstract
Titanium dioxide (TiO2), frequently used in foods, coatings, pigments, and paints, accounts for a major fraction of engineered nanomaterials released from products during usage. Impacts of food and industrial grade TiO2 on the composition and phenotype of a human gut microbiota, representing an upstream anthropogenic system, were studied to elucidate systemic perturbations to the microbial community. Findings show an inhibition of an expected, natural shift in microbial composition observed during control conditions from Proteobacteria to Firmicutes phyla in the presence of both types of TiO2 particles, with food grade exposures having a greater effect. Additionally, both TiO2 exposures resulted in lower values of the colonic pH (<5) as compared to the control (>5), with food grade exposures recording the largest reduction (∼pH 4). Similar trends in microbial community hydrophobicity and electrophoretic mobility between baseline, food, and industrial grade exposures indicate TiO2 exposures may have little effect on microbial stability. Results of this study indicate that inherent physical and chemical properties of the two TiO2 forms may indeed produce different microbial responses, which is significant when considering environmental exposure and risk, and the design of environmental fate and toxicity studies.
Introduction
E
Assessing titanium dioxide (TiO2) ENMs toxicity to mammalian and aquatic organisms has been the subject of multiple studies. Ecotoxicological assessments of ENMs on fish (Zhang et al., 2007) and rodents (Jani et al., 1994) determined that TiO2 exposures resulted in the intestinal accumulation of the metal oxide ENMs before the subsequent translocation to other bodily systems, such as liver and spleen. Further, an in vivo investigation of TiO2 ENMs introduced to mice resulted in a secondary genotoxic response associated with DNA instability, inflammation, and/or oxidative stresses (Trouiller et al., 2009). TiO2 ENMs introduced to an in vitro intestinal model possessed the capacity to cross the epithelial lining via transcytosis although these effects were nonlethal (Koeneman et al., 2010).
Particle morphology is an additional consideration of ENMs ecotoxicty having been shown to cause inhibition and other deleterious effects to model environmental organisms (Gurr et al., 2005; Hamilton et al., 2009; Tong et al., 2013). Anatase TiO2 exhibited greater toxicity than the rutile form in human bronchial epithelial cells resulting in DNA damage, lipid peroxidation, and micronuclei formation (Gurr et al., 2005). However, toxicity in this case could additionally result from differences in particle size as the anatase TiO2 was 10–20 nm while the rutile form was 200 nm. An investigation between anatase TiO2 nanospheres (60–200 nm diameter) and nanobelts (60–300 nm diameter; 5 and 15 μm length) found that greater toxicity in alveolar macrophages and mice occurred in the presence of the longer nanobelts compared to the shorter, smaller spherical TiO2 particles (Hamilton et al., 2009). Notably, nanobelt introduction resulted in inflammatory responses by alveolar macrophages and the release of inflammatory cytokines.
More recently, the induced phototoxicity to model pathogens was attributed to morphological differences between spherical and low-dimensional TiO2 ENMs (Tong et al., 2013). A major contributing factor was the exposed surface area based on the ENMs alignment along the bacterial surface, mediating the capacity for production of reactive oxygen species. Morphological studies reveal that the same nanomaterial (e.g., TiO2) can result in different microbial impacts depending on the specific properties associated with the particle.
Average daily intake of TiO2 ENMs in food and personal care products were quantified using a number of food sources (Weir et al., 2012). Adults in the United States were found to potentially ingest up to 1 mg TiO2/kg of bodyweight per day. Further, food grade forms of TiO2 more commonly found in food and personal care products would predominate intake, rather than industrial forms more commonly incorporated in environmental health and safety studies.
Five different types of food grade TiO2 in a separate study were obtained from global food suppliers and characterized for comparison to industrial grade (Aeroxide® P25; Evonik Degussa) highlighting notable differences between parameters linked to environmental fate and toxicity (Yang et al., 2014). Elemental and surface composition analyses revealed the presence of substances known to influence environmental fate and toxicity such as phosphorous, silica, and alumina in food grade samples, were not detected in industrial grade samples. These elements were stated to be the result of anionic surfactants added by the manufacturer to increase particle stability.
Considerable differences also existed between the food and industrial grade ENMs in the primary particle size and crystal structure (Yang et al., 2014). Food grade samples contained between 17% and 35% nanoparticles (<100 nm) TiO2 compared to the industrial grade, which had 100% of the particles in the nano-range. Four of the food grade samples had an exclusively anatase crystal structure, whereas P25 and the remaining food grade sample were a combination of both anatase and rutile; however, the food grade sample was largely rutile, while the industrial grade had greater anatase structure. Further, cationic dyes were observed to adsorb more readily to food grade than industrial grade particles, indicating different potentials for interaction with organics in the environment.
These findings support a similar sentiment as Weir et al. (2012), studies considering the fate and toxicity of ENMs should utilize food grade TiO2 in addition to industrial grade, as inherent differences exist between the particle types that are capable of altering their behavior in human and environmental systems.
This study aimed to assess whether the inherent differences between these unique TiO2 particles (food vs. industrial grade), such as particle size and surface potential resulted in comparable perturbations within a complex environment represented here by a human gut microbiota. Specifically addressed in this study were the differing impacts to the microbial community structure and cellular function in the presence of food or industrial grade TiO2 ENMs. A lab scale, in vitro model human colon reactor was utilized to assess perturbances to (1) the microbial community structure determined via DNA sequencing, (2) the microbial community's ability to degrade substrates via biochemical analyses, and (3) changes in phenotypic expressions by physicochemical analyses when the system was exposed to ENM loadings.
Materials and Methods
Model colon reactor
The bench scale model colon reactor has previously been used in studies to determine impacts to microbial communities in the presence of a model pathogen (Marcus et al., 2013), and impacts of other ENMs less commonly used in food and personal care products on the community function (Taylor et al., 2015). Model colon dimensions and operation have been described previously (Marcus et al., 2013).
Briefly, the cylindrical glass reactor is housed in an incubator (Barnstead MaxQ 4000; Thermo Scientific, Asheville, NC) maintained at 37°C. Testing of each experimental condition—baseline (control), food and industrial grade TiO2 exposures—spanned 5 days termed experimental “weeks” and each condition was performed in triplicate (i.e., three baseline weeks, three industrial grade exposure weeks, and three food grade exposure weeks). The colon medium (Venema et al., 2003), similar in composition to digested food entering the large intestine, is pumped into the reactor in 100 mL volumes three times daily (simulating feedings) for the entire 5 days duration of the experiment while 100 mL are equally removed for testing. The three feeding times were morning, afternoon, and night and remained constant between all three testing conditions.
Included in the colon medium are sources of simple salts, carbohydrates, and proteins simulating a western diet. This medium replicates digested food entering the large intestine termed here as colon medium. Per liter the medium contains 4.5 g NaCl, 2.5 g K 2HPO4, 0.45 g CaCl2·2H2O, 0.5 g MgSO4·7H2O, 0.005 g FeSO4·7H2O, 0.05 g ox bile, 0.01 g hemin, 0.4 g cysteine, 0.6 g pectin, 0.6 g xylan, 0.6 g arabinogalactan, 0.6 g amylopectin, 5 g starch, 2 mL Tween 80, 3 g Bacto peptone, and 3 g casein. After autoclaving the media, 1 mL of a vitamin mixture contains, per liter, 1 mg menadione, 2 mg
The colon medium flowed (5 mL/min) within a dialysis tube inside the reactor while a polyethylene glycol mixture flowed external to the dialysis tube (2.1 mL/min), yet still within the reactor, simulating the dehydrating function of the large intestine. All microbial and colonic fluid characterization were performed in triplicate, twice daily in the morning and afternoon feedings.
Before the start of the experimental week, colon medium (200 mL) was inoculated and incubated for 24 h. The inoculum consisted of a microbial community extracted from human fecal material provided by a healthy, 26-year-old female who had been free of antibiotics for 8 months. Initially, control experiments are conducted with the system operating in the absence of ENMs in the model colon. Subsequently, model ENMs are introduced in independent experiments to evaluate perturbations to the microbial community under each exposure condition. The collected colonic fluid, 100 mL, is then utilized for microbial community characterization experiments. During weeks of TiO2 addition the incubator and all media containers are covered to simulate dark conditions.
Nanoparticle selection and characterization
Two forms of nanoscale titanium dioxide were used individually during exposure experiments testing microbial community perturbations. An industrial grade TiO2 (Aeroxide TiO2 P25; Evonik Degussa Corporation, NJ) was selected as it is commonly used in environmental toxicity, fate, and transport studies (Maness et al., 1999; Brunett et al., 2009; Chowdhury et al., 2013; Yang et al., 2014). P25 has a nominal size of 21 nm and no surface coatings are stated in product specifications. A commercially available TiO2, referred to as food grade in this study, was acquired from Arizona State University to represent a form more likely to be utilized in food and personal care products. Particle size was determined to be 122 ± 48 nm using transmission electron microscopy and ion chromatography revealed the surface was coated with inorganic phosphate (Yang et al., 2014).
The daily ENM dose introduced into the colon reactor was determined using estimates based on TiO2 quantities found in commercial food products, which is ∼0.3–0.7 mg/kg of body weight-day for an adult consuming a western diet (Weir et al., 2012). An assumed mass of 80 kg would suggest that ∼36 mg of TiO2 are consumed by an adult male each day (Walpole et al., 2012).
ENMs were quickly added to the bulk solution of colon media at the start of the experimental week, after autoclaving the media, in the biological safety cabinet to minimize contamination risks.
Nanoparticle characterization allowed for better understanding the inherent properties and characteristics of the two different types of TiO2. X-ray diffraction (XRD), dynamic light scattering (DLS), and zeta-potential (ZP) were performed to determine the crystal structure, effective hydrodynamic diameter, and surface potential, respectively, of the industrial and food grade TiO2 particles. Crystal structure of TiO2 particles was determined by scanning 2θ values from 10° to 70° for characteristic TiO2 peaks.
Hydrodynamic diameter (ZetaPALS; Brookhaven Instruments Corp.) was quantified via DLS by suspending 120 ppm of TiO2 in deionized water. Particles were then sonicated for 30 min before addition to respective media, where a final 30 s sonication was performed just before characterization. DLS and ZP (ZetaPALS) measurements were quantified in fresh colon medium before introduction to colon reactor, in addition to 10 mM KCl and 191 mM solution, representing equivalent ionic strength (IS) of the colon medium from pH range 4–8.
Phenotypic microbial characterization
Phenotypic characterization determines the systemic microbial community response to TiO2 introduction combining genetic expression with conditions of the local environment. Testing was performed on the microbial community at the morning and afternoon feedings extracted from the colon fluid after being washed three times at 3,700 g using 10 mM KCl. Bacterial cells were then suspended in 10 mM KCl for all phenotypic testing that consisted of cellular concentration, relative hydrophobicity, electrophoretic mobility (EPM), and protein and sugar content of extracellular polymeric substances (EPS). Cellular concentration was determined using a hemocytometer to quantify cells per volume (Haznedaroglu et al., 2012; Mihmanli et al., 2012; Gutierrez et al., 2016).
Relative hydrophobicity was assessed by the microbial adhesion to hydrocarbon test using n-dodecane as the model hydrocarbon allowing for the separation of bacteria with nonpolar surface groups from the aqueous phase. The higher the concentration of bacteria in the hydrocarbon phase, greater the hydrophobicity value (Walker et al., 2005). EPM was quantified using Zeta-pals zeta potential analyzer utilizing an electric field to determine the relative surface potential of the microbiota in solution. EPS, as protein and sugar content bound to the microbial surface, was determined by following the freeze-dry method and quantified the biomacromolecules colorimetrically (Gong et al., 2009). These characterization tests were performed twice daily using methods published previously in greater detail (Marcus et al., 2013).
Biochemical characterization
Biochemical characterization allowed for determination of the microbial community's response to introduction of the two model ENMs. Specifically, variations in electrical conductivity and pH were observed to determine disturbances caused by the addition of ENMs to the system. Conductivity (YSI 3200 Conductivity Instrument Model #3200 115 V; YSI, Yellow Springs, OH) and pH (Thermo Scientific Orion Star A214, Waltham, MA) were monitored twice daily during morning and afternoon sampling. Conductivity measurements allowed indirect quantification of IS of colon fluid (Griffin and Jurinak, 1973).
Microbial community composition
Microbial community composition determined shifts in the structure of the community resulting from system perturbations associated with ENM introduction. Samples for DNA sequencing were collected and stored at −20°C each day during the morning feeding. DNA extraction was performed using the MoBio (Carlsbad, CA) total microbial extraction kit following the manufacturer's protocols. After extraction, samples were shipped to the Research and Testing Laboratories (Lubbock, TX) for bacterial tag-encoded pyrosequencing using the 28F-388R primer. Sequences were first denoised and assigned operational taxonomic units using quantitative insights into microbial ecology (QIIME) software to allow taxonomic units to then be assigned.
Statistical analysis
Repeated one-way analysis of variance (ANOVA) was used to determine variation of phenotypic and biochemical parameters between testing conditions to account for temporal dependency of data. Tukey honestly significant differences (HSD) was the post hoc test used to determine between which testing conditions (e.g., baseline, industrial grade, and food grade exposures) the statistical significance determined by repeated measures ANOVA occurred. An alpha value of 0.05 (p-value <0.05) was utilized to determine statistical significance between testing parameters (e.g., pH, conductivity, etc.) from TiO2 exposures.
Results
Nanoparticle characterization
Characterization of food and industrial grade TiO2 allowed quantification of physical properties known to influence the human and environmental fate and transport of the particles. Characteristic XRD 2θ peaks for anatase and rutile crystal formations are 25° and 27°, respectively (Fig. 1) (Thamaphat et al., 2008). XRD results indicate that both industrial and food grade TiO2 contained a mostly anatase crystal structure. Specifically, industrial grade samples were comprised of 75% anatase and 25% rutile while food grade TiO2 was 98% anatase and 2% rutile.

TiO2 X-ray diffraction spectra. X-ray diffraction pattern of food grade and industrial grade TiO2 with anatase and rutile peaks denoted by (A) and (R), respectively. Error bars represent the standard error of triplicate measurements.
Hydrodynamic diameters and zeta potential of industrial and food grade TiO2, as functions of IS are presented in Fig. 2A and B, respectively. Food grade TiO2 has a largely unchanged diameter in 10 mM KCl ranging between 212 ± 6 nm to 315 ± 15 nm from pH 4–8 indicating stability under idealized conditions (Fig. 2A). Industrial grade hydrodynamic diameter increases with pH in 10 mM KCl between the range of 252 ± 15 nm to 864 ± 48 nm meaning less stability and greater aggregation.

Hydrodynamic diameter and zeta-potential of industrial and food grade TiO2. Variations in
ZP in 10 mM KCl reveals the isoelectric point (IEP) of food grade particles is between pH 3 and 4 while industrial grade is closer to pH 6.8 (Fig. 2B). Findings agree with previous TiO2 characterization studies determining the IEP of this industrial grade TiO2 as being between pH 6.2–6.8 (Chowdhury et al., 2011; Yang et al., 2014) and the food grade sample of ∼3.5 (Yang et al., 2014). Food grade TiO2 represents a far more stabilized particle under idealized solution conditions.
Additionally, hydrodynamic diameter and ZP of both TiO2 types were quantified at the equivalent IS of colon medium (191 mM) using solely the colon media salts (NaCl, CaCl2, K2HPO4, MgSO4, and FeSO4) dissolved into deionized water (Fig. 2A, B). Figure 2A shows that the hydrodynamic diameters for both TiO2 types undergo little change across pH ranges 4–8, however, industrial grade aggregates were far larger averaging ∼1,091 nm compared to ∼330 nm with food grade samples.
Industrial and food grade TiO2 particles also exhibited similar ZP values at the higher IS (191 mM) between pH 4 and 8 (industrial grade: −14.7 mV; food grade: −14.1 mV) in a solution containing both monovalent and divalent cations. Comparison between the dilute monovalent solution and the equivalent IS of the colon medium in Fig. 2A and B indicates that the stability associated with TiO2 is mediated by the solution chemistry of the complex media. ZP values do indicate that double layer compression occurs with both particles as to be expected in the presence of divalent cations (e.g., Ca2+) (Gregory, 2004). However, differences in hydrodynamic diameter between the two TiO2 types suggests that the food grade particles still exhibit a degree of stability limiting the extent of their aggregation in complex media.
Phenotypic characterization
Cellular concentration was used to determine the quantity of bacterial cells present in colonic fluid (Fig. 3A). Bacterial colonization of the intestines aids normal physiological processes, supports the immune system, and helps defend against pathogen growth (Reid et al., 2001; Hooper et al., 2002; Lupp et al., 2007). Gut microbiota concentration ranges from 103 to 1012 bacteria per mL with highest values observed within the colon (Xu and Gordon, 2003; Posserud et al., 2006). Cellular concentration oscillated throughout the week for the baseline conditions starting at 4.32 ± 0.6 × 10⁹, reaching a high of 6.06 ± 1.9 × 10⁹, and ending at a low of 3.47 ± 1.01 × 10⁹ by day 5 indicating values remained within a normal range during under control conditions.
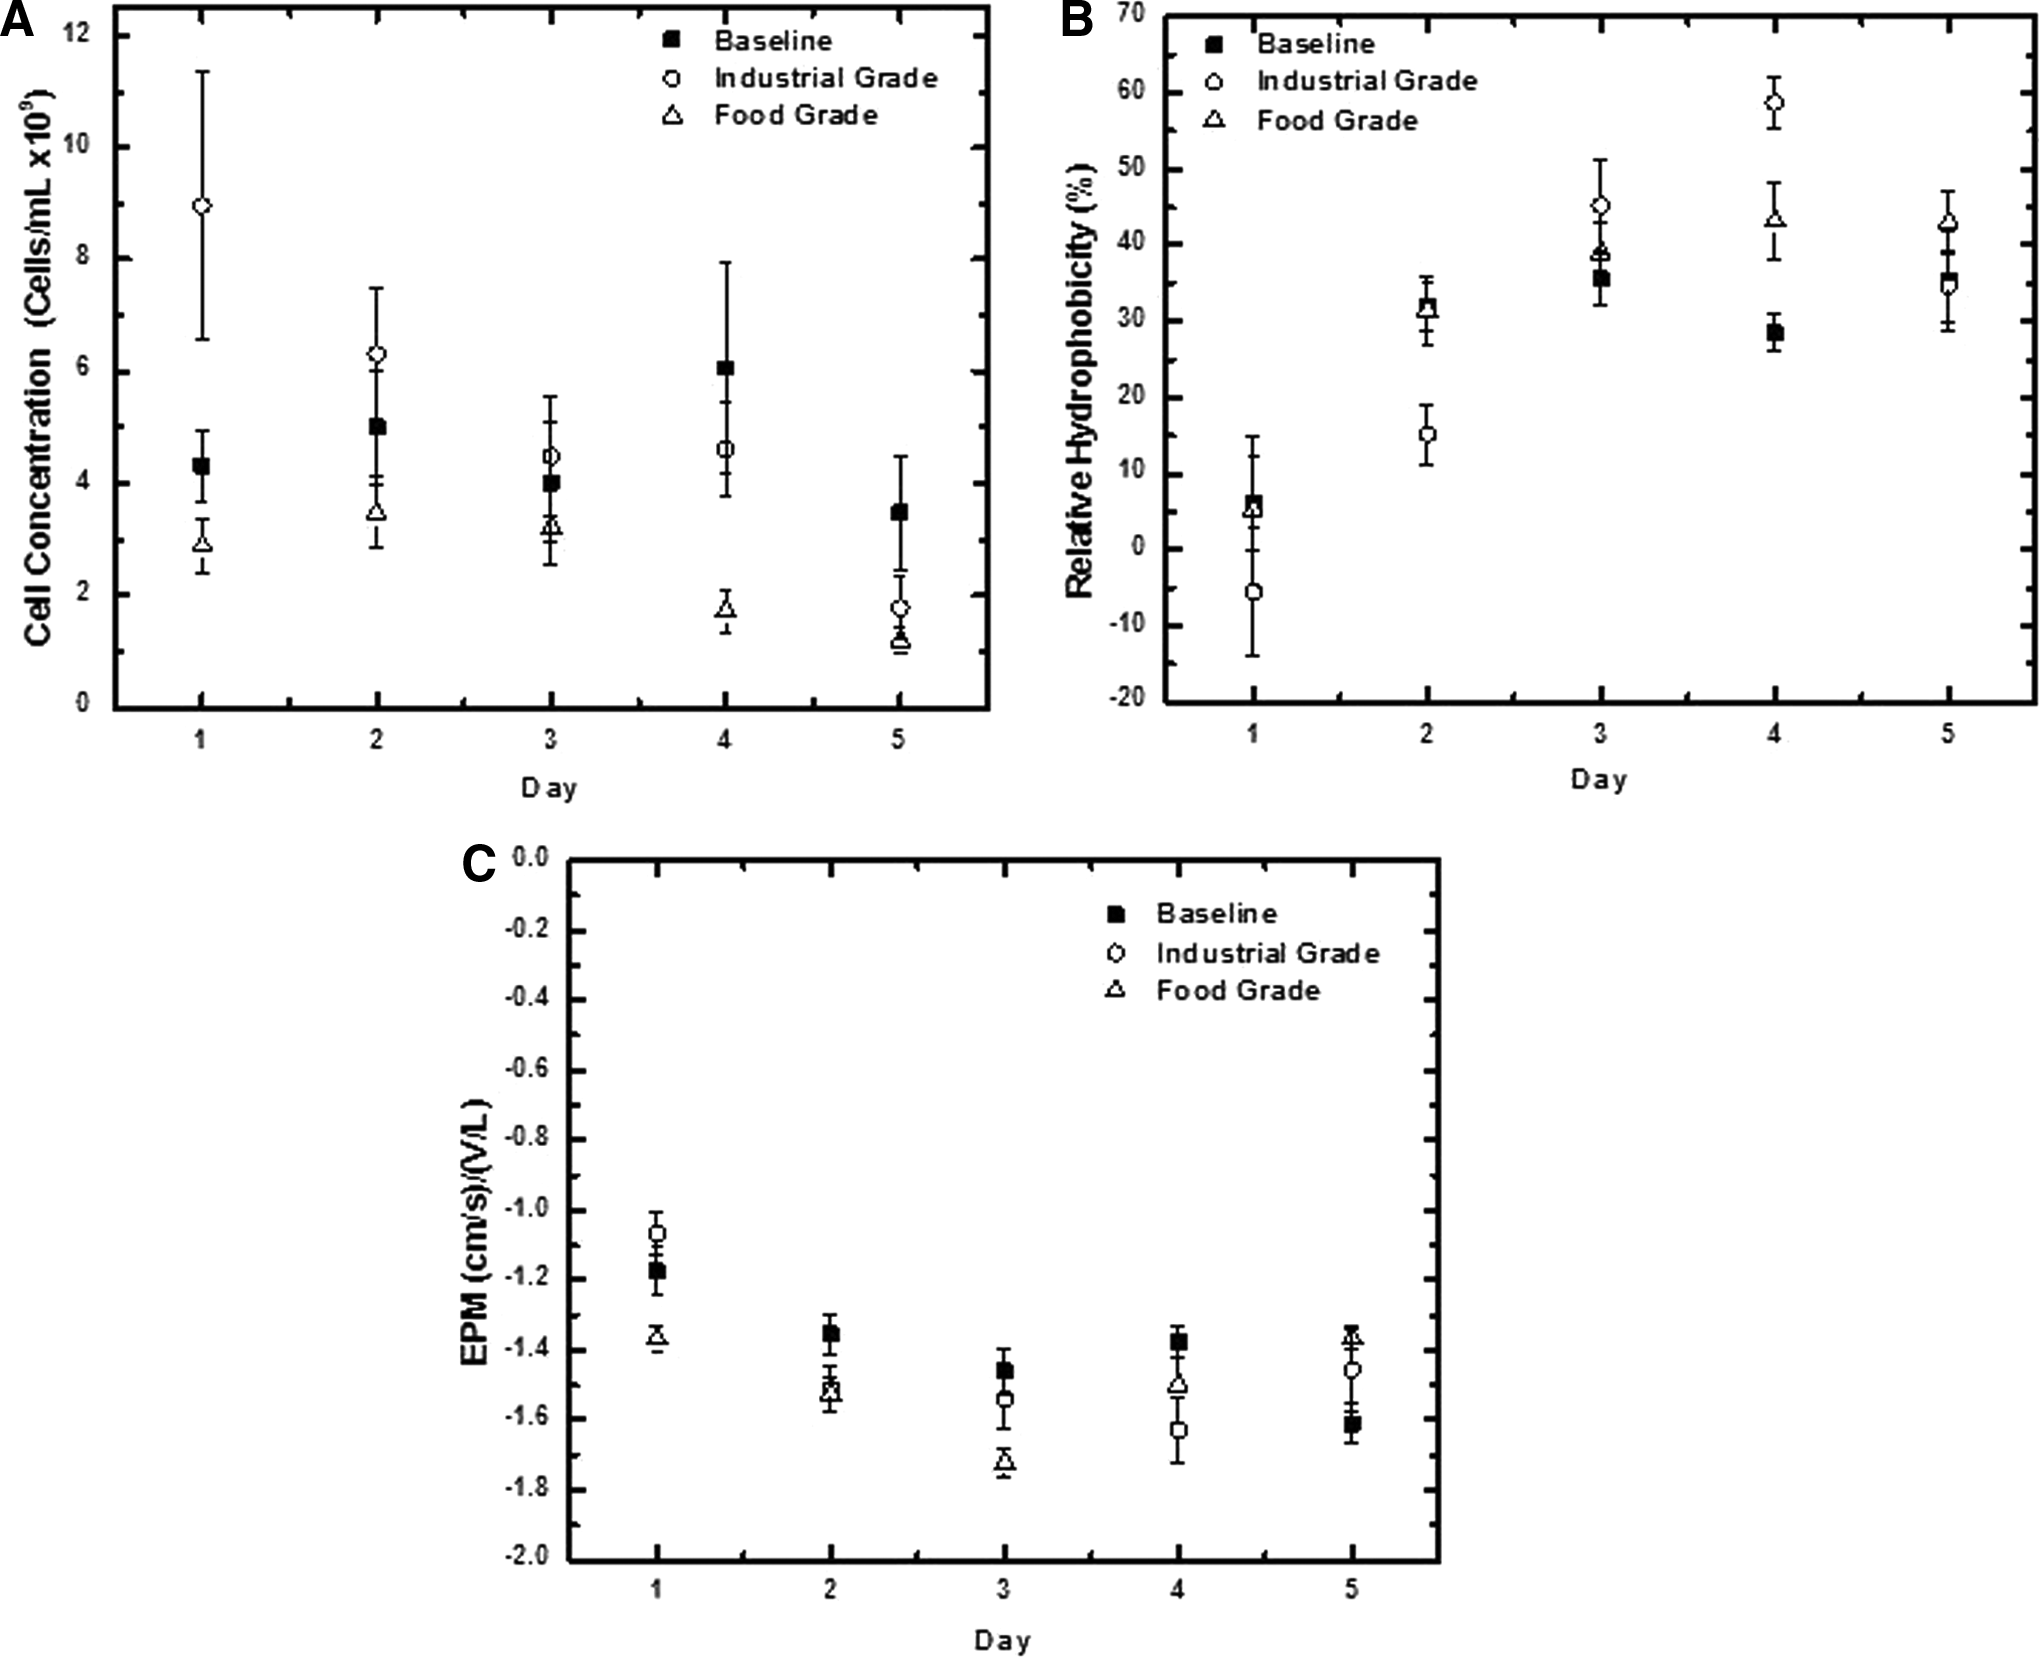
Microbial cellular concentration, hydrophobicity, and EPM. Changes in microbial
Both TiO2 treatment conditions additionally resulted in decreases of cellular concentration during the 5-day exposures. An 80% reduction was observed from the starting cell concentration during industrial grade TiO2 exposure (8.96 ± 2.4–1.78 ± 0.6 × 10⁹ cells/mL). Food grade TiO2 exposures varied showing an initial increase in cellular concentration of ∼20% during days 1 and 2; however, a total reduction of 58.6% (2.88 ± 0.5–1.19 ± 0.2 × 10⁹ cells/mL) was observed from the start to the end of the week. Overall, both TiO2 exposures resulted in a larger decrease in cell concentration than the 19.6% reduction (4.32 ± 0.6–3.5 ± 1.0 × 10⁹ cells/mL) observed during baseline conditions suggesting potential inhibition of physiological processes (Reid et al., 2001). Differences observed in the cell concentration were not of statistical significance (p-value: 0.165, baseline: 4.5 ± 0.4, industrial grade: 5.2 ± 1.2, food grade: 2.5 ± 0.4 × 10⁹cells/mL).
Quantification of the microbial community's relative hydrophobicity provides insight into microbial aggregation, EPS production, and biofilm formation (Schafer et al., 1998; Marcus et al., 2013). Microbial aggregates and biofilms in the human body are indicative of deleterious, inflammatory chronic conditions (e.g., cystic fibrosis, ulcerative colitis) and can prevent nutrient absorption by blocking the pili of the intestines (Fallingborg et al., 1993; Raisch et al., 2014; Johnson et al., 2015). Baseline conditions resulted in a gradual rise in hydrophobicity from 6% ± 6.3% on day 1 to 35% ± 6.5% by day 5 (Fig. 3B). The trend of increasing relative hydrophobicity of the microbiota was also observed previously with a similar in vitro ENM investigation, although values were slightly lower than the current study (1% to 5% ± 0.8% versus 5.3% to 34% ± 16.8%) (Taylor et al., 2015).
Exposure to industrial grade and food grade ENMs also resulted in increases from lows between 0% and 5% hydrophobicity to 34% ± 4.7% and 43% ± 4.1%, respectively, representing a range similar to that of the baseline conditions Relative hydrophobicity trended comparably to baseline conditions during food grade TiO2 exposures until day 3 when baseline reduced from 35% ± 3.5% to 28% ± 2.4%, between days 3 and 4, while food grade increased from 39% ± 3.9% to 43% ± 4.1% for the same time point. Between all testing conditions, the greatest relative hydrophobicity was observed between days 3 and 4 of industrial grade TiO2 exposures noted by an increase from 45.2% ± 6.1% to 58.6% ± 3.5%. After this increase, however, the relative hydrophobicity during industrial grade exposures returns to near baseline levels by day 5 (34.6% ± 4.6% and 35.2% ± 6.5%, respectively).
Differences in relative hydrophobicity were statistically significant between baseline and food grade testing conditions as determined by repeated measures ANOVA (p-value: 0.005, baseline: 27.5 ± 5.5, industrial grade: 29.6 ± 11.3, food grade: 32.4 ± 7.1) and Tukey HSD values (HSD: 27, baseline and industrial grade: 2; baseline and food grade: 5; industrial and food grade: 3). While the conservative nature of Tukey HSD is not always powerful enough to capture statistical significance between means it can suggest between which testing conditions the statistical significance occurs (Jaccard et al., 1984; Vasey and Thayer, 1987). General trends in relative hydrophobicity indicate a slightly more hydrophobic microbiota in the presence of both TiO2 types than baseline conditions with food grade exposures slightly higher than that of industrial grade exposure.
EPM provides a relative measure of the surface charge of the microbiota that is linked to bacterial aggregation and microbial community stability; where higher absolute EPM values are linked with more stable microorganisms (Hermansson, 1999; Marcus et al., 2013). EPM during baseline and both TiO2 exposures show similar trends of increasing negativity of the microbial community until day 4 when the trends begin to deviate (Fig. 3C). Baseline conditions became more negative (higher absolute value) by day 5; whereas, both TiO2 exposures resulted in reduced negativity (lower absolute value) (baseline: −1.61 ± 0.1, industrial grade: −1.5 ± 0.1, food grade: −1.3 ± 0.03, [(μm s−1)/(V cm−1)]), respectively). However, although baseline conditions are more negative than both TiO2 exposures by day 5, the EPM of the microbiota between days 2 through 4 was slightly more negative in the presence of TiO2 particles suggesting greater microbiota stability during this time.
Microbiota EPM during baseline conditions (−1.61 ± 0.1 [(μm s−1)/(V cm−1)]) reflect a similar value (−1.67 ± 0.2 [(μm s−1)/(V cm−1)]) as control values obtained in a previous study utilizing a similar experimental design (Marcus et al., 2013). Variations observed in the EPM were not of statistical significance as determined by repeated measures ANOVA (p-value: 0.063, baseline: −1.4 ± 0.2, industrial grade: −1.44 ± 0.2, food grade: −1.5 ± 0.1), which suggest similar microbial aggregation and transport behavior during each testing condition.
Sugar and protein content of EPS produced by the microbiota are indicators of cellular conditions around the microbial community (Eboigbodin and Biggs, 2008). Sugar content of the EPS during baseline conditions remained mostly constant toward midweek (36.4 ± 3.7–43.6 ± 4.3 mg/1010 cells), when values further reduced by day 5 (26.82 ± 10.7 mg/1010 cells) (Fig. 4A). Relatively constant EPS sugar content produced by the microbiota was also observed previously during control conditions although values were much lower (3.6 ± 0.2 mg/1010 cell) (Taylor et al., 2015).

Microbial EPS production. Variations in average
Industrial grade exposure resulted in a similar starting sugar content (29.7 ± 3.4–46.36 ± 6.1 mg/1010 cells) as baseline conditions through day 3, before an end of the week spike at 117.8 ± 23.5 mg/1010 cells (∼300% increase over 5 days). Conversely, food grade exposures resulted in mostly constant and lower sugar content in the EPS (11.6 ± 0.7–13.5 ± 3.7 mg/1010 cells) than both industrial grade and baseline conditions during days 1–4 and increased slightly higher than baseline on day 5 (46.6 ± 16.9 and 26.8 ± 10.7 mg/1010 cells, respectively). Differences observed in the sugar content were not of statistical significance as determined by repeated measures ANOVA (p-value: 0.253, baseline: 34 ± 3.5, industrial grade: 57 ± 16, food grade: 19 ± 7 mg/1010 cells, respectively).
Protein content of the EPS produced by the microbiota increased gradually until day 3 from 177.9 ± 17 to 240.5 ± 59 mg/1010, cells during baseline conditions (Fig. 4B). After midweek, the protein content then decreased to 121.72 ± 44 mg/1010 cells before rising sharply to 325.8 ± 119 mg/1010 cells by day 5. Increasing protein content of the EPS produced by the microbiota was also observed previously with a similar in vitro ENM investigation, although values were lower than the current study (40–80 mg/1010 cells) (Taylor et al., 2015).
Protein content of the EPS during both TiO2 exposures followed a similar trend observed during baseline conditions remaining higher with food grade exposures and lower with industrial grade exposures. Differences observed in the protein content between testing conditions were of statistical significance as determined by repeated measures ANOVA (p-value: 0.0004, baseline: 213 ± 34, industrial grade: 207 ± 49, food grade: 290 ± 52). Tukey HSD values for protein content (HSD: 110, baseline and industrial grade: 6; baseline and food grade: 77; industrial and food grade: 83.), while conservative, still support that statistical significance is observed between food grade exposures and both industrial and baseline conditions. This difference is also evident in the trends observed in Fig. 4B.
The sugar to protein ratio (S/P ratio) is utilized as an indicator of cellular conditions, whereas increased sugar content suggests microbial aggregation and biofilm formation (Marcotte et al., 2007). During baseline conditions, the S/P ratio increased from day 1 to 4 by ∼140% (0.24 ± 0.04–0.57 ± 0.1, respectively) followed by a sharp reduction on day 5 to 0.09 ± 0.01 (Fig. 4C). Industrial grade exposures follow baseline conditions early in the week as the S/P ratio nearly doubles from 0.243 ± 0.044 on day 2 to 0.424 ± 0.046 by day 4 and rises slightly higher into day 5 (0.489 ± 0.088) contrasting with baseline observations. Alternatively, food grade exposures resulted in a largely unchanged S/P ratio throughout the week with the exception of day 5 where an increase of 40% (0.05–0.07) occurred from the start of the week.
Variations observed in the S/P ratio between testing conditions were not of statistical significance as determined by repeated measures ANOVA (p-value: 0.58, baseline: 0.327 ± 0.184, industrial grade: 0.357 ± 0.1, food grade: 0.057 ± 0.011). However, Tukey HSD values for S/P ratio show near statistical significance between group means of testing conditions with food grade exposures in relation to both industrial and baseline conditions, which is also supported by trends in Fig. 4C; although, as values remain just below 0.4, they are not reflected as significant by this conservative procedure (HSD: 0.4, baseline and industrial grade: 0; baseline and food grade: 0.3; industrial and food grade: 0.3).
Biochemical characterization
Measurement of colonic fluid pH provides insight into microbial degradation of energy sources and overall colon health (Nugent et al., 2001). Healthy colonic pH values typically fall between 5.5 and 7.5 (Nugent et al., 2001). Colonic pH during baseline conditions generally remains in this range decreasing from 6.7 ± 0.1 to 5.4 ± 0.1 from day 1 to 5 with a weekly low occurring on day 3 of 4.9 ± 0.1 as shown in Fig. 5A. Industrial grade exposure also resulted in a pH reduction from 6.7 ± 0.03 to 4.7 ± 0.1 from day 1 to 5. Food grade exposures additionally decreased reaching the lowest pH of all testing conditions by day 5 (6.4 ± 0.05–4.1 ± 0.02). Reductions in intraluminal colonic pH suggest significant changes occurring within the colon possibly indicating the onset of deleterious colonic conditions (Nugent et al., 2001).

System pH and conductivity. Changes in system
The pH recovery observed on day 3 in baseline conditions shifted toward day 4 (4.5 ± 0.1) with industrial grade exposures and day 5 (4.1 ± 0.02) for food grade exposures. Variations observed in the pH between testing conditions were of statistical significance as determined by repeated measure ANOVA (p-value: 0.0004, baseline: 5.5 ± 0.8, industrial grade: 5.2 ± 0.4, food grade: 4.9 ± 0.4). Tukey HSD values for pH indicate that none of the statistically significant variance in the data set is reflected by the conservative estimates for significance among group mean values (HSD: 0.9, baseline and industrial grade: 0.2; baseline and food grade: 0.6; industrial and food grade: 0.3). However, HSD values do suggest that statistical significance quantified using ANOVA likely lies between food grade exposures and baseline conditions as the 0.6 difference is nearest to the 0.9 HSD value.
Conductivity measurements quantify ionic content of the solution and indirectly approximate IS (Griffin and Jurinak, 1973). Short chain fatty acids (SCFAs) are organic anions produced from the degradation of organic compounds within the human colon partially responsible for increasing ionic content (Nugent et al., 2001) The production and further degradation of SCFAs alters the conductivity of the intraluminal colonic fluid, which would additionally be reflected in the system pH. Baseline conditions recorded an increase from day 1 to 2 of 4.7 ± 0.3–5.5 ± 0.5 mS/cm before reducing to 5.1 ± 0.4 mS/cm on day 3 and remaining largely constant into day 5 (Fig. 5B). Findings suggest mineralization of the organic compounds is indeed occurring during the control weeks.
The conductivity of the matrix upon industrial grade particle exposure was higher on day 1 (6.8 ± 0.3 mS/cm) than baseline conditions before reaching comparable levels on day 2 (industrial grade: 5.3 ± 0.2; baseline: 5.5 ± 0.5 mS/cm). These values remained higher, increasing to 6.4 ± 0.3 mS/cm by day 5. Conductivity during food grade exposure contrasts with industrial grade exposures by remaining relatively constant showing only a 6% increase from beginning to end of the week. Notably, the highest value of conductivity was observed on day 4 during industrial grade exposure measuring 38% and 50% greater than baseline conditions and food grade exposure, respectively.
Variations observed between testing conditions in conductivity were not of statistical significance as determined by repeated measures ANOVA (p-value: 0.63, baseline: 5.092 ± 0.1, industrial grade: 6.332 ± 0.3, food grade: 4.59 ± 0.09). However, Tukey HSD values do indicate statistical significance between group means for industrial and food grade conditions (HSD: 1.4; industrial and food grade: 1.7) and nearly significant between baseline and industrial grade (HSD: 1.4; baseline and industrial grade 1.2), which is supported by trends observed in Fig. 5B. Findings indicate that industrial grade TiO2 exposure may increase the production of acidic metabolites, reflected by the highest conductivity, whereas the food grade TiO2 exposures conversely result in an inhibitory action determined by lower conductivity than baseline conditions.
Microbial community composition
Quantification of the microbial community allows for the characterization of the most abundant bacteria within the gut microbiome (Arumugam et al., 2011; Marcus et al., 2013). Proteobacteria dominance on day 1 (99% ± 0.0%) in baseline conditions and both TiO2 exposures indicates a consistent microbial distribution at the start of each experiment (Fig. 6). Firmicutes became the most abundant phyla by day 5 under baseline conditions accounting for 81% ± 0.0% of the microbial community.
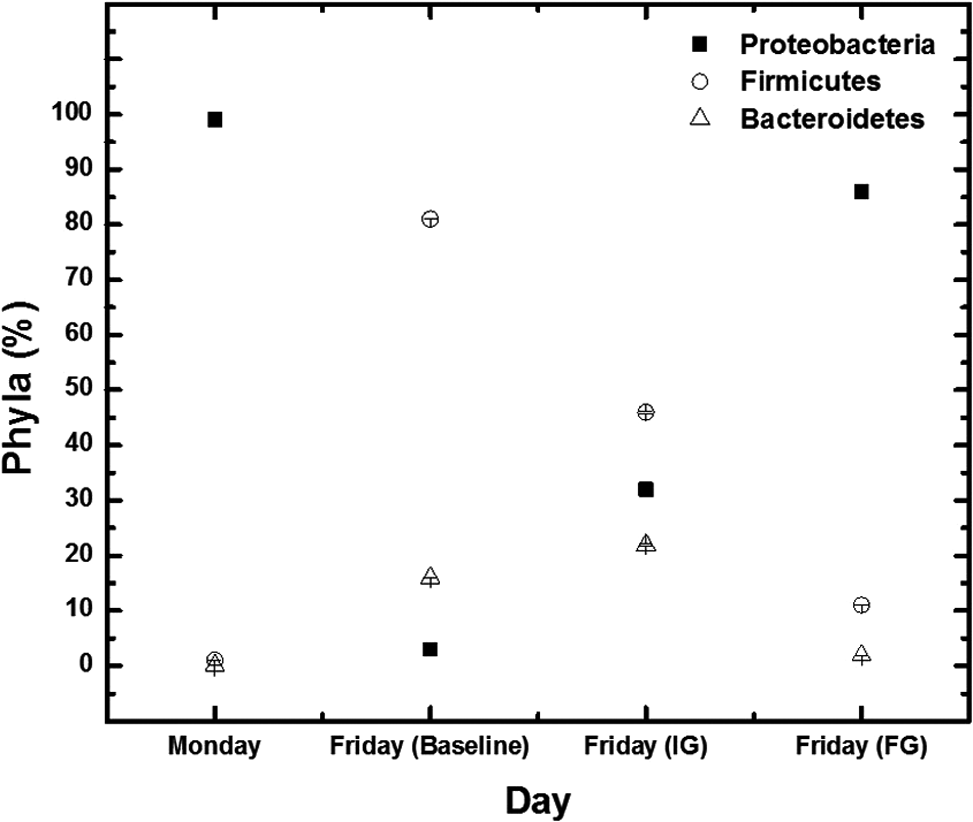
Microbial community composition. Changes in microbial composition of the human gut microbiota in a model colon reactor measured on day 1 (Monday) and day 5 (Friday) during a 5-day experiment. Conditions tested include exposure to 36 mg/L/day IG or FG TiO2 nanoparticles and the particle free control referred to as BL. Monday represents all three testing conditions since each began with same starting microbial composition (Proteobacteria >99% ± 0.0%). The microbial compositions observed on Friday are presented individually for each testing condition. Error bars represent the standard error of triplicate measurements of daily averages between reactor runs of the same experimental condition. BL, baseline; FG, food grade; IG, industrial grade.
Under exposure to industrial grade particles, a greater combination of phyla existed. Notably, Proteobacteria initially dominated at 99% ± 0.0%, but reduced to 32% ± 0.0% while Firmicutes and Bacteroidetes became more abundant (46% ± 0.2% and 22% ± 0.2%, respectively). Alternatively, food grade exposure resulted in decreasing Proteobacteria (99% ± 0.0% to 86% ± 0.0% over 5 days), although it remained the most abundant phyla present. Only minor increases were observed for both Firmicutes and Bacteroidetes from 1.3% ± 0.0% to 11% ± 0.0% and 0.234% ± 0.0% to 2% ± 0.0%, respectively. Increased quantities of Firmicutes compared to Bacteroidetes in the microbiota have been associated with increased energy reabsorption and obesity (Ley et al., 2005, 2006; Turnbaugh et al., 2006).
Discussion
Microbial community composition
Assessment of the microbiota in the absence of TiO2 particles (baseline conditions) revealed that the community naturally shifted from a phyla composition dominant in Proteobacteria to that of Firmicutes over the course of the 5-day experiment. Numerous studies determined that the human gut microbiota largely consists of Bacteroidetes in in vitro models and Firmicutes in real gut microbiomes when fed diets high in proteins and fats (Ley et al., 2006; Turnbaugh et al., 2006; Zoetendal et al., 2008; Arumugam et al., 2011).
While the Proteobacteria dominance observed at the start of each experimental condition conflicts with the reported compositions, this can be attributed to the microbiota donor consuming a vegetarian diet with greater amounts of carbohydrates rather than animal proteins and fats (Arumugam et al., 2011). Further, studies have determined that long-term dietary selection plays a major role in the normal composition of the microbial community (Gill et al., 2006; Benson et al., 2010). However, in addition to this, sudden changes in diet can cause rapid community shifts to occur supporting the phyla shift observed in the microbiota during baseline conditions (Wu et al., 2011; David et al., 2014).
Moreover, Turnbaugh et al. (2009) utilized metagenomics analyses to observe and report a shift in microbial composition to Firmicutes dominant in humanized gnotobiotic mice when the diet was switched from mouse chow to a western diet (Turnbaugh et al., 2009). Yet even with perturbations, the gut microbiota, overall, is quite stable with consistent diet and capable of restoration after perturbations (Vanhoutte et al., 2004; Costello et al., 2009). Therefore, a diet high in animal protein and fats as commonly found in western diets explain the microbial shift from Proteobacteria to Firmicutes observed during these control conditions.
Interestingly, inhibition of the baseline transition in microbial composition from Proteobacteria to Firmicutes dominance (as anticipated via dietary considerations) occurs during TiO2 exposures. Food grade TiO2 exposures only show a minor drop in Proteobacteria from 99% ± 0.0% to 86% ± 0.0% indicating a largely unchanged microbiota with this form of TiO2. Proteobacteria during industrial grade exposure was reduced from 99% ± 0.0% to 32% ± 0.0%, however, the Firmicutes dominance was less than that observed during baseline conditions (46% ± 0.2% and 81% ± 0.0%, respectively).
Microbial composition is of vital importance as the human gut microbiota plays a significant role in maintaining colonic health and preventing the development of disease (Sekirov et al., 2010). Increased quantities of Firmicutes compared to Bacteroidetes in the microbiota are associated with increased energy reabsorption and obesity (Ley et al., 2005, 2006; Turnbaugh et al., 2006). Thus, the greatest energy reabsorption may occur normally during baseline conditions as Firmicutes composition dwarfs Bacteroidetes (81% ± 0.0% to 16% ± 0.0%, respectively) compared to both TiO2 exposures with the least energy reabsorption possibly during food grade exposure (Firmicutes: 11% ± 0.0%; Bacteroidetes 2% ± 0.0%, respectively).
Differences in microbial community composition may be explained by direct interaction between TiO2 particles and the bacteria (Jiang et al., 2009; Chowdhury et al., 2012), and binding of colon medium molecules to the TiO2 surfaces (Cedervall et al., 2007b; Jiang et al., 2010; Walkey et al., 2012). Either binding action (bacteria and TiO2; colon medium and TiO2) can result in aggregation that prevents the microbiota from reaching the energy sources most necessary to remain viable. Microbial aggregates are associated with increased biofilm within the human colon, which has been linked to the development of chronic inflammatory conditions (Fallingborg et al., 1993; Raisch et al., 2014; Johnson et al., 2015). As such, the hindered community transition in presence of TiO2 particles from Proteobacteria to Firmicutes dominance may potentially be due to surface interactions preventing access to microbial nutrients potentially resulting in persistent, colonic health concerns.
Particle stability is known to influence the fate and transport of nanoparticles and depends upon the surface and solution chemistries. EPM (used to calculate ZP [Gregory, 2004]) provides a measure of ion accumulation around the surface for assessing particle stability. These properties impact the capacity of the particles to approach and interact with other particles leading to homo-aggregation. Previous work with food and industrial grade TiO2 suggest that the aggregation and stability are sensitive to the pH of the solution relative to the IEP of the particle (Zhang et al., 2008; Domingos et al., 2009; French et al., 2009; Keller et al., 2010; Chowdhury et al., 2011; Yang et al., 2014).
Notably, industrial grade particles have an IEP near pH 6.8 and food grade closer to pH 3.5 (Yang et al., 2014). DLS and ZP measurements shown in Fig. 2A and B using solutions of 10 mM KCl and only the salts present in the colon media (IS 191 mM) demonstrate that the IEP for industrial and food grade TiO2 occurs near pH 6.8 and <4, respectively. The intial pH of the colon media at particle introduction (∼6.7) suggests greater electrostatic stability with food grade particles than the industrial grade form of TiO2, likely resulting from an intentionally added phosphate surface coating for enhanced stability during food preparation and consumption (Yang et al., 2014). Furthermore, previous work determined that no detectable quantity of stabilizing agents (i.e., phosphorus coating) were present with industrial grade samples (Yang et al., 2014).
The lack of surface enhancements and an IEP near the initial colon medium pH (∼6.4–6.8) demonstrates that industrial grade TiO2 would be unstable in this system, and therefore more prone to aggregation with other TiO2 particles and solids in the colon media. Alternatively, stable food grade TiO2 particles could also explain the lack of shift in microbial composition resulting from limited interaction between the negatively charged TiO2 particles and microbial surfaces.
Biochemical characterization
Particle aggregation may partially explain the limited microbial community shift during TiO2 exposure; however, it does not entirely address other observations such as with conductivity measurements (Table 1 and Fig. 5B). Comparison of only colon medium salts in deionized water with actual colon media (without bacteria and TiO2 particles) shows similar conductivities corresponding to 191 mM (11.4 ± 0.0 and 11.2 ± 0.1 mS/cm, respectively), suggesting that the initial conductivity results from salts, while variations likely indicate acidic metabolite production, or the lack there of, within the colon reactor (Table 1). SCFAs are weak acids, pKa near 4.8, meaning they exist as organic anions under these normal conditions (Nugent et al., 2001) and increases would indicate greater production based on the conductivity controls.
Industrial and food grade TiO2 particles were introduced into 95, 191, and 380 IS solutions using only the salts present in the colon medium (NaCl, CaCl2, K2HPO4, MgSO4, and FeSO4). Additionally, both particle types were added into fresh colon media consisting of carbohydrates and proteins (influent) at an equivalent IS of 191 mM for comparison to controls. Standard error of triplicate measurements is presented.
IS, ionic strengths.
At the same IS (191 mM media salts in DI water), industrial and food grade TiO2 particles resulted in slightly lower conductivity than the control of 11.4 ± 0.0 mS/cm (9.0 ± 0.2 and 9.4 ± 0.2 mS/cm, respectively). Within the actual colon media, the conductivities of the control (without particles and bacteria), industrial grade, and food grade are 11.2 ± 0.1, 10 ± 0.1, and 11 ± 0.5 mS/cm, respectively. These values reveal that both types of TiO2 are capable of altering the ionic content of the solution; however, this effect is reduced when particles are introduced into the colon media.
System conductivity (after passing through the colon) results suggest higher ionic content within the colon in the presence of industrial grade particles, as compared to baseline conditions and food grade TiO2 exposure (Fig. 5B). Greater conductivity (suggesting higher IS) is anticipated to result in increased aggregation of destabilized industrial grade particles with molecules in the colon medium (French et al., 2009). Derjaguin-Landau-Verwey-Overbeek theory supports the concept that electrical double layer compression occurs with increasing IS across IS ranges of 1–100 mM (Chowdhury et al., 2011). While electrostatic differences between the three testing conditions may be minimal, any increase or reduction in IS is still theoretically expected to alter the electrostatic forces influencing system interactions.
Lower conductivity observed with baseline conditions and the stable food grade particles may suggest the occurrence of a more comparable shift in microbial composition between the two as food grade particles and the microbial community both possess negative surface charges indicative of electrostatically repulsive conditions (Figs. 2B and 3C, respectively). Yet, this was not the case (Fig. 6). Rather, the major shift observed during baseline conditions from Proteobacteria (>99% reducing to 3%) to Firmicutes (<1% increasing to 81%) dominance while food grade conditions remain largely unchanged (13% reduction in Proteobacteria (99–86%) suggests that the phosphate coating applied to stabilize food grade particles may not prevent interactions with molecules in the complex colon medium.
Proteins in complex solutions have been shown to cause particles to destabilize and aggregate in conditions similar to this study (Cedervall et al., 2007b; French et al., 2009). Cationic binding between proteins and the stable, negatively charged food grade particles is one such possible mechanism that can occur within complex solutions of the human body (Nel et al., 2009).
Partial support of cationic binding can be observed from an idealized study, where the presence of anionic surface groups (e.g., inorganic phosphate) on the food grade particles resulted in greater absorption of the cationic dye, methylene blue, than industrial grade TiO2 at near neutral conditions (pH 6.6) (Yang et al., 2014). However, solutions containing proteins, carbohydrates, and other molecules with uneven charge distributions complicate the assumption that net positive molecules will attract net negative as negatively charged particles can bind to positive segments of the overall negatively charged molecule (Nel et al., 2009; Hamad-Schifferli, 2013).
Although both TiO2 particles are expected to be coated in part with protein and other small molecules of the solution (Cedervall et al., 2007a; Walkey et al., 2012; Hamad-Schifferli, 2013), system conductivity and microbial composition suggests that food grade's stabilizing surface enhancements (Weir et al., 2012; Yang et al., 2014) may be responsible for greater interaction with substrates in the complex media that limit the possibility for an extensive community shift to occur as observed during baseline conditions.
Buffering of colonic pH resulting from microbial degradation of substrates that appears during baseline conditions appears to be impaired when TiO2 particles are present within the system (Fig. 5A). All three testing conditions recorded reductions in pH between days 1 and 3 before deviations between baseline conditions and TiO2 exposures, and between the TiO2 exposures themselves occur. Natural decreases in pH within the human colon have been previously observed and associated with the fermentation of carbohydrates by the microbiota-producing SCFAs (Vernia et al., 1988).
Decreases in colonic pH are followed by the mineralization of the SCFAs by acetogens and methanogens in tandem with mucosal secretions of bicarbonate caused a pH recovery resulting in a higher intraluminal colonic pH (Nugent et al., 2001). This suggests that the trend of pH decrease and then recovery observed during baseline conditions is the response expected under these conditions. Delayed recoveries in pH during TiO2 exposures between days 4 and 5 for industrial grade exposures and food grade TiO2 exposure appearing to show no sign of a recovery indicate disturbances to the SCFA production and mineralization occur during TiO2 presence.
Deleterious, chronic conditions are associated with decreases of intraluminal colonic pH. Low or reduced colonic pH (2.2–4.7) has been linked with the onset of inflammatory diseases like ulcerative colitis and Crohn's disease (Fallingborg et al., 1989; Raimundo et al., 1992). These findings suggest that the introduction of either TiO2 type may lead to unhealthy colonic conditions over time, with food grade TiO2 exposures potentially having the slightly greater impact.
Phenotypic characterization
Phenotypic characterization—EPS S/P ratio, EPM, and relative hydrophobicity—of the human gut microbiota further captures the impacts of food grade and industrial grade TiO2 exposures. Biofilm is produced under certain conditions as a stress response to protect bacteria from hostile environments (Costerton et al., 1999). Bacteria within the biofilm are shielded from antimicrobial agents and cellular desiccation by a hydrated layer surrounding the microbial community (Sutherland, 2001). EPS plays a major role in microbial aggregation and biofilm production (Flemming and Trevors, 1989; Burdman et al., 2000; Tsuneda et al., 2003) with increased sugar content being linked to greater aggregation and biofilm development (Marcotte et al., 2007).
Both industrial grade exposure and baseline conditions indicate increasing sugar content within the EPS compared to protein; whereas, protein dominance during food grade TiO2 is suggested by the largely unchanged S/P ratio (Fig. 4C). Conditions during food grade exposures may prove more tolerable to the initial gut microbiota; however, as EPS production is also dependent on nutrient availability, it could also be that conditions are unfavorable for biofilm development (Sutherland, 2001). Generally, less microbial EPS production and biofilm formation is anticipated in the presence of food grade TiO2 particles compared to industrial grade particles and baseline conditions.
EPM trends suggest that similar microbial community aggregation and transport can be expected in the presence or absence of the TiO2 particles (Fig. 3C). Nanoparticles coating the bacterial surface have been suggested as one mechanism that may alter the EPM of the microbial community (Jiang et al., 2009). However, comparable trends in microbial EPM between all test conditions may suggest that particles have minimal direct contact with the microbial community. Further, many studies report that nanoparticles tend to develop coatings of protein or other organic substances, therefore the minor variations in microbiota EPM may simply result from responses to colonic conditions and not necessarily particles coating the microbial surface (Cedervall et al., 2007b; Walkey et al., 2012).
The relatively close ratio of bacteria to TiO2 particles within this study (∼109 bacteria to 3.33 × 10¹⁰ TiO2 per mL of colon medium), assuming well dispersed particles, also supports that direct interaction between particles and bacterial surfaces is unlikely. DLS and ZP values presented in Table 2 show aggregation is quite likely occurring between particles and colon medium as particle size increases during industrial grade exposure and food grade shows signs of steric hindrance (Chowdhury et al., 2013).
Zeta-potential values were calculated from EPM measurements using the Smoluchowski equation. Standard error of triplicate measurements is presented.
Relative hydrophobicity of the microbial community increased in each testing condition across the experimental week (Fig. 3B). Biofilm has been shown to line the mucosal surface and can indicate disruption of the normal colon mucous barrier (Probert and Gibson, 2002; Shah and Swlatlo, 2008). The influence of TiO2 in this process is considered negligible as similar trends exist for microbial hydrophobicity in the control and other experimental conditions (Fig. 3B).
Increases in hydrophobicity observed within this system can be attributed to lowered pH altering functional groups at the microbial surface. Additionally, solutions possessing a higher IS result in electrical double layer compression of the charged surface functional groups exposing a more hydrophobic surface (Yee et al., 2000; Abu-Lail et al., 2003). A prior study utilizing the same in vitro model colon similarly recorded increases in hydrophobicity in the presence of three model ENMs (CeO2, TiO2, and ZnO) during the 5-day experimental runs (Taylor et al., 2015). Microbial relative hydrophobicity of the current study indicate TiO2 exposures may result in comparable microbial deposition to baseline conditions, possibly along the mucosal surface within the actual human colon.
This study assessed impacts to the human gut microbiome within an in vitro model colon from the addition of two different types of titanium dioxide particles (industrial grade and food grade). TiO2 exposure resulted in microbial compositional, phenotypic, and biochemical changes within the colonic system. Notably, TiO2 exposure was linked to reduced transition of the microbial community from Proteobacteria abundance to Firmicutes, with this effect being more pronounced during food grade TiO2 exposures. Additionally, reduced system pH and conductivity were observed during food grade TiO2 exposure suggesting disruption of the anaerobic digestive process. Production of lactate rather than SCFAs can be attributed to this possibility suggesting the potential onset of deleterious conditions over continuous, long-term exposure.
Interestingly, while protein content in EPS suggests less biofilm production during food grade exposures, other phenotypic parameters (relative hydrophobicity and EPM) exhibit similar trends between conditions indicating similar microbial community deposition and transport whether or not TiO2 exposure has occurred.
These findings further suggest minimal direct interaction between the particles is occurring, but rather that TiO2 particles are interacting with molecules in the colon medium suggesting the development of the protein corona around the nanomaterials. Preferential interactions with proteins, and other molecules present within the medium would render the particles and molecules biologically unavailable to the microbial community. Lastly, these findings support the utilization of particles most likely present within the system of study to perform environmental fate, transport, and toxicity assessments. Within this system, food grade TiO2 exposure has been shown to result in different microbial compositions and biochemical responses than both industrial grade exposure and baseline conditions, indicating industrial grade may not accurately represent impacts of TiO2 particles within the human body.
Footnotes
Acknowledgments
This study has been supported by a combination of National Science Foundation (NSF), Environmental Protection Agency (EPA), and Department of Education funding. T.W. was supported by both the Department of Education (GAANN, Grant no. P200A130127) and the NSF IGERT: WaterSENSE–Water Social, Engineering, and Natural Sciences Engagement Program (Grant no. 1144635). C. Chen was supported by the NSF (Grant no. CBET-0954130). S. Walker's participation and the work more broadly was also funded through the UC-CEIN (University of California Center for Environmental Implications of Nanotechnology), which is supported by the NSF and the EPA under Cooperative Agreement Number DBI 0830117. We would like to thank Dr. Ian Marcus for his guidance with the revisions. Any opinions, findings, and conclusions or recommendations expressed in this article are those of the author(s) and do not necessarily reflect the views of the NSF or the EPA. This work has not been subjected to EPA review and no official endorsement should be inferred.
Author Disclosure Statement
No competing financial interests exist.