




Abstract
Abstract
Seawater from along the coast of the Korean Peninsula was analyzed for heavy metal concentrations three times over a period of 8 years. Samples showed that Cu concentrations increased during the testing period, whereas Cd, Cr, Pb, and Zn concentrations decreased between 2006 and 2009 before increasing or holding constant between 2009 and 2013. To understand this pattern, the annual amounts of heavy metal discharge from industrial sources were compared with the heavy metal concentrations in the seawater. In the case of Cu, Zn, and Cr, measured concentrations corresponded to discharged amounts. Furthermore, Cu and Zn concentrations exceeded acceptable standards established by the South Korean government in 70% and 67% of the sampling points in 2013, respectively. The effect of waste emission on the concentration of heavy metals in seawater was larger than that of industrial or nonindustrial complex areas. Principal component analysis results revealed that between 2006 and 2009, same heavy metals were formed as components, while 2013 produced different results, suggesting a change to the marine environment. Compared to adjacent countries, Korean ocean waters consisted of relatively higher Cu and Zn concentrations, which suggests a need for continuous monitoring of heavy metal concentrations.
Introduction
U
While Cu and Zn are essential micronutrients, they can have adverse effects when present in higher concentrations than physiologically necessary. Excessive levels of Cu have been reported to induce hypothyroidism and hypoadrenalism, while excessive levels of Zn can cause night blindness, dermatitis, and keratitis (Flemming and Trevors, 1989; Duruibe et al., 2007). Moreover, Pb, Cr, and Cd are not essential micronutrients; therefore, even a small quantity of these elements in an organism is harmful (Nriagu, 1988). The U.S. Environmental Protection Agency (EPA) has designated Cd and Cr as carcinogens. In addition, Pb (although less toxic) has been reported to cause malaise, lethargy, and a loss of appetite (Fewtrell et al., 2003; EPA, 2011).
South Korea's economic growth has been based on the growth of its manufacturing industry. In 2010, the manufacturing industry accounted for 30% of the country's gross domestic product (NAMD, 2015). This relatively high percentage, compared with those of other developed countries, implies the high discharge of heavy metals by the activity of manufacturing industry. Heavy metals are suspected of being discharged into the marine environment, through water and air systems.
The South Korean government announces the status of chemical compounds permitted in the country through the pollutant release and transfer register (PRTR, 2015) information system. The PRTR is a system used to collect and disseminate information about environmental releases (water and air systems) and transfers of chemical compounds from industries and other facilities. This system was made when the Korean government took part in the Organization for Economic Cooperation and Development (OECD) in 1996 and referred PRTR of OECD, Toxics Release Inventory of the United States, National Pollutant Release Inventory of Canada, and Pollution Inventory of the United Kingdom. In particular, the Korean PRTR is known to be reliable because it was conducted for all business units in Korea.
Many researchers have used PRTR in confirming numerous substances' contamination pattern changes. South Korea's PRTR is being used in predictions of contamination pattern (Kwon et al., 2014; Ji and Lee, 2016). Thus, this study, using PRTR, examined the relationship between the industrial complexes' contaminant emission amount and marine pollution level. The emission to water system and the emission to air system refer to the amount of heavy metal emission discharged from the wastewater treatment plant and from the air pollution control facility, respectively. The heavy metals generated from these facilities are eventually discharged into rivers or oceans and affect the marine environment. Then the discharge amounts of five metals (Cd, Cr, Cu, Pb, and Zn) were checked for 2006, 2009, and 2013 in PRTR.
For this study, heavy metal concentrations were measured three times over a course of 8 years (between 2006 and 2013) along the major coastlines of South Korea. The heavy metal contamination patterns in this period were compared with the heavy metal discharge amounts reported by manufacturing companies in South Korea. The results were then compared with those listed in the guidelines issued by the South Korean government and the contaminant concentrations of adjacent countries to determine the present heavy metal contamination status along the coasts of South Korea. Also, the difference of heavy metal concentration between industrial and nonindustrial complexes areas and the routes of heavy metal contamination from industrial complexes by principal component analysis (PCA) were investigated.
Materials and Methods
Chemicals
Standard solutions of Cd, Cr, Pb, Cu, and Zn (1,000 ppm) were purchased from Junsei (Tokyo, Japan). Working solutions were prepared daily. Ammonium pyrrolidine dithiocarbamate (APDC, 98% pure) was obtained from Fluka (Buchs, Switzerland) for the metal complexes. The extraction solution (methyl isobutyl ketone [MIBK] 99% pure) was acquired from Aldrich (Milwaukee, WI). Nitric acid (78% pure) was supplied by Merck (Darmstadt, Germany) and deionized water (18 MΩ) was used for all solutions.
Seawater sampling site
Nine major bays in South Korea were chosen as sampling points for this study. Twenty-eight samples were collected from 11 industrial areas and 17 nonindustrial areas. Sampling points within 1 km of diverse industrial businesses were considered industrial areas and sites greater than 1 km from industrial complexes were considered nonindustrial areas (Fig. 1). Samples were taken from June 18 to 21, 2006; July 19 to 23, 2009; and August 11 to 15, 2013. Two liters of seawater was drawn from a depth of 20 cm and stored in polyethylene (PE) bottles. To protect their integrity, after adding nitric acid, all samples were stored in a deep freezer (−20°C).
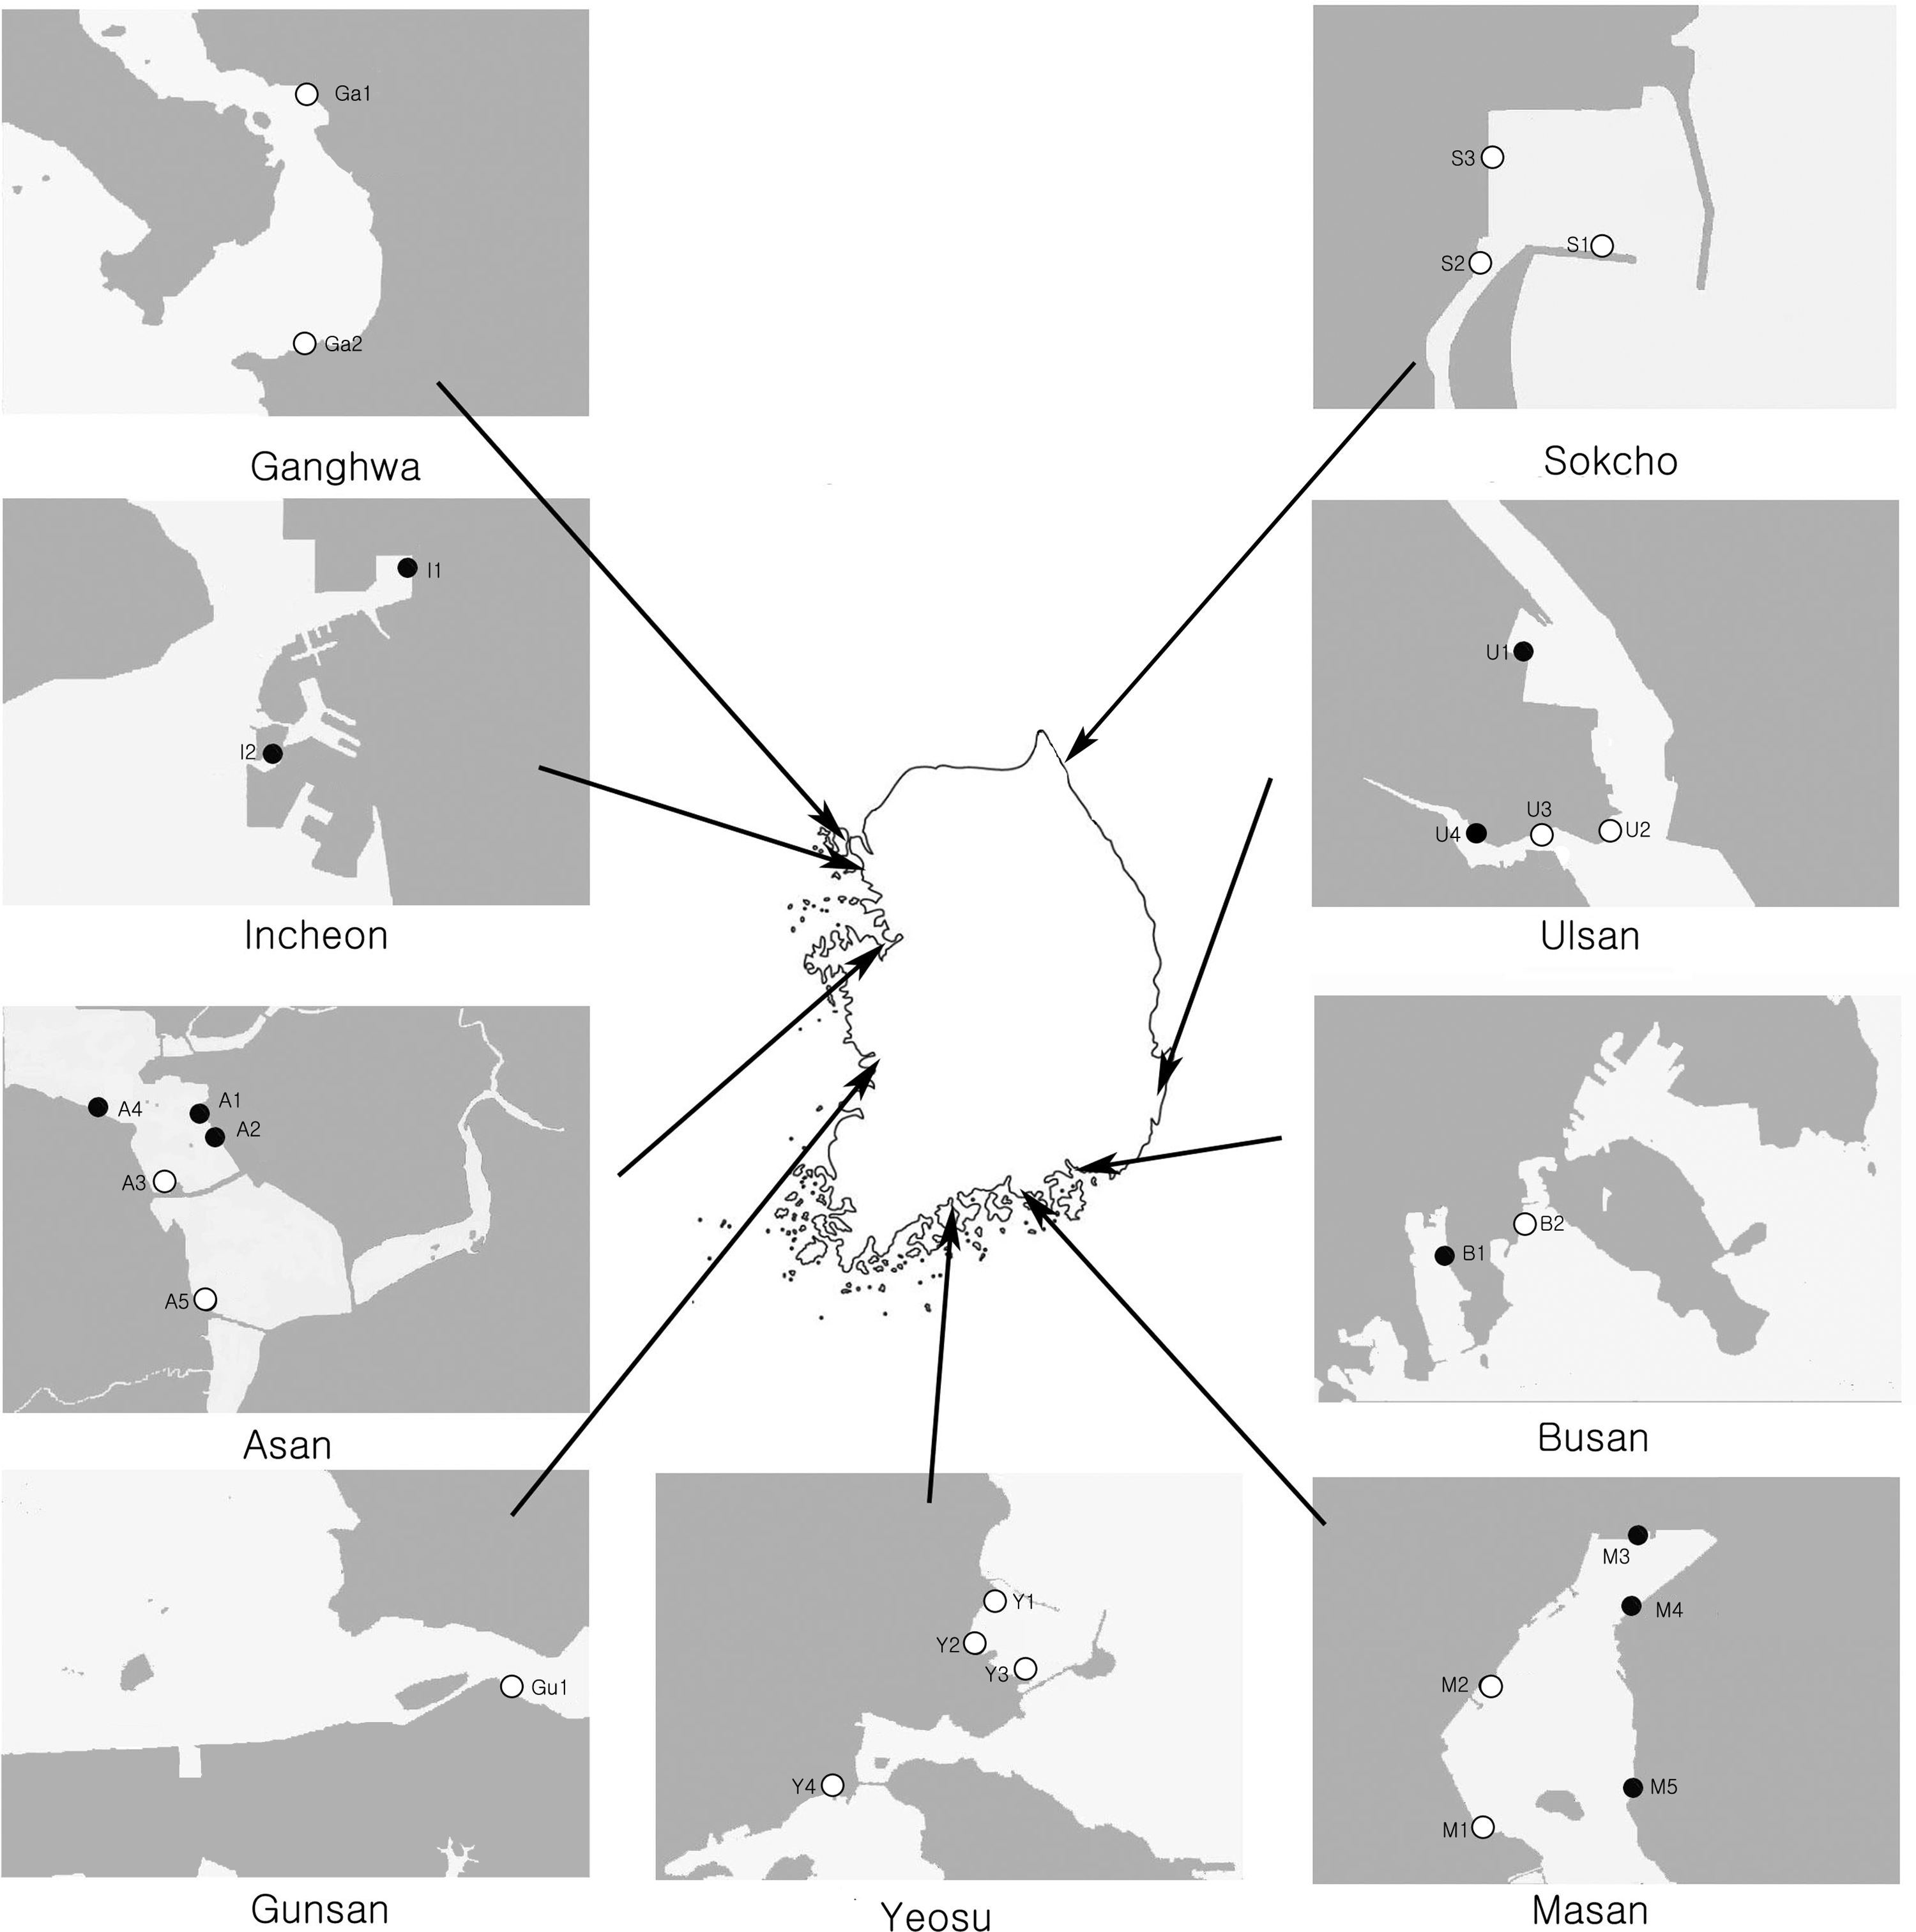
Location of sampling point in Korea coastline (□, nonindustrial area; ■, industrial area).
Extraction method
For the Cd, Cr, Cu, and Pb extractions, standard methods were used (APHA, AWWA, and WEF, 2005). All samples were filtered through a membrane filter (Whateman No. 7404-004). A 100 mL sample was collected and placed in a 100-mL volumetric flask. The pH was adjusted to 3.0 with HNO3 or NaOH. Subsequently, 1 mL of 1% APDC and 10 mL of MIBK were added to the sample, and the sample was sealed. The organic layer of the sample was collected separately after agitation for 10 min. This was then analyzed by graphite furnace atomic absorption spectrometry (GFAAS). Zinc was analyzed directly through flame atomic absorption spectroscopy (FAAS) without preconcentration.
Measurements on instruments
A Perkin–Elmer analyst 700 model GFAAS (Norwalk, CT), equipped with a Zeeman background correction, and an AS-800 autosampler were used for analyses. The atomization program of the GFAAS was performed according to the manufacturer's instructions (atomization temperature: 1,800°C for Pb, 1,650°C for Cd, 2,500°C for Cr, and 2,300°C for Cu). A EUTECH pH meter (Crescent, Singapore), equipped with a combined glass-calomel electrode, was used to adjust the pH. The Zn concentration was determined by FAAS using a Perkin–Elmer Analyst 700 model. The air-acetylene flame was adjusted according to the manufacturer's recommendations.
To analyze the recovery rates, 20 μg/L of Cu, 120 μg/L of Zn, 0.004 μg/L of Cd, 0.004 μg/L of Cr, and 0.004 μg/L of Pb were added to a standard sample and a real seawater sample through a matrix. Replicate analyses of the spiked matrices (n = 3) showed adequate precision with good recovery and repeatability. The mean recoveries (±RSD) of Cu, Zn, Cd, Cr, and Pb were 98.2% ± 2.5%, 101.2% ± 3.6%, 102.2% ± 4.3%, 95.2% ± 3.6%, and 98.2% ± 2.3%, respectively. Calibration curves were evaluated at 0.002, 0.004, 0.02, and 0.04 μg/L for Cd, Cr, and Pb; at 2.5, 5.0, 7.5, 12.5, and 20.0 μg/L for Cu; and at 10.0, 20.0, 40.0, 80.0, and 120.0 μg/L for Zn. All of the curves showed good linearity. The detection limit was calculated by regression analysis, as suggested by the EPA. The detection limits for Cu, Zn Cd, Cr, and Pb were 2.5, 8.2, 0.003, 0.003, and 0.002 μg/L, respectively.
Statistical analysis
To determine whether these patterns are statistically significant, the Friedman test (an alternative to the ANOVA test) and PCA were conducted. The Friedman test is a nonparametric statistical test developed by Milton Friedman. All data processing was conducted using SPSS 16.0 (SPSS, Inc., Chicago, IL), and Microsoft Excel 2013.
Results and Discussion
Average concentration of heavy metals in the country by year
Concentrations of the five heavy metals were analyzed over the course of 8 years (from 2006 to 2013), as shown in Fig. 2. While Cu concentrations continued to increase, Cd, Cr, and Zn concentrations decreased between 2006 and 2009 before increasing between 2009 and 2013. Pb concentrations decreased between 2006 and 2009, and then their levels were maintained until 2013.

Quartile displays for concentrations of Cu, Zn, Cd, Cr, and Pb in seawater from 10 Korean harbors between 2006 and 2013.
To determine whether these patterns are statistically significant, the Friedman test (an alternative to the ANOVA test) was conducted. The significance probabilities for Cd, Cr, Zn, and Cu were 0.002, 0.003, 0.005, and 0.131, respectively, indicating that the change in their averages was significant. Pb, however, had a 0.882 significance probability, indicating that the change in its average was statistically insignificant. Although this result may suggest that the change in the average Pb concentration is insignificant, this trend was more closely reviewed, given the fact that it shared a similar pattern with the other metals.
Comparison of total discharge amounts and dissolved concentrations in seawater
The South Korean government announces the status of chemical compounds permitted in the country through the PRTR (2015) information system.
These results were compared with the average concentrations that were investigated in study. The total discharge amounts of the five metals were 166,817 kg/year in 2006; 163,548 kg/year in 2009; and 307,143 kg/year in 2013. These numbers show a decrease between 2006 and 2009 and an increase between 2009 and 2013. These results were very similar to the annual patterns of the average concentrations of five metals. The measured concentrations were 37.64 μg/L in 2006, 36.58 μg/L in 2009, and 55.65 μg/L in 2013 (Fig. 3). The decreasing pattern in the average concentrations of metals (other than Cu) between 2006 and 2009 appears to have been caused by the economic recession, including the collapse of manufacturing companies such as the Lehman Brothers, in 2008.

Emissions
Discharge amounts were compared with the measurements of the five metals. The discharge patterns of Cu, Zn, and Cr corresponded to the measurements. However, in the cases of Pb and Cd, the discharge amount did not correspond to the average concentration. The Cd discharge amount was too small compared with that of the other four metals, which appears to be responsible for this observed mismatch. In the case of Pb, the decreasing pattern between 2006 and 2009 was the same. However, between 2009 and 2013, the measured concentration was constant (0.11 μg/L), despite the fact that the discharge amount increased (from 12 to 24 tons).
Study results indicate that the heavy metals discharged from industrial sources is the one of different pollution sources in the marine environment. In addition, the heavy metal discharge survey conducted by the South Korean government on all businesses can be assumed to be very effective for forecasting environmental contamination.
In 2011, the South Korean government established a standard for heavy metal concentrations in seawater. The allowable standard values for Cu, Pb, Zn, Cd, and Cr are 4.0, 7.6, 34, 19, and 200 μg/L, respectively (MOF, 2011). Concentrations measured in this study for Pb, Cd, and Cr were below the standard values, indicating that they have been controlled below the standard level according to the managements of the government. Concentrations for Cu and Zn, however, exceeded the standard values in some areas (Table 1).
The percentage of sampling points that had Cu concentrations above the standard value increased from 33% in 2006 to 67% in 2009, which further increased to 70% in 2013. The percentage of sampling points that had Zn concentrations above the standard value went from 39% in 2006 to 36% in 2009 to 68% in 2013. In the case of Cu, the number of sampling points that had concentrations above the standard value continued to increase; however, in the case of Zn, this number decreased between 2006 and 2009, only to increase between 2009 and 2013. The number of measurements exceeding the standard value showed the same pattern as the discharge, indicating that the discharged heavy metals affected specific areas.
Comparison with adjacent countries
Results of this study were compared with researches conducted in other countries (Table 2) that have similar environments to Korea: China, Taiwan, and Japan. The results were limited to studies conducted after 2003 to ensure that the sampling results are based on a similar timeline. For a better comparison, heavy metal concentrations in other countries were calculated as average concentrations. The concentrations of Pb, Cd, and Cr were lower in Korea than the averages found in the literature.
NA, not available; ND, not detected.
In contrast, the Cu concentration (9.39 μg/L) was 3.4 times higher in Korea than the average concentration in the other countries (2.41 μg/L). This result can be attributed to the unique industrial structure of Korea, in which the electrical and electronics industry is well developed, with a large ship-building industry. The mean Zn concentration of Korea (45.59 μg/L) was also higher than the average value reported in the literature (20.00 μg/L). Taiwan has an average concentration of 42.66 μg/L (Zn), which is likely due to a combination of the presence of many vehicles within a small land area, construction-related issues, and industrial wastewater. South Korea's Cr and Cd concentrations were similar to or slightly lower than those of the other studied areas, and its Pb concentration was clearly lower than the values in the other studied areas.
Relationship between heavy metal concentrations and industrial complex
Sampling points within 1 km of industrial complexes were considered industrial areas, while those greater than 1 km from industrial complexes were considered nonindustrial complex areas. Heavy metal concentrations were higher in areas closer to industrial complexes in both 2006 and 2009 (Fig. 4). However, in 2013, some metal concentrations such as Pb, Cu, and Zn in nonindustrial complex areas were higher than those in industrial complex areas. This result implies that heavy metals in seawater have indefinite correlation.

Distributions of the heavy metal concentrations according to area type in 2006
There were various types of industry in industrial complex area. The highest amount of Cd was used in battery-related businesses, metal manufactures (Fe, Cu, Pb, Zn, etc.), and nonmetal mineral manufactures (e.g., glass). These three businesses accounted for more than 90% of the amount of Cd used (Lee, 2011). Cr was used mostly in cement, car (exhaust gas), electroplating, and leather industries (KFDA, 2010). Pb was mostly used in lead storage batteries, PVC stabilizers, solders, copper alloy cements, and car-related industries (Lee, 2011). Cu was used in electric/electronic devices, construction, transportation equipment, industrial machinery, and other consumer goods industries (ICSG, 2013). Zn was mostly used in construction, transport, machinery/equipment, consumer durables, and infrastructure industries (Korea Zinc, 2000). Conclusively, the uncertain relationship between heavy metals in seawater and industrial complex might be explained because heavy metals discharged from the industries inside industrial complex areas are controlled according to the strict regulation.
Other than the above-mentioned contamination sources, the traffic pollution was also another source of contamination and it affected both industrial complexes and nonindustrial complexes. Because of Korea's ban on the use of tetraethyl lead in 1996, which is used to achieve a high octane number, Pb contamination due to vehicle fuel was not significant. On the contrary, the Zn concentration was highest near highways in Korea due to tire wear, braking, and exhaust gas (Lee et al., 2010). Considering that Korea has 20 million registered vehicles, contamination caused by traffic pollution should also be routinely monitored.
Possibility of heavy metal contamination by other source
Heavy metal contamination in the marine environment is significantly affected by heavy metal contaminants, which are discharged from industrial complexes through water and air routes. Diverse relationships between the sampling point location and characteristics of industrial complexes will determine which route has more influence. In this study, causes for the increase and decrease in heavy metal concentrations were examined using the results of “the emission of contaminant to the water and air system,” which were surveyed in 2006 and 2013 (PRTR, 2015).
In case of Cu, Zn, and Cr, the change in the emission to air was significantly similar to that in metal concentrations in seawater (Table 3), implying that heavy metals in air are affected on those in seawater near coastal areas. The survey of the Baltic Marine Environment Protection Commission reported the effects of heavy metals generated from industrial complexes on the marine environment via air. The decrease in heavy metal contamination in air influenced the decrease in heavy metal contamination in the Baltic Sea (HELCOM, 2004).
PRTR, pollutant release and transfer register.
The lead concentration in seawater decreased from 2006 to 2009, while it remained unchanged between 2009 and 2013. However, the measured lead concentration between 2009 and 2013 was not consistent with the pattern of the lead discharge into water and air in the same period, and this inconsistency needs to be closely examined. In the case of Cd, the measured concentration and discharge amount were not consistent with each other, suggesting that, compared with other metals, the Cd discharge amount was small; this result was deemed as not accurately reflecting the concentration change.
PCA was conducted on the results of the 2006, 2009, and 2013 tests, and the two results (2006 and 2009) showed similar trends (Fig. 5a, b). After a varimax orthogonal rotation, two components were extracted, which were related to the sources of the elements in the studied samples. The first component with a 30.59% variance comprised Cd, Cu, and Pb in 2009 (Fig. 5b). This association strongly suggests that these variables have a similar source. These metals are often used in nonmetal manufacturing industries, and are apparently affected by those industries because high concentrations were found in sampling points close to nonmetal manufacturing industries (Lee, 2011). The second component (PC2) contributed Zn and Cr at a 27.53% total variance (Fig. 5b). This component was considered to be arisen from a different source, such as traffic contaminants. Lee et al. (2010) mentioned these metals as traffic contaminants, and the Korean Contamination Status also mentioned contamination by these metals (Lee et al., 2010; Lee and Hieu, 2011).

Principle component analysis of heavy metals in 2006
Two components were extracted in 2013, which were related to the sources of the elements in the studied samples. The first component with a 37.60% variance comprised Zn, Cu, and Pb and second component with 23.50% Cr and Cd in 2013 (Fig. 5c). In the case of Zn, Cu, and Pb, measured as the first components, two reasons were found. The first reason was presumably because these three metals increased their emissions compared with other metals due to 2013 economic recovery and the like (Fig. 3). The second reason was that these metals were used as the major components of alternative antifoulants in the marine environment. An antifouling agent will prevent the attachment of fouling organisms, such as barnacles, weeds, and slime, on the surface of ship—a fouled hull can cause serious problems such as reduction of ship speed. Before 2008, TBT was used as a major antifoulant, but due to its strong toxicity, TBT was stopped being used (Lee et al., 2011). Thus, the relatively less toxicant Zn, Cu, and Pb were begun to be used as alternative antifoulants (Chambers et al., 2006; Hansen et al., 2014). These metals thus presumably influenced the 2013 metal emissions.
Conclusions
Heavy metal contamination patterns along the coasts of South Korea's major bays were analyzed over the course of 8 years, spanning from 2006 to 2013. These results show that heavy metal contamination patterns along the country's coastlines were very similar to the amounts of contaminants discharged from adjacent industrial complexes. It seems that the heavy metals discharged from industrial sources into water and soil systems affect Korean coastlines. The standard concentration for Cu in seawater is 4.0 μg/L, and the percentage of sampling points that had Cu concentrations above the permissible value increased from 33% in 2006 to 67% in 2009 to 70% in 2013. The standard concentration for Zn is 34 μg/L, and the percentage of sampling points that had Zn concentrations above the allowable value went from 39% in 2006 to 36% in 2009 to 68% in 2013. There were many sampling points with concentrations above the standard value in 2013, which was caused by an increase in the amount of contaminants discharged from industrial sources. The concentrations of other metals (Pb, Cd, and Cr) were lower than the standard values. The results of this study show that the two metals in excess of their permissible values (Cu and Zn) should be more thoroughly controlled to protect coastal environments. Pollution routes were examined by categorization into water and air systems. Based on the emitted amounts and metal concentration in seawater, the contamination of Cu, Zn, and Cr in seawater was caused by heavy metals emitted to from air. Through PCA, the increase of Cu, Zn, and Pb concentration in coastal area could be resulted from the excessive use of alternative antifouling agents after 2008.
Footnotes
Author Disclosure Statement
No competing financial interests exist.