
Abstract
Abstract
A new adsorbing material for crystal violet (CV) and methylene blue (MB) dye removal, fly ash and bentonite-supported microscale zero-valent iron (FB-mZVI), was synthesized by using iron-ore tailings (IOT) as the iron source. Palm kernel shells (PKSs) were used to reduce the iron oxide of the IOT to Feo. A statistical orthogonal method was used to evaluate the factors determining the adsorbent synthesis. It was found that the important factors were the mass ratio of the fly ash, bentonite, IOT, and PKSs as well as the synthesis time, temperature, and heating rate. Optimum mass ratio of the fly ash, bentonite, PKSs, and IOT was found to be 2:2:1:1, and optimum synthesis temperature, time, and heating rate were found to be 800°C, 10 min, and 10°C/min, respectively. An FB-mZVI adsorbent was used to remove the CV and MB from aqueous solutions. Removal efficiency for CV was much higher than that for MB. UV, XRD, and FTIR analyses revealed that the adsorption mechanisms for removal of CV were different from those for MB. Adsorption process was well described by the pseudo-second-order kinetic model, and Langmuir isotherm model better represented the adsorption isotherm data.
Introduction
E
Many physical and chemical methods have been reported for the removal of CV and MB from water, such as reverse osmosis, coagulation, precipitation, and adsorption (Zhao et al., 2015; Köhler et al., 2016; Lonappan et al., 2016; Schwahn et al., 2016). Of all these methods, adsorption is regarded as one of the most effective and attractive processes because of its high removal efficiency, cost effectiveness, ease of operation, and lack of chemical sludge production (Cottet et al., 2014). Many new adsorbents have been proposed for CV and MB removal from water, such as biochar microparticles derived from different waste materials (Lonappan et al., 2016), mansonia wood sawdust (Ofomaja, 2008), metal-organic frameworks based on copper-benzenetricarboxylate (Lin et al., 2014), and functionalized nanomaterials (Lu et al., 2015; Dariani et al., 2016). Recently, iron-based materials have proved to be effective for removing toxic dyes from aqueous solutions (Zhang et al., 2010; Wang et al., 2012). Nanoscale zero-valent iron (nZVI) removes toxic dyes effectively due to its unique redox potential, high surface area, and large reaction sites (Li et al., 2006; Kerkez et al., 2014). However, the application of nZVI in actual water treatment is subject to certain restrictions, because it tends to agglomerate and is easily oxidized (Liu et al., 2007). Therefore, many studies have been initiated to search for different matrices to overcome the iron particle aggregation, such as adding iron on montmorillonite for the adsorption and degradation of toxic cationic dyes (Zermane et al., 2010; Cottet et al., 2014; Guz et al., 2014) and adding iron nanoparticles onto three-dimensional graphene to degrade azo dyes (Wang et al., 2015).
In this work, a fly ash and bentonite-supported microscale zero-valent iron (FB-mZVI) adsorbent was prepared by using direct reduction iron technology with iron-ore tailings (IOT) in which the iron is an iron oxide. Palm kernel shells (PKSs) were used as the reductant, and fly ash and bentonite were used as supports for mZVI to increase the adsorption performance of the adsorbent for CV and MB from aqueous solutions. The statistical orthogonal method was used to evaluate the factors determining the synthesis of the FB-mZVI. Likewise, the application of FB-mZVI to remove CV and MB was also studied. The adsorbent was prepared in the form of cylindrical-shaped pellets, which were the materials used in the adsorption studies.
Materials and Methods
Materials and chemicals
Iron-ore tailings (Wu Han Province, China), palm kernel shells (Carbon 50.2%; Oxygen 40.8%; Nitrogen 0.3%; Hydrogen 6.2%), fly ash, and bentonite were dried in an oven for 24 h at 105°C. The chemical compositions of the tailings, fly ash, and bentonite are shown in Table 1. Major minerals in the tailings are hematite (Fe2O3), goethite (FeOOH), and quartz (SiO2). Analytical-grade CV (C25H30N3, Mw: 407.98 g/mol, λmax = 582 nm) and MB (C16H18N3S, Mw: 319.86 g/mol, λmax = 664 nm) were obtained from Beijing Chemical Reagents Company. All chemical reagents used in the study were of analytical grade, and all the experiments were done in triplicate.
Preparation of FB-mZVI adsorbents
For the direct reduction of the iron oxide in the tailings to Fe0, PKSs were used as the reductant. Iron oxide in IOT was mainly in the form of Fe2O3; therefore, the reduction yield (η) was calculated based on how much Fe2O3 was reduced to Fe0. To assess the effect of the reduction temperature (300–900°C), reaction time (5–150 min), ratio of PKSs to the iron ore (0.5:1–2.0:1), and heating rate (2–10°C/min) on the reduction yield, batch experiments were conducted. The reduction yield (η) was calculated as follows:
where m1 (mg) is the mass of the zero-valent iron generated in the reaction, m2 (mg) is the mass of Fe2O3 in the IOT, and M1 and M2 are the molecular masses of the zero-valent iron and Fe2O3, respectively.
The orthogonal experiments were designed to examine the effects of various factors on the reduction reaction and to optimize the conditions to prepare the FB-mZVI adsorbent. The experimental design was developed by using the Orthogonal Design Assistant, where the ratios of the fly ash to bentonite, IOT to PKSs, reaction time, reaction temperature, and heating rate were chosen as variables. An OA9 (33) matrix, which is an orthogonal array of three factors and three levels, was employed to assign the considered factors and levels, as shown in Table 2.
Ratio (fly ash: bentonite: palm kernel shell: iron-ore tailing).
After drying, the fly ash, bentonite, IOT, and PKSs were sieved through a 500 mesh screen (28 μm) and mixed evenly in mass proportions. With some water, they were compressed into cylindrical-shaped pellets, 5 mm diameter and 20 mm long. The pellets were first dried in air and then in an electro thermostatic blast oven for 24 h, followed by calcination in an atmosphere-controlled sintering furnace at a given heating rate, temperature, and time under a nitrogen atmosphere.
Adsorption experiments
The influence of the adsorbent dosage (0.2, 0.4, 0.6, 0.8, and 1 g), reaction time (1, 3, 5, 7, 9, 21, 24, 28, 30, 33, 45, and 48 h), pH (2, 4, 6, 8, and 10), and initial concentration (100, 200, 400, 600, and 800 mg/L) on the removal of CV and MB by FB-mZVI adsorbents was measured as follows: Aqueous solutions (100 mL) were used in 250 mL Erlenmeyer flasks.; then, they were shaken in an orbital shaker at a constant speed of 120 rpm and 50°C. Aqueous solution samples (0.2 mL) were withdrawn from the flasks at 1, 4, 5, 7, 9, 21, 24, 28, 30, 33, 45, and 48 h to determine the concentrations of the CV and MB. This was done by using a UV spectrophotometer at a wavelength of 582 nm for CV and 664 nm for MB. The desired pH of the suspensions was adjusted with 0.1 M NaOH or HCl aqueous solutions. The percentage removal efficiency (R) and adsorption capacity (Qt) were calculated as follows:
where C0 (mg/L) is the initial concentration, Ct (mg/L) is the equilibrium concentration, V is the volume of the aqueous solution (L), and m is the adsorbent mass (g).
Analytical methods
Chemical compositions of the IOT, fly ash, and bentonite were measured by using XRF (Delta-50, Innov-X, Olympus). Zero-valent iron was detected with potassium dichromate titration after decomposing the sample with ferric chloride (Tao and Ling, 2009; Jun and Zheng, 2009). The surface areas and textures were investigated by using the BET method (ST-08A; Beijing analysis instrument factory) and a Joel JSM-6610 LV scanning electron microscope. XRD (08 Advance Davinci, Bruker, λCu = 1.5406 Å) was used to determine the adsorbent chemical components both before and after adsorption. FTIR characterization was performed by using an FTIR spectrophotometer (Tensor 27, Bruker). The chemical oxygen demand (COD) values were measured by using the rapid digestion spectrophotometry method with potassium dichromate and a microwave digestion system (XJ-III; Shaoguan Taihong Medical Instrument Co., Ltd.). The total organic carbon (TOC) content was detected by using a TOC survey analyzer (Shimadzu TOC-4100).
Results and Discussion
Factors affecting direct reduction of iron oxide in the tailings
Effect of temperature
Direct reduction of iron oxide to metallic iron can be achieved by using gas or solid reductants to carry out the reduction reaction at a certain temperature (Man et al., 2014; Luo et al., 2011). In this study, PKSs were used as the reductant. With the ratio of the PKSs (1:1), reaction time (30 min), and heating rate (8°C/min), the reduction yield as a function of temperature is presented in Fig. 1a. As noted, the reduction yield slowly increased with the temperature to a maximum of 700°C; then, it sharply increased, and a plateau was reached above 800°C. At this temperature, the reduction yield was 42%. In the iron-ore sample, iron mainly existed as hematite (Fe2O3) and goethite (FeOOH) together with quartz (SiO2). At temperatures below 700°C, the reduction yield was less than 10%, which can be attributed to the conversion of goethite into hematite after being heated at a moderate temperature (Rashid et al., 2014). When the reaction temperature was 700°C, magnetite was found in the powder samples from the XRD analysis in Fig. 2. It can be concluded that the hematite started to be reduced to magnetite at 700°C. The direct reduction of iron oxide in the tailings is a highly endothermic reaction process (Rashid et al., 2014). The heat required for this reaction is easily achieved at higher temperatures (Mashhadi et al., 2008; Kumar et al., 2010), leading to increased reduction yields with increasing temperatures. At 800°C, hematite and magnetite started to reduce to zero-valent iron (2θ = 44.9) (El-Hussiny and Shalabi, 2011; Shi et al., 2011). Accordingly, the reduction yield increased to 42%. At 900°C, the reduction yield increased to 44%, which was slightly more than the reduction yield at 800°C. Therefore, 800°C was chosen as the optimum temperature in the study to achieve high efficiency and low cost.

Effect of four factors on reduction yield,
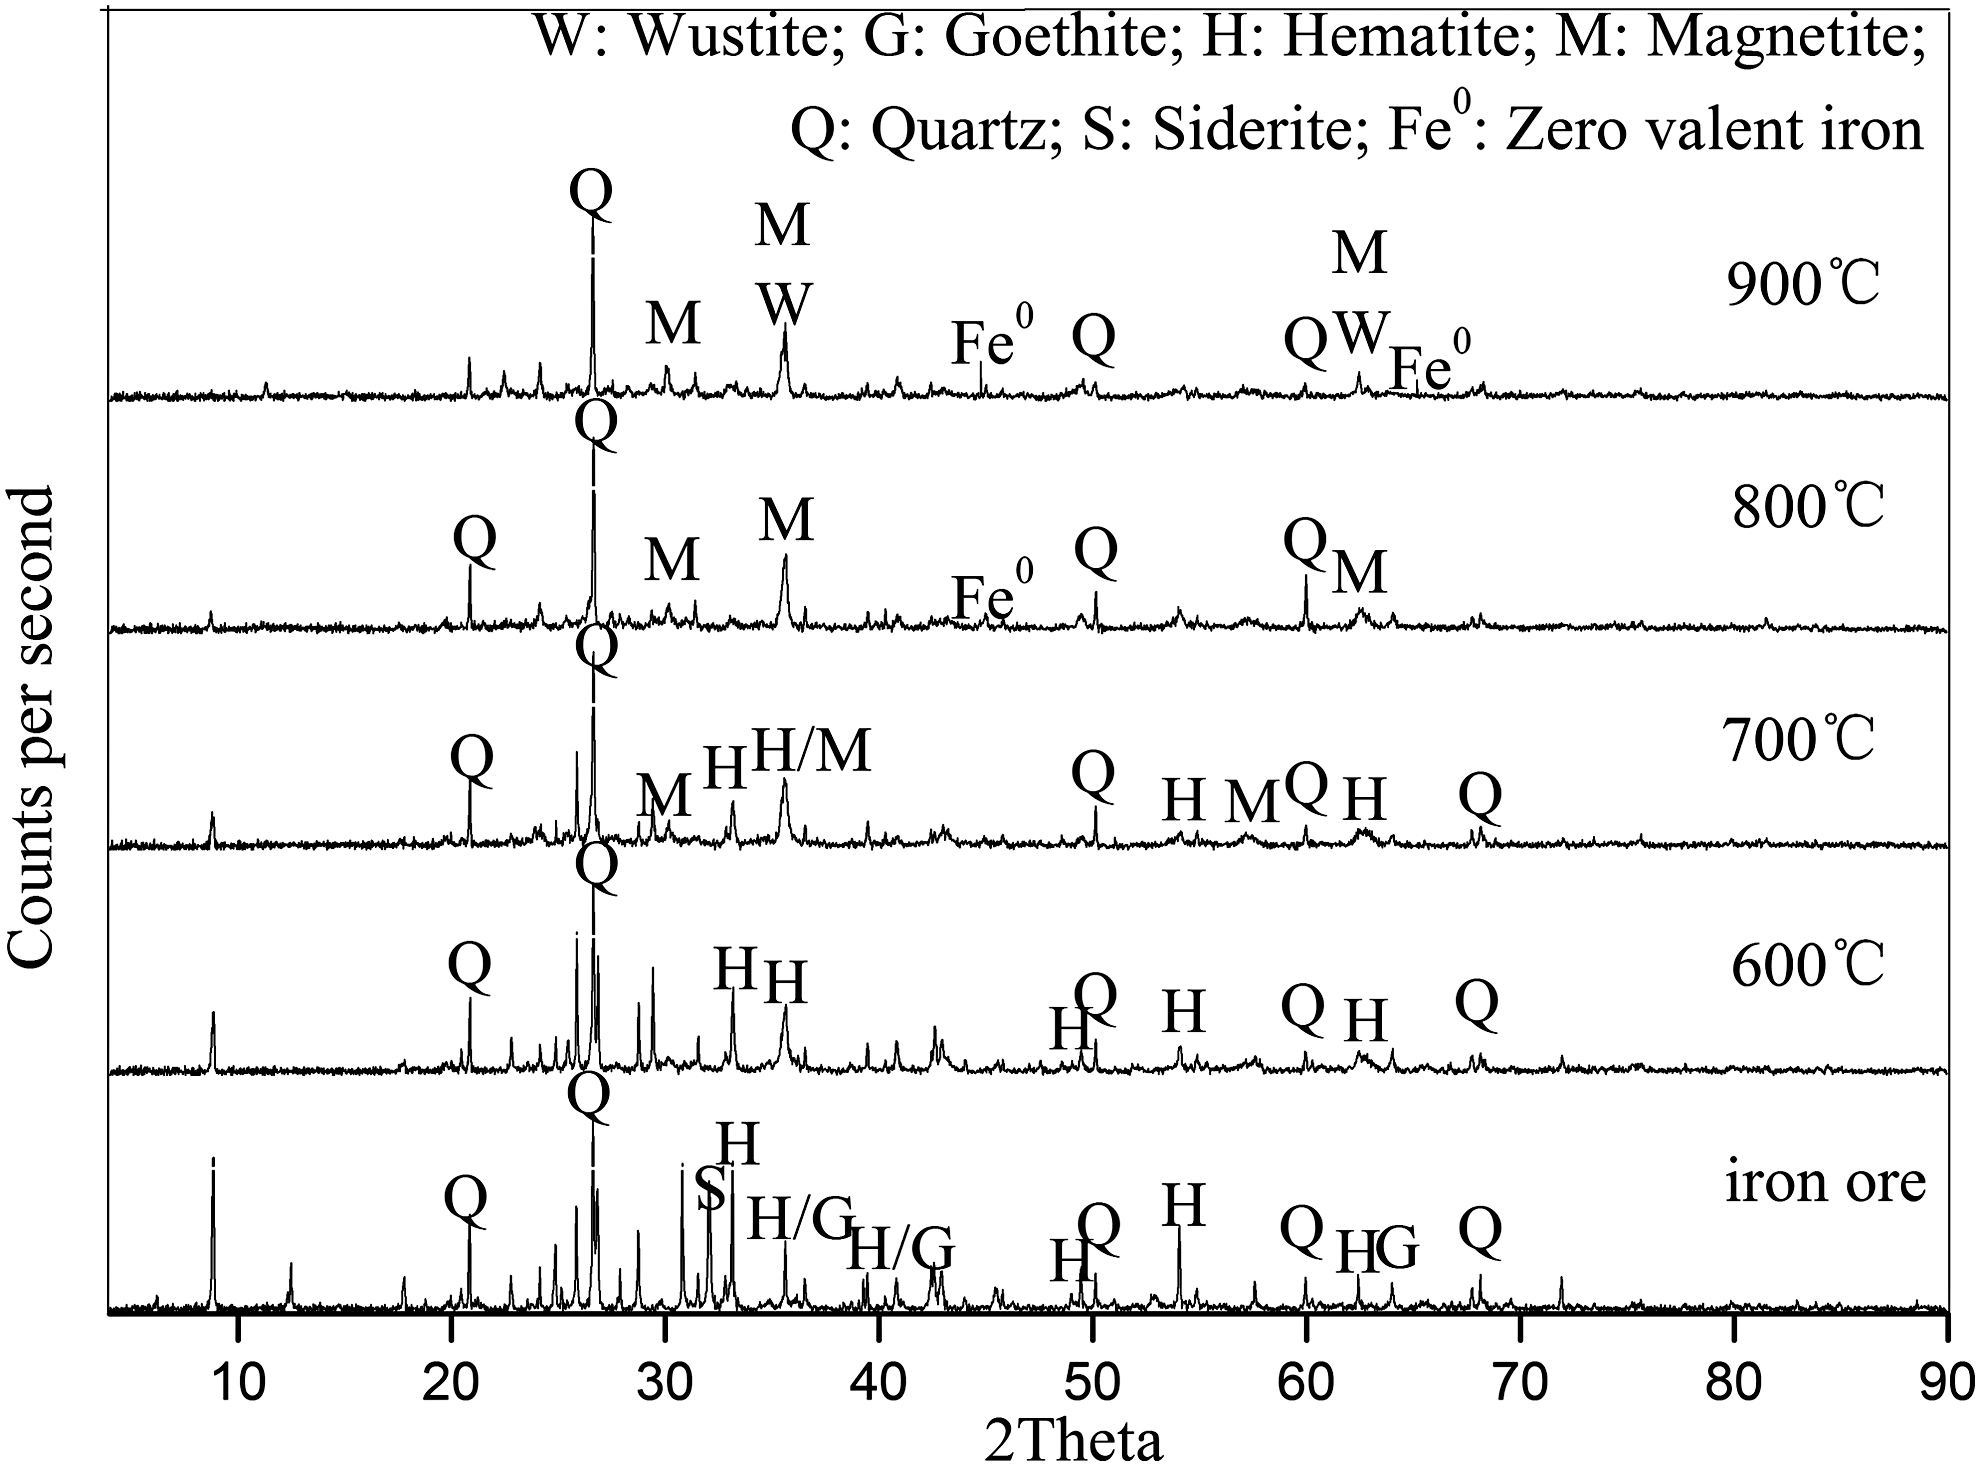
XRD analysis of samples at different temperatures.
Effect of the reaction time
To assess the effect of the reaction time on the reduction yield at 800°C, batch experiments were conducted at 5, 10, 20, 30, 60, 90, 120, and 150 min with a heating rate of 8°C/min. Figure 1b presents the reduction yields as a function of time when the mass ratio of the PKSs and tailings was 1:1. The reduction yield increased with time until a plateau was reached after 30 min, indicating that the reduction of the iron oxide was complete at the reaction time of 30 min. The reduction yield sharply increased during the first 30 min due to the rapid formation of CO and hydrogen from the organic matter (cellulose, hemicellulose, and lignin) in the PKSs due to biomass pyrolysis reactions. CO and hydrogen were the main reducing agents in the reaction, as reported in a previous study (Guo et al., 2016).
Effect of reductant dosage
At a temperature of 800°C and a heating rate of 8°C/min, different mass ratios of the PKSs and tailings (0.5:1, 0.75:1, 1:1, 1.25:1, 1.5:1, 2.0:1) were used to evaluate their effect on the iron reduction yield. This is shown in Fig. 1c for a constant reaction time (30 min). The reduction yield increased with the mass ratio until a maximum (43%) was obtained at the mass ratio of 1:1, after which the reduction yield tended to decrease. Below a ratio of 1:1, the increase in the PKS content promoted the reduction reaction due to the higher amount of the reducing gases, carbon and hydrogen, generating from the PKSs for reducing the iron oxides in the tailings. Above a mass ratio of 1:1, the decrease in reduction yield was attributed to an excessive amount of organic matter (cellulose, hemicellulose, and lignin) in the PKSs, causing the conversion of ferrite into cementite, as shown in Fig. 3 (Mohsenzadeh and Mazinani, 2016). Accordingly, the optimum mass ratio of the PKSs and tailings was 1:1.

XRD analysis of samples at different ratios of palm kernel shells and iron-ore tailings.
Effect of heating rate
Figure 1d shows the effect of the heating rate on the iron reduction yield when the temperature was 800°C, the reaction time was 30 min, and the mass ratio of the PKSs and tailings was 1:1. It was noted that the reduction yield monotonically increased with the heating rate increasing to 8°C/min, and then, the reduction yield remained constant. This is similar to what occurred to the yield with the temperature and reaction time. It may be deduced that the carbonyl groups in the PKSs quickly turned to CO and H2. In addition, this result indicated that the iron reduction reaction occurred very quickly. Therefore, the heating rate of 10°C/min was chosen as the optimum heating rate for the experiments. Under these conditions, the iron reduction yield reached 47%.
Orthogonal analyses
Based on results mentioned earlier for direct reduction of iron oxide in tailings by PKSs, a three-factor, three-level orthogonal experiment was applied with factor values (temperature, reaction time, and mass ratio of the precursors) to optimize the preparation of the FB-mZVI adsorbent (Shi et al., 2011). The influence of these factors on the removal efficiency of CV from aqueous solutions by using FB-mZVI is presented in Table 3.
Ratio (fly ash: bentonite: palm kernel shell: iron ore tailing).
Preparation conditions of FB-mZVI were established by using Orthogonal Design Assistant software (El Hajjouji et al., 2008) with range analysis and variance analysis (Table 3). The higher the range and the F-value were, the more significant the factor was and the greater the influence of the factor was on the FB-mZVI preparation (Shi et al., 2011). Comparing the range and F-values in Table 4, the factors influencing the FB-mZVI adsorbent preparation were as follows: reaction time > temperature > ratio. This means that the reaction time had the largest influence on the FB-mZVI preparation. The K values from K1 to K3 represented each level of each factor, from the lowest to the highest level. The higher the K value was, the higher the removal efficiency and the better the level of the factor was (Shi et al., 2011). Taking temperature as an example, the highest K was K1, which represented the level at 800°C as the optimum temperature. The change in the K values indicated that CV removal decreased with temperature and time. Meanwhile, the highest K value for the factor of the mass ratio was K2, which indicated the level of 2:2:1:1 as the optimum ratio. Accordingly, the optimal conditions for preparing FB-mZVI to remove CV from aqueous solutions were 800°C, 10 min for the preparation time, and 2:2:1:1 for the mass ratio (fly ash: bentonite: palm kernel shell: iron-ore tailing).
Ratio (fly ash: bentonite: palm kernel shell: iron-ore tailing).
Adsorbent characterization
Texture of the FB-mZVI adsorbent is presented in the SEM photomicrograph shown in Fig. 4. It was noted that the adsorbent was highly porous, where the pores were generated by volatile CO and hydrogen formed from the organic matter (cellulose, hemicellulose, and lignin) in the PKSs through a biomass pyrolysis chemical reaction (Frost et al., 2010). In the figure, the bright spots represent Fe0 particles. It was noted that they were dispersed throughout the matrix and attached to it. The matrix was composed of fly ash and bentonite, which was used to support the Fe0. The nitrogen adsorption-desorption isotherm is shown in Fig. 5. The BET surface area, pore volume, and pore size of the FB-mZVI adsorbent were 31.2 m2/g, 0.02955 cm3/g, and 1.701 nm, respectively.

SEM images of the FB-mZVI adsorbent

Nitrogen adsorption-desorption isotherm of the FB-mZVI adsorbent.
CV and MB removal from aqueous solutions
Effect of initial adsorbent dosage
Effect of initial adsorbent dosage on the removal of CV and MB was investigated; the results are shown in Fig. 6. As seen in Fig. 6, the CV and MB removal efficiency increased as the adsorbent dosage increased. This was attributed to the increase in the zero-valent iron content and surface area of the FB-mZVI adsorbents. Above the adsorbent dosage of 0.6 g, the CV and MB removal efficiency gradually leveled off. When the adsorption dosage was 0.6 g, the MB removal efficiency reached 45.1%, whereas that for CV was much higher at 94.5%. Therefore, 0.6 g was chosen as the optimal dosage considering the removal efficiency and the cost effectiveness.
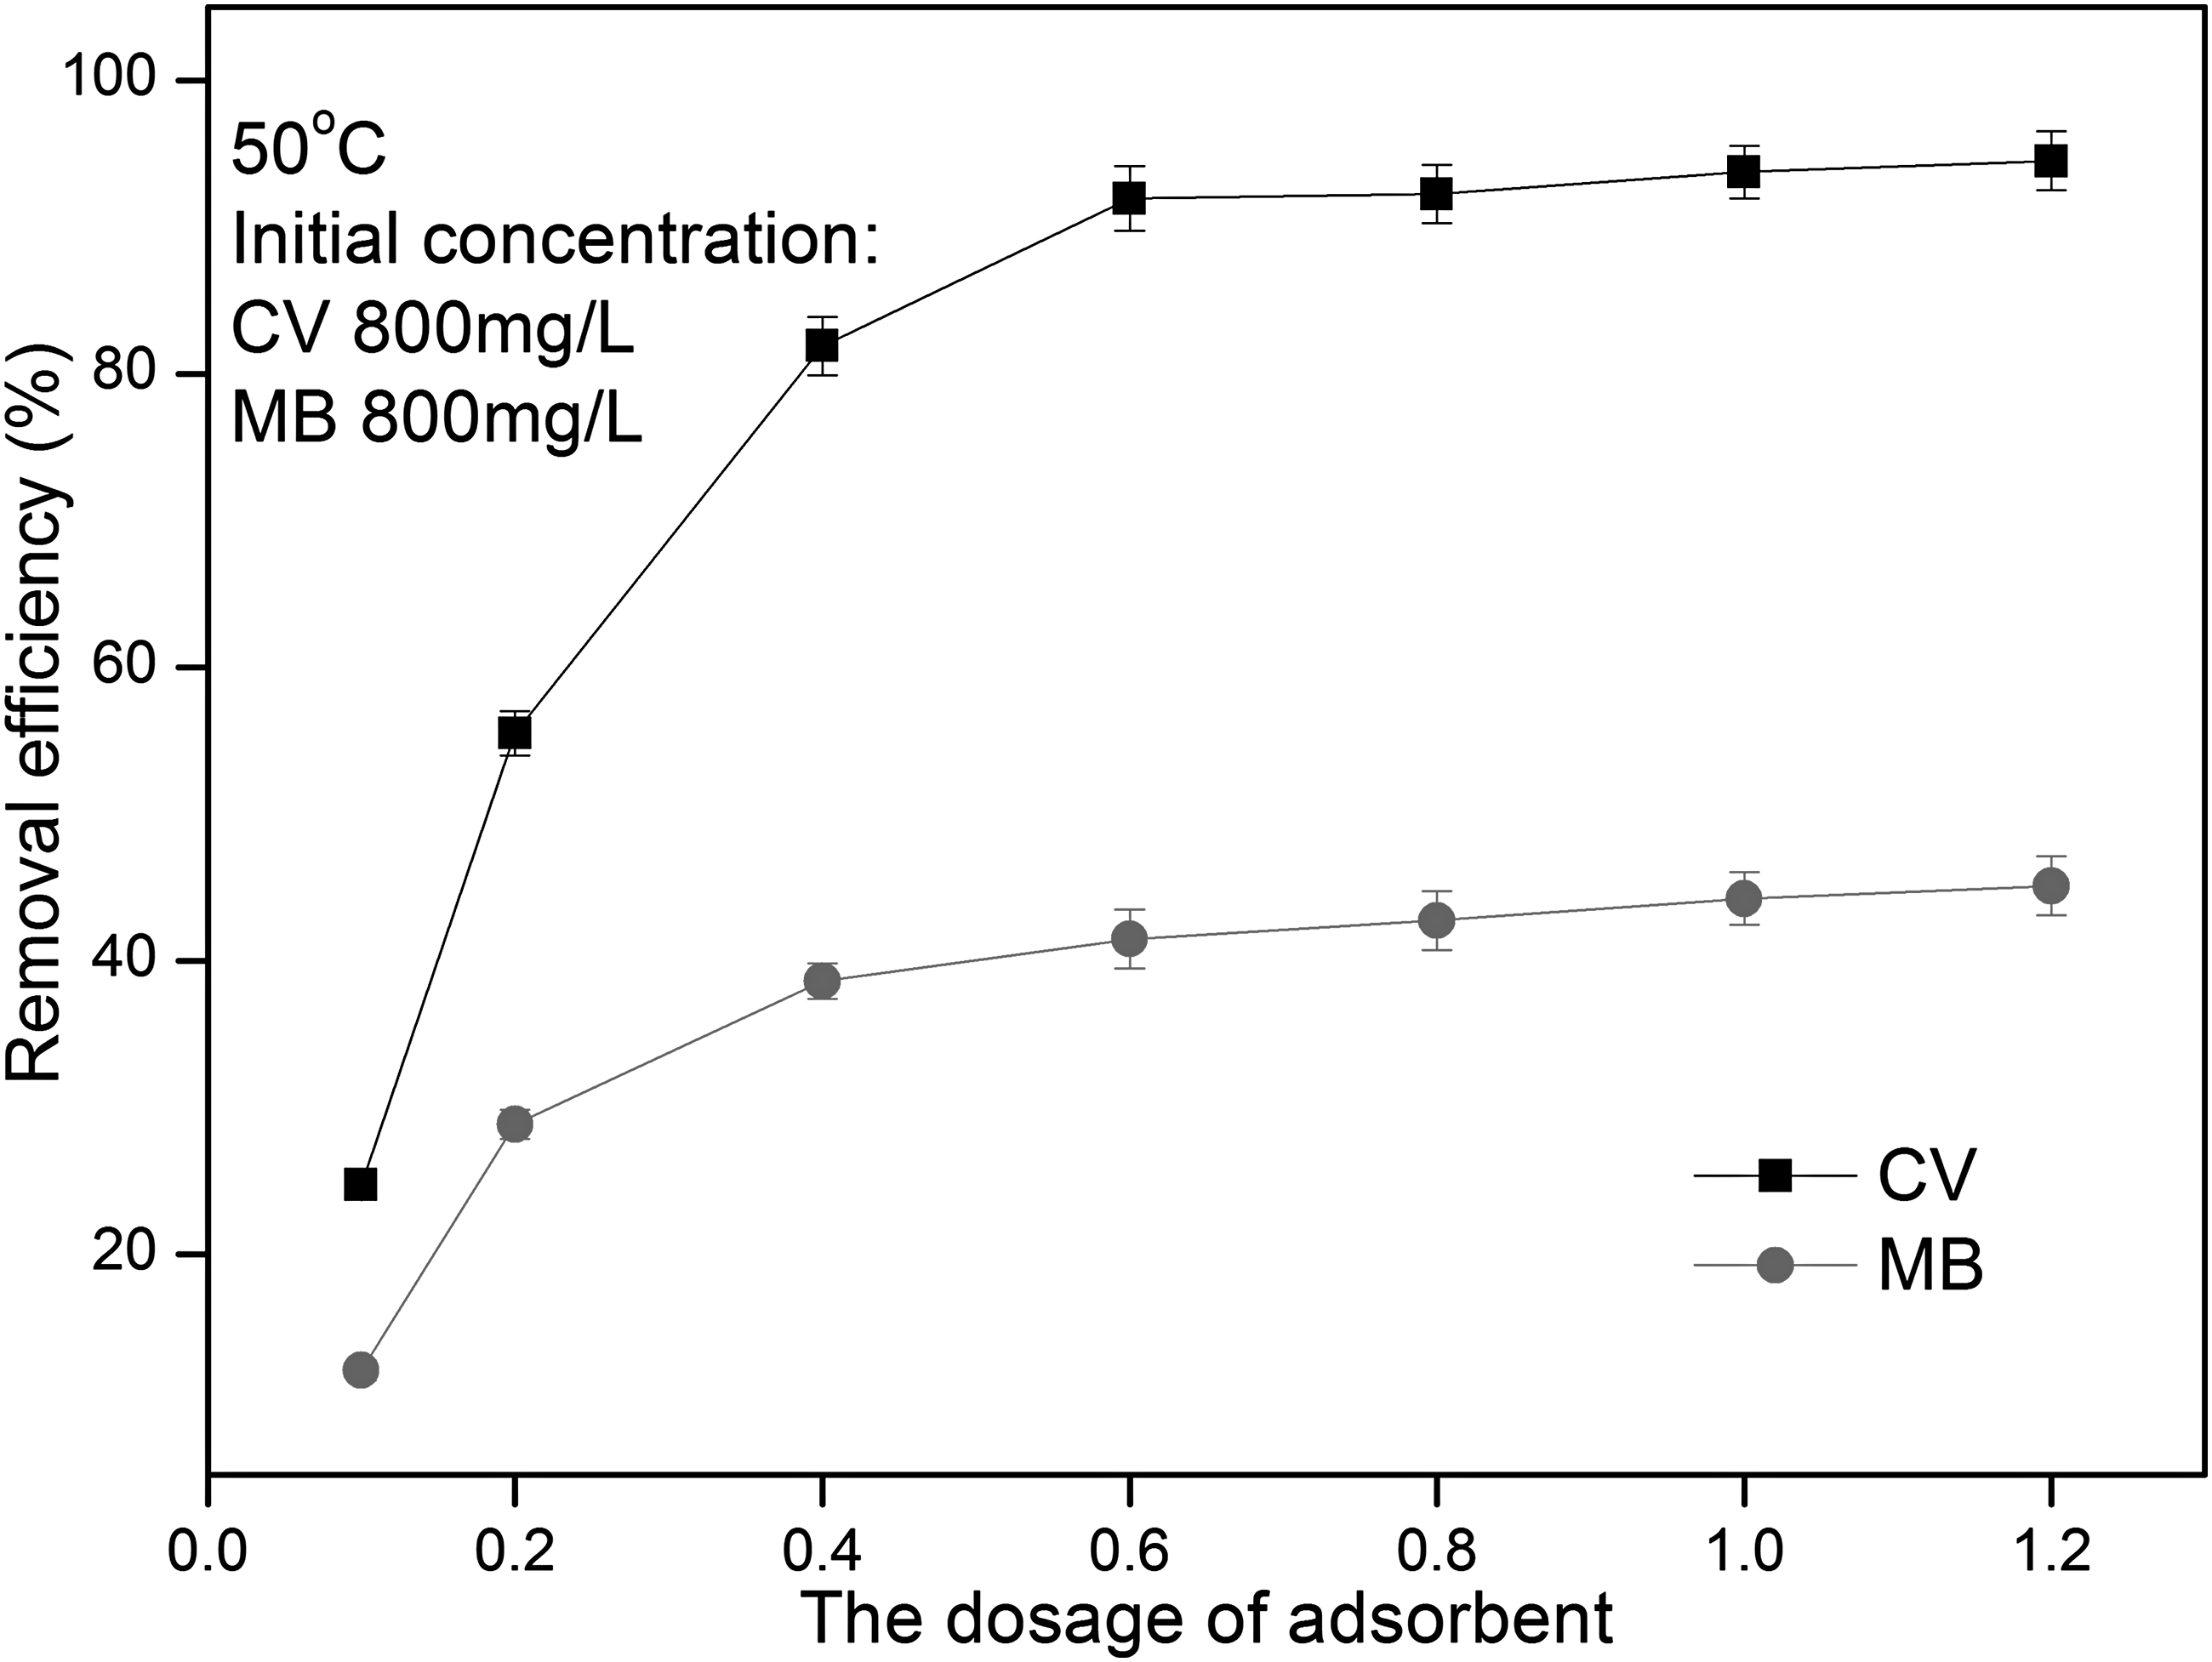
Effect of initial adsorbent dosage on adsorption of CV and MB on FB-mZVI. CV, crystal violet; MB, methylene blue.
Effect of reaction time
Figure 7 presents the adsorbent capacity and removal efficiency for the removal of CV and MB from an aqueous solution with a 200 mg/L initial concentration of CV and MB at 50°C. As noted in Fig. 7, the adsorption of both CV and MB was initially fast; then, it gradually leveled off. When the adsorption time was 33 h, the MB adsorption capacity reached 23.8 mg/g; whereas that for CV was much higher at 29.5 mg/g. Figure 7 shows that the FB-mZVI adsorbent removed 96.6% of the CV present in the aqueous solution with 200 mg/L CV. For an aqueous solution with the same MB initial concentration (200 mg/L), the removal efficiency of the adsorbent was only 75%. The UV-vis spectra of the CV and MB aqueous solutions before and after adsorption are shown in Fig. 8a and b, respectively. As noted in Fig. 8a, a new band appeared at approximately 373 nm in the spectrum of the CV aqueous solution after adsorption, indicating that a new compound resulted from the adsorption process. These UV spectra results along with those of the FTIR and XRD studies on CV and MB adsorption suggest that CV was reduced by the Fe0 present in the FB-mZVI. This electrochemical reduction of CV by the adsorbent seemed to be the driving force, causing its higher removal in comparison to MB. The FTIR and XRD studies showing evidence of the CV electrochemical reduction by the adsorbent are presented next.

Effect of reaction time on adsorption of CV and MB on FB-mZVI.
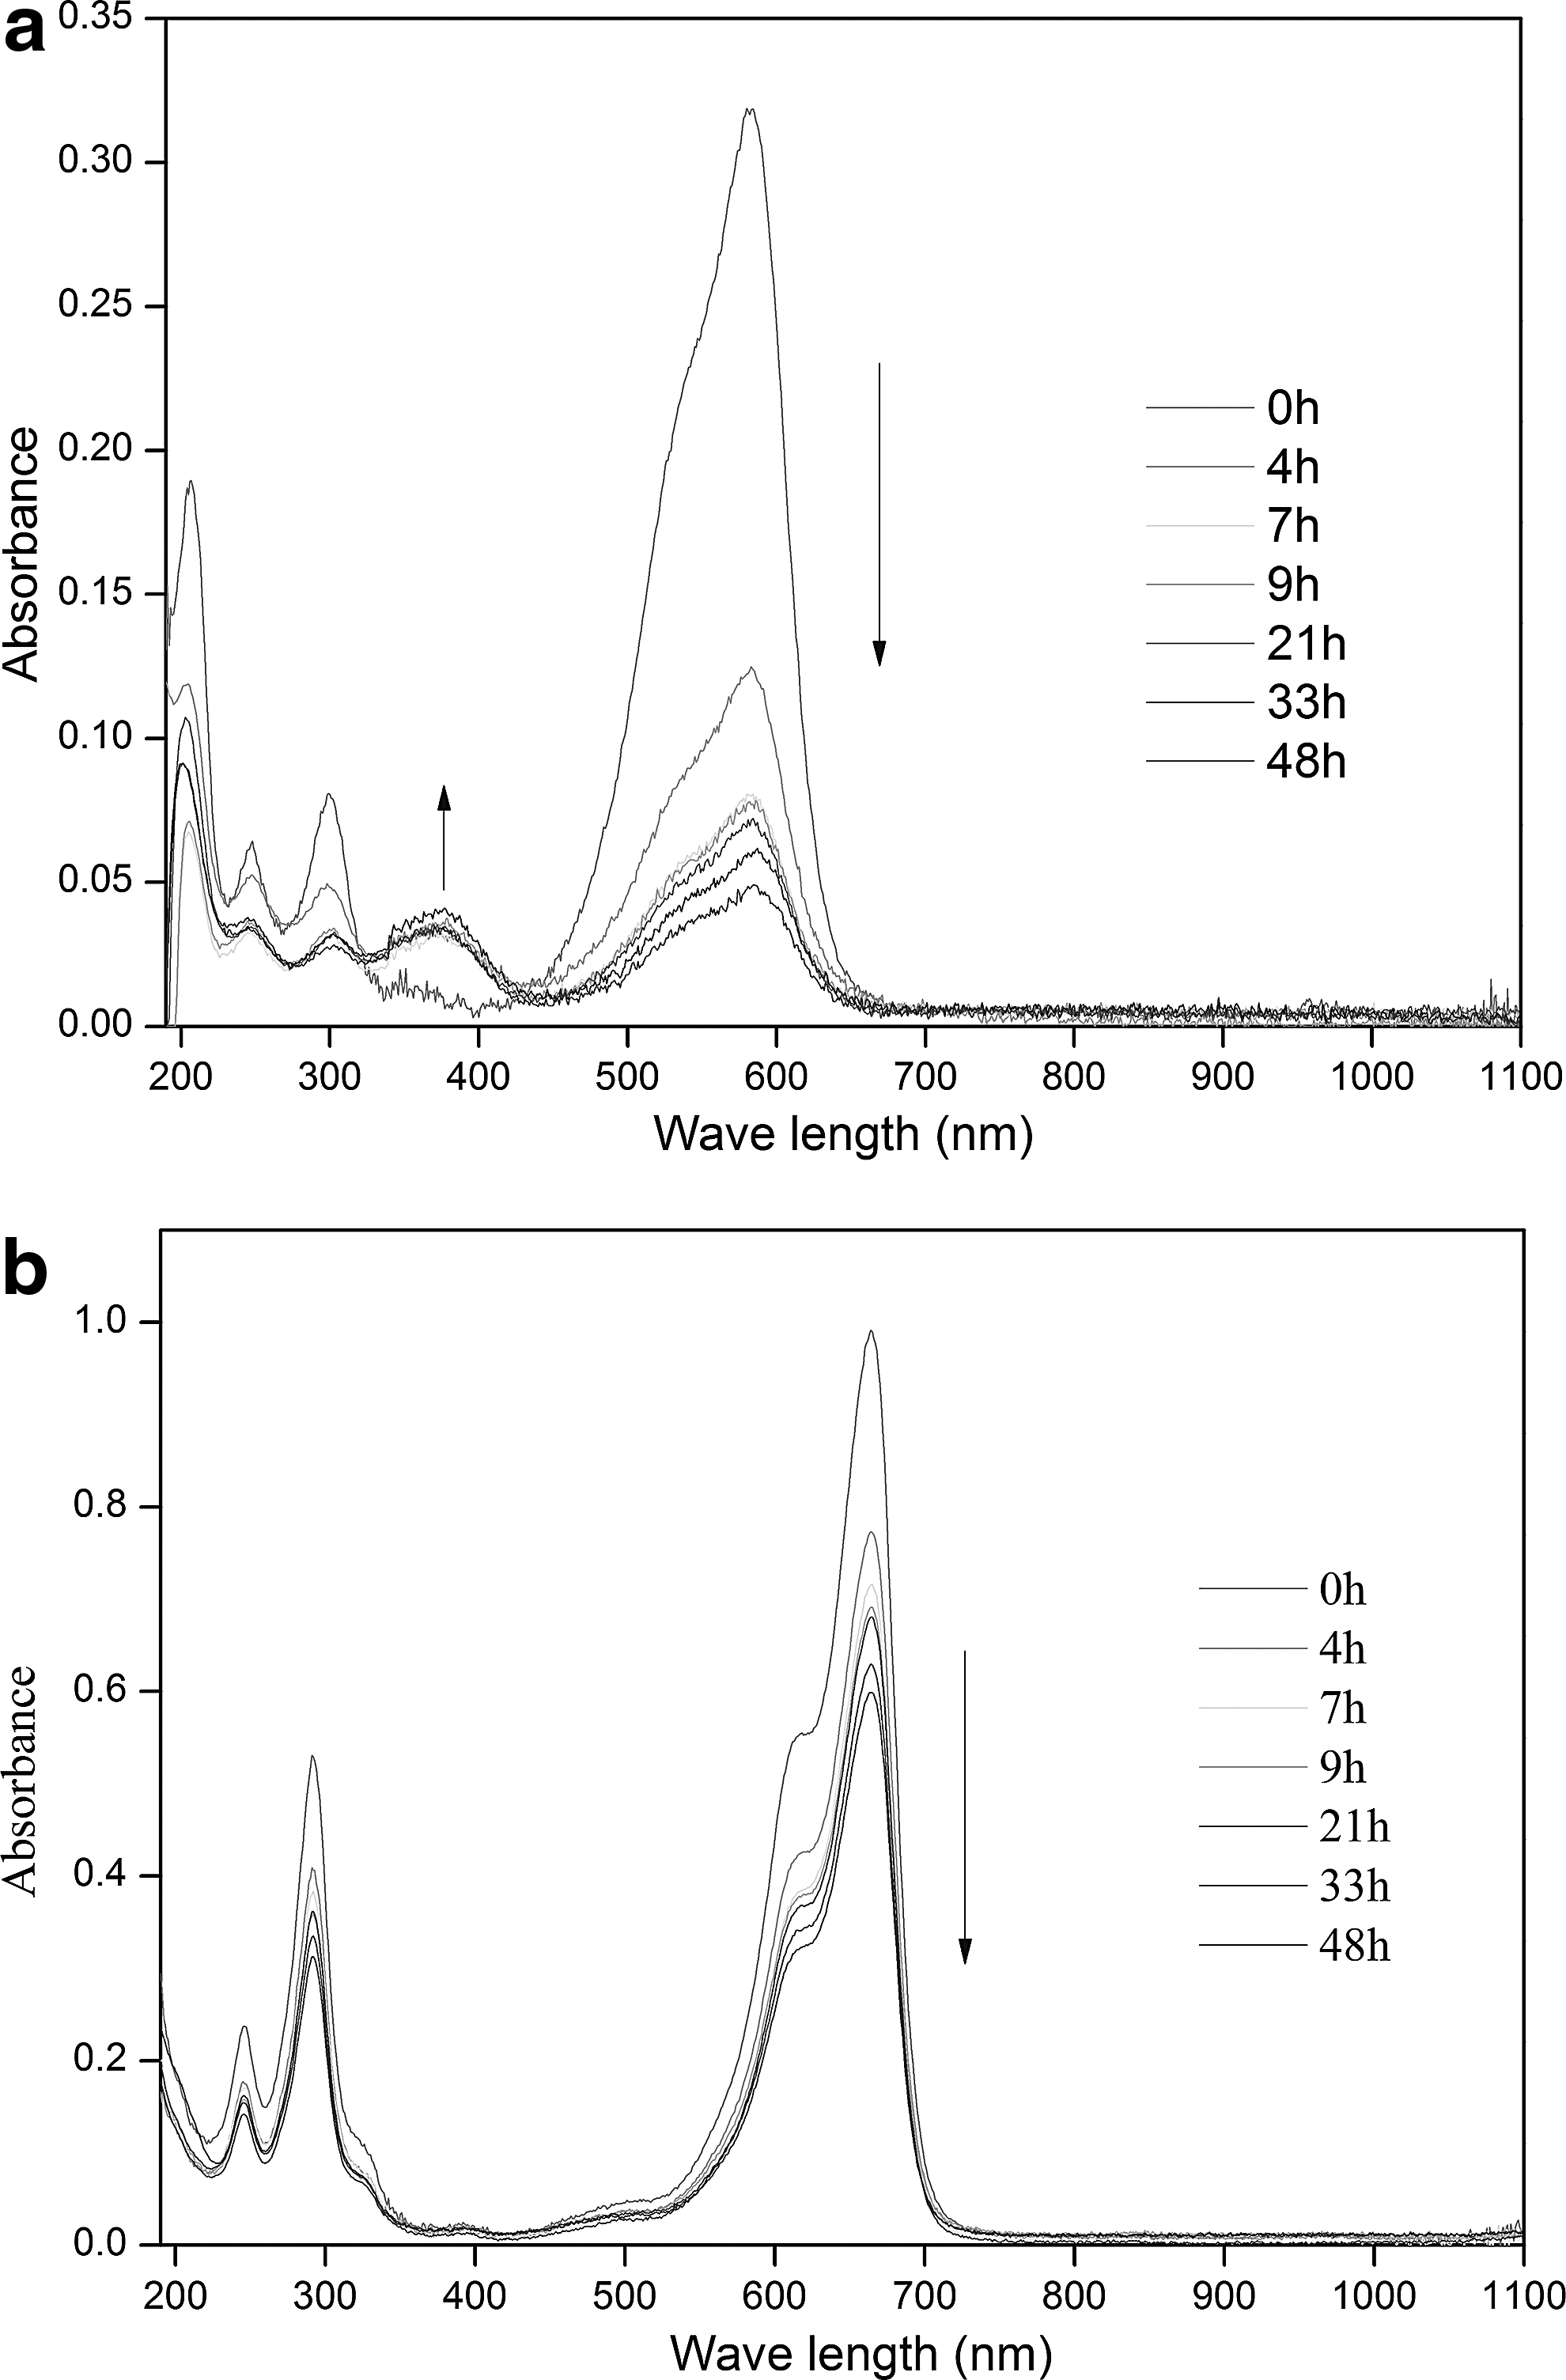
UV-vis spectra of dye solutions
Effect of pH
Effect of pH on the removal of MB and CV by FB-mZVI was investigated, as shown in Fig. 9. The removal efficiency of CV and MB was maximum at approximately pH 6, where the absorbent/aqueous interface was positively charged because the IEP of the adsorbent was 7 (Xing and Wang, 2016). Below pH 6, the CV and MB removal decreased, which could be accounted for by the increase in the electrostatic repulsion contributing to adsorption due to an increase in the positive electrical potential at the adsorbate/aqueous solution interface. This decrease in CV adsorption below pH 6 was also reported by Mbacké et al. (2015) to have occurred in an electrocoagulation process by using aluminum electrodes as the dissolved cathode.
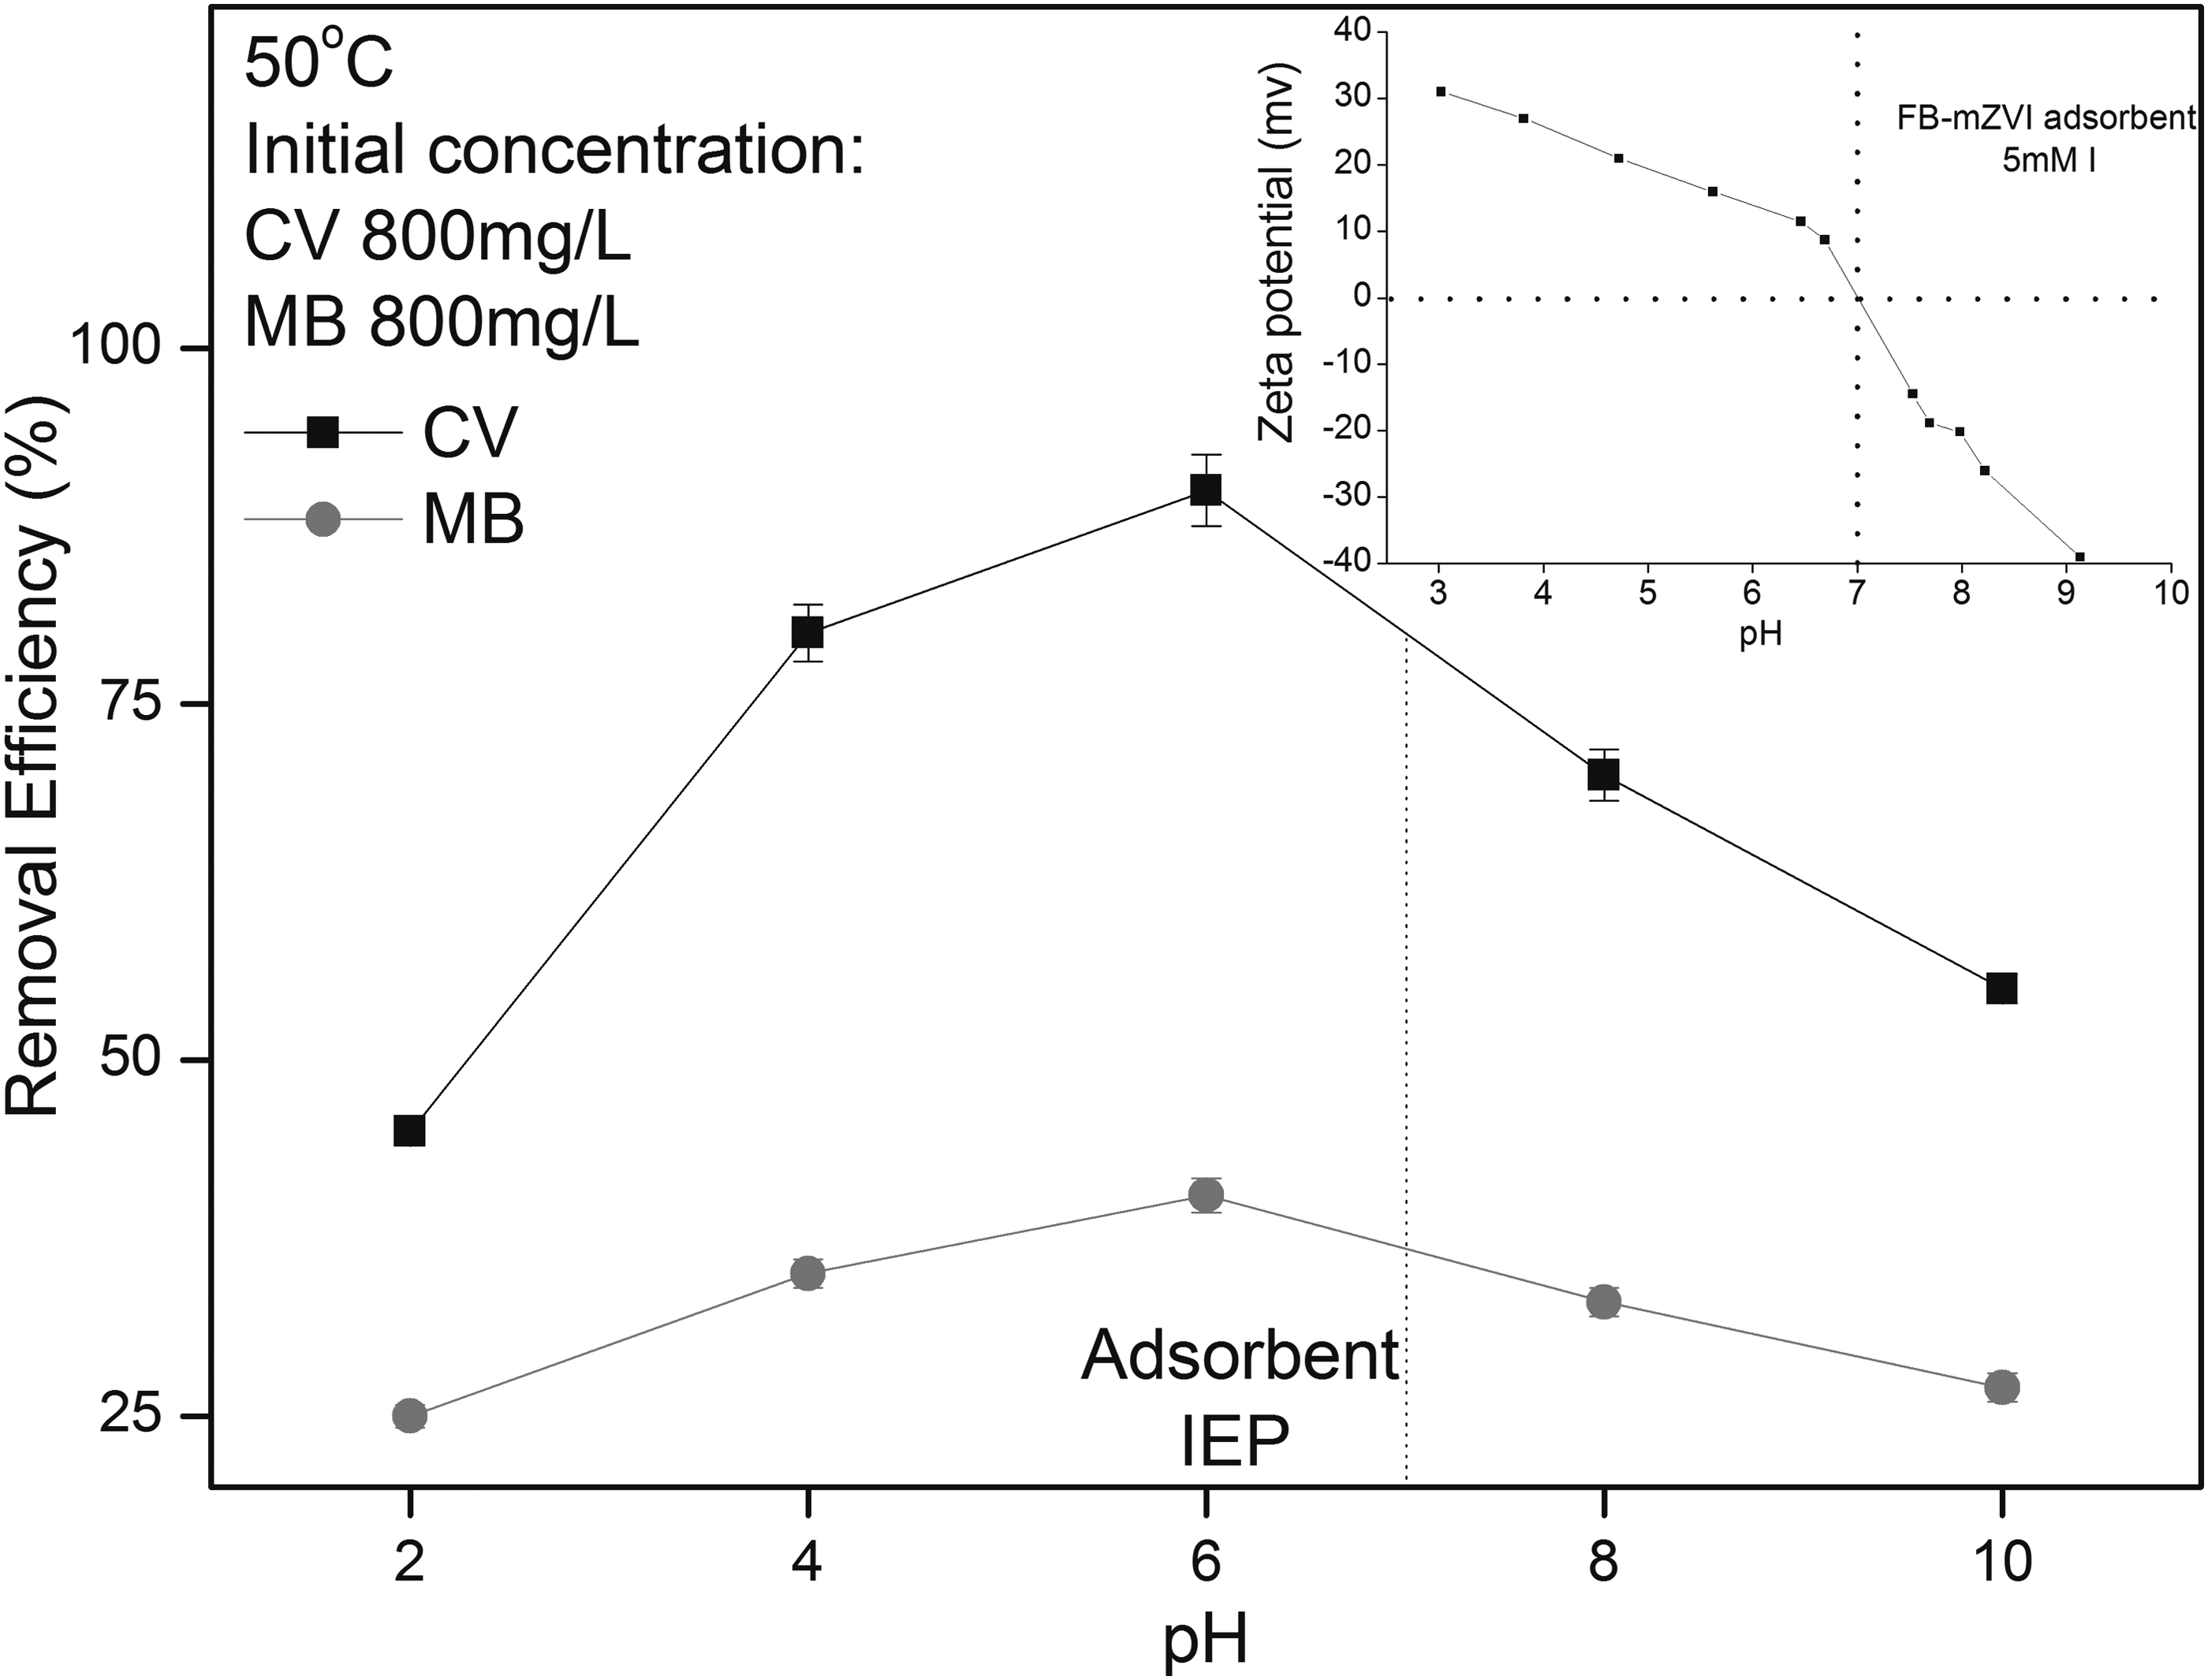
Effect of pH on adsorption of CV and MB by the FB-mZVI adsorbent.
Above pH 6, the CV and MB removal efficiency decreased, despite the fact that the adsorbent/aqueous solution interface was negatively charged. From the electrostatic interaction point of view, a high removal efficiency would be expected if the CV and MB species retained their positive electrical charge. Likely, the OH− ions neutralized the positive electrical charges of the adsorbates, because this neutralization process was greater at higher pH values. This neutralization effect on the positive electric charges of CV and MB by anions has been reported by Li et al. (2016). Accordingly, the removal efficiency of CV and MB by the adsorbent decreased with the pH.
Effect of initial dye concentration
Effect of the initial CV and MB concentration on the removal process was studied in the range of 100–800 mg/L, as shown in Fig. 10. It was found that the CV and MB removal efficiency varied with different initial concentrations; at all the different initial concentrations, the CV and MB removal was very fast in the initial stages and then gradually reached an adsorption equilibrium.
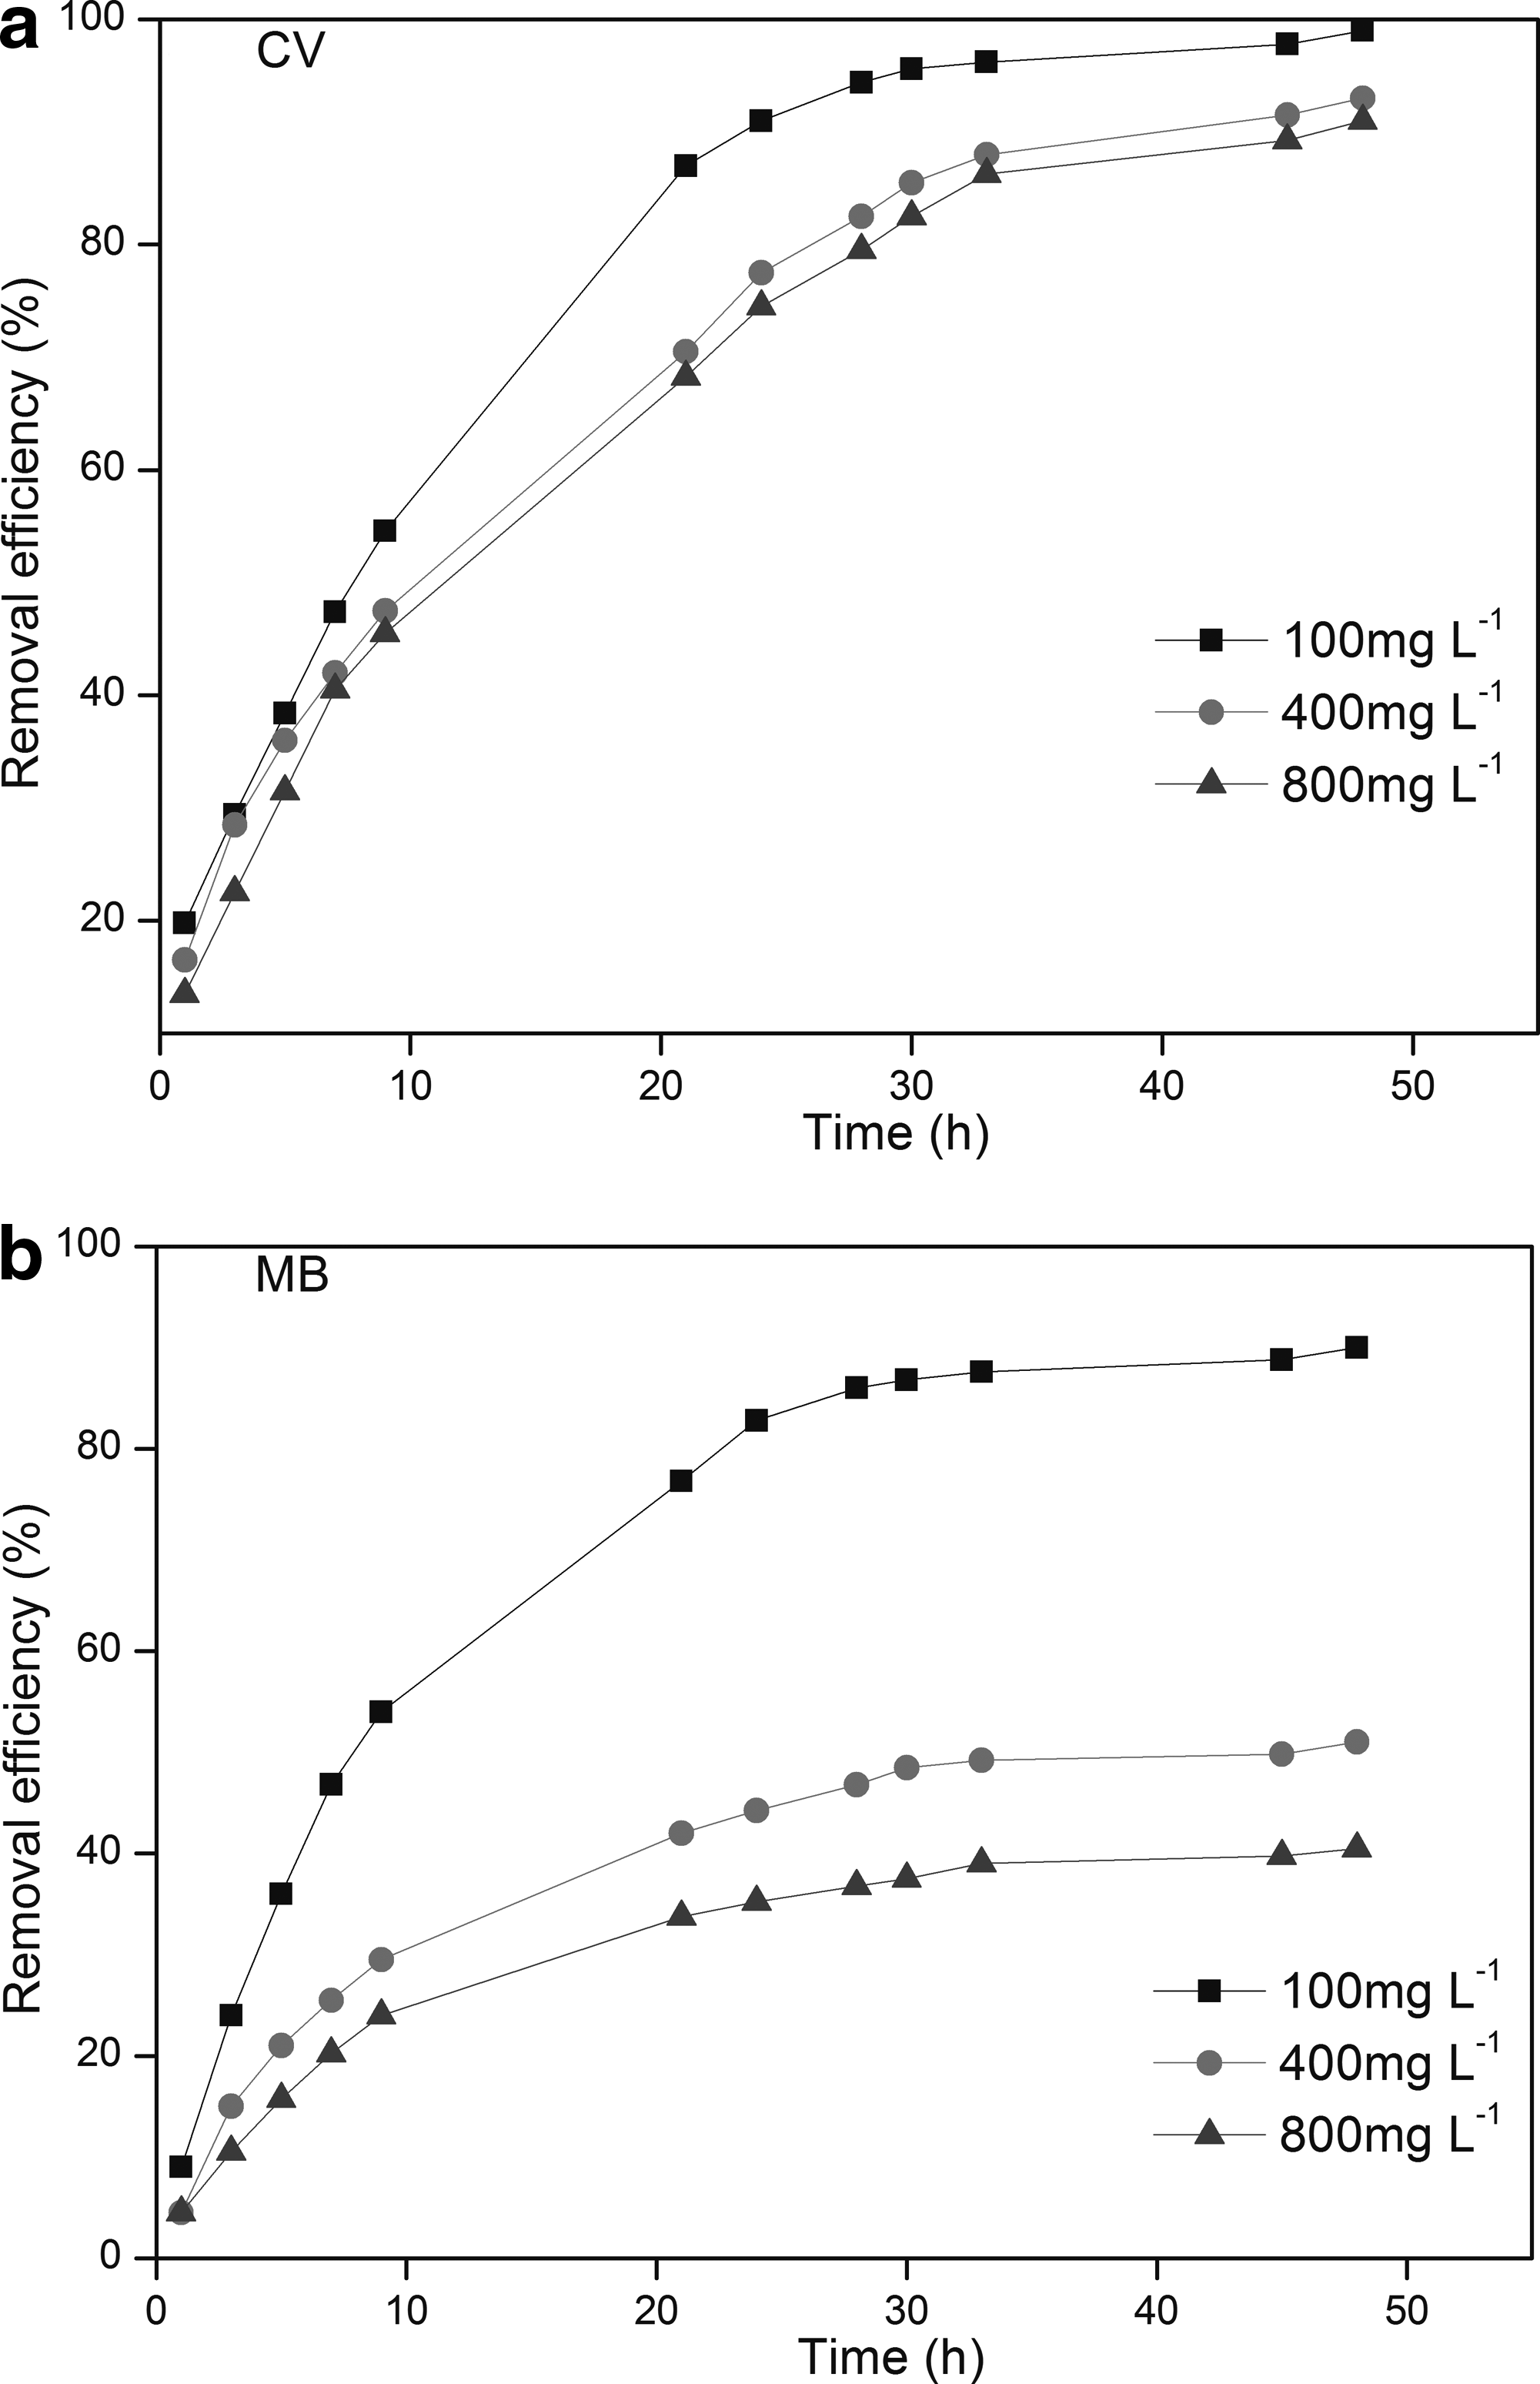
Effect of initial concentration on the adsorption of
With initial CV and MB concentration increasing, the removal efficiency of the CV and MB decreased, and the time to reach adsorption equilibrium became longer. When the initial CV and MB concentrations were 100 mg/L, the equilibrium time was 28 h with a removal efficiency of 94.4% and 86%, respectively. The initial CV and MB concentration of 800 mg/L exhibited the longest equilibrium time and the lowest removal efficiency from the aqueous solutions. This can be explained by the fact that more CV and MB molecules approached the Fe0 on the surface of the adsorbent, causing more rapid zero-valent iron oxidization to iron oxides, which reduced the activity of the zero-valent iron (Shi et al., 2011). In contrast, a higher concentration resulted in more pores being filled, thereby reducing the available active sites.
COD and TOC
Mineralization of CV and MB with FB-mZVI adsorbents was studied with COD and TOC measurements, in which the initial COD of the CV and MB was 322 and 285 mg/L, respectively. After 24 h of adsorption by using the FB-mZVI adsorbent, there was a significant decrease in the COD values of CV and MB. The COD value of CV was 30 mg/L, which was much lower than that of MB (80 mg/L). Figure 11 shows that 90.63% mineralization was achieved for CV, which was higher than that of MB (71.4%). It was found that significant degradation and mineralization efficiency occurred when using the FB-mZVI adsorbent for CV and MB.

TOC removal efficiency of CV and MB by FB-mZVI adsorbent. TOC, total organic carbon.
Adsorption kinetics
Lagergren pseudo-first-order kinetic model in Equation (4) and the pseudo-second-order kinetics equation in Equation (5) were examined to correlate the time and adsorbent adsorption density of CV and MB.
The best-fit model was selected based on both the correlation coefficient (r2) and the calculated Qe values. The values of the parameters (Qe, K1, K2) and the respective correlation coefficients (r2 values) for CV and MB adsorption were calculated from the plot of log(Qe–Qt) versus t for the pseudo-first-order model and the plot of t/Qt versus t for the pseudo-second-order model. Table 5 shows that the pseudo-second-order kinetic model provided nearly a perfect match between the theoretical and experimental data of the CV and MB adsorption kinetics (r2 = 0.9906 for CV and r2 = 0.9924 for MB). Accordingly, it was concluded that the adsorption mechanisms of CV and MB included both physical and chemical processes (Frost et al., 2010; Zhang et al., 2010; Shi et al., 2011; Chen et al., 2013).
FB-mZVI, fly ash and bentonite-supported microscale zero-valent iron.
Adsorption isotherms
Equilibrium data, commonly known as adsorption isotherms, are important for describing the equilibrium relationship between adsorbents and adsorbates. The adsorption of pollutants from liquid solutions by solid adsorbents has been widely evaluated by using the Langmuir isotherm in Equation (6) and the Freundlich isotherm in Equation (7):
Parameters of the Langmuir and Freundlich models are presented in Table 5. This table shows that the Langmuir adsorption isotherm represented a better fit of the experimental data due to the relatively better r2 values (all 0.9961 for CV, 0.9968 for MB), compared with those of the Freundlich isotherm. This might have been due to the homogenous distribution of the active sites on the microsphere's adsorbent surface, because the Langmuir equation assumes that the surface is homogeneous and that adsorption proceeds up to a monolayer. Then, it could be said that the adsorption of CV and MB on the adsorbent occurred within a monolayer region.
X-ray diffraction and FTIR analyses
XRD analyses of the FB-mZVI adsorbent before and after adsorbing CV and MB are shown in the diffractograms presented in Fig. 12. The XRD patterns of FB-mZVI before adsorbing CV showed an apparent peak for Fe0 at 2θ = 44.90. This peak significantly decreased in the diffractogram of the adsorbent after adsorbing CV, indicating that the amount of Fe0 in the FB-mZVI decreased with the CV adsorption. Likely, the Fe0 was oxidized to an Fe(III) species, such as iron hydroxide or iron oxide (Fe2O3, Fe(OH)3, FeOOH), in which this iron oxidation was coupled with the reduction of CV. This phenomenon has been reported to occur during CV adsorption by Fe0 nanoparticles (Üzüm et al., 2009; Smuleac et al., 2010; Chen et al., 2013). Accordingly, the removal of CV by FB-mZVI appeared to involve an electrochemical reduction step. The peak decrease in Fe0 at 2θ = 44.90 was not evident for the case of FB-mZVI after adsorbing MB, which indicated that MB did not undergo a chemical change during the adsorption process.

XRD diffractogram of FB-mZVI adsorbent before and after adsorbing CV and MB.
Figure 13 shows the FTIR results of CV and FB-mZVI before and after adsorbing CV. For CV, the absorption peaks at 3134 and 1647 cm−1 were due to the C═C stretching modes, whereas those at 1693 and 3200 cm−1 represented benzene. These latter peaks were detected in the FTIR spectrum of FB-mZVI after adsorbing CV, confirming the adsorption of the dye. However, the absorption peaks at 3134 and 1647 cm−1 did not appear in the spectrum, indicating that a new compound with no C═C bonds adsorbed on the adsorbent as a result of the CV degradation. As indicated earlier, this CV degradation was related to its electrochemical reduction, as previously proposed by Chen et al. (2013).

FTIR spectrum of FB-mZVI adsorbent, FB-mZVI after adsorbing CV and the CV powder.
Conclusions
An adsorbent for CV and MB named FB-mZVI was successfully prepared by using fly ash, bentonite, iron-ore concentration tailings, and PKSs. This adsorbent effectively removed CV and MB from aqueous solutions. The optimal synthesis conditions of the FB-mZVI were at 800°C, with a synthesis time of 10 min, heating rate of 10°C/min, and mass ratio of fly ash, bentonite, iron-ore tailings, and PKSs of 2:2:1:1. An FB-mZVI adsorbent was used to remove CV and MB from aqueous solutions, and the removal efficiency for CV was much higher than for MB. The removal of CV and MB by the FB-mZVI adsorbent was affected by the adsorbent dosage, reaction time, pH, and initial concentration. The adsorption kinetics of CV and MB on FB-mZVI were expressed by the pseudo-second-order model, and the Langmuir isotherm model could be better represented by the adsorption isotherm data.
Footnotes
Acknowledgments
This work was supported by the State Key Laboratory of Environmental Criteria and Risk Assessment (No. SKLECRA2013FP12) and the Public Science and Technology research fund projects of Ocean, China (201105020). In addition, Y. Wang would like to thank the State Scholarship Fund by the China Scholarship Council for offering the scholarship during her joint Ph. D. while studying at Universidad Autónoma de San Luis Potosí in the Surface Chemistry laboratory of the Institute of Metallurgy.
Author Disclosure Statement
No competing financial interests exist.