
Abstract
Abstract
To determine the effect of oxytetracycline on the anaerobic biological treatment of livestock wastewater, we studied the removal efficiency of chemical oxygen demand (determined by K2Cr2O7, CODCr), methane production, and bacterial diversity under the stress of different concentrations of oxytetracycline. Results indicated that the removal of COD and the yield of methane were inhibited by oxytetracycline. With an increase in oxytetracycline concentration, methane production decreased from 392 to 207 mL (the control group was 448 mL) and COD removal efficiency fell from 92% to 84% (the control group was 94%). Results of PCR-DGGE (polymerase chain reaction and denaturing gradient gel electrophoresis) indicated that, with an increase in oxytetracycline concentration, the richness values of the bacterial community fell from 0.86 to 0.45 (the control group was 1). In addition, oxytetracycline reduced COD removal efficiency, methane production, and bacterial diversity in livestock wastewater. Results presented in this study provide important information about bacterial diversity in livestock wastewater treated using oxytetracycline.
Introduction
L
Oxytetracycline is an antibiotic that is commonly used as a prophylactic and therapeutic treatment in livestock animals (including cattle, swine, poultry, and fish), and it is also used as a growth promoter due to its broad antibacterial spectrum and low cost (Arikan et al., 2006). Oxytetracycline has a strong inhibitory effect on most microorganisms in the biological wastewater treatment process (Watkinson et al., 2007; Li et al., 2008; Bouki et al., 2013), and it is added in fodder for quick growth and disease resistance. Only a small part of oxytetracycline is metabolized by animals, as the majority of oxytetracycline is discharged as waste; thus, discharged oxytetracycline is contained in wastewater.
Livestock wastewater treated with oxytetracycline is less efficient as biological wastewater treatment (Kim and Aga, 2007; Zhang et al., 2014; Jahne et al., 2015). An anaerobic treatment processes microorganisms in the absence of oxygen into inorganic (methane, carbon dioxide, and steam) cellular materials (Daverey et al., 2014; Zhang et al., 2015). Anaerobic biological treatment of refractory organic wastewater can improve the biodegradability of wastewater (Amor et al., 2015; Herrero and Stuckey, 2015; Hu et al., 2015; Yu et al., 2015). Therefore, anaerobic biological treatment has been widely employed for primary or secondary treatment of various industrial residues. Operational conditions are affected by temperature, pH, hydraulic retention times, and other parameters (Leitão et al., 2006; Staunton et al., 2015; Kamali et al., 2016).
Effects of oxytetracycline on the activity and diversity of anaerobic microorganisms in livestock wastewater treatment systems are unknown in certain regions. Modern molecular biology techniques provide advanced technical means for investigation of environmental microbial systems (Xiao et al., 2009; Ercolini, 2013), and previous studies have used molecular biology methods to study environmental microbiology (Pinar et al., 2013; Yan et al., 2013; Moreira et al., 2014; Taylor et al., 2014). Denaturing gradient gel electrophoresis (DGGE) of polymerase chain reaction (PCR) amplifies 16S ribosomal RNA (rRNA) gene fragments that can be used to analyze the bacterial community structure (LaPara et al., 2002; Hu et al., 2014). The PCR-DGGE, with its capacity to detect and measure minute amounts of nucleic acids in a wide range of samples from numerous sources, is an excellent tool for molecular diagnostics, life sciences, agriculture, and medicine (Bustin et al., 2009; Gyawali and et al., 2015). Molecular methods such as these have not yet been applied to the study of anaerobic microbial communities in livestock wastewater after oxytetracycline treatment.
The objective of this study was to determine the effect of oxytetracycline on the activity and diversity of anaerobic microorganisms in a livestock wastewater treatment system by using PCR-DGGE. In addition, methane production and COD removal efficiency were also evaluated.
Materials and Methods
Anaerobic treatment system
Oxytetracycline was provided by Hefei Bomei Biotechnology Co., China. The anaerobic-activated sludge was sampled from an upflow anaerobic sludge blanket (UASB) reactor by a livestock wastewater treatment plant in Changsha City (China). It was cultured for 48 h in the laboratory (35°C ± 2°C) before the experiment, and the concentration of anaerobic-activated sludge was ∼40 g/L.
The experimental apparatus are shown in Figure 1. The volume of one reactor is 500 mL, and six reactors were settled under the temperature of 35°C ± 2°C by a thermostat water bath and shaken regularly to ensure the sludge in suspension. The reactor was sealed with a rubber stopper, and a catheter was set on the rubber stopper. The generated gas was passed into a 3% NaOH solution to absorb carbon dioxide, and the volume of discharged liquid resulted in methane production. The reactor contained a solution of anaerobic-activated sludge (100 mL) and water (400 mL). After the acclimation of anaerobic-activated sludge in the reactor, oxytetracycline was added into the reactor with shaking. The concentration of oxytetracycline was set as follows: 10, 20, 40, 60, and 80 mg/L, respectively, according to previous studies (Polubesova et al., 2006) and our previous experiment, and they were marked as 1, 2, 3, 4, and 5, correspondingly; the control contained no oxytetracycline. The pH in the reactor was adjusted to 7.5 with a low concentration of hydrochloric acid or sodium hydroxide. Methane production was determined each day (across 24 h) until gas production ceased and COD concentration was measured each day (across 24 h). The anaerobic-activated sludge was sampled and stored at −20°C. The COD concentration was measured by the dichromate method (K2Cr2O7, CODCr), and methane production was measured by the drainage method.
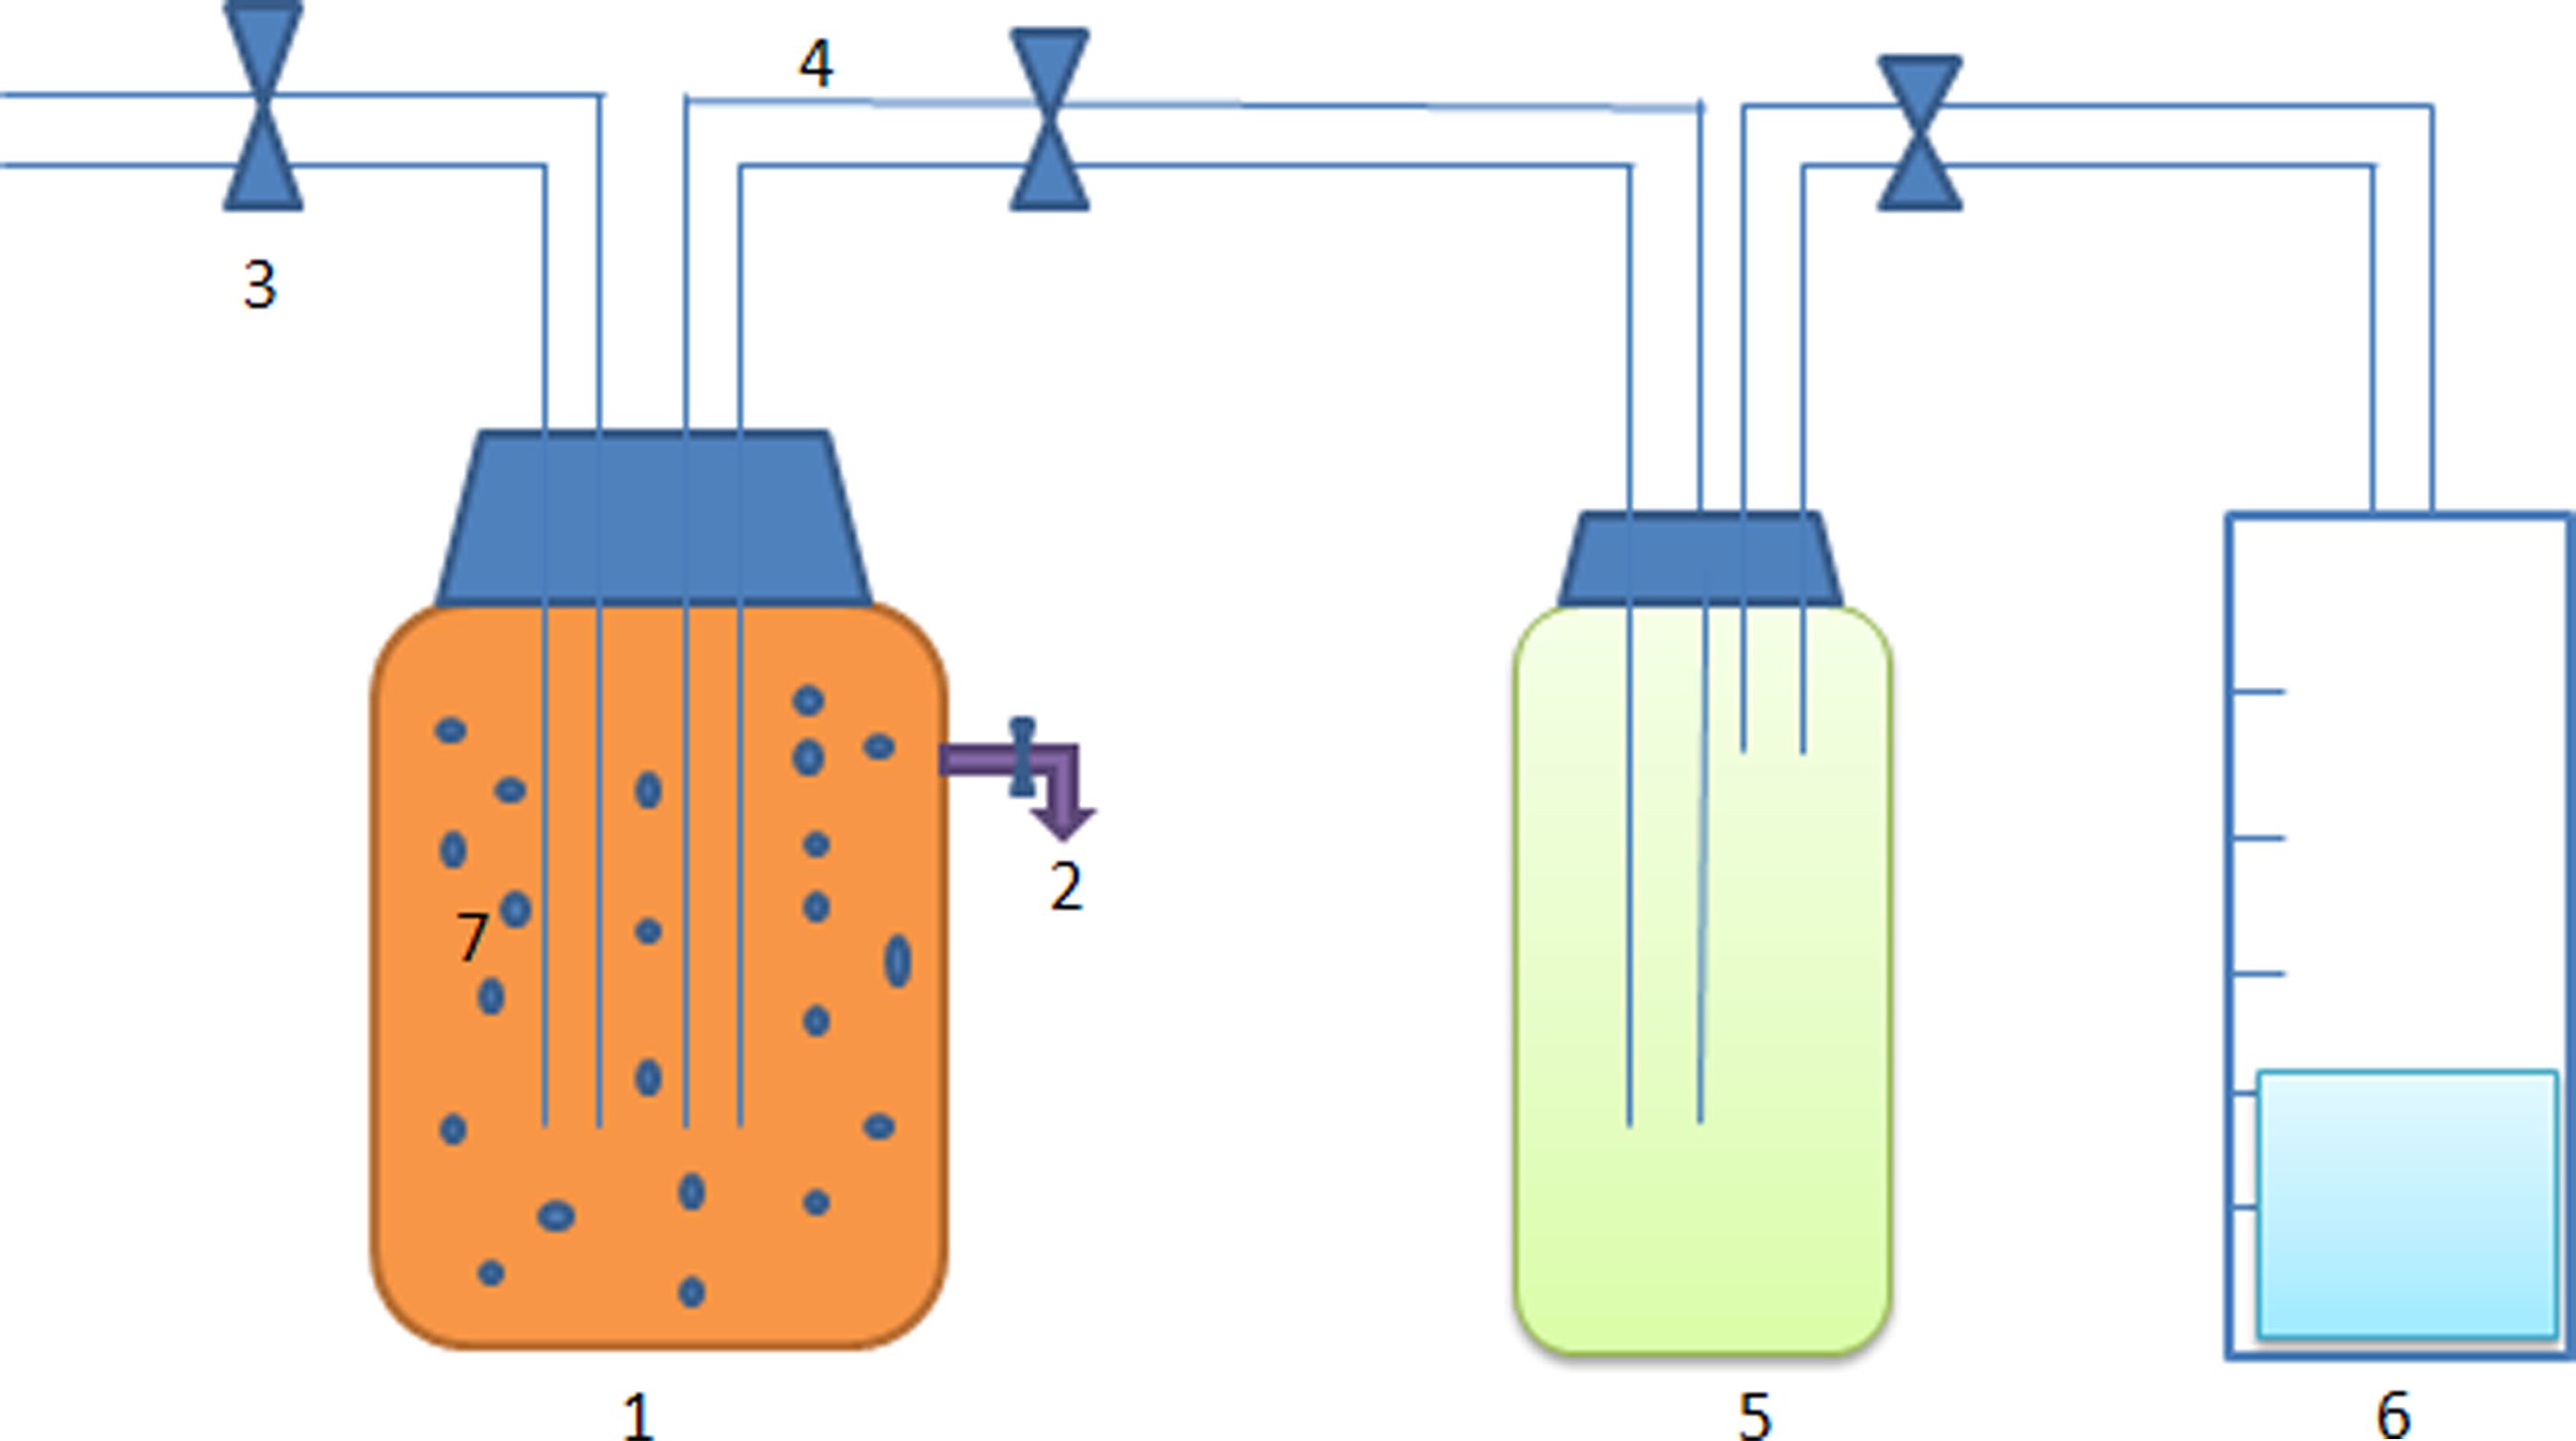
Experimental apparatus. 1: anaerobic reactor; 2: sampling location; 3: control valve; 4: duct; 5: sodium hydroxide solution (3%); 6: measuring container; 7: anaerobic-activated sludge.
DNA extraction and PCR amplification
Total DNA of the activated sludge was extracted with Fast DNA SPIN Kit for Soil (BioTeke, China). The bacterial universal 16S rRNA gene primer pair 341F (5′-CCT ACG GGA GGC AGC AG-3′) with a GC clamp and 517R (5′-ATT ACC GCG GCT GG-3) (Maeda et al., 2010; Jiang et al., 2011; Goud and Mohan, 2012; Dunlevy et al., 2013; Xiao et al., 2015b) were used. The PCR reaction mixture contained 1 μL template DNA, 5 μL of 10 × Easy Taq Buffer (TransGen, China), 4 μL of 2.5 mM dNTPs (TransGen, China), 1 μL of 10 μmol/L per primer (Sangon, China), 1 μL of 5 U Easy Taq DNA Polymerase (TransGen, China), and 37 μL of Milli-Q water. A touchdown PCR was carried out as follows: 3 min at 95°C, 32 cycles with each cycle for 30 s at 95°C, 1 min at 65°C at the first cycle, and the annealing temperatures decreasing by 1° every two cycles from 65°C to 50°C, and 1 min at 72°C, followed by a final 7-min extension at 72°C. Products were stored at −20°C before analysis.
DGGE analysis
DGGE analyses were carried out by using a DCode™ Universal detection instrument (Bio-Rad). The acrylamide concentration in the gel was 8%, and the denaturing gradient was 45–65%. The 100% denaturant solution contained 7 mol/L urea, 40% (v/v) acrylamide/bis-acrylamide (39:1), and 1× TAE buffer (pH 8.0) in Milli-Q ultrapure water. The 0% denaturant solution contained 8% acrylamide/bis-acrylamide (39:1) and 1× TAE buffer (pH 8.0) in ultrapure water. Electrophoresis was run in 1× TAE buffer at 60°C for 16 h at 70 V. Gels were stained with 0.5 μg/mL of ethidium bromide (EB) and photographed under ultraviolet light by using the Gel Doc 2000 system (Bio-Rad).
Statistical analysis
Community abundance of each sample was presented by using the index (Ai) compared with all the analyzed samples in this article. The index is calculated with the following equation: Aij = lj/Lt, where j is the analyzed sample, Lj is the number of bands in lane j in the DGGE profile, and Lt is the number of all bands presented in the DGGE profile. The parallel bands in different lanes are regarded as one band. A bigger Ai value indicates a more abundant community in the sample analyzed.
The phylotype profiles of the samples from every two samples were compared by using Sorenson's index as follows: CSAB = 2LAB/(LA+LB) × 100; a pairwise similarity coefficient (Murray and Grzymski, 2007; Kong et al., 2014; Powney et al., 2014), where LAB is the number of bands found common in both lanes A and B, LA is the number of bands at lane A, and LB is the number of bands at lane B. A CS value of 0 indicates that the two samples are completely different, and a CS value of 100 indicates that the two samples have an identical microbiological abundance.
Distinct bands were excised from DGGE gel under UV light, and then DNA was extracted and purified from the excised band with a quick gel extraction kit (TianDZ, China). The purified DNA was re-amplified by using the primer pair 341F/517R, and the products were ligated into the PMD18-T vector (Takara, Japan). The inserted fragment in the selected clone was sequenced by a sequencing company (Sangon, China).
Results and Discussion
Reactor operation
The effects of oxytetracycline on COD, and methane production are shown in Figures 2 and 3. Samples are taken three times to eradicate any discrepancies for each test, and the mean value is shown.
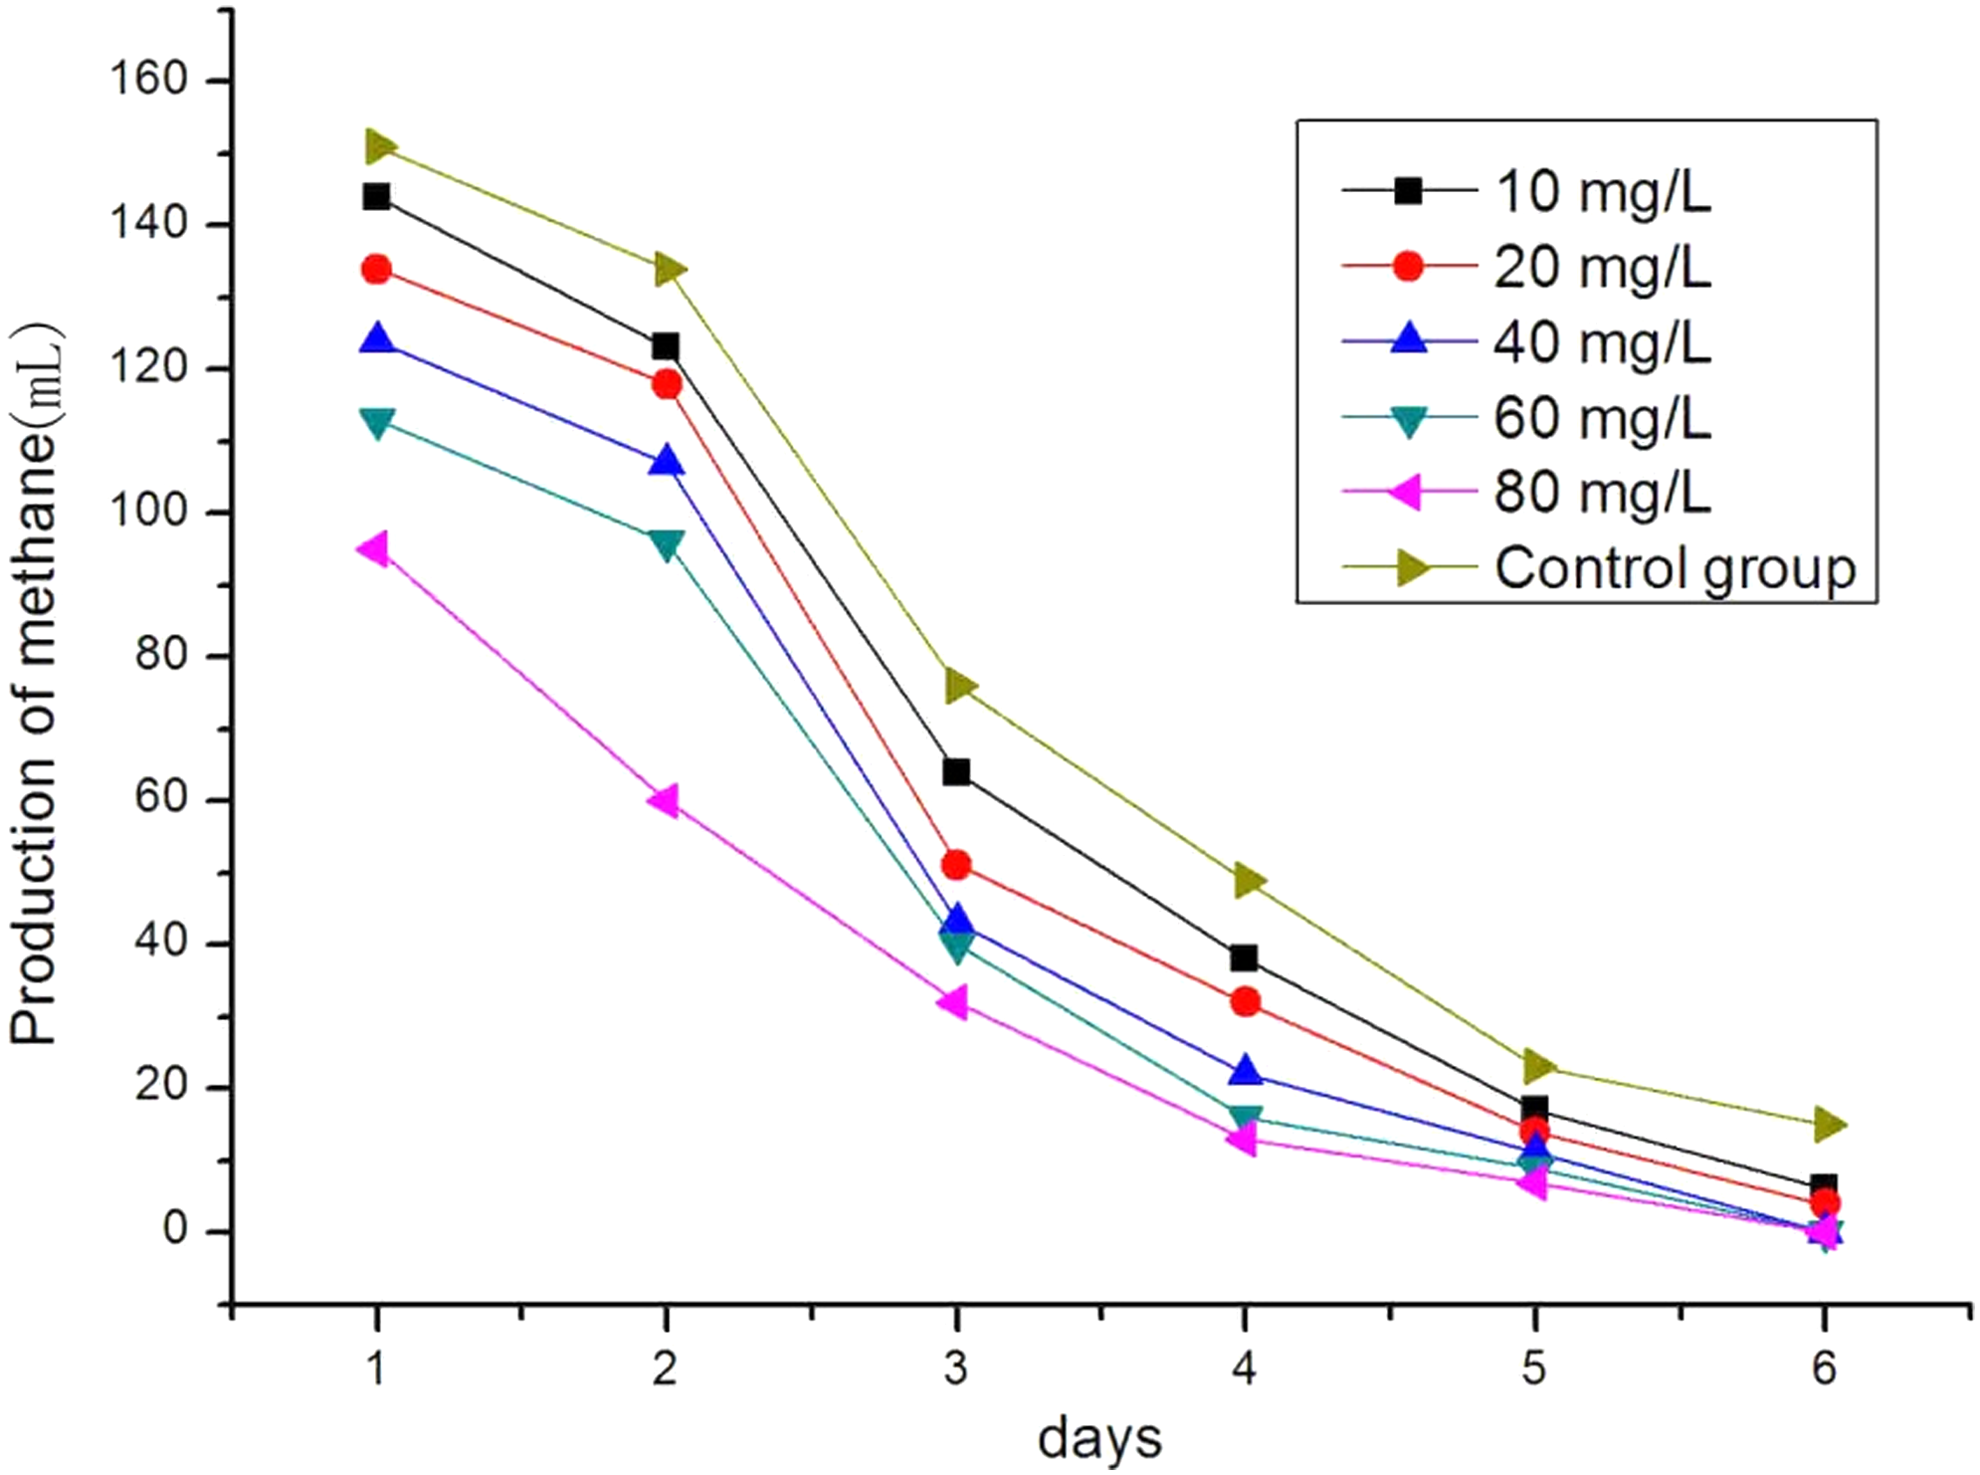
Effect of oxytetracycline on methane production in livestock wastewater by the anaerobic biological treatment system.

Change in COD concentration in the anaerobic biological treatment system treated with different levels of oxytetracycline. COD, chemical oxygen demand.
As shown in Figure 2, methane production in the control group was significantly higher than in those treated with oxytetracycline. In the first 5 days, mean methane production was 392, 353, 307, 274, and 207 mL, for oxytetracycline treatments of 10, 20, 40, 60, and 80 mg/L, respectively; whereas it was 448 mL in the control group, indicating that oxytetracycline inhibited anaerobic methane production in a dose-dependent manner. Figure 3 shows that COD concentrations decreased rapidly in the first 2 days of treatment and then they decreased slowly across the next 4 days.
The mean COD removal efficiencies of the test groups were 92%, 91%, 89%, 86%, and 84% respectively; whereas that of the control group was 94%. These results suggest that oxytetracycline inhibited COD degradation of anaerobic microorganisms, and the inhibitory effect was aggravated by increased oxytetracycline concentration, the same pattern as observed in methane production. The reduction in methane production and COD removal efficiency indicates that the microorganisms in the reactors were subdued by oxytetracycline.
Oxytetracycline belongs to a class of tetracyclines that is widely used in chicken and pig farming in China, and it can influence microbial enzyme activity (Yang et al. 2009). Fernández et al. (2015) showed that oxytetracycline can affect structural and functional communities of environmental anaerobic bacteria, and Lü et al. (2014a, 2014b) reported that tetracyclines possess an inhibitory mechanism that is attributed to their pore formation capability on target cell cytoderms and/or cytomembranes. Oxytetracycline can inhibit microbial morphology, structure, and function, and, therefore, reduce methane production and COD removal efficiency.
DGGE and statistical analysis
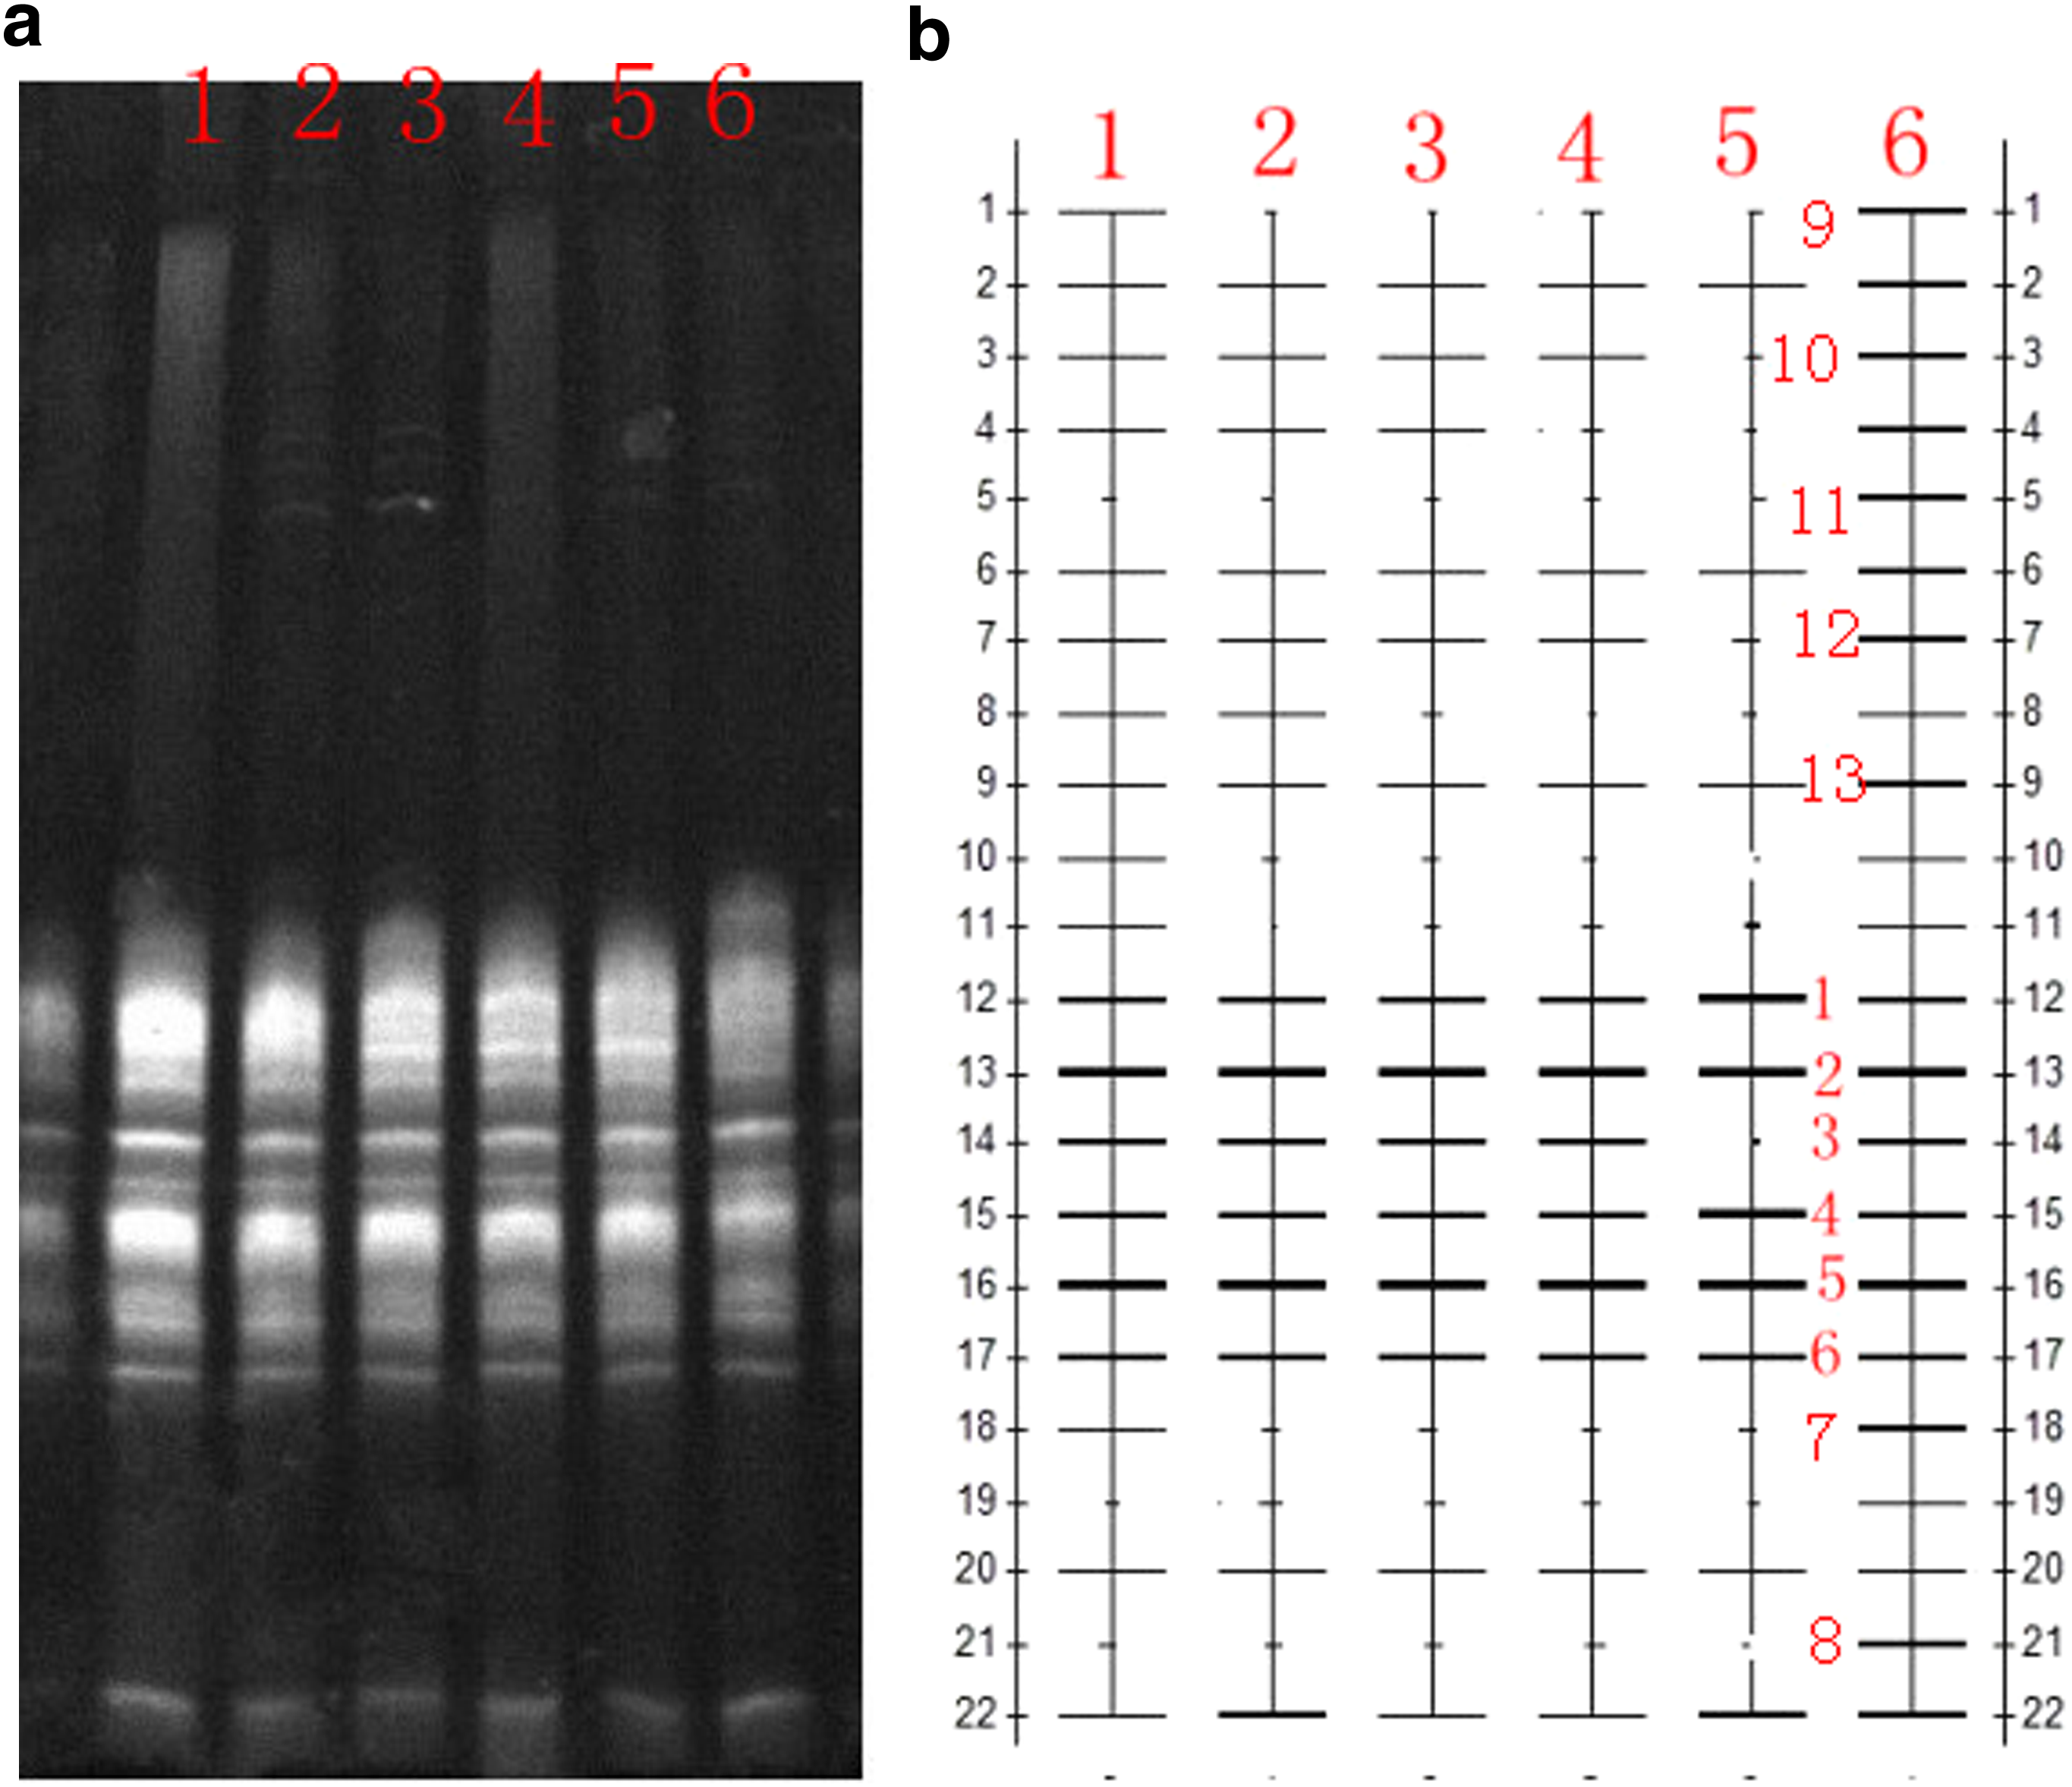
Total DNA with a length of ∼25 kb was extracted, and partial 16S rRNA gene fragments of ∼250 bp were PCR amplified sequentially, without unexpected products. All of the PCR products were applied for DGGE analysis. The DNA extraction, PCR, and DGGE analysis were performed three times for reproducibility. The same DGGE profile was screened by using the Gel Doc 2000 System using Quantity One V4.52 (Bio-Rad). Twenty-two distinct bands were counted from the stained denaturing gradient gel. The left-hand side of Figure 4 showed the DGGE profile of all treatments, and the right image is a schematic map of DGGE. All the corresponding bands in lanes 1–5 are present in lane 6.
PCR-DGGE profile
An abundance index analysis for lanes 1–6 in the DGGE profile indicated that sample 6 (control group) had the most abundant bacterial diversity, as it had an Ai value of 1; the values for samples are indicated in Table 1. The coefficient of similarity (Cs) values in Table 2 show the similarity of bacterial diversities. The higher values between samples indicate similarity of bacterial diversities; with an increase in oxytetracycline concentrations, the Cs values decreased (Table 2). The Cs value between samples 5 and 6 was 62.5, the minimum value in Table 2, and indicated their minor similarity. These samples represent the maximum oxytetracycline concentration, indicating that increased oxytetracycline levels led to greater inhibitory effects.
Ai, Abundance Index.
DGGE was used to analyze bacterial diversity under different concentrations of oxytetracycline, and the results showed that bacterial diversity was inhibited under oxytetracycline; with an increase in oxytetracycline concentrations, the inhibitory effect was more obvious. Oxytetracycline is one of the most commonly used antibiotics, and antibiotics affect the cell cytoderm and/or cytomembrane, which alters bacterial diversity in the reactors. The DGGE analysis provided clear results on the effect of oxytetracycline. The DGGE results were in accord with the methane production and COD removal efficiency findings.
Phylogenetic analysis
Thirteen sequences were separated from the excised bands after PCR-DGGE. Table 3 showed the corresponding relationship between bands in DGGE profile and the accession number given by GenBank. The phylogenetic tree was constructed with MEGA 5.0 by using the Clustral V method.
After a period of continuous monitoring, in the groups treated with oxytetracycline compared with the control group, the COD concentration was higher and the amount of methane was reduced. With an increase in oxytetracycline concentration, the difference rate of methane production expanded from 12.5% to 53.79%, and the COD removal rate dropped from 92.18% to 84.1%; whereas the COD removal rate of the control group reached 94%. PCR-DGGE results indicated that, with oxytetracycline concentration, bacterial community richness values fell from 0.91 to 0.65, whereas the control group was 1; the coefficient of similarity (Cs) of the bacterial population in different groups also indicated that the gap between the two groups increased from 62.5 to 96.6 with an increase in oxytetracycline concentration.
In the total 22 bands, 13 bands were recovered and sequenced. Table 3 and Figure 5 show that band 13 was similar to Nitrospirae, and under the stress of oxytetracycline; Nitrospirae may have had a variation, consistent with previous studies (Fernández et al., 2015; Huang et al., 2015). The bands 7, 8, and 12 were similar to Chloroflexi bacterium (Liu et al., 2013; Huang et al., 2014), and the band 10 was similar to Firmicutes, consistent with previous studies (Drudge et al., 2012; Hsu et al., 2014; Huang et al., 2014). Methane production and COD removal were mainly dependent on the function of microorganisms, as some bacteria are sensitive to antibiotics (oxytetracycline). Nitrospirae, Chloroflexi bacterium, and Firmicutes were sensitive to oxytetracycline, and other microorganisms that were affected by different oxytetracycline concentrations were similar to these based on phylogenetics. Growing microorganisms require carbon and nitrogen sources; in the absence of these microorganisms, COD removal efficiency and methane production are reduced.
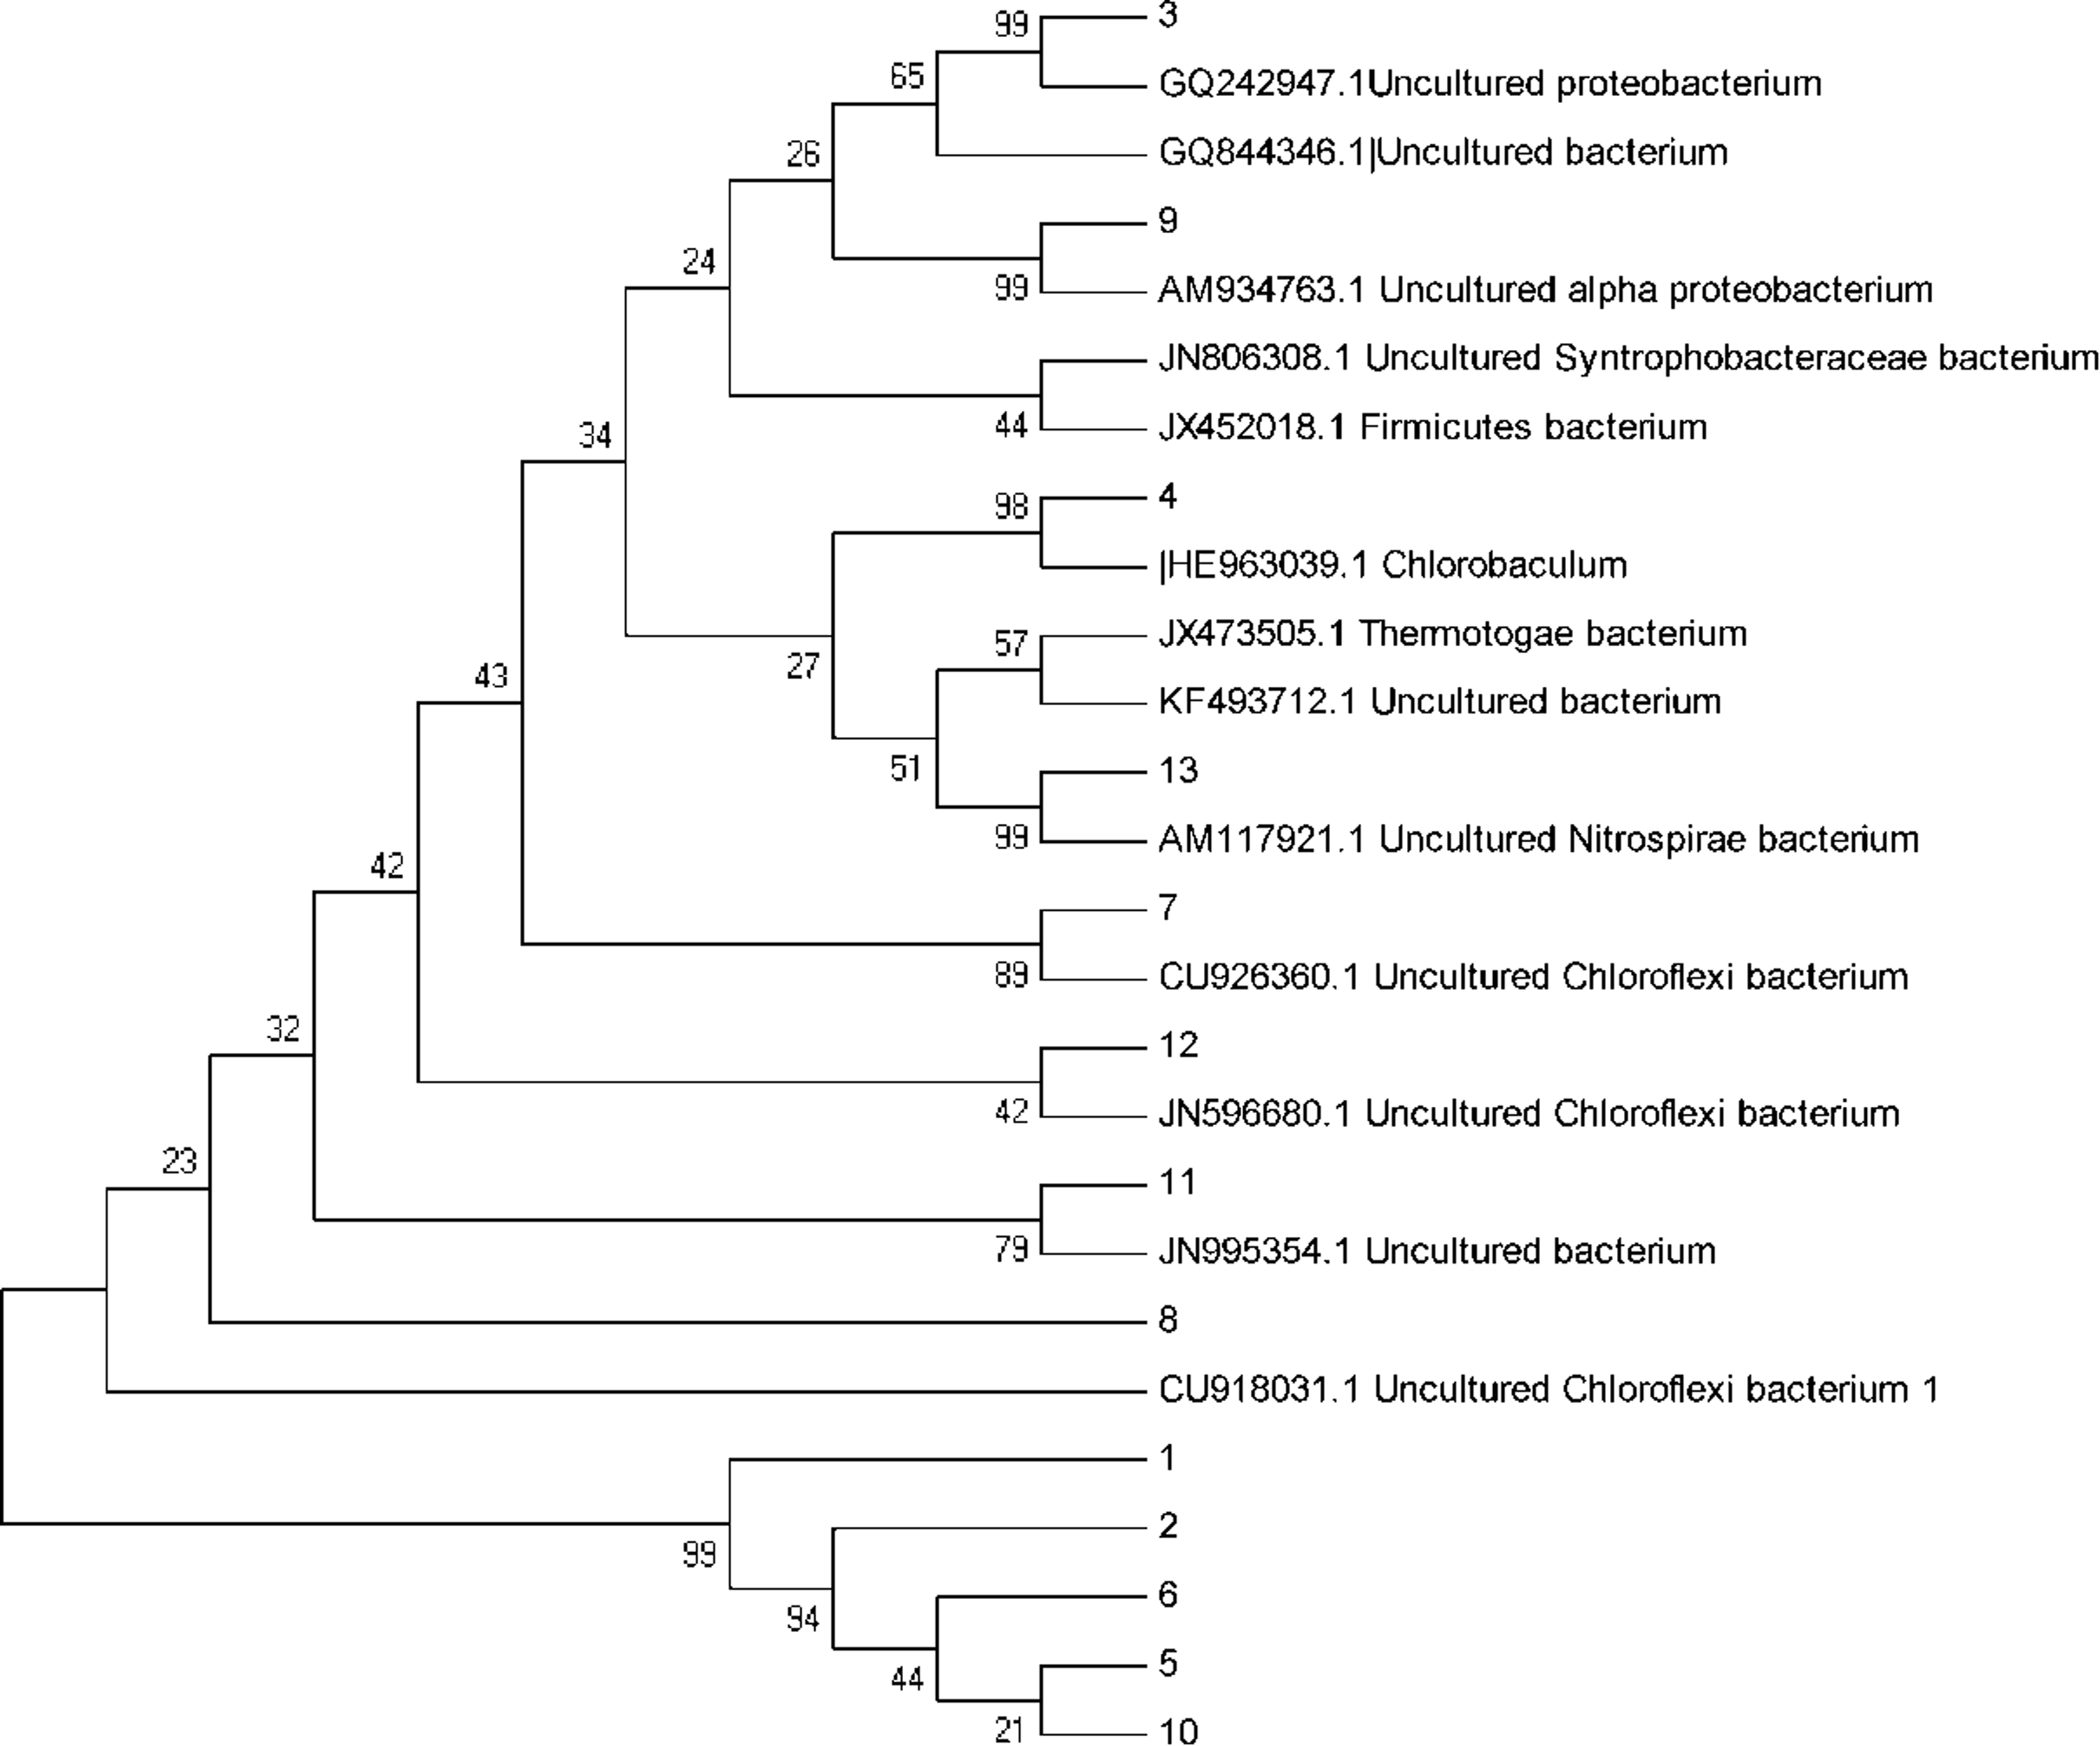
Phylogenetic tree based on results of BLAST sequences.
Though we identified several different bacteria in reactors that have an effect on COD removal and methane production, we could not conclude that the bacteria corresponded to the different abilities of COD removal and methane production under oxytetracycline stress, since a previous study indicated that DGGE can only detect 1–2% of the microbial population representing dominant species present in an environmental sample (Koskey et al., 2014; Varela et al., 2014). Additional tools, such as the PLFA method (Reichel et al., 2014; Elouaqoudi et al., 2015) and biosensors (Rosenbaum and Franks, 2014; Xiao et al., 2015a), which have been used to monitor microbial community, should be employed to further study why oxytetracycline reduces COD removal and methane production in an anaerobic biological treatment system.
Conclusion
In this study, we investigated the effects of oxytetracycline on the anaerobic biological treatment of livestock wastewater. The results indicated that removal of COD and methane production were inhibited by oxytetracycline. With an increase in oxytetracycline concentrations from 10 to 80 mg/L, methane production decreased from 392 to 207 mL (the control group was 448 mL) and COD removal efficiency fell from 92% to 84% (the control group was 94%). Results of PCR-DGGE indicated that, with an increase in oxytetracycline concentration, the richness values of the bacterial community fell from 0.86 to 0.45 (the control group was 1), and the phylogenetic analysis showed that the species was influenced by oxytetracycline. The results presented here provide important information on the effects of treating livestock wastewater with oxytetracycline and how bacterial diversity is influenced by oxytetracycline.
Footnotes
Acknowledgments
This study was financially supported by the Water Pollution Control and Treatment Technology Project of China (2014ZX07206001), the Special Fund for Environmental-Scientific Research in the Public Interest of China (201109024), and Hunan Provincial Innovation Foundation for Postgraduates (CX2013B302).
Author Disclosure Statement
No competing financial interests exist.