Ferric hydroxide adsorbents are commonly used to remove phosphonate antiscalants from membrane concentrate solutions. This research investigated competitive adsorption of nitrilotris(methylenephosphonic acid) (NTMP) and silica on ferric hydroxide. Equilibrium adsorption isotherms were measured and column breakthrough and regeneration experiments were performed for an NTMP adsorbate in simulated membrane concentrate solutions with and without dissolved orthosilicic acid. Quantum chemistry simulations using density functional theory (DFT) were used to evaluate the thermodynamic favorability of possible adsorption mechanisms for NTMP and silica. Column breakthrough experiments showed that 86 mg/L of dissolved silica decreased adsorption of NTMP by 36% after 3,685 bed volumes. DFT modeling indicated that NTMP and silica adsorption on ferric hydroxide may occur through both mono- and bidentate complex formation. NTMP adsorption through a bidentate binuclear complex was 12 kcal/mol more energetically favorable than monodentate complexation. Dimerization reactions between adsorbed silica and dissolved silica greatly increased silica adsorption for dissolved silica concentrations greater than 60 mg/L. DFT modeling and experimental results also indicated that dissolved NTMP may react with adsorbed silica through condensation reactions. Although adsorbed silica decreased the total uptake of NTMP, it increased the efficiency of regeneration by 0.10 M NaOH solutions. This is consistent with adsorbed silica decreasing formation of bidentate binuclear NTMP complexes.
Introduction
Phosphonate antiscalant compounds are often used during water desalination through reverse osmosis (RO) and nanofiltration (NF) to reduce membrane fouling by mineral scale. Phosphonate compounds in membrane concentrate solutions interfere with many brine treatment technologies, such as lime softening and fluidized bed crystallization (Aghdam et al., 2016). The phosphonate compounds also add phosphorus into the environment when the brine solutions are discharged to the ocean or other body of water (Nowack, 2003). Thus, in many circumstances, it is desirable to remove these antiscalants from the membrane concentrate solutions.
Several research studies have investigated removal of phosphonate antiscalants through ion exchange, adsorption on activated carbon, and adsorption on a variety of ferric hydroxide adsorbents (Boels, 2012; Boels et al., 2012). The best performing material for phosphonate adsorption was found to be akaganeite (β-FeOOH), with other ferric hydroxide adsorbents showing lower adsorption capacities for a commercial antiscalant mixture and for nitrilotris(methylenephosphonic acid) (NTMP). Adsorption of NTMP to akaganeite was found to conform to either linear or Langmuir isotherm models, and the adsorbent could be regenerated with 0.10 M NaOH solutions (Boels et al., 2012; Chen et al., 2016).
The adsorption mechanisms of phosphonate compounds on ferric hydroxide are believed to be similar to those for phosphate. Phosphate adsorption to ferric hydroxide occurs through a ligand exchange reaction forming inner-sphere surface complexes (Goldberg and Sposito, 1984). To date, the only spectroscopic data for phosphonate adsorption to ferric hydroxide are for the herbicide, glyphosate (Sheals et al., 2002; Jonsson et al., 2008). This spectroscopic study and quantum chemistry simulations indicated that the phosphonate group can form an Fe-O-P bond through a ligand exchange mechanism (Tribe et al., 2006). Exchange of a single -OH or -(OH)2 ligand on Fe(III) with a phosphonate group resulted in formation of a monodentate complex with a single Fe-O-P bond. Another FTIR study indicated that a second Fe-O-P bond may form with an adjacent Fe(III) atom, resulting in bidentate mononuclear complex formation (Bajara and Alfonso, 2005). These types of complexation mechanisms also occur for other compounds commonly found in water, such arsenate and orthosilicic acid (Waychunas et al., 1993; Kubicki et al., 2007; Gao et al., 2013).
Previous investigations on NTMP adsorption to ferric hydroxide were performed in simulated membrane concentrate solutions that did not contain any dissolved silica (Boels, 2012; Boels et al., 2012). However, silica is commonly present in membrane concentrate solutions. Since silica and phosphonate compounds have similar adsorption mechanisms on ferric hydroxide, dissolved silica may significantly interfere with phosphonate removal.
The goal of this study was to investigate the effect of dissolved silica on removal of a model phosphonate compound (NTMP) from simulated membrane concentrate solutions. NTMP was selected for study due to its common use as an antiscalant in evaporative cooling systems and RO water treatment (Boels et al., 2012). It also serves as a model for a polyfunctional phosphonate compound having multiple phosphonate groups that can interact with the adsorbent. Toward that end, batch isotherm and column breakthrough and regeneration experiments were performed to investigate NTMP and silica adsorption on a commercial ferric hydroxide adsorbent. Density functional theory (DFT) simulations were performed to understand competitive adsorption effects and condensation reactions between adsorbed and solution-phase silica and NTMP.
Materials and Methods
Adsorption isotherms and column breakthrough experiments were measured for NTMP on the ferric hydroxide adsorbent, GFH®. The NTMP was obtained from Sigma Aldrich and had a purity of ≥97%. NTMP has six ionizable phosphonic acid groups and one basic amine group, with pKa values of <0, <0, 1.50, 4.62, 5.90, 7.25, and 14.2 (Popov et al., 2001). GFH consists of the iron oxide mineral akaganeite (β-FeOOH) and was obtained from GEH Wasserchemie (Osnabruck, Germany). The pH of zero charge for akaganeite is 7.2 (Stumm and Morgan, 1970). The manufacturer's reported specific surface area for GFH was 300 m2/g, and the reported particle size ranged from 0.2 to 2.0 mm.
All experiments were performed in synthetic membrane concentrate solutions whose composition was set to be equivalent to NF concentrate produced in a previous investigation (Aghdam et al., 2016). The composition of the NF concentrate was similar to that produced from Central Arizona Project Water using a Dow Filmtec® NF membrane operated at 85% recovery. The composition of simulated NF concentrate is listed in Table 1, and fresh solutions were prepared immediately before each experiment. To investigate the effects of dissolved silica, experiments were performed in simulated NF concentrate solutions with 0 or 86 mg/L of SiO2. The concentrate solutions were prepared in 18 MΩ-cm ultrapure water using ACS grade Na2SiO3·9H2O, H2SO4, CaCl2, Na2CO3, Na2SO4, MgCl2, NaOH, and HCl from Fisher Scientific. Activity coefficients were calculated using the PHREEQC modeling package from the U.S. Geological Survey (Parkhurst and Appelo, 2013). The PHREEQC package calculates activity coefficients using the Davies or the extended WATEQ Debye–Huckel equation (Parkhurst and Appelo, 1999).
Composition of pH 8.3 Synthetic Nanofiltration Concentrate Used in Isotherm and Column Experiments
Analyte
Concentration (mM)
Concentration (mg/L)
Na+
29.0
667
Ca2+
8.50
340
Mg2+
6.25
150
SO42−
13.0
1,250
Cl−
29.5
1,050
HCO3−
3.00
300 as CaCO3
Na2SiO3•9H2O
1.43
86.0 as SiO2
Column breakthrough experiments were performed in 0.8 cm diameter by 9-cm-long glass columns packed with ∼2 g of adsorbent. Breakthrough profiles were measured at a flow rate of 1.0 mL/min with a feed solution containing 2.0 mg/L NTMP and 0 or 86 mg/L of SiO2. Column regeneration experiments were performed using 0.10 M NaOH solutions at a flow rate of 0.05 mL/min, corresponding to an empty bed contact time of 35 min. Effluent samples from the column experiments were collected using a Gilson FC204 fraction collector. As a check on the NTMP mass balance, adsorbent samples were removed from the columns after regeneration. The samples were dissolved at room temperature in 1.5 M HCl for 24 h and the NTMP and SiO2 concentrations in the liquor were measured.
Adsorption isotherm experiments were measured at 20°C by placing 80 to 1,500 mg of GFH into synthetic NF concentrate solutions contained in polyethylene bottles. An initial NTMP concentration of 10.0 mg/L was used in all isotherm experiments. The pH of the solutions was buffered by the 3.0 mM bicarbonate concentration. The suspensions were placed on a shaker table operated at 80 rpm and were sampled after 24 h. A previous investigation reported that adsorption equilibrium for NTMP on this adsorbent was achieved in ∼9 h (Boels et al., 2012). Triplicate samples were taken and filtered using 0.45-μm syringe filters. The standard deviation of the triplicate samples in isotherm experiments was 1.09% for P and 2.10% for Si. NTMP and SiO2 concentrations were measured using an Agilent model 5100 synchronous vertical dual view inductively coupled plasma optical emission spectrophotometer. NTMP concentrations were determined by measuring the phosphorus content of each sample.
Molecular modeling was performed to aid explanation of the experimental data. DFT modeling was performed using the DMol3 (Delley, 1990, 2000) package in the Materials Studio modeling suite (Grillo et al., 2004). Ferric hydroxide was modeled using a geometry-optimized iron oxide cluster consisting of two Fe(III) atoms in octahedral coordination with 10 oxygen atoms with the general formula Fe2O3(H2O)7 and is illustrated in Supplementary Fig. S1 in the supporting information. This cluster has been used in previous investigations modeling phosphate adsorption (Kubicki et al., 2007; Rahnemaie et al., 2007; Acelas et al., 2013) and was selected to reduce the computational cost over using a three-dimensional periodic structure. The simulations were unrestricted spin, all electron calculations using double-numeric with polarization basis sets (Delley, 1996), and the gradient-corrected VWN-BP functionals for exchange and correlation (Vosko et al., 1980; Becke, 1988; Perdew and Wang, 1992). Thermal smearing of 0.005 Ha was used to speed convergence of the self-consistent field iterations. Energies of reactant and product species were calculated in separate simulations. Implicit solvation was incorporated using the COSMO-ibs polarizable continuum model (Klamt and Schüürmann, 1993; Delley, 2006). Frequency calculations were performed to determine zero-point vibrational energies, thermal corrections, and to confirm energy minima. Standard Gibbs free energies of reaction (\documentclass{aastex}\usepackage{amsbsy}\usepackage{amsfonts}\usepackage{amssymb}\usepackage{bm}\usepackage{mathrsfs}\usepackage{pifont}\usepackage{stmaryrd}\usepackage{textcomp}\usepackage{portland, xspace}\usepackage{amsmath, amsxtra}\usepackage{upgreek}\pagestyle{empty}\DeclareMathSizes{10}{9}{7}{6}\begin{document}
$$\Delta {G}_\textbf{\textit{r}}^\textbf{\textit{o}}$$
\end{document}) were calculated for adsorption of \documentclass{aastex}\usepackage{amsbsy}\usepackage{amsfonts}\usepackage{amssymb}\usepackage{bm}\usepackage{mathrsfs}\usepackage{pifont}\usepackage{stmaryrd}\usepackage{textcomp}\usepackage{portland, xspace}\usepackage{amsmath, amsxtra}\usepackage{upgreek}\pagestyle{empty}\DeclareMathSizes{10}{9}{7}{6}\begin{document}
$${ \rm{HN}}{ \left( {{ \rm{C}}{{ \rm{H}}_2}{ \rm{P}}{{ \rm{O}}_3}} \right) _3}{ \rm{H}}_2^{3 - }$$
\end{document} onto a negatively charged adsorption site, \documentclass{aastex}\usepackage{amsbsy}\usepackage{amsfonts}\usepackage{amssymb}\usepackage{bm}\usepackage{mathrsfs}\usepackage{pifont}\usepackage{stmaryrd}\usepackage{textcomp}\usepackage{portland, xspace}\usepackage{amsmath, amsxtra}\usepackage{upgreek}\pagestyle{empty}\DeclareMathSizes{10}{9}{7}{6}\begin{document}
$${ \left( {{ \rm{Fe}}{{ \rm{O}}_5}} \right) _2}{ \rm{H}}_{13}^{1 - }$$
\end{document}. Although this is not the predominant NTMP species under the experimental conditions, it had the most energetically favorable adsorption of the three most predominant NTMP species. Adsorption of a minor species will shift the aqueous-phase equilibrium to produce more of that species. Thus, even when a species may only represent a small fraction of the overall NTMP, it can still account for the majority of adsorption. A second reason for using \documentclass{aastex}\usepackage{amsbsy}\usepackage{amsfonts}\usepackage{amssymb}\usepackage{bm}\usepackage{mathrsfs}\usepackage{pifont}\usepackage{stmaryrd}\usepackage{textcomp}\usepackage{portland, xspace}\usepackage{amsmath, amsxtra}\usepackage{upgreek}\pagestyle{empty}\DeclareMathSizes{10}{9}{7}{6}\begin{document}
$${ \rm{HN}}{ \left( {{ \rm{C}}{{ \rm{H}}_2}{ \rm{P}}{{ \rm{O}}_3}} \right) _3}{ \rm{H}}_2^{3 - }$$
\end{document} in the reaction modeling is that it had protonated -POH groups that could react with -FeOH to produce H2O through the condensation reactions. Production of H2O as the reaction product rather than OH– makes the calculated \documentclass{aastex}\usepackage{amsbsy}\usepackage{amsfonts}\usepackage{amssymb}\usepackage{bm}\usepackage{mathrsfs}\usepackage{pifont}\usepackage{stmaryrd}\usepackage{textcomp}\usepackage{portland, xspace}\usepackage{amsmath, amsxtra}\usepackage{upgreek}\pagestyle{empty}\DeclareMathSizes{10}{9}{7}{6}\begin{document}
$$\Delta G_r^o$$
\end{document} values more representative of experimental conditions, where H2O, but not OH–, is at close to unit activity.
Dissolved silica was modeled as orthosilicic acid, which is the predominant dissolved silica species under the experimental conditions (Nikolaychuk, 2014) and had the most energetically favorable adsorption among the dissolved silica species. Sodium atoms were included in the calculations to balance the negative charges on the deprotonated acid species. To limit the scope of modeling, other ions present in RO concentrates that may affect phosphonate adsorption have not been included in these simulations. Because of disparities between modeled and experimental systems, and approximations involved in the DFT formalism, the modeling results are likely not accurate to within ± 5 kcal/mol for the calculated reactions (Paul et al., 2006; Zhu et al., 2009). Thus, they are useful for assessing the relative thermodynamic favorability of different possible reactions, but are not useful for determining accurate equilibrium constants.
Results and Discussion
Column breakthrough experiments
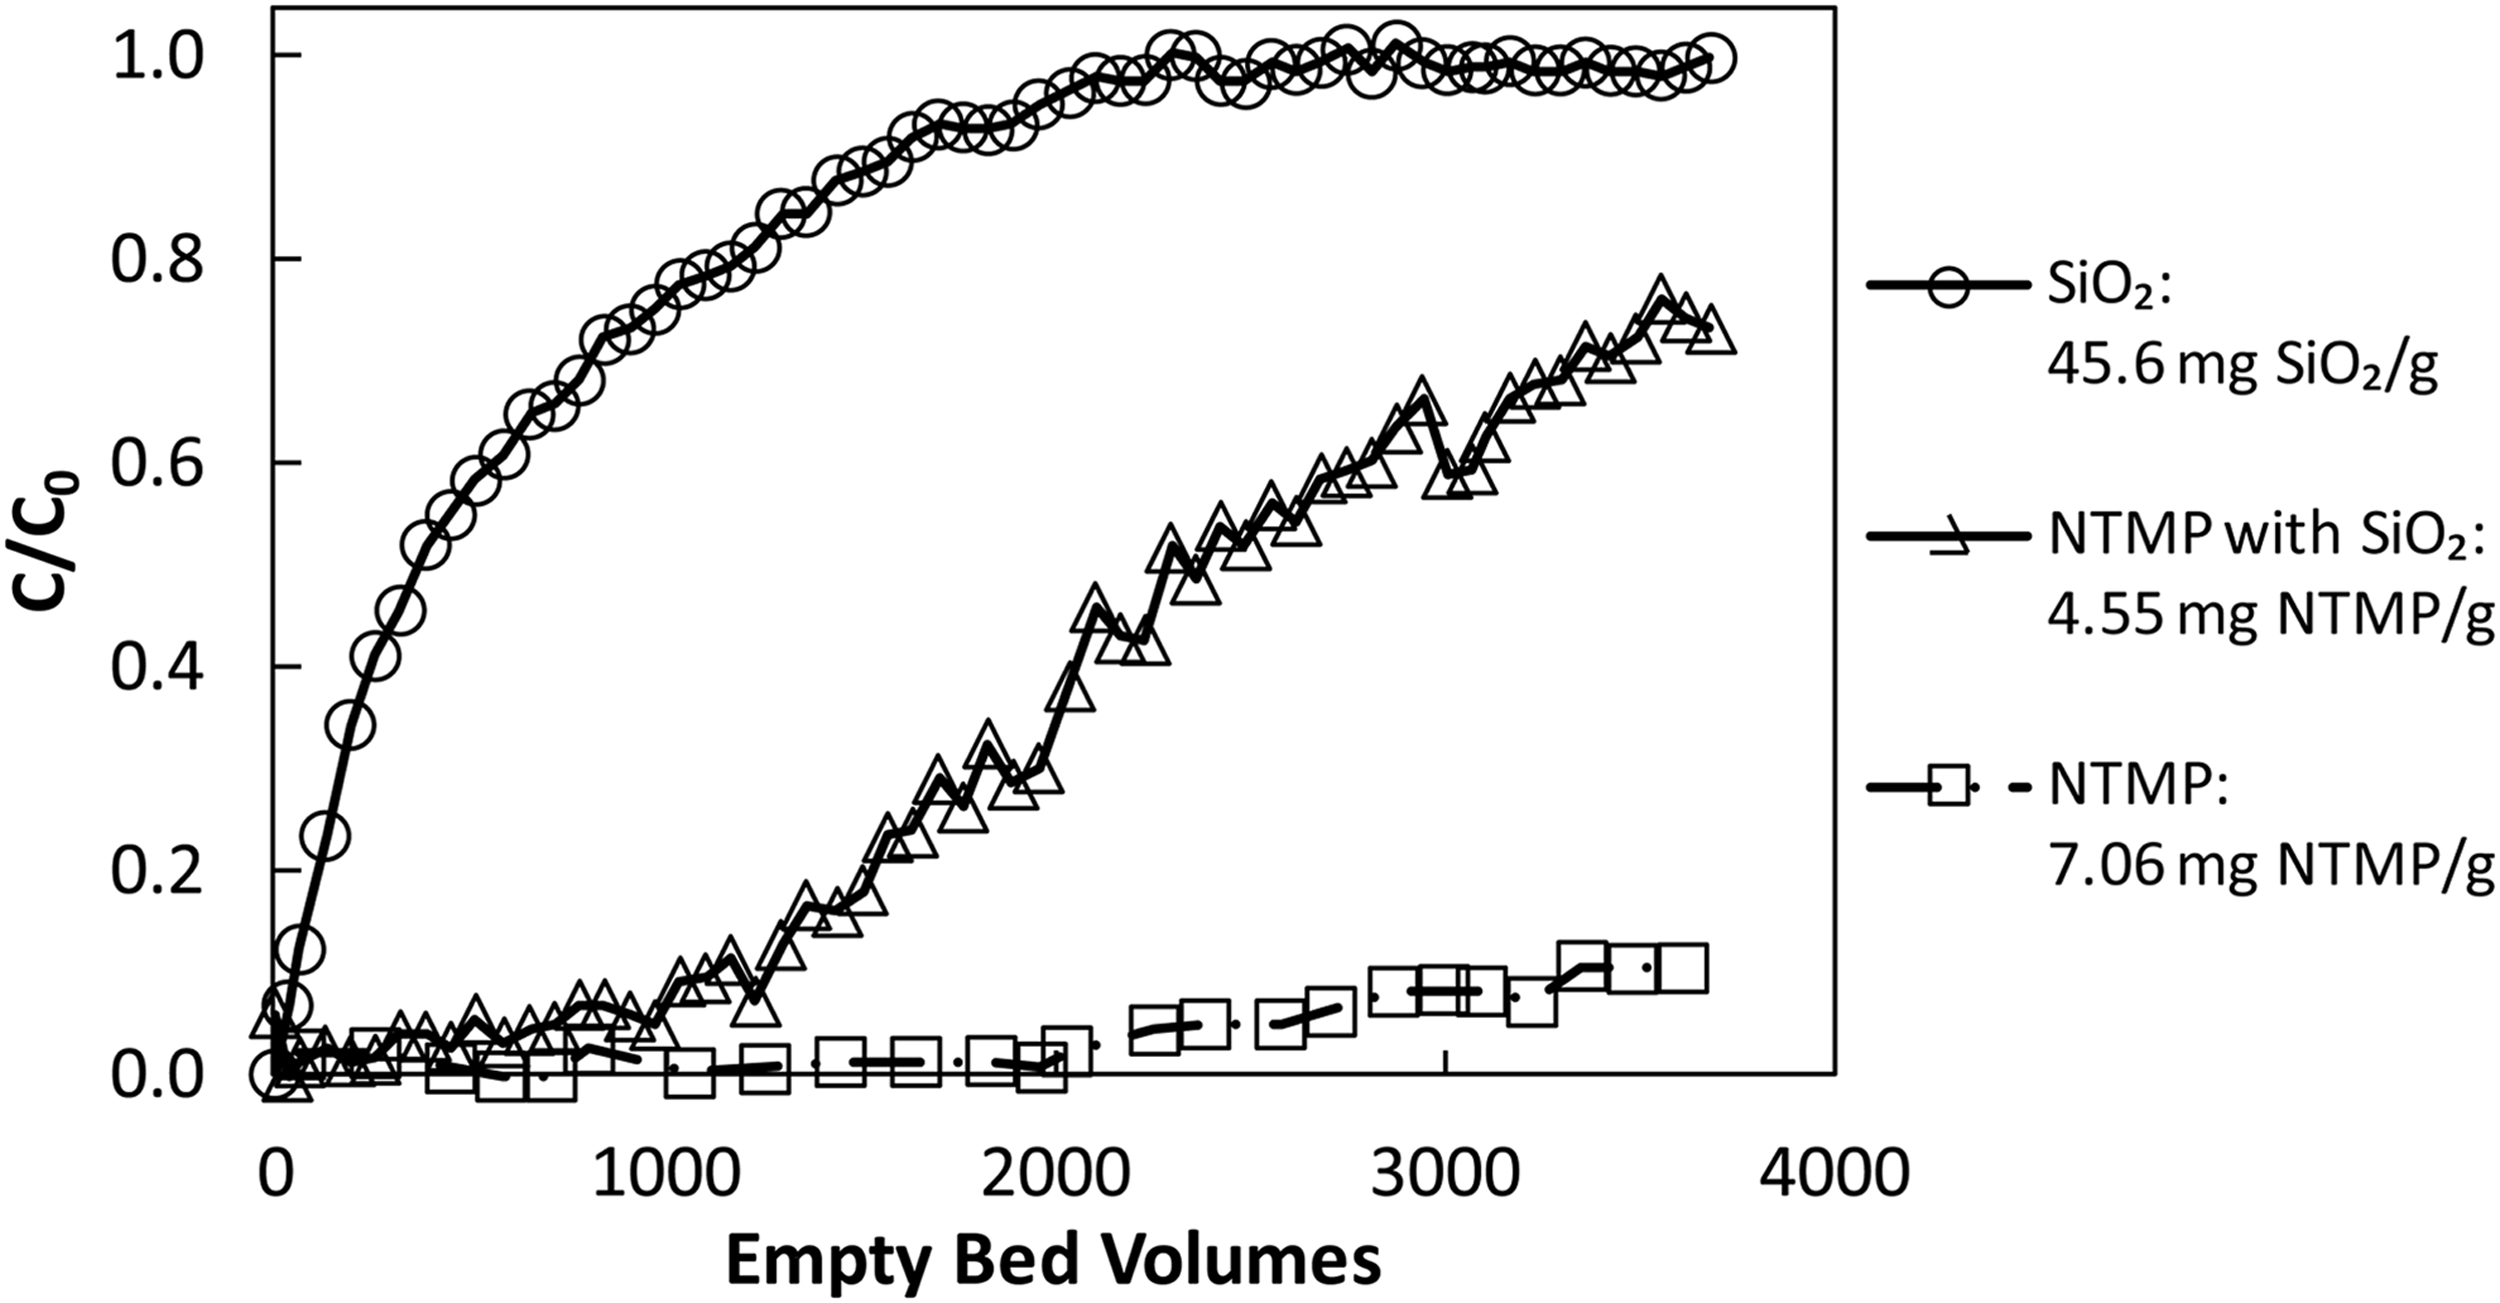
Figure 1 shows NTMP breakthrough profiles on two columns of GFH with 0 and 86 mg/L SiO2. In the column without silica, near-complete NTMP removal (>98.5%) was observed for ∼2,000 empty bed volumes, and after 3,685 bed volumes, less than 10% breakthrough was observed. However, in the presence of silica, near-complete (98.5%) removal was observed for only 200 bed volumes, and 10% breakthrough occurred after 1,200 empty bed volumes. After 3,685 bed volumes, silica decreased NTMP adsorption by 36%, from 7.06 to 4.55 mg/g. At this point, the molar uptake of silica (759 μmol/g) was a factor of 50 times greater than that for NTMP (15.2 μmol/g), while the aqueous-phase molar concentration of silica was a factor of 214 times greater than that for NTMP.
Breakthrough profiles for NTMP and dissolved silica on two columns of GFH operated with empty bed contact times of 2.0 min for feed concentrations (Co) of NTMP Co = 2.0 mg/L and SiO2 Co = 0 or 86 mg/L. NTMP, nitrilotris(methylenephosphonic acid).
where \documentclass{aastex}\usepackage{amsbsy}\usepackage{amsfonts}\usepackage{amssymb}\usepackage{bm}\usepackage{mathrsfs}\usepackage{pifont}\usepackage{stmaryrd}\usepackage{textcomp}\usepackage{portland, xspace}\usepackage{amsmath, amsxtra}\usepackage{upgreek}\pagestyle{empty}\DeclareMathSizes{10}{9}{7}{6}\begin{document}
$${{ \rm{q}}_{{ \rm{NTMP}}}}$$
\end{document} and \documentclass{aastex}\usepackage{amsbsy}\usepackage{amsfonts}\usepackage{amssymb}\usepackage{bm}\usepackage{mathrsfs}\usepackage{pifont}\usepackage{stmaryrd}\usepackage{textcomp}\usepackage{portland, xspace}\usepackage{amsmath, amsxtra}\usepackage{upgreek}\pagestyle{empty}\DeclareMathSizes{10}{9}{7}{6}\begin{document}
$${{ \rm{q}}_{{ \rm{Si}}{{ \rm{O}}_2}}}$$
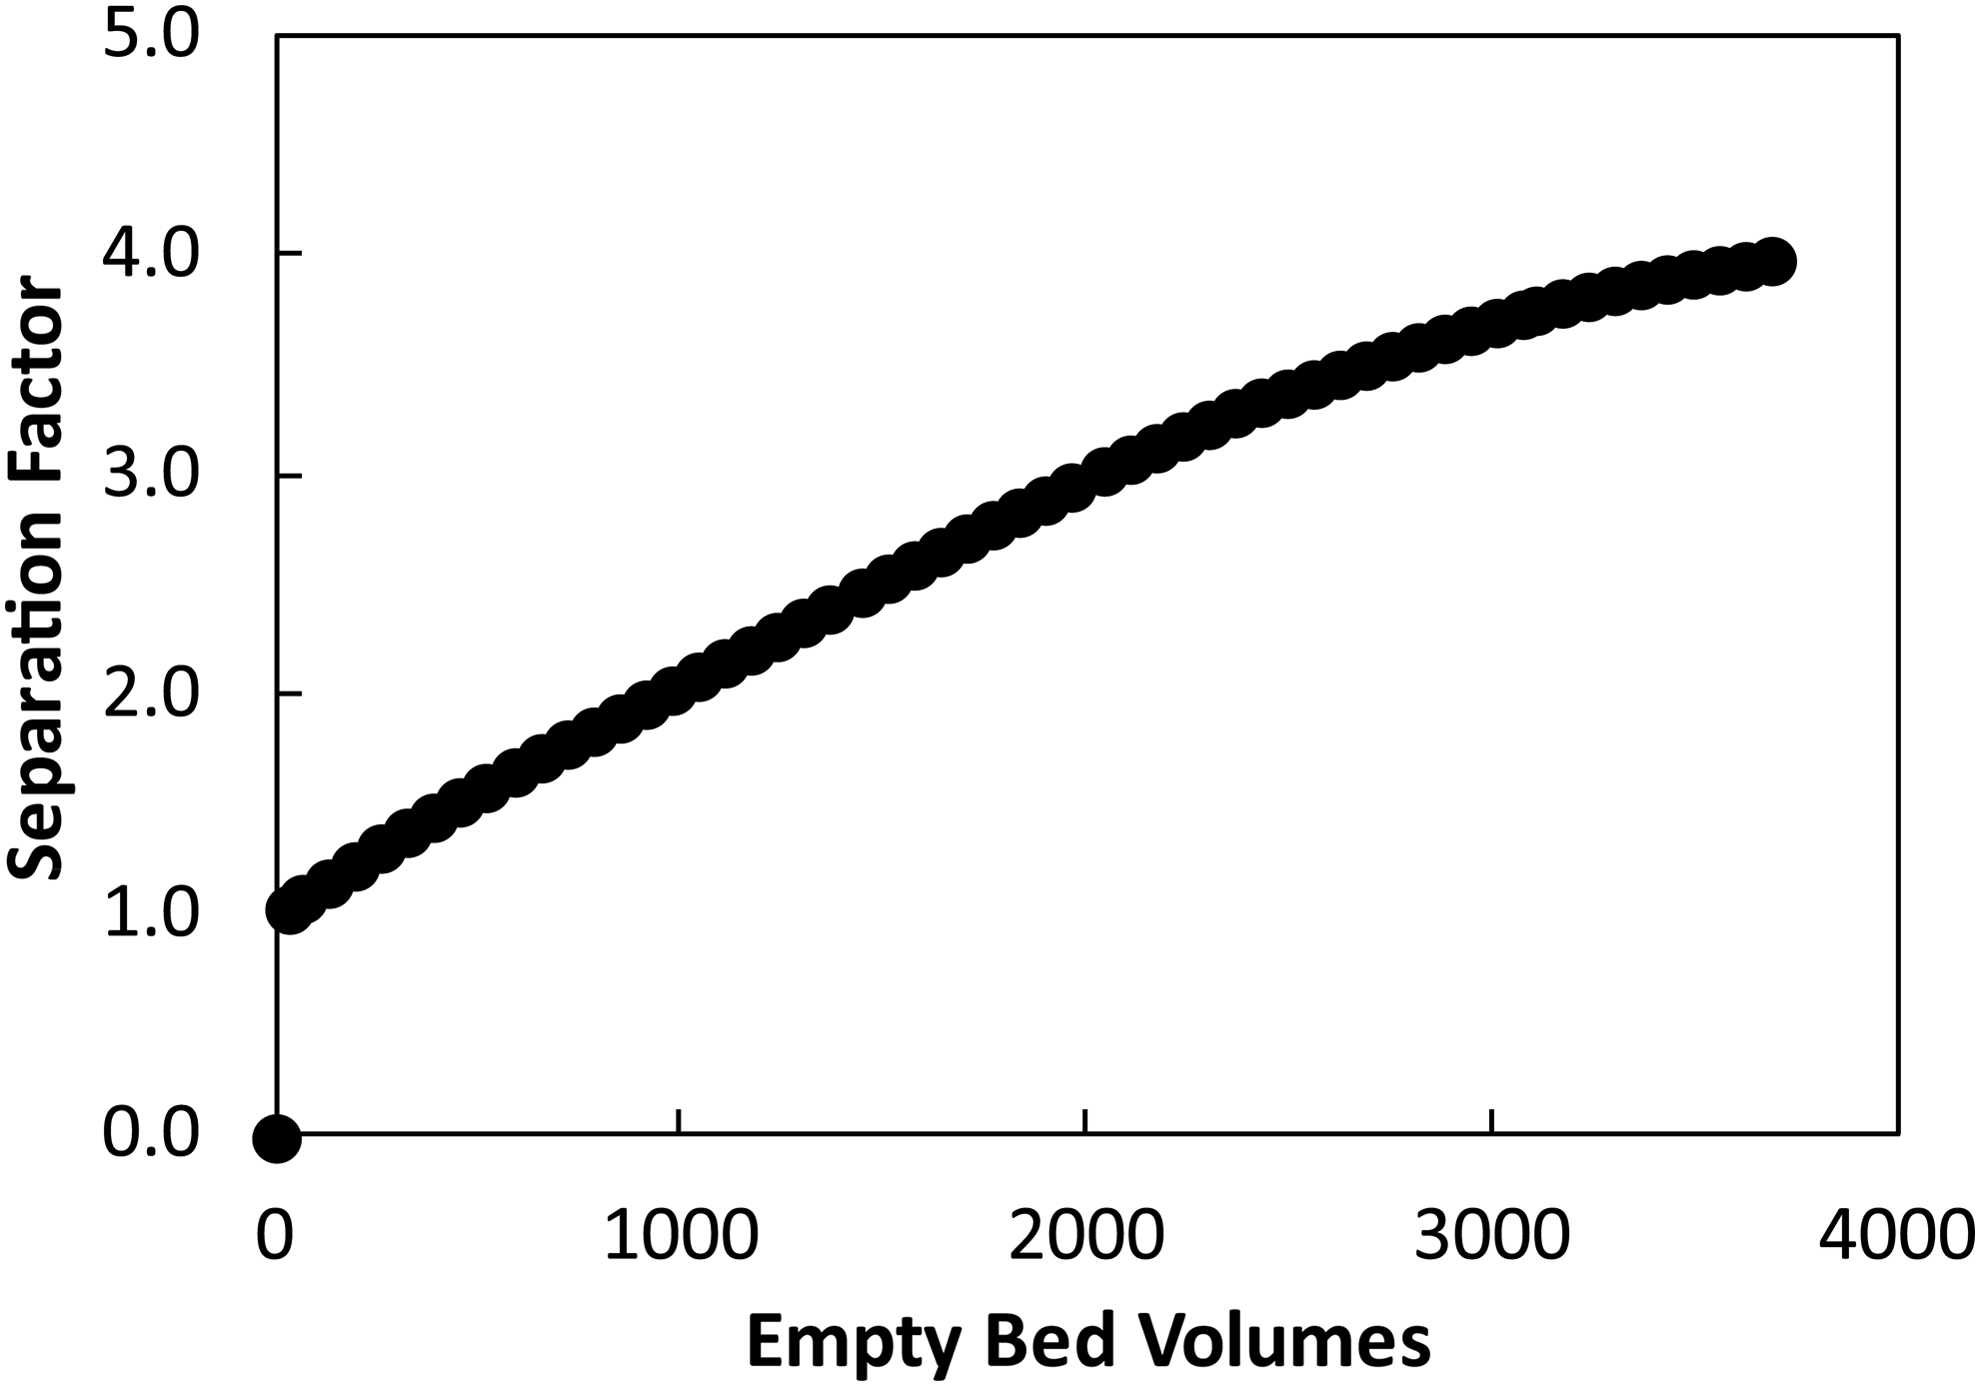
\end{document} are the adsorbed-phase concentrations of NTMP and silica in molar units, and {NTMP5−} and {Si(OH)4} are the dimensionless aqueous-phase activities of NTMP and silica. Figure 2 compares the \documentclass{aastex}\usepackage{amsbsy}\usepackage{amsfonts}\usepackage{amssymb}\usepackage{bm}\usepackage{mathrsfs}\usepackage{pifont}\usepackage{stmaryrd}\usepackage{textcomp}\usepackage{portland, xspace}\usepackage{amsmath, amsxtra}\usepackage{upgreek}\pagestyle{empty}\DeclareMathSizes{10}{9}{7}{6}\begin{document}
$${ \alpha }_{{ \rm{Si}}{{ \rm{O}}_2}}^{{ \rm{NTMP}}}$$
\end{document} over the course of the experiment depicted in Fig. 1. At the commencement of the experiment when there was no competition for adsorption sites, \documentclass{aastex}\usepackage{amsbsy}\usepackage{amsfonts}\usepackage{amssymb}\usepackage{bm}\usepackage{mathrsfs}\usepackage{pifont}\usepackage{stmaryrd}\usepackage{textcomp}\usepackage{portland, xspace}\usepackage{amsmath, amsxtra}\usepackage{upgreek}\pagestyle{empty}\DeclareMathSizes{10}{9}{7}{6}\begin{document}
$${ \alpha}_{{ \rm{Si}}{{ \rm{O}}_2}}^{{ \rm{NTMP}}}$$
\end{document} was equal to 1. As the adsorbent loading increased, the selectivity factor gradually increased to a final value near 4. This indicates that adsorption of NTMP was more energetically favorable than that for silica.
Separation factor \documentclass{aastex}\usepackage{amsbsy}\usepackage{amsfonts}\usepackage{amssymb}\usepackage{bm}\usepackage{mathrsfs}\usepackage{pifont}\usepackage{stmaryrd}\usepackage{textcomp}\usepackage{portland, xspace}\usepackage{amsmath, amsxtra}\usepackage{upgreek}\pagestyle{empty}\DeclareMathSizes{10}{9}{7}{6}\begin{document}
$${\alpha}_{{ \rm{Si}}{{ \rm{O}}_2}}^{{ \rm{NTMP}}}$$
\end{document} for dual adsorbate breakthrough experiment shown in Fig. 1.
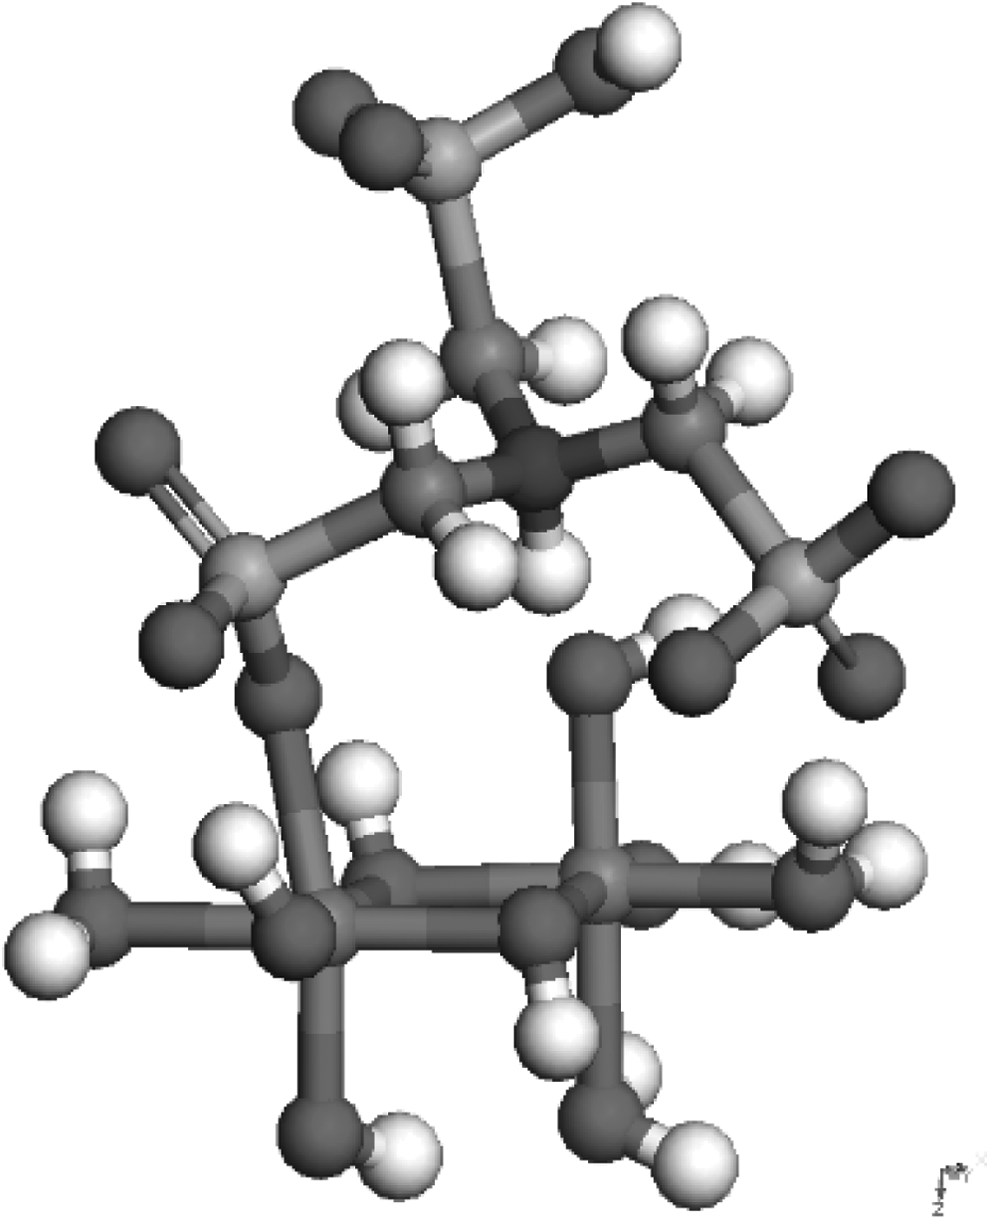
DFT modeling was used to calculate the relative thermodynamic favorability for possible adsorption reactions and thereby give insight into adsorption mechanisms. One monodentate and two bidentate complexes were identified for NTMP adsorption on ferric hydroxide. The reaction forming the monodentate complex illustrated in Fig. 3 can be expressed as follows:
\documentclass{aastex}\usepackage{amsbsy}\usepackage{amsfonts}\usepackage{amssymb}\usepackage{bm}\usepackage{mathrsfs}\usepackage{pifont}\usepackage{stmaryrd}\usepackage{textcomp}\usepackage{portland, xspace}\usepackage{amsmath, amsxtra}\usepackage{upgreek}\pagestyle{empty}\DeclareMathSizes{10}{9}{7}{6}\begin{document}
\begin{align*}
&{ \left( {{ \rm{Fe}} {{ \rm{O}}_5}} \right) _2} { \rm{H}}_{13}^
- + { \rm{HN}}{ \left( {{ \rm{C}}{{ \rm{H}}_2}{ \rm{P}}{{
\rm{O}}_3}} \right) _3}{ \rm{H}}_2^{3 - } + 4{ \rm{N}}{{ \rm{a}}^
+ } \\ & \quad \longrightarrow {\left( {{ \rm{Fe}}{{ \rm{O}}_4}}
\right) _2}{ \rm{O}}{{ \rm{H}}_{12}} - { \rm{HN}}{ \left( {{
\rm{C}}{{ \rm{H}}_2}{ \rm{P}}{{ \rm{O}}_3}} \right) _3}{{
\rm{H}}^{4 - }} + 4{ \rm{N}}{{ \rm{a}}^ + } + {{ \rm{H}}_2}{
\rm{O}} \tag{2}
\end{align*}
\end{document}
Monodentate complex between NTMP and ferric hydroxide. A color illustration and the locations of the charge compensating Na+ ions are shown in Supplementary Figure S2 in the Supplementary Data.
This reaction has a \documentclass{aastex}\usepackage{amsbsy}\usepackage{amsfonts}\usepackage{amssymb}\usepackage{bm}\usepackage{mathrsfs}\usepackage{pifont}\usepackage{stmaryrd}\usepackage{textcomp}\usepackage{portland, xspace}\usepackage{amsmath, amsxtra}\usepackage{upgreek}\pagestyle{empty}\DeclareMathSizes{10}{9}{7}{6}\begin{document}
$$\Delta G_r^o$$
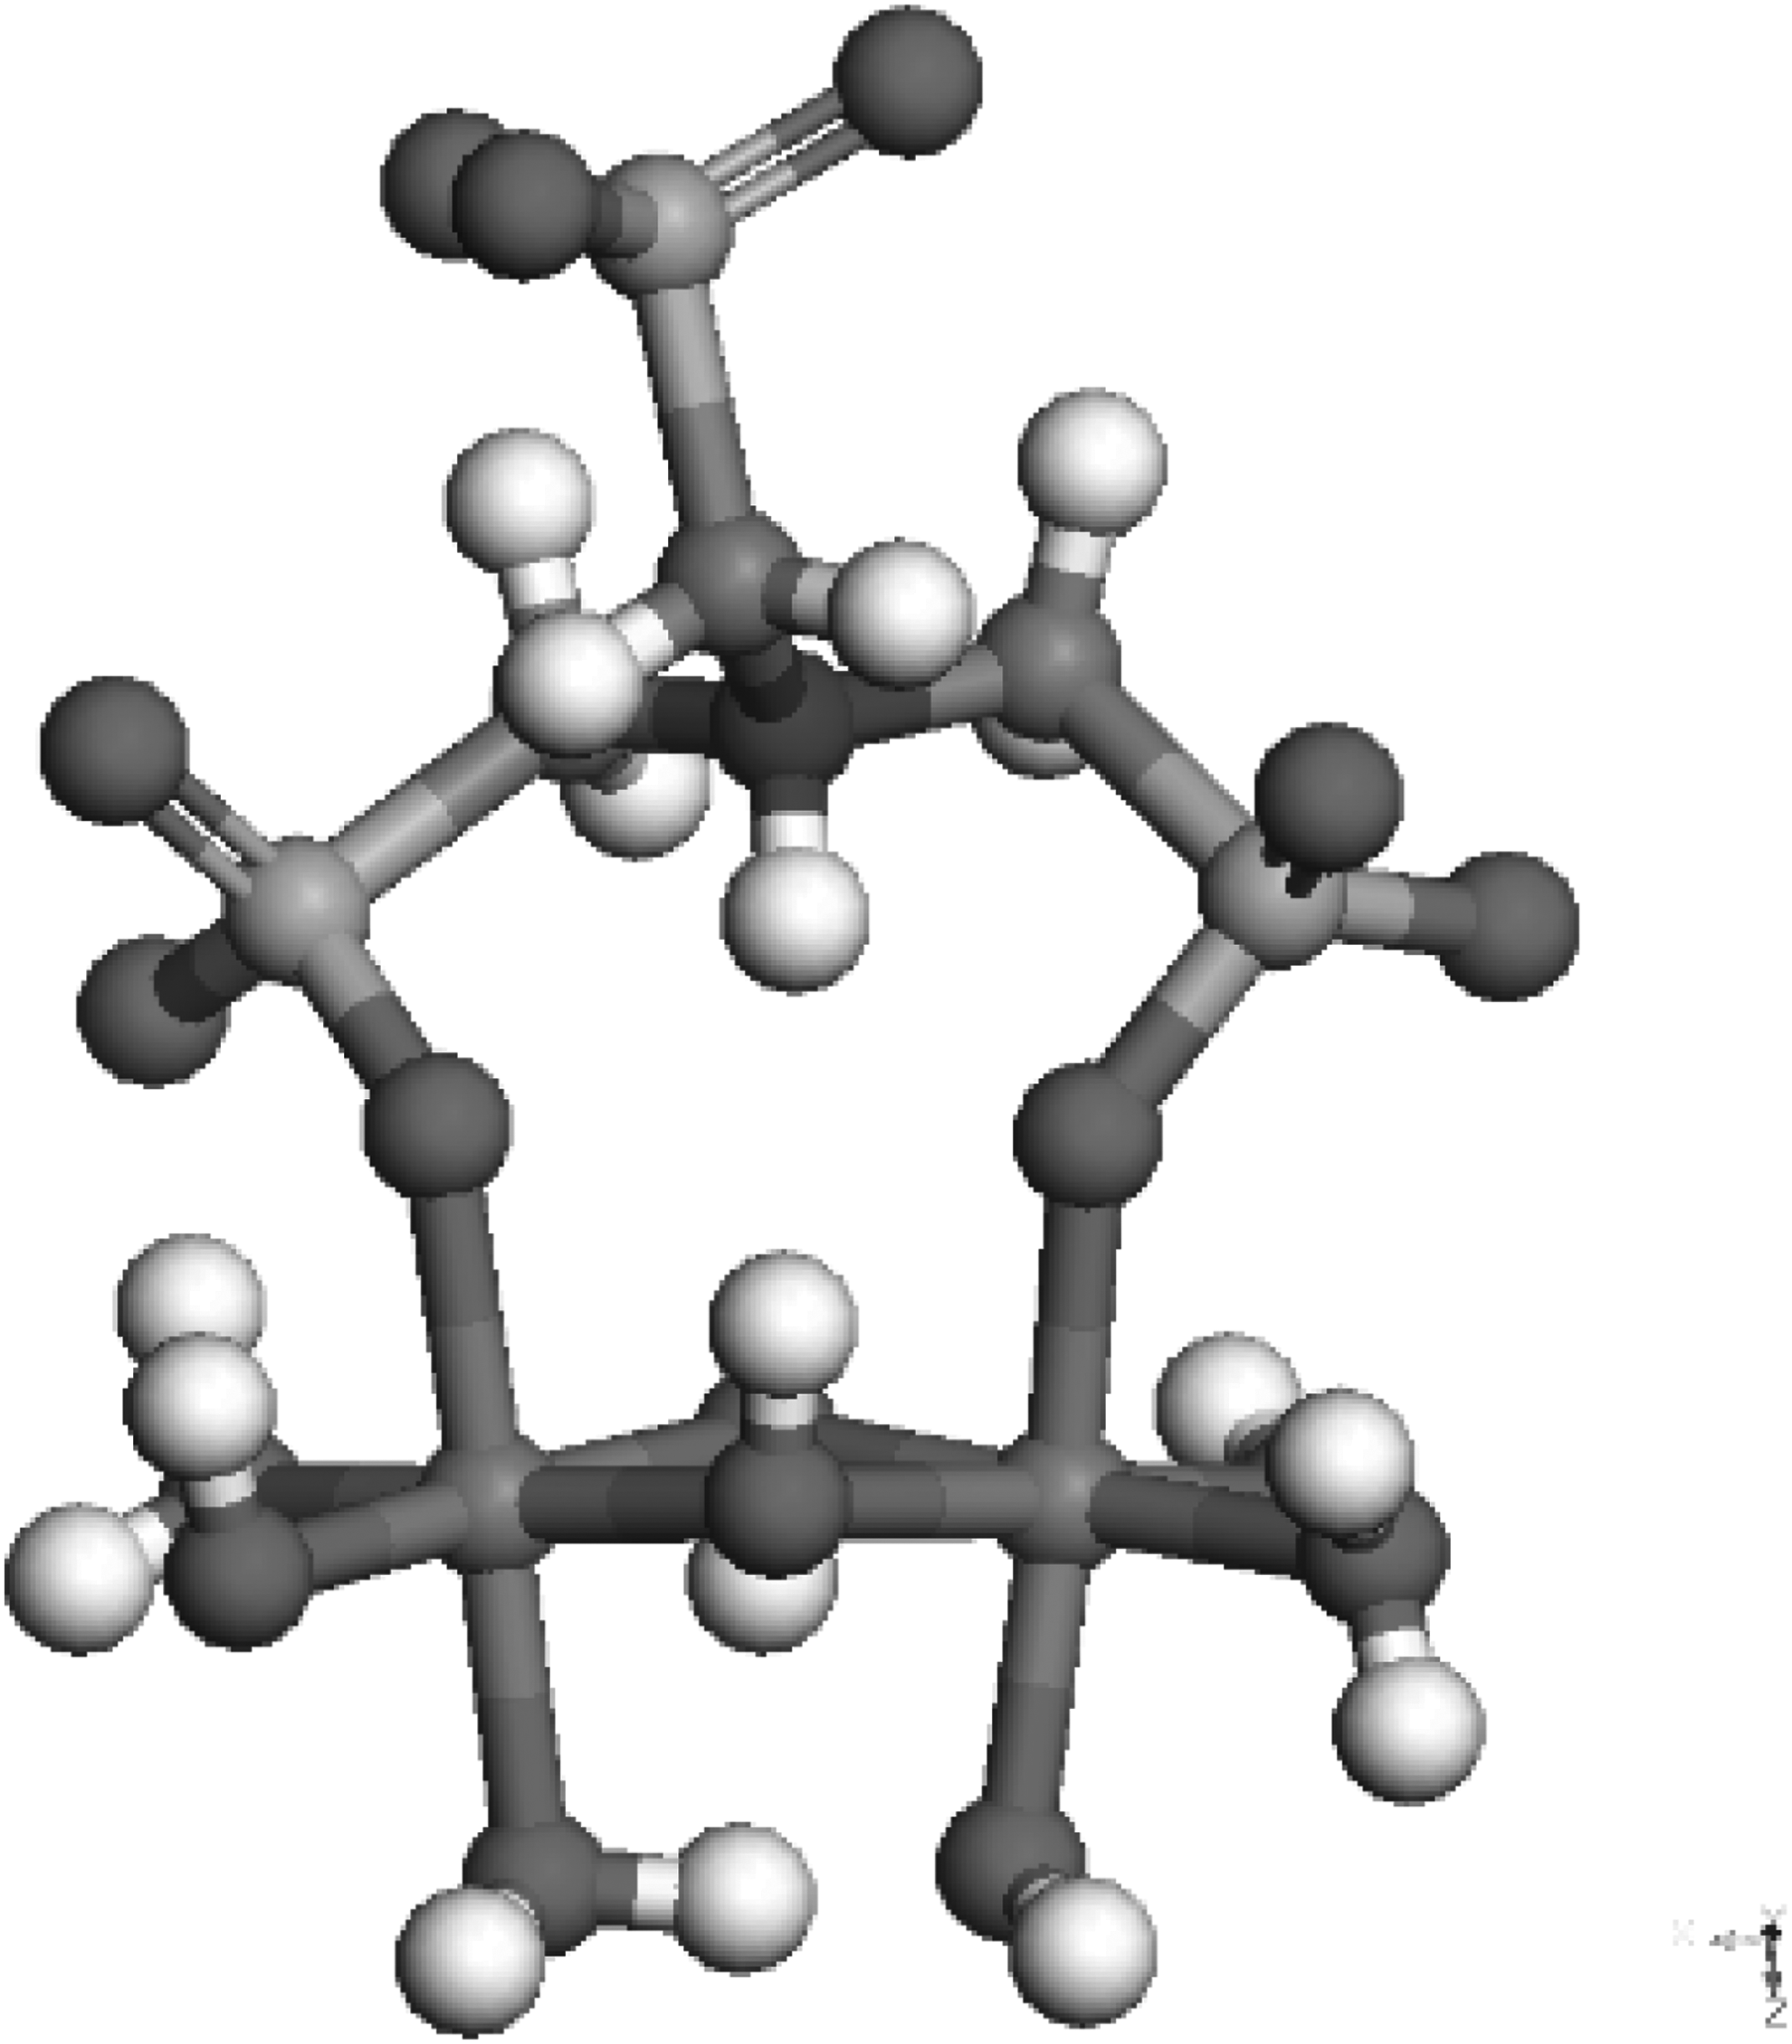
\end{document} = −12.8 kcal/mol. A bidentate mononuclear complex may also form between a single phosphonate group and two adjacent Fe(III) atoms, as illustrated in Fig. 4. The reaction for this is given as follows:
\documentclass{aastex}\usepackage{amsbsy}\usepackage{amsfonts}\usepackage{amssymb}\usepackage{bm}\usepackage{mathrsfs}\usepackage{pifont}\usepackage{stmaryrd}\usepackage{textcomp}\usepackage{portland, xspace}\usepackage{amsmath, amsxtra}\usepackage{upgreek}\pagestyle{empty}\DeclareMathSizes{10}{9}{7}{6}\begin{document}
\begin{align*}
& {\left( {{ \rm{Fe}}{{ \rm{O}}_5}} \right) _2}{ \rm{H}}_{13}^{1 -
} + {\rm{HN}}{ \left( {{ \rm{C}}{{ \rm{H}}_2}{ \rm{P}}{{
\rm{O}}_3}} \right) _3}{ \rm{H}}_2^{3 - } + 4{ \rm{N}}{{ \rm{a}}^
+ } \\ & \quad \longrightarrow {\left( {{ \rm{Fe}}}{{
\rm{O}}_4}\right) _2} {{ \rm{H}}_{10}} - {\rm{HN}}{\left( {{
\rm{C}}{{ \rm{H}}_2}{ \rm{P}}{{ \rm{O}}_3}} \right)_3}{{
\rm{H}}^{4 - } + 4{ \rm{N}}{{ \rm{a}}^ + } + 2{{ \rm{H}}_2}{
\rm{O}}} \tag{3}
\end{align*}
\end{document}
and the reaction energy is \documentclass{aastex}\usepackage{amsbsy}\usepackage{amsfonts}\usepackage{amssymb}\usepackage{bm}\usepackage{mathrsfs}\usepackage{pifont}\usepackage{stmaryrd}\usepackage{textcomp}\usepackage{portland, xspace}\usepackage{amsmath, amsxtra}\usepackage{upgreek}\pagestyle{empty}\DeclareMathSizes{10}{9}{7}{6}\begin{document}
$$\Delta G_r^o$$
\end{document} = −17.1 kcal/mol.
Bidentate mononuclear complex between NTMP and ferric hydroxide. A color illustration and the locations of the charge-compensating Na+ ions are shown in Supplementary Fig. S3 in the Supplementary Data.
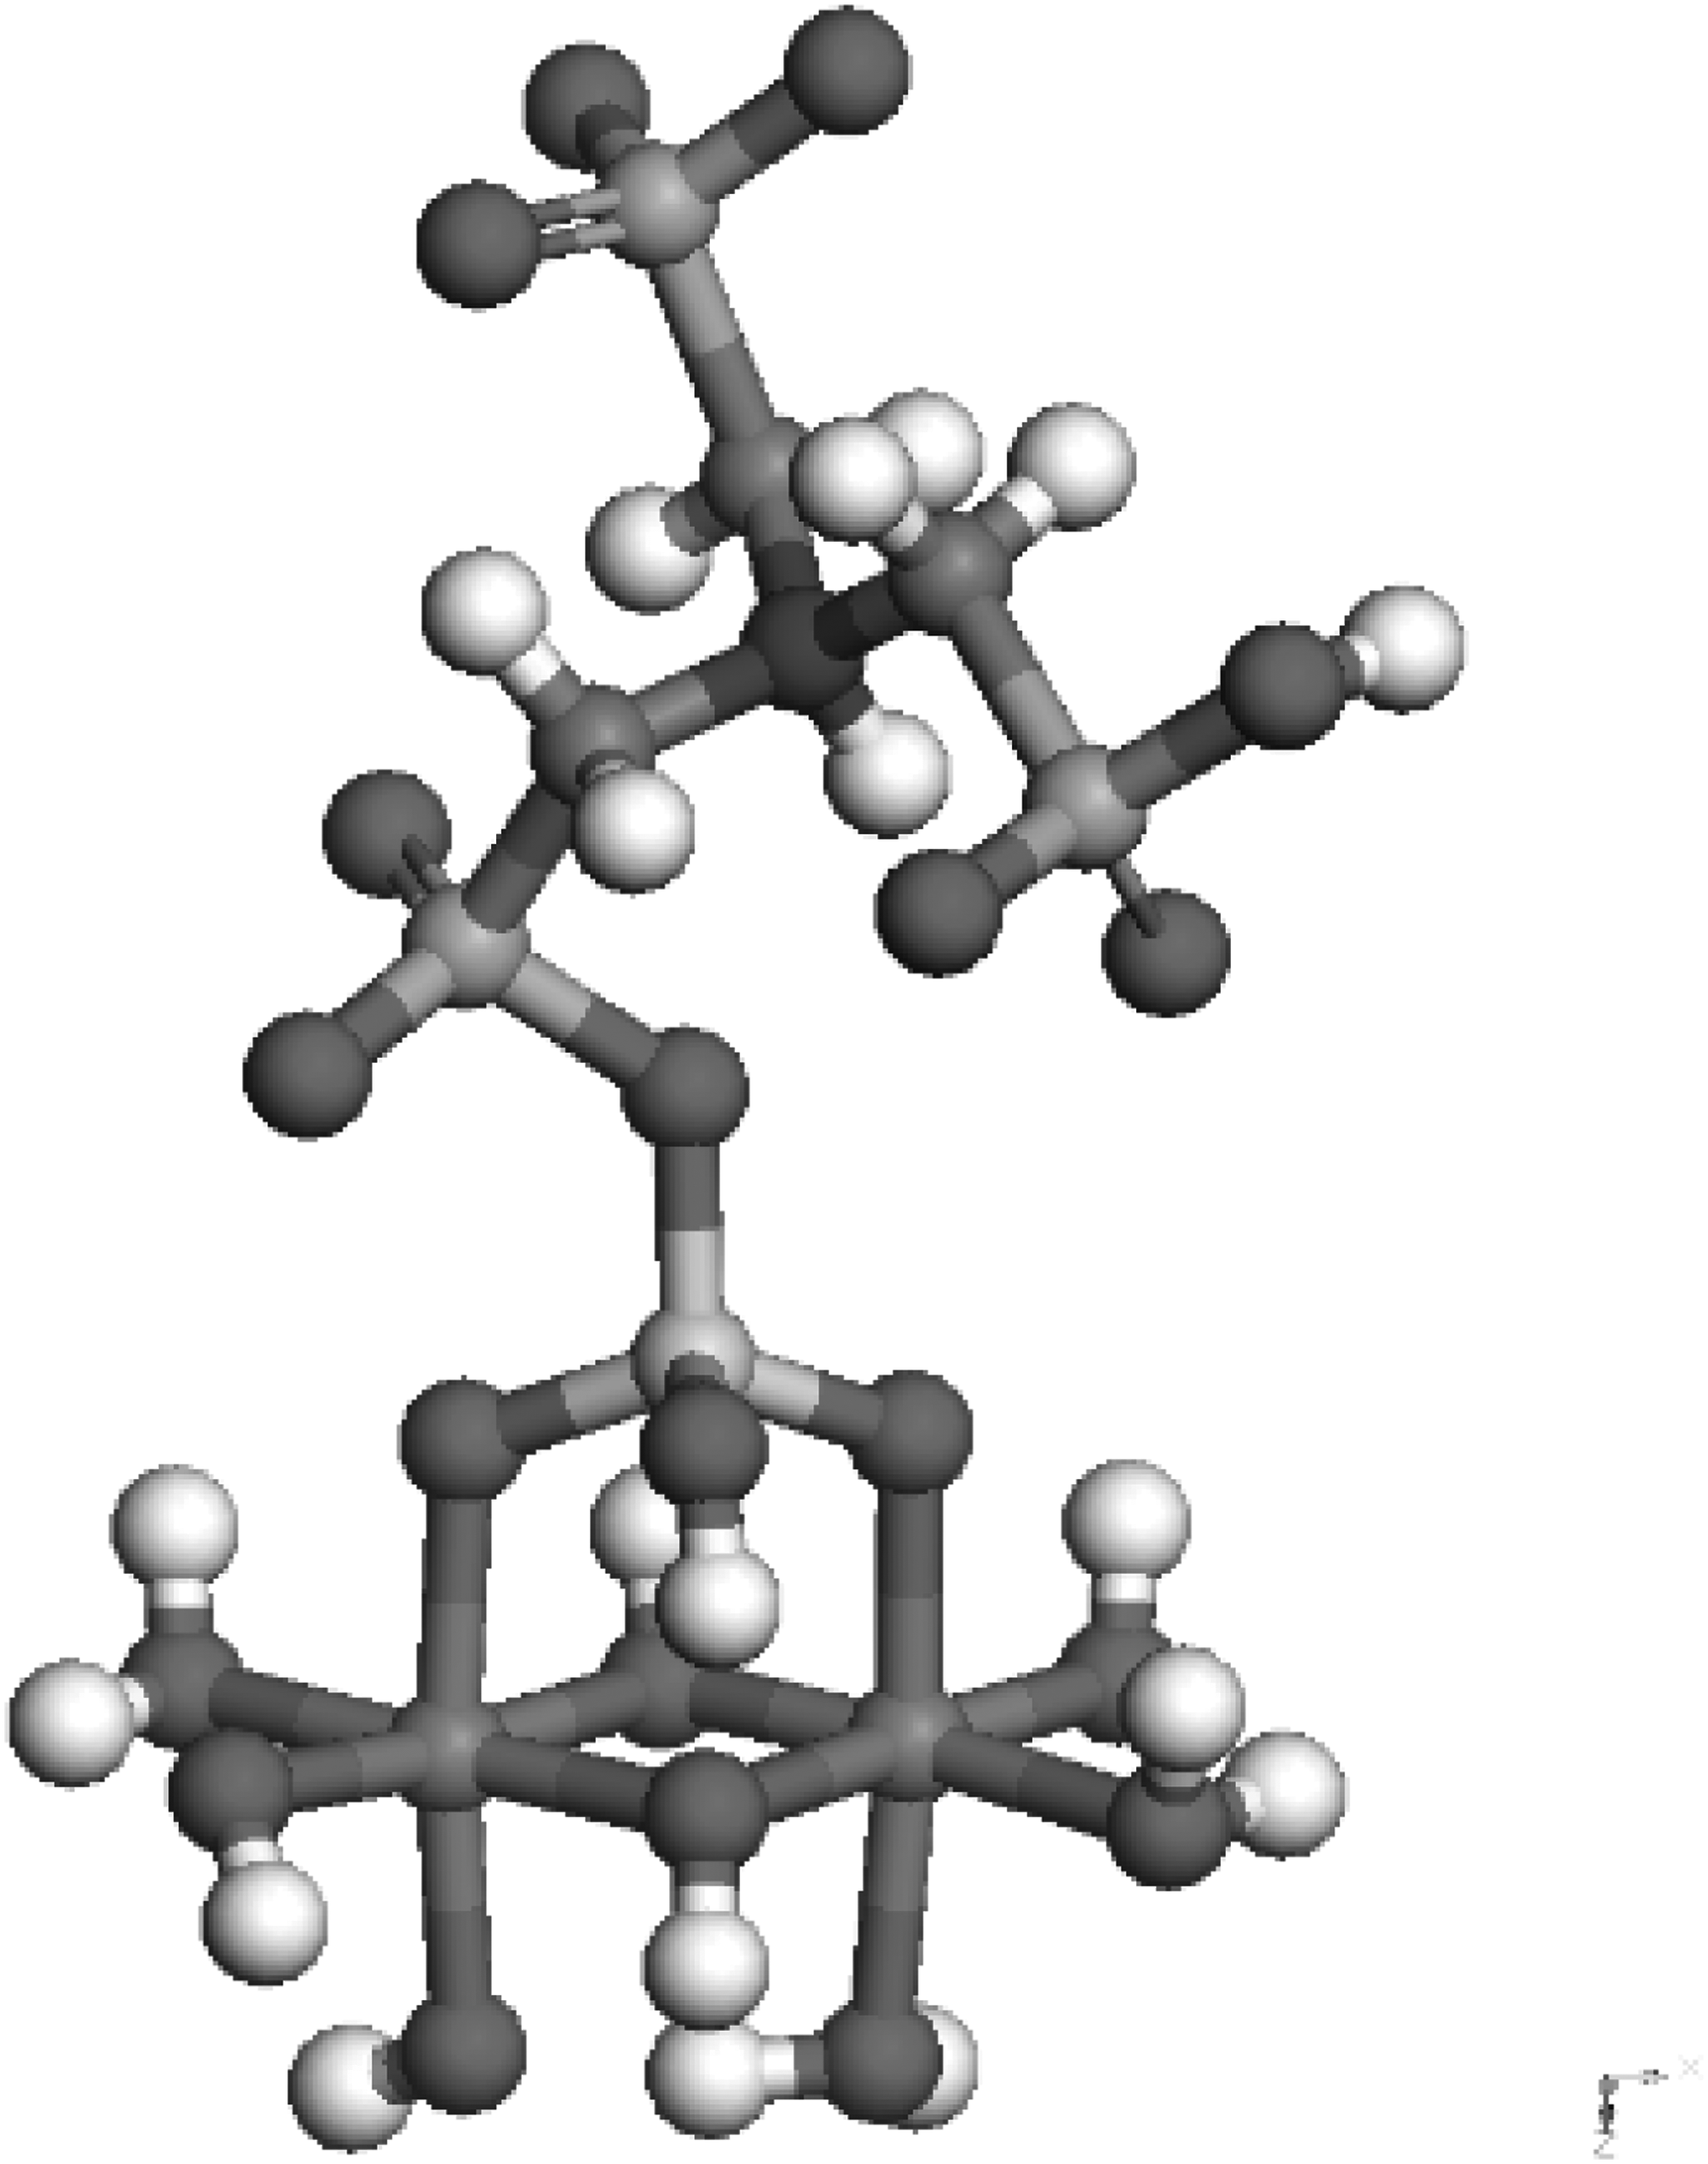
In addition, a bidentate binuclear complex may also form through reaction of two different phosphonate groups, as illustrated in Fig. 5. This reaction can be expressed as follows:
\documentclass{aastex}\usepackage{amsbsy}\usepackage{amsfonts}\usepackage{amssymb}\usepackage{bm}\usepackage{mathrsfs}\usepackage{pifont}\usepackage{stmaryrd}\usepackage{textcomp}\usepackage{portland, xspace}\usepackage{amsmath, amsxtra}\usepackage{upgreek}\pagestyle{empty}\DeclareMathSizes{10}{9}{7}{6}\begin{document}
\begin{align*}
&{ \left( {{ \rm{Fe}}{{ \rm{O}}_5}} \right) _2}{ \rm{H}}_{13}^{1 -
} + { \rm{ \;HN}}{ \left( {{ \rm{C}}{{ \rm{H}}_2}{ \rm{P}}{{
\rm{O}}_3}} \right) _3}{ \rm{H}}_2^{3 - } + 4{ \rm{N}}{{ \rm{a}}^
+ } \\ & \quad \longrightarrow { \left( {{ \rm{Fe}}{{ \rm{O}}_4}}
\right) _2}{{ \rm{H}}_{11}} - { \rm{HN}} \left( {{ \rm{C}}{{
\rm{H}}_2}{ \rm{P}}{{ \rm{O}}_3}} \right) _3^{4 - } + 4{
\rm{N}}{{ \rm{a}}^ + } + 2{ \rm{}}{{ \rm{H}}_2}{ \rm{O}} \tag{4}
\end{align*}
\end{document}
Bidentate binuclear complex between NTMP and ferric hydroxide. A color illustration and the locations of the charge-compensating Na+ ions are shown in Supplementary Fig. S4 in the Supplementary Data.
The reaction energy for this bidentate complex is \documentclass{aastex}\usepackage{amsbsy}\usepackage{amsfonts}\usepackage{amssymb}\usepackage{bm}\usepackage{mathrsfs}\usepackage{pifont}\usepackage{stmaryrd}\usepackage{textcomp}\usepackage{portland, xspace}\usepackage{amsmath, amsxtra}\usepackage{upgreek}\pagestyle{empty}\DeclareMathSizes{10}{9}{7}{6}\begin{document}
$$\Delta G_r^o$$
\end{document} = −24.8 kcal/mol.
Silica may also form mono- and bidentate complexes, as illustrated in Supplementary Figs. S5 and S6. For monodentate complex formation at the pH value of the experiments, the reaction can be expressed as
\documentclass{aastex}\usepackage{amsbsy}\usepackage{amsfonts}\usepackage{amssymb}\usepackage{bm}\usepackage{mathrsfs}\usepackage{pifont}\usepackage{stmaryrd}\usepackage{textcomp}\usepackage{portland, xspace}\usepackage{amsmath, amsxtra}\usepackage{upgreek}\pagestyle{empty}\DeclareMathSizes{10}{9}{7}{6}\begin{document}
\begin{align*}
{ \left( {{ \rm{Fe}}{{ \rm{O}}_5}} \right) _2}{ \rm{H}}_{13}^{1 - } + { \rm{Si}}{ \left( {{ \rm{OH}}} \right) _4} \to { \left( {{ \rm{Fe}}{{ \rm{O}}_5}} \right) _2}{ \rm{Si}}{{ \rm{O}}_3}{ \rm{H}}_{15}^{1 - } + {{ \rm{H}}_2}{ \rm{O}} \tag{5}
\end{align*}
\end{document}
with a reaction energy of \documentclass{aastex}\usepackage{amsbsy}\usepackage{amsfonts}\usepackage{amssymb}\usepackage{bm}\usepackage{mathrsfs}\usepackage{pifont}\usepackage{stmaryrd}\usepackage{textcomp}\usepackage{portland, xspace}\usepackage{amsmath, amsxtra}\usepackage{upgreek}\pagestyle{empty}\DeclareMathSizes{10}{9}{7}{6}\begin{document}
$$\Delta G_r^o$$
\end{document} = −13.4 kcal/mol. The reaction for formation of a bidentate complex can be expressed as
\documentclass{aastex}\usepackage{amsbsy}\usepackage{amsfonts}\usepackage{amssymb}\usepackage{bm}\usepackage{mathrsfs}\usepackage{pifont}\usepackage{stmaryrd}\usepackage{textcomp}\usepackage{portland, xspace}\usepackage{amsmath, amsxtra}\usepackage{upgreek}\pagestyle{empty}\DeclareMathSizes{10}{9}{7}{6}\begin{document}
\begin{align*}
{ \left( {{ \rm{Fe}}{{ \rm{O}}_5}} \right) _2}{ \rm{H}}_{13}^{1 - } + { \rm{Si}}{ \left( {{ \rm{OH}}} \right) _4} \to { \left( {{ \rm{Fe}}{{ \rm{O}}_5}} \right) _2}{ \rm{Si}}{{ \rm{O}}_2}{ \rm{H}}_{13}^{1 - } + 2{{ \rm{H}}_2}{ \rm{O}} \tag{6}
\end{align*}
\end{document}
with a reaction energy of \documentclass{aastex}\usepackage{amsbsy}\usepackage{amsfonts}\usepackage{amssymb}\usepackage{bm}\usepackage{mathrsfs}\usepackage{pifont}\usepackage{stmaryrd}\usepackage{textcomp}\usepackage{portland, xspace}\usepackage{amsmath, amsxtra}\usepackage{upgreek}\pagestyle{empty}\DeclareMathSizes{10}{9}{7}{6}\begin{document}
$$\Delta G_r^o$$
\end{document} = −15.4 kcal/mol.
The reaction energies indicate that silica adsorption through both mono- and bidentate modes is more energetically favorable than monodentate NTMP adsorption. However, for both the bidentate complexes, NTMP adsorption is more energetically favorable than silica adsorption. The \documentclass{aastex}\usepackage{amsbsy}\usepackage{amsfonts}\usepackage{amssymb}\usepackage{bm}\usepackage{mathrsfs}\usepackage{pifont}\usepackage{stmaryrd}\usepackage{textcomp}\usepackage{portland, xspace}\usepackage{amsmath, amsxtra}\usepackage{upgreek}\pagestyle{empty}\DeclareMathSizes{10}{9}{7}{6}\begin{document}
$${ \alpha}_{{ \rm{Si}}{{ \rm{O}}_2}}^{{ \rm{NTMP}}}$$
\end{document} values shown in Fig. 2 indicate that NTMP adsorption is favored over silica adsorption. Thus, the reaction energy calculations suggest that bidentate complexes are the preferred mode of NTMP complexation.
Adsorption isotherms
Figure 6 compares adsorption isotherms for NTMP in synthetic concentrate solutions with 0 and 86 mg/L SiO2. In the absence of silica, the adsorption isotherm for NTMP was approximately linear over the concentration range investigated. However, in the presence of dissolved silica, the isotherm became nonlinear, as indicated by the increase in the Freundlich isotherm exponent from 1.08 to 2.40, as shown in Table 2.
Adsorption isotherm for NTMP on GFH at 20°C in pH = 8.3 simulated NF concentrate solutions with 0 and 86 mg/L SiO2. NF, nanofiltration.
Freundlich and Linear Isotherm Parameters for NTMP and Silica Adsorption on GFH
Freundlich parameters
Linear (\documentclass{aastex}\usepackage{amsbsy}\usepackage{amsfonts}\usepackage{amssymb}\usepackage{bm}\usepackage{mathrsfs}\usepackage{pifont}\usepackage{stmaryrd}\usepackage{textcomp}\usepackage{portland, xspace}\usepackage{amsmath, amsxtra}\usepackage{upgreek}\pagestyle{empty}\DeclareMathSizes{10}{9}{7}{6}\begin{document}
$${C_{aq}}$$
\end{document}< 40 mg/L)
K
n
R2
Slope (L/g)
R2
NTMP
1.72
1.08
0.99
NTMP + 86 mg/L SiO2
0.15
2.40
0.98
SiO2
5.80 × 10⁻¹⁶
9.34
0.90
0.40
0.96
SiO2+10 mg/L NTMP
1.67 × 10⁻⁹
5.82
0.83
0.32
0.89
The Freundlich model is given by \documentclass{aastex}\usepackage{amsbsy}\usepackage{amsfonts}\usepackage{amssymb}\usepackage{bm}\usepackage{mathrsfs}\usepackage{pifont}\usepackage{stmaryrd}\usepackage{textcomp}\usepackage{portland, xspace}\usepackage{amsmath, amsxtra}\usepackage{upgreek}\pagestyle{empty}\DeclareMathSizes{10}{9}{7}{6}\begin{document}
$${C_s} = K \times C_{aq}^n$$
\end{document}, and the linear model is \documentclass{aastex}\usepackage{amsbsy}\usepackage{amsfonts}\usepackage{amssymb}\usepackage{bm}\usepackage{mathrsfs}\usepackage{pifont}\usepackage{stmaryrd}\usepackage{textcomp}\usepackage{portland, xspace}\usepackage{amsmath, amsxtra}\usepackage{upgreek}\pagestyle{empty}\DeclareMathSizes{10}{9}{7}{6}\begin{document}
$${C_s} = K \times {C_{aq}}$$
\end{document}.
NTMP, nitrilotris(methylenephosphonic acid).
The mechanism by which adsorbed silica may increase NTMP adsorption was investigated using DFT modeling. In addition to NTMP binding to Fe-O sites on ferric hydroxide, NTMP may also react with an adsorbed silicic acid residue, as illustrated in Fig. 7. This reaction can be expressed as follows:
\documentclass{aastex}\usepackage{amsbsy}\usepackage{amsfonts}\usepackage{amssymb}\usepackage{bm}\usepackage{mathrsfs}\usepackage{pifont}\usepackage{stmaryrd}\usepackage{textcomp}\usepackage{portland, xspace}\usepackage{amsmath, amsxtra}\usepackage{upgreek}\pagestyle{empty}\DeclareMathSizes{10}{9}{7}{6}\begin{document}
\begin{align*}
&{ \left( {{ \rm{Fe}}{{ \rm{O}}_5}} \right) _2}{ \rm{Si}}{{
\rm{O}}_2}{ \rm{H}}_{13}^{1 - } + { \rm{HN}}{ \left( {{ \rm{C}}{{
\rm{H}}_2}{ \rm{P}}{{ \rm{O}}_3}} \right) _3}{ \rm{H}}_2^{3 - } +
4{ \rm{N}}{{ \rm{a}}^ + } \\ & \quad \longrightarrow { \left( {{
\rm{Fe}}{{ \rm{O}}_5}} \right) _2}{ \rm{SiO}}{{ \rm{H}}_{11}} - {
\rm{HN}}{ \left( {{ \rm{C}}{{ \rm{H}}_2}{ \rm{P}}{{ \rm{O}}_3}}
\right) _3}{ \rm{H}}_2^{4 - } + 4{ \rm{N}}{{ \rm{a}}^ + } + {{
\rm{H}}_2}{ \rm{O}} \tag{7}
\end{align*}
\end{document}
NTMP complexation with adsorbed silicic acid residue on ferric hydroxide. A color illustration and the locations of the charge-compensating Na+ ions are shown in Supplementary Fig. S7 in the Supplementary Data.
This reaction has an energy change of \documentclass{aastex}\usepackage{amsbsy}\usepackage{amsfonts}\usepackage{amssymb}\usepackage{bm}\usepackage{mathrsfs}\usepackage{pifont}\usepackage{stmaryrd}\usepackage{textcomp}\usepackage{portland, xspace}\usepackage{amsmath, amsxtra}\usepackage{upgreek}\pagestyle{empty}\DeclareMathSizes{10}{9}{7}{6}\begin{document}
$$\Delta G_r^o$$
\end{document} = −10.8 kcal/mol. At NTMP concentrations below ∼6 mg/L, dissolved silica competed with NTMP for adsorption sites and lowered the amount of NTMP adsorption. However, at higher aqueous NTMP concentrations, adsorbed silica was able to increase the amount of NTMP adsorption. Although NTMP reaction with an adsorbed silicic acid residue was less energetically favorable than adsorption directly on ferric hydroxide, this mechanism may become increasingly favored as the surface coverage of NTMP increases. Chemisorption of NTMP results in the buildup of negative charge near the ferric hydroxide surface, making it less energetically favorable for further adsorption of NTMP. However, NTMP reaction with a surface-adsorbed silica residue occurs further away from the negatively charged surface, thereby reducing repulsive electrostatic effects. Significant electrostatic effects for reaction (7) can be seen by comparing the reaction with that for adsorption of NTMP5− through
\documentclass{aastex}\usepackage{amsbsy}\usepackage{amsfonts}\usepackage{amssymb}\usepackage{bm}\usepackage{mathrsfs}\usepackage{pifont}\usepackage{stmaryrd}\usepackage{textcomp}\usepackage{portland, xspace}\usepackage{amsmath, amsxtra}\usepackage{upgreek}\pagestyle{empty}\DeclareMathSizes{10}{9}{7}{6}\begin{document}
\begin{align*}
&{ \left( {{ \rm{Fe}}{{ \rm{O}}_5}} \right) _2}{ \rm{Si}}{{
\rm{O}}_2}{ \rm{H}}_{13}^{1 - } + { \rm{HN}} \left( {{ \rm{C}}{{
\rm{H}}_2}{ \rm{P}}{{ \rm{O}}_3}} \right) _3^{5 - } + 5{
\rm{N}}{{ \rm{a}}^ + } \\ & \quad \longrightarrow{ \left( {{
\rm{Fe}}{{ \rm{O}}_5}} \right) _2}{ \rm{SiO}}{{ \rm{H}}_{11}} - {
\rm{HN}} \left( {{ \rm{C}}{{ \rm{H}}_2}{ \rm{P}}{{ \rm{O}}_3}}
\right) _3^{6 - } + 5{ \rm{N}}{{ \rm{a}}^ + } + {H_2}O \tag{8}
\end{align*}
\end{document}
For this reaction, the energy change is \documentclass{aastex}\usepackage{amsbsy}\usepackage{amsfonts}\usepackage{amssymb}\usepackage{bm}\usepackage{mathrsfs}\usepackage{pifont}\usepackage{stmaryrd}\usepackage{textcomp}\usepackage{portland, xspace}\usepackage{amsmath, amsxtra}\usepackage{upgreek}\pagestyle{empty}\DeclareMathSizes{10}{9}{7}{6}\begin{document}
$$\Delta G_r^o$$
\end{document} = −4.2 kcal/mol, which is 6.6 kcal/mol less energetically favorable than reaction (7).
The final product of this reaction is illustrated in Supplementary Fig. S8 and the energy change is \documentclass{aastex}\usepackage{amsbsy}\usepackage{amsfonts}\usepackage{amssymb}\usepackage{bm}\usepackage{mathrsfs}\usepackage{pifont}\usepackage{stmaryrd}\usepackage{textcomp}\usepackage{portland, xspace}\usepackage{amsmath, amsxtra}\usepackage{upgreek}\pagestyle{empty}\DeclareMathSizes{10}{9}{7}{6}\begin{document}
${\Delta}G_r^o$
\end{document} = 5.8 kcal/mol, yielding an equilibrium constant of K = 5.6 × 10⁻⁵. The small equilibrium constant for this reaction indicates that it does not contribute to adsorption of NTMP.
Adsorption isotherms for silica on GFH with 0 and 10 mg/L NTMP are shown in Fig. 8. For aqueous silica concentrations below 40 mg/L, the adsorption isotherm for silica was approximately linear, as indicated by the best-fit linear isotherm parameters listed in Table 2. In the linear region, the presence of 10 mg/L NTMP decreased the isotherm slope for silica adsorption from 0.40 to 0.32 L/g. This can be attributed to competition for surface adsorption sites. As the aqueous silica concentration increased above 40 mg/L, the exponential increase in silica adsorption may be explained by dimerization of a dissolved Si(OH)4 species with a silicic acid residue adsorbed to ferric hydroxide, as illustrated in Fig. 9. The reaction between a bidentate silica complex and aqueous silica can be expressed as follows:
\documentclass{aastex}\usepackage{amsbsy}\usepackage{amsfonts}\usepackage{amssymb}\usepackage{bm}\usepackage{mathrsfs}\usepackage{pifont}\usepackage{stmaryrd}\usepackage{textcomp}\usepackage{portland, xspace}\usepackage{amsmath, amsxtra}\usepackage{upgreek}\pagestyle{empty}\DeclareMathSizes{10}{9}{7}{6}\begin{document}
\begin{align*}
& { \left( {{ \rm{Fe}}{{ \rm{O}}_5}} \right) _2}{ \rm{Si}}{{
\rm{O}}_2}{ \rm{H}}_{13}^{1 - } + { \rm{Si}}{ \left( {{ \rm{OH}}}
\right) _4} \\ & \quad \longrightarrow{ \left( {{ \rm{Fe}}{{
\rm{O}}_5}} \right) _2}{ \left( {{ \rm{Si}}{{ \rm{O}}_2}} \right)
_2}{ \rm{OH}}_{15}^{1 - } + {{ \rm{H}}_2}{ \rm{O}} \tag{10}
\end{align*}
\end{document}
Adsorption isotherm for silica on GFH at 20°C in pH = 8.3 simulated NF concentrate solutions with 0 and 10.0 mg/L NTMP. Dashed lines show Freundlich isotherm fits.
Complex formation between adsorbed silicic acid residue on ferric hydroxide and aqueous Si(OH)4.
The energy change for this reaction is \documentclass{aastex}\usepackage{amsbsy}\usepackage{amsfonts}\usepackage{amssymb}\usepackage{bm}\usepackage{mathrsfs}\usepackage{pifont}\usepackage{stmaryrd}\usepackage{textcomp}\usepackage{portland, xspace}\usepackage{amsmath, amsxtra}\usepackage{upgreek}\pagestyle{empty}\DeclareMathSizes{10}{9}{7}{6}\begin{document}
$$\Delta G_r^o$$
\end{document} = 0.56 kcal/mol, yielding an equilibrium constant of K = 0.39. Thus, these dimer complexes are increasingly likely to form with increasing dissolved silica concentrations. This conclusion is supported by spectroscopic evidence showing the presence of siloxane bonds (Si-O-Si) on silica adsorbed to ferrihydrite (Vempati et al., 1990). The reaction to form a bidentate bond between Si(OH)4 and a bidentate silica complex, as illustrated in Supplementary Fig. S9, was not energetically favorable with a reaction energy of \documentclass{aastex}\usepackage{amsbsy}\usepackage{amsfonts}\usepackage{amssymb}\usepackage{bm}\usepackage{mathrsfs}\usepackage{pifont}\usepackage{stmaryrd}\usepackage{textcomp}\usepackage{portland, xspace}\usepackage{amsmath, amsxtra}\usepackage{upgreek}\pagestyle{empty}\DeclareMathSizes{10}{9}{7}{6}\begin{document}
$$\Delta G_r^o$$
\end{document} = 13.8 kcal/mol. Reactions between a monodentate silicic acid residue and aqueous silica, as illustrated in Supplementary Fig. S10, were also not energetically favorable, with a reaction energy of \documentclass{aastex}\usepackage{amsbsy}\usepackage{amsfonts}\usepackage{amssymb}\usepackage{bm}\usepackage{mathrsfs}\usepackage{pifont}\usepackage{stmaryrd}\usepackage{textcomp}\usepackage{portland, xspace}\usepackage{amsmath, amsxtra}\usepackage{upgreek}\pagestyle{empty}\DeclareMathSizes{10}{9}{7}{6}\begin{document}
$$\Delta G_r^o$$
\end{document} = 14.4 kcal/mol.
Although dimerized silica formed on the ferric hydroxide surface, it was not energetically favorable for NTMP to react with dimerized silica. The reaction between a silica dimer adsorbed to ferric hydroxide and NTMP can be expressed as
\documentclass{aastex}\usepackage{amsbsy}\usepackage{amsfonts}\usepackage{amssymb}\usepackage{bm}\usepackage{mathrsfs}\usepackage{pifont}\usepackage{stmaryrd}\usepackage{textcomp}\usepackage{portland, xspace}\usepackage{amsmath, amsxtra}\usepackage{upgreek}\pagestyle{empty}\DeclareMathSizes{10}{9}{7}{6}\begin{document}
\begin{align*}
&{ \left( {{ \rm{Fe}}{{ \rm{O}}_5}} \right) _2}{ \left( {{
\rm{Si}}{{ \rm{O}}_2}} \right) _2}{ \rm{OH}}_{15}^{1 - } + {
\rm{HN}}{ \left( {{ \rm{C}}{{ \rm{H}}_2}{ \rm{P}}{{ \rm{O}}_3}}
\right) _3}{ \rm{H}}_2^{3 - } + 4{ \rm{N}}{{ \rm{a}}^ + }
\\ & \quad \longrightarrow { \left( {{ \rm{Fe}}{{ \rm{O}}_5}} \right) _2}{ \left(
{{ \rm{Si}}{{ \rm{O}}_2}} \right) _2}{{ \rm{H}}_{14}} - {
\rm{HN}}{ \left( {{ \rm{C}}{{ \rm{H}}_2}{ \rm{P}}{{ \rm{O}}_3}}
\right) _3}{{ \rm{H}}^{4 - }} \\ & \quad +4{ \rm{N}}{{ \rm{a}}^ +
} + {{ \rm{H}}_2}{ \rm{O}}
\tag{11}
\end{align*}
\end{document}
The structure for this reaction is illustrated in Supplementary Fig. S11 and the energy change is \documentclass{aastex}\usepackage{amsbsy}\usepackage{amsfonts}\usepackage{amssymb}\usepackage{bm}\usepackage{mathrsfs}\usepackage{pifont}\usepackage{stmaryrd}\usepackage{textcomp}\usepackage{portland, xspace}\usepackage{amsmath, amsxtra}\usepackage{upgreek}\pagestyle{empty}\DeclareMathSizes{10}{9}{7}{6}\begin{document}
$$\Delta G_r^o$$
\end{document} = 9.5 kcal/mol. Thus, this reaction is not expected to contribute to NTMP adsorption.
Adsorbent regeneration
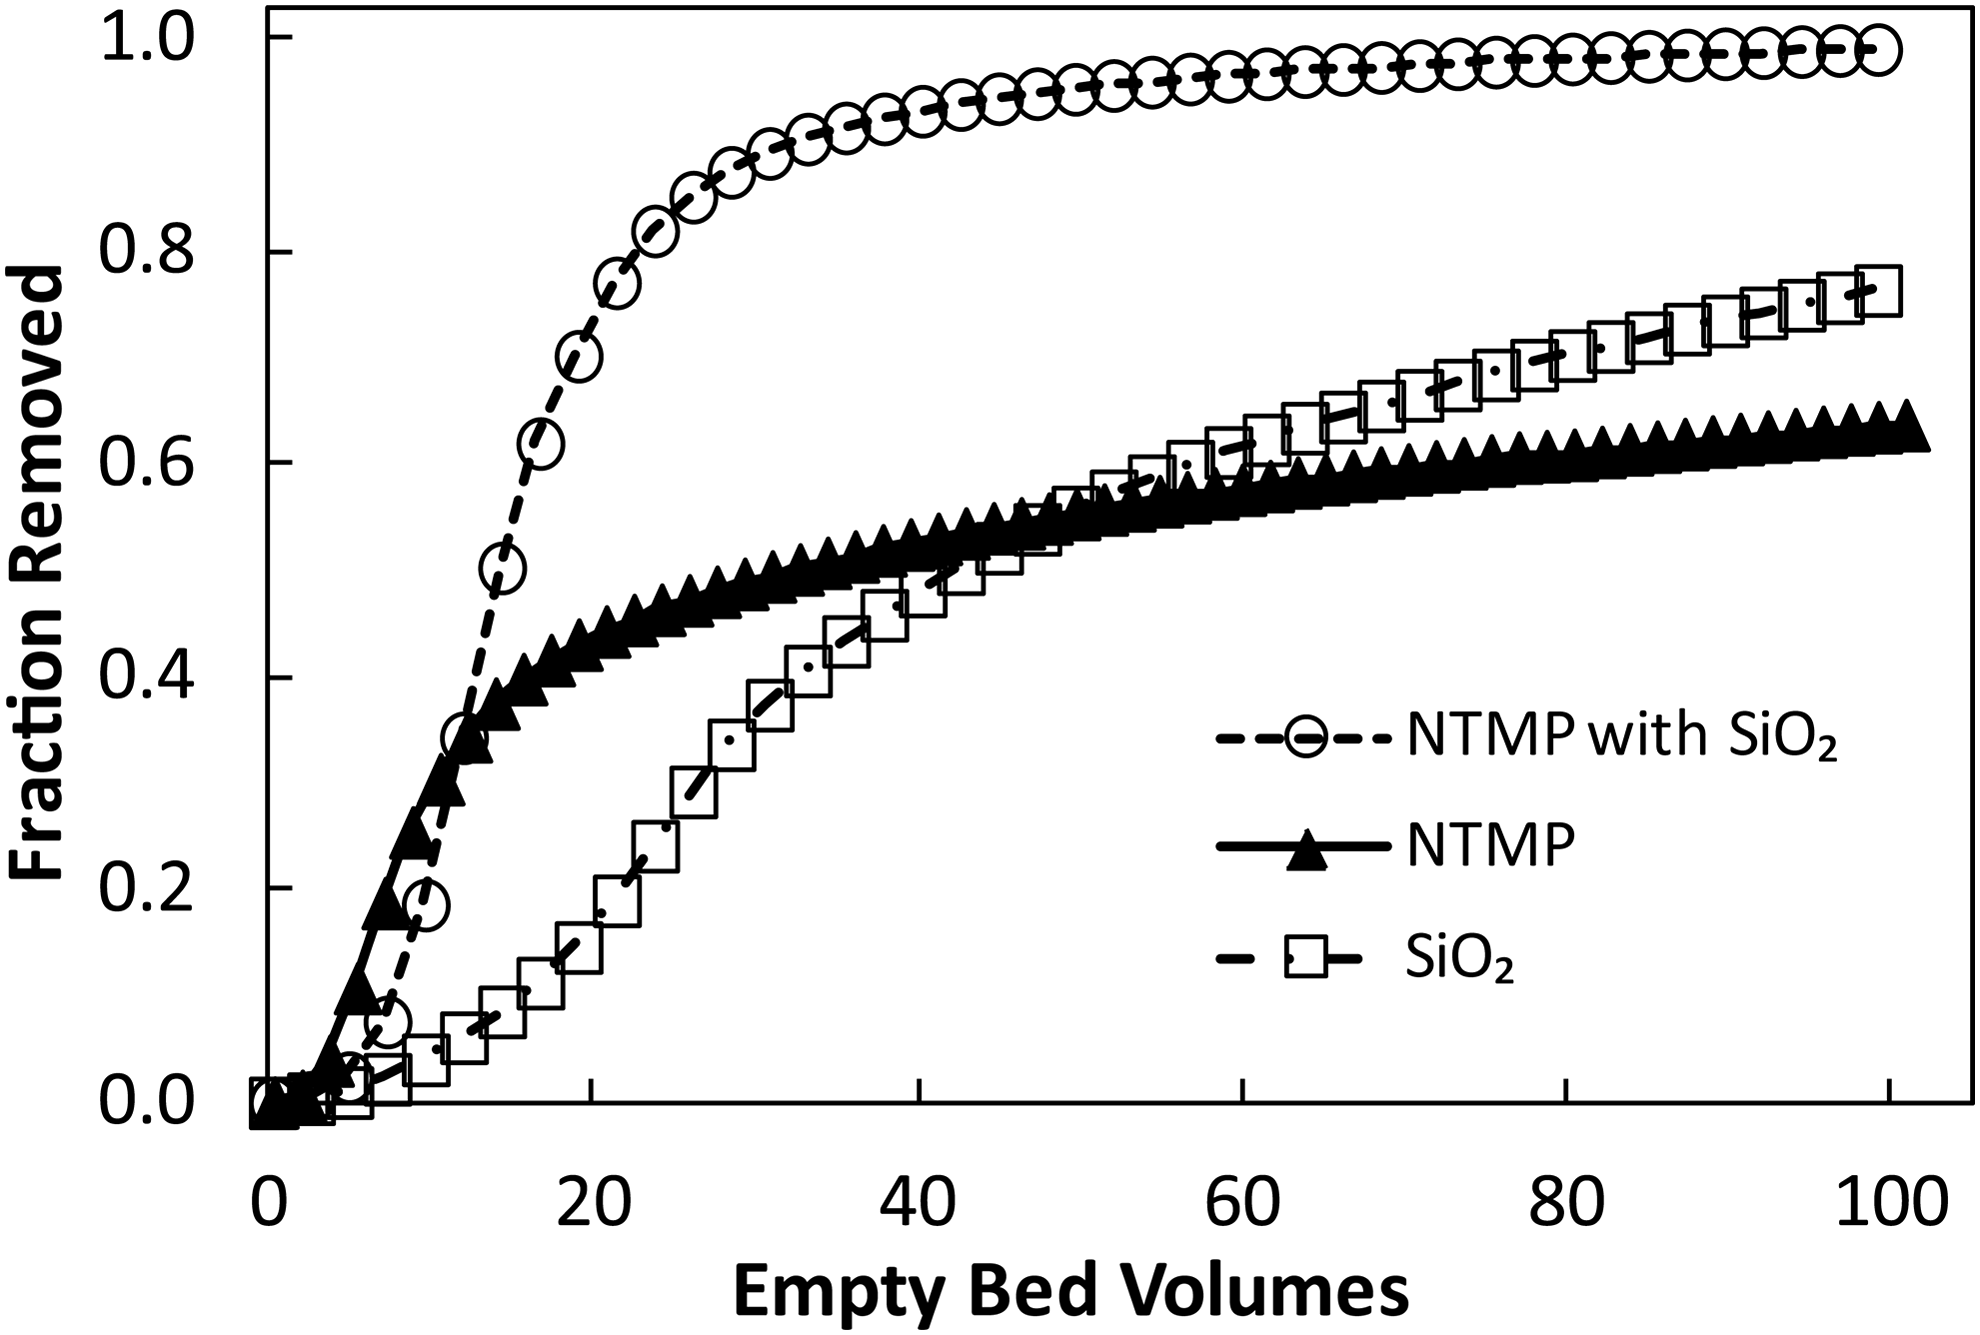
Previous studies have used 0.10 M NaOH eluant solutions to regenerate ferric hydroxide adsorbents used for NTMP removal (Boels, 2012; Boels et al., 2012; Chen et al., 2016). Figure 10 shows the fraction of NTMP and silica desorbed from two columns of GFH as a function of the bed volumes of eluant passed through each column. A 35-minute empty bed contact time was used in these experiments to minimize the effects of diffusional mass transfer on the measured desorption rates. Desorption of both NTMP and silica was bimodal, with a readily desorbing fraction and a desorption-resistant fraction. This phenomenon has previously been attributed to slow intragranular mass transfer and to thermodynamically favorable adsorption, even at elevated pH values (Boels et al., 2012; Chen et al., 2016). In the absence of silica, the desorption-resistant fraction constituted ∼60% of the adsorbed NTMP. In contrast, the slow desorbing fraction with silica constituted only ∼10% of the NTMP uptake. The fact that adsorbed silica increased the fraction of NTMP that was readily desorbed indicates that slow intragranular diffusion was not the mechanism responsible for the desorption-resistant fraction.
Fraction of adsorbed NTMP and silica remaining in GFH column versus bed volumes of 0.10 M eluant solution using an empty bed contact time of 35 min. Adsorption data for these columns are shown in Fig. 1. Also shown is the fraction of NTMP removed from a column of GFH in the single adsorbate experiment.
DFT modeling provides a reasonable explanation for the bimodal NTMP release rates and for silica increasing the fraction of readily desorbed NTMP. Raising the pH to 12.7 in the 0.10 M NaOH solution decreased the adsorption energies for both the mono- and bidentate NTMP complexes. For the monodentate complex, the adsorption reaction at high pH can be expressed as
\documentclass{aastex}\usepackage{amsbsy}\usepackage{amsfonts}\usepackage{amssymb}\usepackage{bm}\usepackage{mathrsfs}\usepackage{pifont}\usepackage{stmaryrd}\usepackage{textcomp}\usepackage{portland, xspace}\usepackage{amsmath, amsxtra}\usepackage{upgreek}\pagestyle{empty}\DeclareMathSizes{10}{9}{7}{6}\begin{document}
\begin{align*}
&{ \left( {{ \rm{Fe}}{{ \rm{O}}_5}} \right) _2}{ \rm{H}}_{13}^{1 -
} + { \rm{HN}} \left( {{ \rm{C}}{{ \rm{H}}_2}{ \rm{P}}{{
\rm{O}}_3}} \right) _3^{5 - } + 5{ \rm{N}}{{ \rm{a}}^ + }
\\ & \quad \longrightarrow{ \left( {{ \rm{Fe}}{{ \rm{O}}_4}} \right) _2}{
\rm{O}}{{ \rm{H}}_{11}} - { \rm{HN}} \left( {{ \rm{C}}{{
\rm{H}}_2}{ \rm{P}}{{ \rm{O}}_3}} \right) _3^{6 - } + 5{
\rm{N}}{{ \rm{a}}^ + } + {{ \rm{H}}_2}{ \rm{O}}
\tag{12}
\end{align*}
\end{document}
The energy change for this reaction of \documentclass{aastex}\usepackage{amsbsy}\usepackage{amsfonts}\usepackage{amssymb}\usepackage{bm}\usepackage{mathrsfs}\usepackage{pifont}\usepackage{stmaryrd}\usepackage{textcomp}\usepackage{portland, xspace}\usepackage{amsmath, amsxtra}\usepackage{upgreek}\pagestyle{empty}\DeclareMathSizes{10}{9}{7}{6}\begin{document}
$$\Delta G_r^o$$
\end{document} = −1.6 kcal/mol is 11.2 kcal/mol less favorable than for reaction (2). Thus, the high pH eluant should lead to considerable desorption of monodentate NTMP complexes. For the bidentate complex, the adsorption reaction at high pH can be expressed as
\documentclass{aastex}\usepackage{amsbsy}\usepackage{amsfonts}\usepackage{amssymb}\usepackage{bm}\usepackage{mathrsfs}\usepackage{pifont}\usepackage{stmaryrd}\usepackage{textcomp}\usepackage{portland, xspace}\usepackage{amsmath, amsxtra}\usepackage{upgreek}\pagestyle{empty}\DeclareMathSizes{10}{9}{7}{6}\begin{document}
\begin{align*}
&{ \left( {{ \rm{Fe}}{{ \rm{O}}_5}} \right) _2}{ \rm{H}}_{13}^{1 -
} + { \rm{HN}} \left( {{ \rm{C}}{{ \rm{H}}_2}{ \rm{P}}{{
\rm{O}}_3}} \right) _3^{5 - } + 5{ \rm{N}}{{ \rm{a}}^ + }
\\ & \quad \longrightarrow { \left( {{ \rm{Fe}}{{ \rm{O}}_4}} \right) _2}{{
\rm{H}}_9} - { \rm{HN}} \left( {{ \rm{C}}{{ \rm{H}}_2}{ \rm{P}}{{
\rm{O}}_3}} \right) _3^{6 - } + 5{ \rm{N}}{{ \rm{a}}^ + } + 2{{
\rm{H}}_2}{ \rm{O}} \tag{13}
\end{align*}
\end{document}
The reaction energy of \documentclass{aastex}\usepackage{amsbsy}\usepackage{amsfonts}\usepackage{amssymb}\usepackage{bm}\usepackage{mathrsfs}\usepackage{pifont}\usepackage{stmaryrd}\usepackage{textcomp}\usepackage{portland, xspace}\usepackage{amsmath, amsxtra}\usepackage{upgreek}\pagestyle{empty}\DeclareMathSizes{10}{9}{7}{6}\begin{document}
$$\Delta G_r^o$$
\end{document} = −19.3 kcal/mol is only 5.5 kcal/mol less energetically favorable than that for reaction (4). This indicates that the high pH solution should have a smaller effect on desorption of the bidentate binuclear complex than on the monodentate complex. Thus, in the absence of silica, the 60% of adsorbed NTMP that is desorption resistant can likely be attributed to bidentate binuclear complexes. The presence of silica in the breakthrough experiment likely interfered with formation of bidentate binuclear NTMP complexes. After the breakthrough experiment shown in Fig. 1, the molar ratio of silica to NTMP adsorbed in the column was 50:1. The presence of adsorbed silica on many adsorption sites would lower chances for NTMP to find adjacent sites for adsorption. Thus, silica is expected to lower the fraction of NTMP that is adsorbed through the more strongly bound bidentate binuclear linkage.
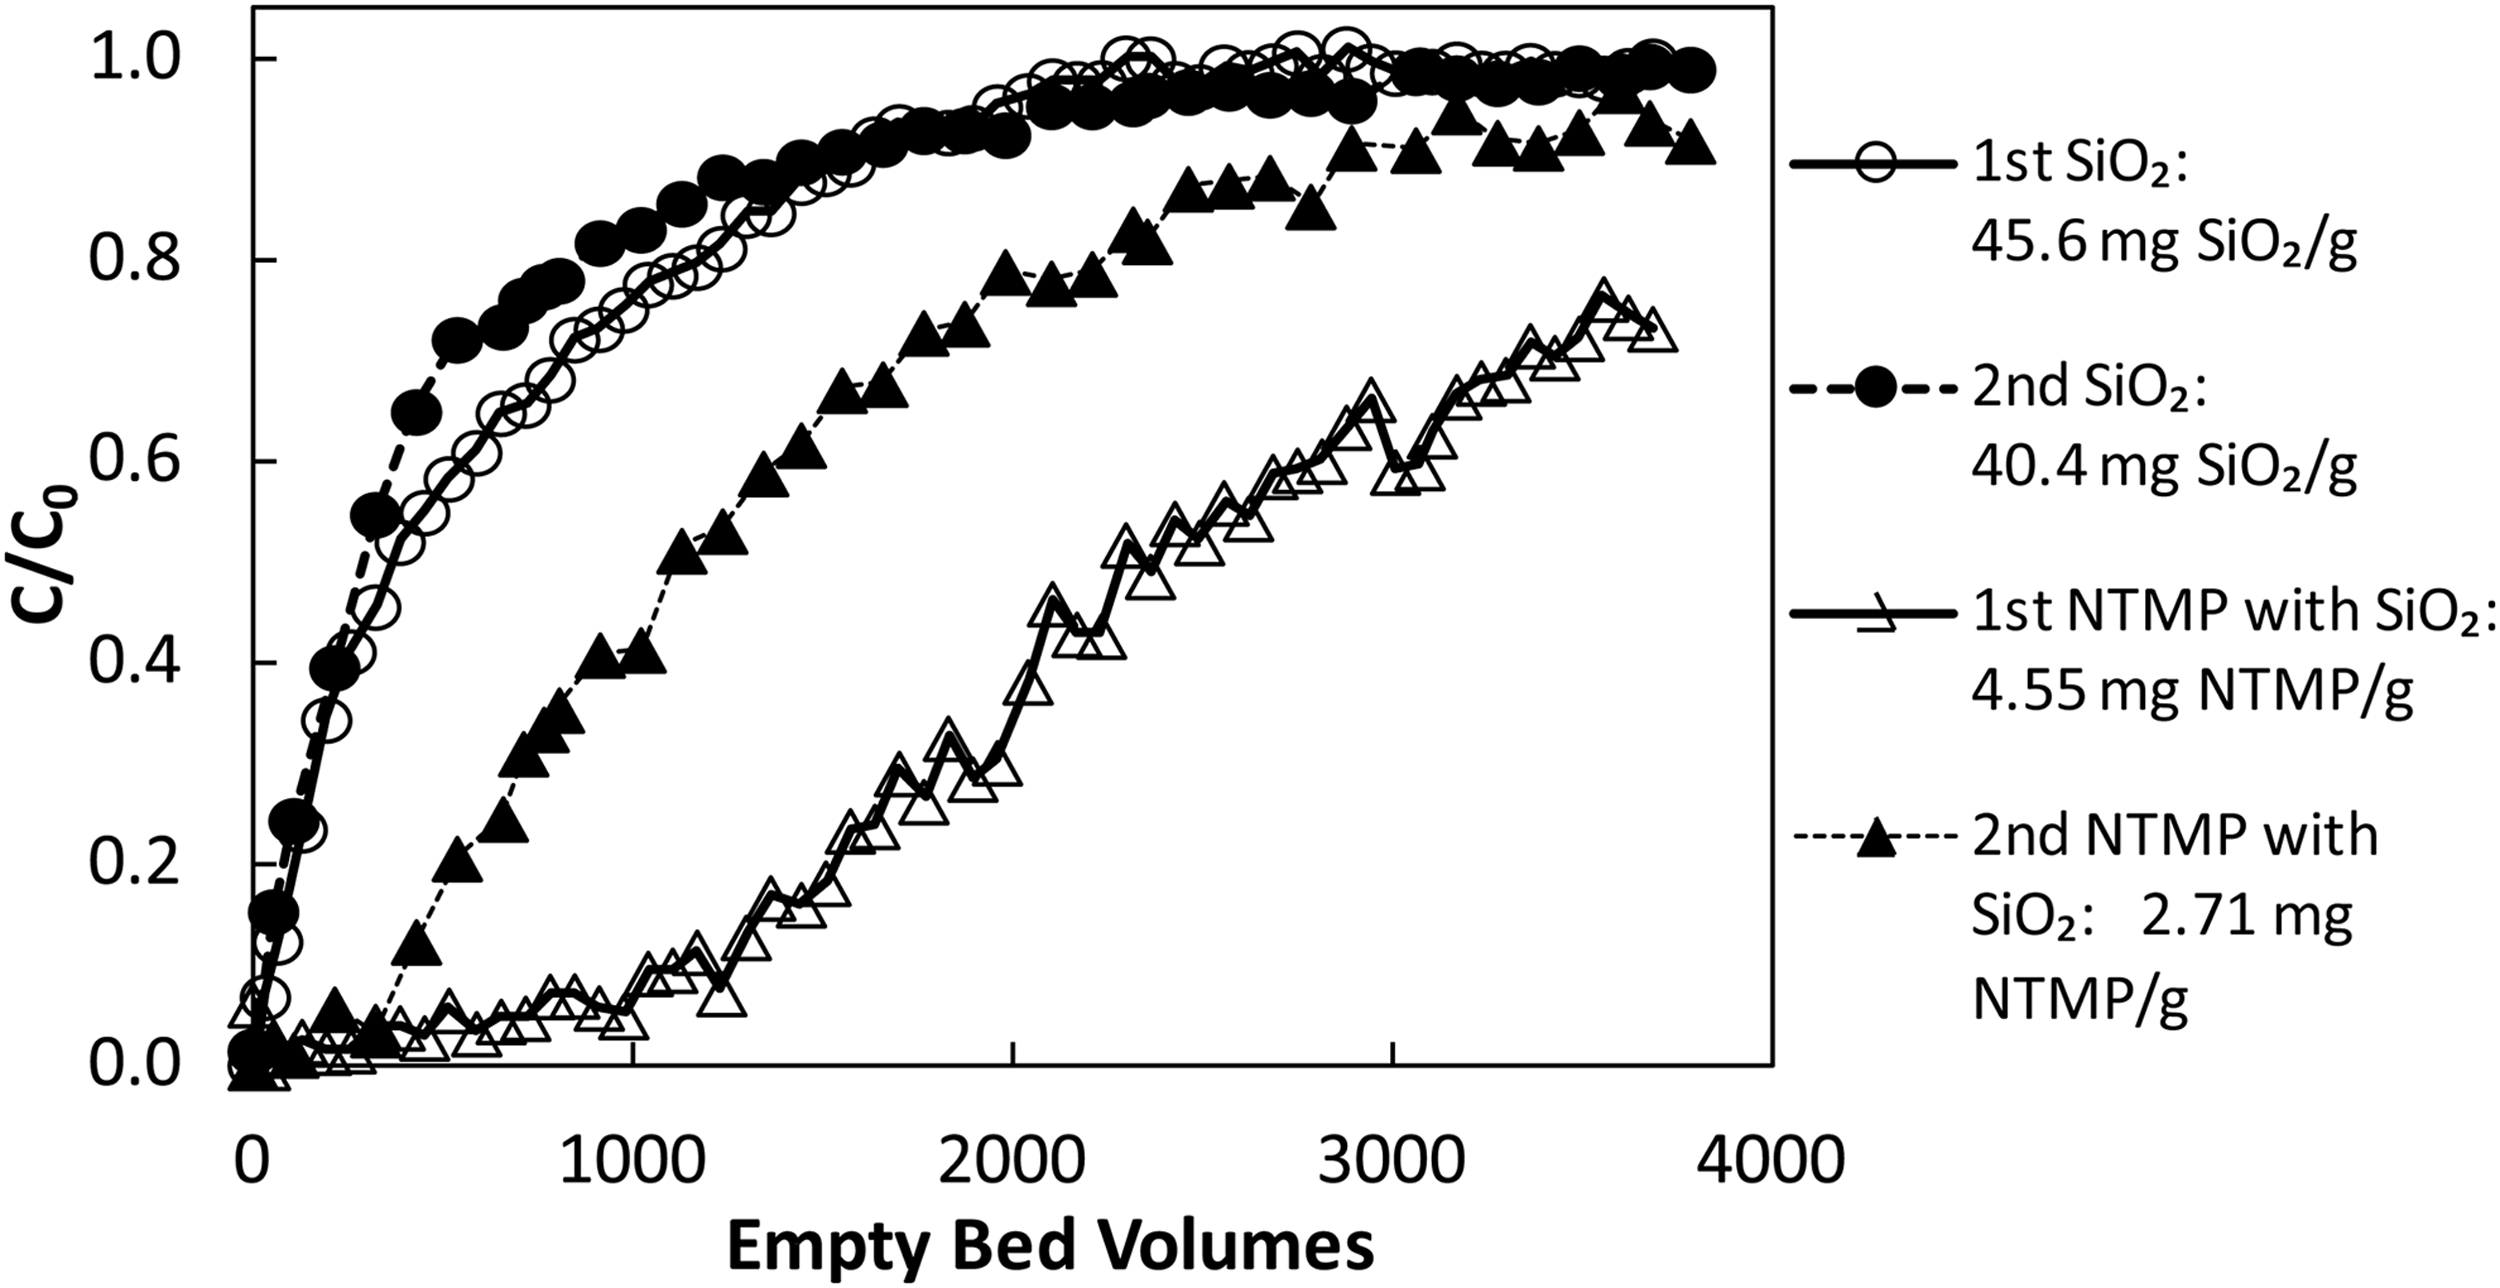
The effect of incomplete removal of silica during column regeneration is illustrated in Fig. 11, which compares breakthrough experiments on virgin and regenerated GFH. On the virgin material, >90% NTMP removal was observed for 1,100 bed volumes, but on the regenerated material, >90% removal was observed for only 300 bed volumes. This can be attributed to the GFH column containing 10.8 mg/g adsorbed SiO2 at the commencement of the second breakthrough experiment. Overall, adsorption of NTMP on the regenerated material was decreased by 40%, from 4.55 to 2.71 mg NTMP/g GFH. Incomplete regeneration decreased the adsorption of silica by only 12% in the second experiment. After completion of the second experiment, the GFH had 51.2 mg/g of adsorbed SiO2. This is greater than the initial uptake of 45.6 mg/g by the virgin GFH and suggests that there may be a buildup of silica in the column due to incomplete regeneration.
NTMP and silica breakthrough at pH = 8.3 in columns of GFH regenerated in Fig. 10. First breakthrough profiles for NTMP and silica on virgin GFH are also shown.
Conclusions
This research showed that there are significant competitive adsorption effects between NTMP and silica on ferric hydroxide. In membrane concentrate solutions, antiscalant compounds are commonly found at concentrations ranging from 5 to 50 μM, while dissolved silica concentrations are often in the range of 1–5 mM. Thus, removing NTMP from membrane concentrate solutions requires an adsorbent that preferentially removes NTMP over silica. The \documentclass{aastex}\usepackage{amsbsy}\usepackage{amsfonts}\usepackage{amssymb}\usepackage{bm}\usepackage{mathrsfs}\usepackage{pifont}\usepackage{stmaryrd}\usepackage{textcomp}\usepackage{portland, xspace}\usepackage{amsmath, amsxtra}\usepackage{upgreek}\pagestyle{empty}\DeclareMathSizes{10}{9}{7}{6}\begin{document}
$${\alpha}_{{ \rm{Si}}{{ \rm{O}}_2}}^{{ \rm{NTMP}}}$$
\end{document} of ∼4 as saturation of the adsorbent was approached and indicates that NTMP was preferentially adsorbed over silica.
DFT modeling showed that the \documentclass{aastex}\usepackage{amsbsy}\usepackage{amsfonts}\usepackage{amssymb}\usepackage{bm}\usepackage{mathrsfs}\usepackage{pifont}\usepackage{stmaryrd}\usepackage{textcomp}\usepackage{portland, xspace}\usepackage{amsmath, amsxtra}\usepackage{upgreek}\pagestyle{empty}\DeclareMathSizes{10}{9}{7}{6}\begin{document}
$$\Delta G_r^o$$
\end{document} for the bidentate binuclear NTMP complex was 9.4–11.4 kcal/mol more energetically favorable than that for the mono- and bidentate silica complexes. Additionally, the bidentate binuclear NTMP complex was favored by 12 kcal/mol over the monodentate NTMP complex. This suggests that bidentate complexation is the primary binding mode for NTMP adsorption in the absence of silica. Experimental isotherms and DFT modeling also indicated that both silica and NTMP could form complexes with silica adsorbed on the ferric hydroxide surface. Although the presence of silica significantly decreased adsorption of NTMP, the adsorbent was still able to treat >1,500 empty bed volumes before 20% breakthrough. This capacity is well within the range of practical treatment processes. However, incomplete regeneration leaving significant amounts of adsorbed silica decreased the adsorption capacity in subsequent experiments by 64% at 20% breakthrough. This suggests that a disposable ferric hydroxide adsorbent, such as coagulation/precipitation using FeCl3, may be a preferred option for removing NTMP from membrane concentrate solutions.
Footnotes
Acknowledgment
This research was funded, in part, by the National Science Foundation (CBET-1235596).
Author Disclosure Statement
No competing financial interests exist.
References
1.
AcelasN.Y., MejiaS.M., MondragonF., and FlorezE. (2013). Density functional theory characterization of phosphate and sulfate adsorption on Fe-(hydr)oxide: Reactivity, pH effect, estimation of Gibbs free energies, and topological analysis of hydrogen bonds. Comp. Theor. Chem., 1005, 16.
2.
AghdamM.A., ZraickF., SimonJ., FarrellJ., and SnyderS.A. (2016). A novel brine precipitation process for higher water recovery. Desalination. 385, 69.
3.
BajaraB.C., and dos Santos AlfonsoM. (2005). Aminomethylphosphonic acid and glyphosate adsorption onto goethite: A comparative study, Environ. Sci. Technol., 39, 585.
4.
BeckeA.D. (1988). A multicenter numerical integration scheme for polyatomic molecules. J. Chem. Phys., 88, 2547.
5.
BoelsL. (2012). Removal and Recovery of Phosphonate Antiscalants (Doctoral dissertation). Delft, Netherlands: Delft University of Technology.
6.
BoelsL., KeesmanK.J., and WitkampG.J. (2012). Adsorption of phosphonate antiscalant from reverse osmosis membrane concentrate onto granular ferric hydroxide. Environ. Sci. Technol., 46, 9638.
7.
DavisM.L. (2010). Water and Wastewater Engineering. New York: McGraw-Hill.
8.
DelleyB. (1990). An all-electron numerical method for solving the local density functional for polyatomic molecules. J. Chem. Phys., 92, 508.
9.
DelleyB. (1996). Fast calculation of electrostatics in crystals and large molecules. J. Phys. Chem. A., 100, 6107.
10.
DelleyB. (2000). From molecules to solids with the DMol3 approach. J. Chem. Phys., 113, 7756.
11.
DelleyB. (2006). The conductor-like screening model for polymers and surfaces. Mol. Simul., 32, 117.
12.
GaoX., RootR.A., FarrellJ., ElaW., and ChoroverJ. (2013). Effect of silicic acid on arsenate and arsenite retention mechanisms on 2-L ferrihydrite: A spectroscopic and batch adsorption approach. Appl. Geochem., 38, 110.
13.
GoldbergS., and SpositoG. (1984). A chemical model of phosphate adsorption by soils: I. Reference oxide minerals. Soil Sci. Soc. Am. J., 48, 772.
14.
GrilloM.E., AndzelmJ.W., GovindN., FitzgeraldG., and StarkK.B. (2004). Computational Materials Science with Materials Studio®*: Applications in Catalysis. In Computational Matererials Science: From Basic Principles to Material Properties. HergertW., ErnstA., and DaneM., editors., Springer, Berlin, p. 207.
15.
JonssonC.M., PerssonP., SjobergS., and LoringJ.S. (2008). Adsorption of glyphosate on goethite (a-FeOOH): Surface complexation modeling combining spectroscopic and adsorption data. Environ. Sci. Technol., 42, 2464.
16.
KlamtA., and SchüürmannG. (1993). COSMO: A new approach to dielectric screening in solvents with explicit expressions for the screening energy and its gradient. J. Chem. Soc., Perkin Trans., 2, 799.
17.
KubickiJ.D., KwonK.D., PaulK.W., and SparksD.L. (2007). Surface complex structures modelled with quantum chemical calculations: Carbonate, phosphage, sulphate, arsenate, and arsenite. Eur. J. Soil Sci., 58, 932.
18.
NikolaychukP.A. (2014). The revised pourbaix diagram for silicon. Silicon, 6, 109.
19.
NowackB. (2003). Environmental chemistry of phosphonates. Water Res. 37, 2533.
20.
ParkhurstD.L., and AppeloC.A.J. (1999). User's guide to PHREEQC (Version 2): A computer program for speciation, batch-reaction, one-dimensional transport, and inverse geochemical calculations. Water Resources Investigations Report 99-4259, U.S. Geological Survey, Denver, CO.
21.
ParkhurstD.L., and AppeloC.A.J. (2013). Description of input and examples for PHREEQC version 3: A computer program for speciation, batch-reaction, onedimensional transport, and inverse geochemical calculations. Chapter 43, Section A, Groundwater Book 6, Modeling Techniques, U.S. Geological Survey, Denver, CO.
22.
PaulK.W., KubickiJ.D., and SparksD.L. (2006). Quantum chemical calculations of sulfate adsorption at the Al- and Fe- (hydr)oxide-H2O interfaces estimation of Gibbs free energies. Environ. Sci. Technol., 40, 7717.
23.
PerdewJ.P., and WangY. (1992). Accurate and simple analytic representation of the electron-gas correlation energy. Phys. Rev. B., 45, 13244.
24.
PopovK., RönkkömäkiH., and LajunenL.H. (2001). Critical evaluation of stability constants of phosphonic acids (IUPAC technical report). Pure Appl. Chem., 73, 1641.
25.
RahnemaieR., HiemstraT., and van RiemsdijkW.H. (2007). Geometry, charge distribution, and surface speciation of phosphate on goethite. Langmuir, 23, 3680.
26.
ShealsJ., SjobergS., and PerssonP. (2002). Adsorption of glyphosate on goethite: Molecular characterization of surface complexes. Environ. Sci. Technol., 36, 3090.
27.
StummW., and MorganJ.J. (1970). Aquatic Chemistry; An Introduction Emphasizing Chemical Equilibria in Natural Waters, New York: Wiley-Interscience.
28.
TribeL., KwonK.D., TroutC.C., and KubickiJ.D. (2006). Molecular orbital theory study on surface complex structures of glyphosate on goethite: Calculation of vibrational frequencies. Environ. Sci. Technol., 40, 3836.
29.
VempatiR.T., LoeppertR.H., DunferD.C., and CockeD.L. (1990). X-ray photoelectron spectroscopy as a tool to differentiate silicon-bonding state in amorphous iron oxides. Soil Sci. Amer. J., 54, 695.
30.
VoskoS.H., WilkL., and NusairM. (1980). Accurate spin-dependent electron liquid correlation energies for local spin density calculations: A critical analysis. Can. J. Phys., 58, 1200.
31.
WaychunasG., ReaB., FullerC., and DavisJ. (1993). Surface chemistry of ferrihydrite: Part 1. EXAFS studies of the geometry of coprecipitated and adsorbed arsenate. Geochim. Cosmochim. Acta., 57, 2251.
32.
ZhuM., PaulK.W., KubickiJ.D., and SparksD.L. (2009). Quantum chemical study of arsenic (III, V) adsorption on Mn-oxides: Implications for arsenic(III) oxidation. Environ. Sci. Technol., 43, 6655.
Supplementary Material
Please find the following supplemental material available below.
For Open Access articles published under a Creative Commons License, all supplemental material carries the same license as the article it is associated with.
For non-Open Access articles published, all supplemental material carries a non-exclusive license, and permission requests for re-use of supplemental material or any part of supplemental material shall be sent directly to the copyright owner as specified in the copyright notice associated with the article.